An electrochemical biosensor for the detection of aflatoxin B1 based on the specific aptamer and HCR biological magnification
Hongyan
Zhang†
 a,
Siying
Ye†
a,
Lishan
Huang
a,
Shen
Fan
a,
Weiwei
Mao
a,
Yijin
Hu
a,
Yuyan
Yu
a,
Siying
Ye†
a,
Lishan
Huang
a,
Shen
Fan
a,
Weiwei
Mao
a,
Yijin
Hu
a,
Yuyan
Yu
 *a and
Fengfu
Fu
 *b
*b
aJoint National Local Engineering Research Center of Fujian and Taiwan Chinese Medicine Molecular Biotechnology, College of Pharmacy, Fujian University of Traditional Chinese Medicine, Fuzhou, Fujian 350122, China. E-mail: yyyfj@163.com; Fax: +86-591-22861322; Tel: +86-591-22861322
bKey Lab of Analysis and Detection for Food Safety of Ministry of Education, Fujian Provincial Key Lab of Analysis and Detection for Food Safety, College of Chemistry, Fuzhou University, Fuzhou, Fujian 350116, China. E-mail: fengfu@fzu.edu.cn; Fax: +86-591-22866135; Tel: +86-591-22866135
First published on 29th November 2022
Abstract
Aflatoxin B1 (AFB1) is a highly toxic mycotoxin, which causes severe acute or cumulative poisoning. Therefore, it is important to develop sensitive and selective detection methods for AFB1 for the safety of food and medicinal herbs. Herein, we have developed a “signal-on” electrochemical aptasensor based on the high specificity of the aptamer and hybridization chain reaction (HCR) biological amplification for AFB1 detection. In this work, thiol-modified complementary DNA (cDNA) immobilized on the surface of a gold electrode (GE) served as an initiator DNA. When AFB1 was present, it competed with the cDNA for binding to the aptamers, which resulted in the detaching of aptamers from the cDNA–aptamer duplexes. Then, the single-stranded cDNA acted as an initiator to trigger the HCR signal amplification. Therefore, long double-stranded DNA (dsDNA) products were produced, which could load large amounts of methylene blue (MB) molecules to generate a distinct electrochemical signal. Under the optimized conditions, the proposed electrochemical aptasensor achieved the ultrasensitive detection of AFB1 with a linear detection range of 0.01–100 pg mL−1, and a limit of detection (LOD) down to 2.84 fg mL−1. Furthermore, the electrochemical aptasensor was successfully applied for detecting AFB1 in corn and two kinds of traditional Chinese medicine samples, indicating the potential value for AFB1 detection in practical samples.
1. Introduction
Aflatoxins are highly toxic fungal metabolites produced by mold toxigenic strains (mainly Aspergillus flavus and Aspergillus parasiticus), and are widely found as contaminants in a variety of crops and medicinal herbs.1,2 They enter the human body directly by the consumption of contaminated medicinal materials, agricultural products, and food.3 Among the aflatoxins, aflatoxin B1 (AFB1) was considered to be of the highest toxicity and was classified as a group IA carcinogen by the International Agency for Research on Cancer (IARC) in 1993.4 Its toxicity has been extensively reported including nausea, vomiting, abdominal pain. Besides, its chronic exposure may also result in various complications such as hepatotoxicity, carcinogenicity, immunotoxicity, and teratogenicity,5,6 which highlights the urgency and importance of developing highly sensitive and specific AFB1 assays. Although many countries and organizations have standardized the limits of AFB1, it is still hard to completely avoid the cumulative toxicity because of the long-term intake of AFB1 below the standard limits. Meantime, AFB1 is too thermally stable to completely remove through conventional food processing.7 Undoubtedly, earlier detection of AFB1 can effectively deal with the source contaminant and decrease the cumulative toxicity of AFB1. Therefore, there is an urgent need to develop high-sensitivity analytical methods that can effectively detect low levels of AFB1 to ensure the safety of food and medicinal herbs.Currently, conventional methods for AFB1 detection including high-performance liquid chromatography (HPLC), liquid chromatography-mass spectrometry (LC-MS) and enzyme-linked immunosorbent assay (ELISA) show good sensitivity and selectivity.8 However, the former (equipment analyses) are laborious and require complicated sample preparation procedures, experienced operators and costly equipment.9 The latter has inherent challenges of enzyme-linked methods including easy inactivation under complicated working conditions (such as severe temperature and pH) and long preparation period of antibodies.10 To some extent, the above drawbacks limited their application in rapid on-the-spot detection of AFB1.
In recent years, various kinds of sensors based on aptamers have been widely used for detecting AFB1.11–14 Compared with traditional detection methods and optical aptamer sensors, electrochemical aptasensors, coupled with the good sensitivity of electrochemical assay and the high specificity and affinity of aptamers, have gained significant attention.15–17 Electrochemical biosensors with efficient advantages including easy-to-carry, low cost, rapid response and sensitive quantification seem to be more suitable for on-the-spot ultrasensitive detection of AFB1.18 The aptamer is promising as an alternative to antibody for the distinct advantages relative to antibody including low-cost, good thermal stability, and easy artificial synthesis and labeling.19,20
Generally, better analytical performances of electrochemical aptasensors can be obtained through various biological signal amplification strategies. For instance, hybridization chain reaction (HCR) is an isothermal replication amplification process based on complementary base pairing, and has attracted great attention for superior advantages including enzyme-free, mild reaction conditions, high amplification efficiency and simple operation.21 Concretely, a long double-stranded DNA with a nicked double helix structure composed of dozens to hundreds of repeating units can be produced by one trigger DNA initiating the cross open one after another and hybridization of two DNA hairpins.22 Definitely, the formed biological structure will carry more signal molecules to obtain signal amplification.
Herein, a “signal-on” enzyme-free electrochemical sensing platform based on the specific aptamer and HCR signal amplification for ultrasensitive and selective detection of AFB1 has been proposed. In the presence of AFB1, the recognition and binding between the aptamer and AFB1 resulted in complementary DNA (cDNA) acting as initiators to trigger the HCR signal amplification in the presence of DNA 1 (H1) and DNA 2 (H2). Therefore, the detection of AFB1 can be realized by monitoring the obvious current changes. In general, this electrochemical aptasensor was designed to possess good sensitivity and high selectivity for the detection of AFB1 due to the combination of a highly selective aptamer and HCR biological amplification technology. This method was simple and controllable, and could be carried out at room temperature. Therefore, it has the potential to be applied to field detection for the screening of bulk samples.
2. Experimental section
2.1. Chemicals and materials
Toxin samples (purity = 99%) including aflatoxin B1 (AFB1), aflatoxin B2 (AFB2), fumonisin B1 (FB1), ochratoxin A (OTA), zearalenone (ZEN) and deoxynivalenol (DON) were all purchased from Tan-Mo Quality Testing Technology Co., Ltd (Beijing, China). 1 kb plus DNA marker and 6× DNA loading buffer were obtained from Beijing Solarbio Science & Technology Co., Ltd (Beijing, China). StarStain Red was purchased from Genstar Biotechnology Co., Ltd (Beijing, China). Agarose was purchased from Sigma-Aldrich (USA). Tris-(2-carboxyethyl) phosphine hydrochloride (TCEP) (purity = 98%) and 6-mercapto-1-hexanol (MCH) (purity = 98%) were purchased from Aladdin Biochemical Technology Co., Ltd (Shanghai, China). Methylene blue (MB) (purity ≥ 98%) was purchased from Solarbio Technology Co., Ltd (Shanghai, China). All other included chemical substances were purchased from Sinopharm Chemical Reagent Co., Ltd (Shanghai, China), and they were all analytical grade. All the water used in this study is Milli-Q water (18.2 MΩ cm).The major buffer solutions used in the experiment are as follows: DNA probe immobilization buffer (pH 7.5) is a mixture of 10 mM Tris–HCl, 1 mM EDTA, 1 M NaCl, 10 mM MgCl2 and 10 mM TCEP. PBS buffer containing 137 mM NaCl, 2.7 mM KCl, 10 mM Na2HPO4 and 2 mM KH2PO4 is employed as DNA hybridization buffer and washing buffer. All DNA oligonucleotides used in this work were synthesized by Sangon Biotech Co., Ltd (Shanghai, China). The labeled sequences were purified by HPLC, and other sequences were purified by ULTRAPAGE. The sequence of the AFB1 binding aptamer was designed referring to the sequence presented by NeoVenture Biotechnology Inc. (Canada).23 The detailed sequences are as follows: cDNA:  . The underlined sequences of cDNA and H2 are complementary to the underlined sequences of AFB1 aptamer and H1. The wavy underlined sequences of H1 are the trigger of hybridization chain reaction, and are complementary to the wavy line sequence of H2.
2.2. Apparatus
All electrochemical measurements were performed on a CHI 660E electrochemical workstation (Chenhua Instrument Shanghai Co., Ltd, China) using a traditional three-electrode system. The working electrode, counter electrode and reference electrode were a gold disk electrode (2 mm in diameter), platinum wire, and AgCl/Ag (3 M KCl) electrode, respectively. In order to analyze and confirm the preparation and electrochemical performance of the sensor, electrochemical impedance spectroscopy (EIS), cyclic voltammetry (CV) and differential pulse voltammetry (DPV) were applied in this study. EIS was performed under the conditions of 0.21 V initial potential, 0.005 V amplitude, 2 s execution time, and 0.1 Hz to 10 kHz scanning frequency in 5.0 mM K3[Fe(CN)6]/K4[Fe(CN)6] ([Fe(CN)6]3−/4−) solution containing 0.1 M KCl. CV was performed under the conditions of −0.2 V to +0.6 V potential range, 2 s quiet time, 50 mV s−1 scan rate and 0.001 V sample interval.The electrophoresis experiments were carried out using a western electrophoresis apparatus (BIO-RAD, USA). Gel images were recorded on a BIO-RAD ChemiDoc MP chemiluminescence gel imaging system (USA). Atomic Force Microscope (AFM) images were recorded using an Asylum Research Cypher (Oxford, USA).
2.3. The protocol of agarose gel electrophoresis
Before agarose gel electrophoresis, all hairpin DNA oligonucleotides were annealed at 95 °C for 2 min and gradually cooled to room temperature (note: the concentrations of H1 and H2 were kept in equal molar ratios). All relevant hybridization processes were carried out at 30 °C for 60 min, and then 1![[thin space (1/6-em)]](https://www.rsc.org/images/entities/char_2009.gif) :
:![[thin space (1/6-em)]](https://www.rsc.org/images/entities/char_2009.gif) 4 v/v of 5× DNA loading (containing 5× StarStain Red) was added to each product for DNA sample staining. Finally, the stained DNA products were loaded into the lanes and the agarose gel electrophoresis was performed at room temperature on a 1.0% (wt) agarose gel with 1× TAE (pH 8.0) as running buffer, at a constant potential of 120 V for 30 min.
4 v/v of 5× DNA loading (containing 5× StarStain Red) was added to each product for DNA sample staining. Finally, the stained DNA products were loaded into the lanes and the agarose gel electrophoresis was performed at room temperature on a 1.0% (wt) agarose gel with 1× TAE (pH 8.0) as running buffer, at a constant potential of 120 V for 30 min.
2.4. Aptasensor fabrication and electrochemical detection of AFB1
First, the gold electrode (GE) was polished, cleaned and activated according to the routine method. Afterwards, in the freshly prepared H2SO4 (0.5 M), the electrode was continuously scanned in the potential range of −0.35 to 1.5 V until a stable characteristic voltammetric peak emerged. Following that, the GE was further rinsed thoroughly with distilled water and was dried by blowing nitrogen.Before the experiment, hairpin probes H1 and H2 were heated by degrees up to 95 °C for 5 min and gradually cooled down to room temperature for the formation of a stem-loop structure. The cDNA was first incubated in DNA probe immobilization buffer (pH 7.5) for 1 h in the dark to minimize the formation of disulfide bonds. Subsequently, 10.0 μL of 0.5 μM cDNA was directly dropped on the prepared GE and incubated overnight at 4 °C. So, the GE modified by cDNA was obtained through the Au–S bond. After rinsing with PBS, the modified GE was incubated with MCH (1.0 mM) for 1 h to block the remaining gold site. Following that, 10.0 μL of 1.0 μM specific AFB1 aptamer was dropped on the GE to form a double-stranded complex (cDNA–aptamer) after incubation for 1 h at 25 °C. Eventually, the modified GE was washed with PBS (pH 7.4).
The detailed steps for detecting AFB1 are described below. Different concentrations of AFB1 standard solution were dropped on the cDNA–aptamer modified GE and incubated for 1 h at 25 °C. After being rinsed with PBS and dried with nitrogen, the GE was immersed into the hairpin DNA mixture solution containing equal molar ratios of H1 (10.0 μM) and H2 (10.0 μM) to implement HCR for 1 h at 30 °C. The cleaned electrode was dipped into the MB solution (40 μM), and incubated at room temperature for 30 min. Later, differential pulse voltammetry was performed within the potential range of −0.5 V to 0 V in 10 mM PBS (pH 7.4), and the concentration of AFB1 was quantified based on the value of the DPV signal.
2.5. Pretreatment of practical samples
Corn, coix seed, and polygala root samples were purchased from a local supermarket and pharmacy (Fuzhou, Fujian Province). Samples were finely ground by using an electric grinder, and 1.0 g of the powder was mixed completely with methanol containing known amounts of AFB1 standards. After drying for 8 h at room temperature, 10 mL of a methanol–water mixture (7![[thin space (1/6-em)]](https://www.rsc.org/images/entities/char_2009.gif) :
:![[thin space (1/6-em)]](https://www.rsc.org/images/entities/char_2009.gif) 3 v/v) was added. After shaking the above mixture for 30 min, and centrifuging for 10 min at 8000 rpm, the supernatant was filtered with a 0.22 μm syringe filter. Finally, the solution was diluted to 0.5, 5 and 50 pg mL−1 with 10 mM PBS buffer (pH 7.4), and stored at 4 °C for further use.
3 v/v) was added. After shaking the above mixture for 30 min, and centrifuging for 10 min at 8000 rpm, the supernatant was filtered with a 0.22 μm syringe filter. Finally, the solution was diluted to 0.5, 5 and 50 pg mL−1 with 10 mM PBS buffer (pH 7.4), and stored at 4 °C for further use.
3. Results and discussion
3.1. Principle of the electrochemical aptasensor
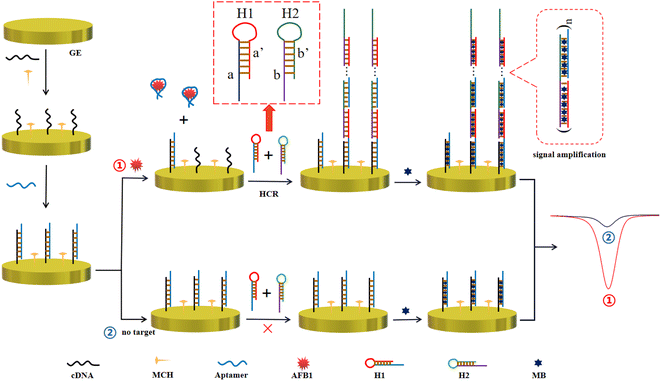
The electrochemical aptasensor for AFB1 detection is schematically illustrated in Scheme 1. In this work, the cDNA is first immobilized on a GE through the gold–sulfur bond, and it is employed as the trigger of subsequent HCR and the binding region of the aptamer. The blocking reaction of MCH is followed to reduce nonspecific adsorption. After the addition of the aptamer, the cDNA hybridizes with the AFB1 aptamer to form a DNA double helix structure through complementary base pairing. In the presence of AFB1, the aptamer combines with AFB1 to form a more stable aptamer–AFB1 complex, and the cDNA returns to the single-stranded state, which is designed to trigger HCR signal amplification. Namely, the single-stranded cDNA can open hairpin DNA 1 (H1) via a toehold-mediated strand displacement (TMSD) reaction, in which cDNA binds to the sticky end of H1 (domain a) and undergoes a branch migration. The just-exposed domain of H1 (domain a′) acts as a new initiator, interacting with the sticky end of hairpin DNA 2 (H2) (domain b), eventually causing the release of the later sequence of H2 (domain b′).24 Domain b′ is designed to open H1, because it is identical to the sticky sequence of cDNA. In theory, it can be generated until H1 or H2 is exhausted. The electroactive indicator methylene blue (MB) is considered as a good electrochemical signal reporter with low toxicity. Numerous MB molecules, which show a strong binding affinity to the dsDNA structure,25–27 are embedded into the grooves of the long double-helix structure as the electrochemical signal reporter. Definitely, this amplification strategy will significantly improve the detection sensitivity. In contrast, in the absence of AFB1, the aptamer and cDNA maintain a stable double-stranded DNA structure. Thus, the amplification effect cannot be implemented because two hairpin DNA molecules remain closed due to the lack of initiator DNA. Only fewer MB molecules are loaded and a faint electrochemical signal is produced. Definitely, the bio-recognition and binding between the aptamer and AFB1 result in an obvious increase of the MB current response. AFB1 detection can be achieved by reading the current change caused by the addition of AFB1.3.2. Feasibility verification of the electrochemical aptasensor
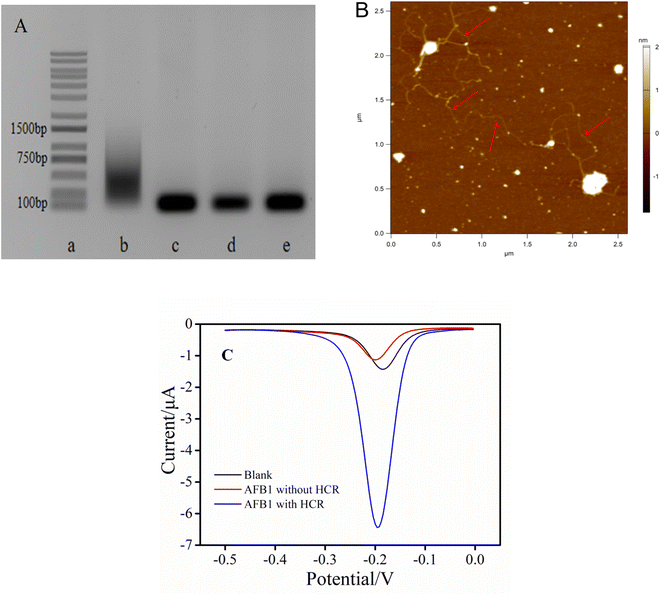
To prove the feasibility, the HCR was first characterized by agarose gel electrophoresis. As shown in Fig. 1A, the DNA bands from lane a to lane e were DNA marker, cDNA + H1 + H2, H1 + H2, H1 and H2 DNA strand, respectively. The designed H1 and H2 exhibited only one well-defined band in lane d and lane e, respectively. It should be noted that, compared with the alone DNA bands (lane d and e), there was no significant change in position after mixing H1 and H2, indicating that no reaction between H1 and H2 occurred in the absence of initiators. However when H1, H2 and cDNA coexisted, a gradient band was obtained (lane b), indicating that their composition was HCR products with different molecular weights. These experimental results demonstrated that HCR could indeed be triggered in the presence of cDNA to generate long-chain biological macromolecules. This amplification strategy was feasible. Additionally, AFM image was used to more accurately demonstrate the realization of DNA amplification. Because the double stranded DNA was unstable under the salt free condition, magnetic beads were employed to capture the long linear double stranded DNA hybridized with the same sequence, and then used the magnet to wash away the salt for the AFM test. As shown in Fig. 1B, multiple twisted long linear HCR products could be clearly observed, which indicated that H1 and H2 had successfully initiated the HCR.Based on the feasibility of HCR, whether this electrochemical aptasensor could be adopted for the detection of AFB1 was preliminarily verified. As shown in Fig. 1C, in the absence of AFB1, a lower peak current was observed even though all other substances including cDNA, H1 and H2 existed in the system (black curve). The existence of this low blank current was attributed to the fact that only a small number of MB signal molecules were embedded into the double-stranded DNA skeleton of the cDNA–aptamer duplex. Significantly, the peak current increased dramatically in the presence of AFB1 (0.5 ng mL−1) (blue curve). In contrast, in the presence of AFB1 but without H1 and H2, the lowest peak current was obtained (red curve). These results further indicated that the proposed aptasensor was feasible to detect AFB1.
3.3. Electrochemical characterization of the stepwise modified electrode
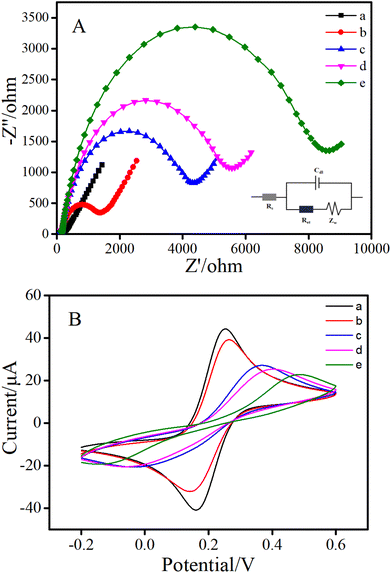
Electrochemical impedance spectroscopy and cyclic voltammetry experiments were utilized to investigate the different fabrication procedure of GE surface modification step by step. As shown in Fig. 2A, the exposed gold electrode in [Fe(CN)6]3−/4− solution presented a typically Nyquist plot with a small diameter semicircle and a long line (curve a), indicating a fast electron-transfer on the electrode surface.28,29 The cDNA-modified electrode (curve b) showed a larger semicircle diameter than the bare electrode, such an increase of Ret indicated that the cDNA had been successfully loaded on the electrode surface.30–32 Upon the addition of MCH (curve c), the MCH further occupied the GE surface to hinder the electronic transmission process, and resulted in an increasing Ret. Afterwards, the modification of the aptamer also increased the diameter of the semicircles in the absence of AFB1 (curve d). The reason might be attributed to the negative charges of DNA phosphate backbones of the aptamer and the fact that the newly produced cDNA–aptamer duplex provided stronger steric hindrance. Finally, with the progress of HCR, a large number of long double-stranded DNA products were produced on the electrode, which seriously hindered electron transfer. Accordingly, dramatically growing Ret (curve e) was obtained. These results greatly proved the feasibility of the proposed sensor.The stepwise modification of the electrode was further confirmed by CV measurements. The results are illustrated in Fig. 2B. At first, on the bare gold electrode, a pair of well-defined redox peaks of the couple [Fe(CN)6]3−/4− were obtained (curve a). Then, when cDNA (curve b) and MCH (curve c) were successively fixed on the GE, the CV peak current decreased continuously. After the aptamer was introduced to the electrode surface, the peak current further decreased (curve d). The decrease of peak current in each of the above steps was due to the obstruction of electron transfer. Finally, in the presence of AFB1, the peak current reduced definitely (curve e) due to the absolute increase of electron transfer resistance caused by long-chain HCR products. These results were consistent with those of EIS. In brief, both CV and EIS confirmed the successful fabrication of the proposed aptasensor, and further reflected the possibility for detecting AFB1.
3.4. Optimization of experimental conditions
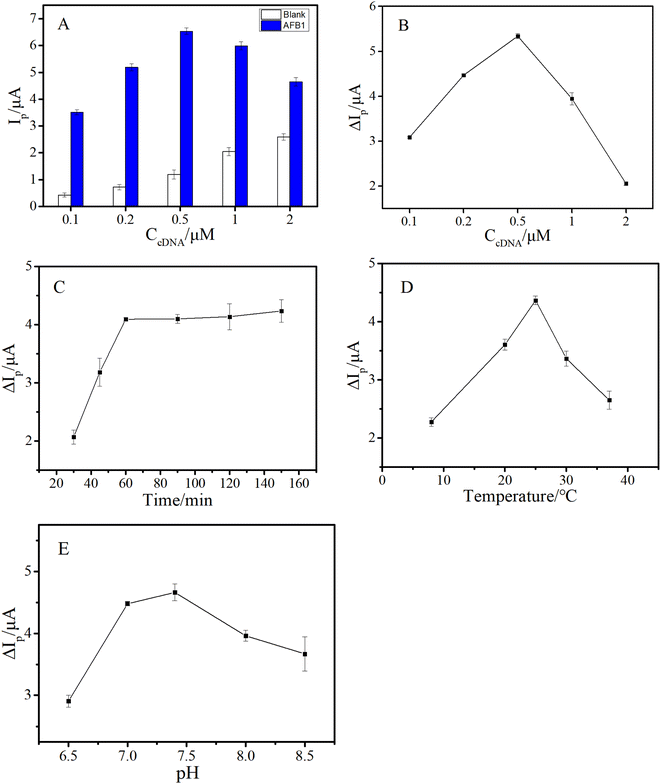
To obtain more excellent analytical performance, several factors such as cDNA concentration, reaction conditions between AFB1 and the aptamer (including buffer pH, temperature and time), and conditions of HCR (including temperature and time) were optimized.In this work, the cDNA was an important substrate for capturing the aptamer and triggering HCR signal amplification. Hence, the density of the cDNA fixed on the GE surface would directly affect the analytical properties of the aptasensor. We varied the cDNA density by changing the concentration of cDNA (CcDNA). It's worth noting that the cDNA–aptamer duplex complex fixed on the GE will also carry a part of MB in the absence of AFB1, resulting in a weak background current. Besides, the background current may increase with the increase of cDNA density. Therefore, it was more reasonable to judge the optimal conditions by using the peak current change (ΔIp) in the absence and presence of AFB1. As shown in Fig. 3A, the background peak current (Ip) increased with the increase of CcDNA (ranging from 0.1 μM to 2 μM), while the peak current induced by AFB1 first increased and then decreased, and reached a maximum when CcDNA was 0.5 μM. The possible reason was that, in a certain concentration range, with the increase of cDNA on the electrode surface, more HCR products were generated, which carried more MB signal molecules. However, when the density of cDNA was too high, larger steric hindrance hindered the reaction of H1 and H2 with the cDNA, resulting in lower efficiency of HCR and the signal current. As a result, the ΔIp achieved a maximum when CcDNA was 0.5 μM (Fig. 3B).
The interaction between the aptamer and AFB1 directly affected not only the specificity of this aptasensor, but also the initiation of HCR signal amplification, affecting the sensitivity of the established method. Thus, the reaction conditions between AFB1 and aptamer were further explored in detail. First, the reaction time between AFB1 and the aptamer was examined, and as shown in Fig. 3C, ΔIp gradually increased with the reaction time, and reached a plateau at 60 min. Additionally, the optimized reaction temperature and buffer pH were also confirmed, and the results are shown in Fig. 3D and E, respectively.
As mentioned above, as the signal amplification strategy of this work, HCR was of great significance for improving the sensitivity of the aptasensor. Consequently, the reaction temperature and time of HCR were further investigated. As shown in Fig. 4A, HCR showed less efficiency at lower temperature, and achieved a maximum when temperature rose to 30 °C. As depicted in Fig. 4B, ΔIp reached a plateau after 60 minutes. Therefore, the HCR amplification reaction was conducted for 1 h at 30 °C.
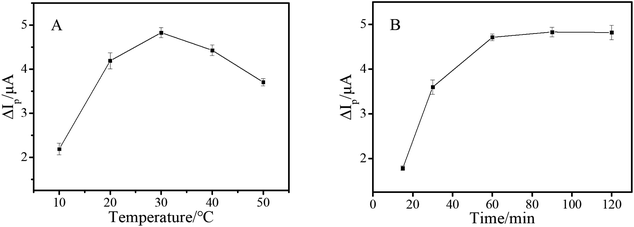 | ||
| Fig. 4 Peak current change of the electrochemical aptasensor coupled with HCR at different temperatures (A) and reaction times (B) and the concentration of AFB1 was 10 pg mL−1. | ||
3.5. The analytical performance of the proposed sensor
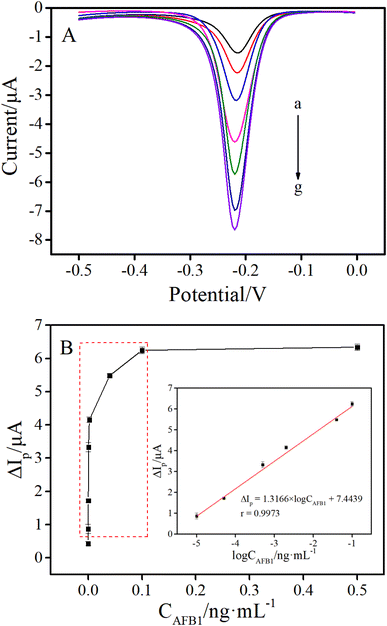
In order to investigate the analytical performance, the as-prepared electrochemical aptasensor was utilized to detect AFB1 standards with different concentrations under the optimal conditions. As shown in Fig. 5A, the peak currents of DPV gradually increased along with the increase of AFB1 concentrations. As shown in the inset of Fig. 5B, the DPV peak current change (ΔIp) was linear with the logarithm of AFB1 concentrations (CAFB1) from 0.01 to 100 pg mL−1. The linear regression equation was ΔIp (μA) = 1.3166 × log![[thin space (1/6-em)]](https://www.rsc.org/images/entities/char_2009.gif) CAFB1 (ng mL−1) + 7.4439 (r = 0.9973). The detection limit (LOD) of this method was calculated to be 2.84 fg mL−1, according to the 3σ rule (where σ is the standard deviation of the blank solutions, 3σ (0.1402) was used as ΔIp to substitute into the formula (ΔIp = 1.3166 × log
CAFB1 (ng mL−1) + 7.4439 (r = 0.9973). The detection limit (LOD) of this method was calculated to be 2.84 fg mL−1, according to the 3σ rule (where σ is the standard deviation of the blank solutions, 3σ (0.1402) was used as ΔIp to substitute into the formula (ΔIp = 1.3166 × log![[thin space (1/6-em)]](https://www.rsc.org/images/entities/char_2009.gif) CAFB1 + 7.4439) for calculating the C value, the C was LOD).33–35 To further illustrate the advantages of the proposed method, the detection limit and linear range of the proposed method were compared with those of other electrochemical methods for AFB1 detection. As shown in Table 1, the LOD of this sensing platform was much lower than that of most of the reported electrochemical methods previously. Such excellent analytical performance was mainly attributed to the introduction of the HCR signal amplification strategy.
CAFB1 + 7.4439) for calculating the C value, the C was LOD).33–35 To further illustrate the advantages of the proposed method, the detection limit and linear range of the proposed method were compared with those of other electrochemical methods for AFB1 detection. As shown in Table 1, the LOD of this sensing platform was much lower than that of most of the reported electrochemical methods previously. Such excellent analytical performance was mainly attributed to the introduction of the HCR signal amplification strategy.
| Methods | Linear range | LOD |
|---|---|---|
| A graphitic carbon nitride nanosheet based electrochemical biosensor36 | 0.003–3 pg mL−1 | 0.328 fg mL−1 |
| A self-powered electrochemical sensor37 | 0.01–1000 ng mL−1 | 0.73 pg mL−1 |
| A nanobody-based voltammetric immunosensor38 | 0.5–10000 pg mL−1 | 68 fg mL−1 |
| A host–guest recognition based electrochemical aptasensor39 | 0.1–10000 pg mL−1 | 0.049 pg mL−1 |
| A label-free electrochemical biosensor40 | 0.001–10000 ng mL−1 | 0.54 pg mL−1 |
| A ratiometric electrochemical aptasensor41 | 5–50000 pg mL−1 | 4.5 pg mL−1 |
| This method | 0.01–100 pg mL−1 | 2.84 fg mL−1 |
The coexistence of mycotoxins is a common phenomenon in nature, signifying that the appearance of one mycotoxin is usually accompanied by other similar mycotoxins,42,43 which requires a high specificity of the detection method. The selectivity of this electrochemical aptasensor was studied by testing six other mycotoxins including aflatoxin B2 (AFB2), aflatoxin G2 (AFG2), deoxynivalenol (DON), fumonisin B1 (FB1), ochratoxin A (OTA), zearalenone (ZEN). The evaluation was carried out through recording the Ip induced by blank or other mycotoxins and AFB1. As depicted in Fig. 6, the Ip generated by the high-concentration of non-target mycotoxins (50 fold versus AFB1) was almost the same as that of the blank. However, a distinct Ip was obtained by the addition of 100 pg mL−1 AFB1. Besides, it is worth noting that coexistence of high-concentration of other mycotoxins and AFB1 did not significantly affect the Ip compared with that of AFB1 alone, indicating that the proposed electrochemical sensing platform possessed high specificity and the capacity for detecting AFB1 when multiple toxins coexisted.
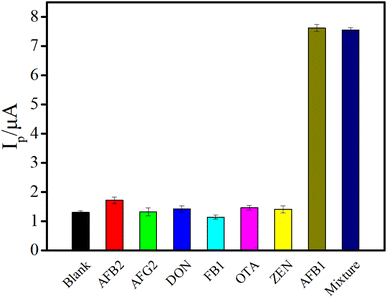 | ||
| Fig. 6 The selectivity of the proposed aptasensor against six kinds of other mycotoxins (the concentration of AFB1 and other mycotoxins was 100 pg mL−1 and 5 ng mL−1, respectively). | ||
Additionally, the reproducibility and repeatability of this aptasensor were investigated by analyzing 10 pg mL−1 AFB1 standards with the different-batch and same-batch electrodes, respectively. The relative standard deviation (RSD) of reproducibility and repeatability was 4.85% and 2.29%, respectively (n = 5), indicating the good reproducibility and repeatability of this system.
3.6. Detection of AFB1 in corn and two traditional Chinese medicine samples
Typically, as a new method, its analysis performance in complex real sample systems such as agricultural products is a problem that must be faced. To clarify this concern, the practical applicability of the proposed electrochemical aptasensor was evaluated by measuring different spiked samples including grain crops and Chinese herbal medicines which were purchased from a local supermarket. In brief, the AFB1 standards of different concentrations were spiked in blank corn and two traditional Chinese medicine samples, which were analyzed beforehand by ELISA and this method, respectively. Three concentrations of spiked samples were used for recovery and RSD measurements by using the developed electrochemical aptasensor. The results are listed in Table 2. The recovery of the proposed method in the detection of corn samples and two traditional Chinese medicine samples was 94.0%–104.8%, indicating that this method is accurate and has potential practical application value.| Sample | Spiked AFB1 (pg mL−1) | Detected by this method (pg mL−1) | Recovery (%) | RSD (n = 6, %) | Detected by ELISA (pg mL−1) |
|---|---|---|---|---|---|
| Corn | 0.5 | 0.47 | 94.0 | 4.68 | 0.44 |
| 5.0 | 4.78 | 95.6 | 3.64 | 4.99 | |
| 50.0 | 51.44 | 102.9 | 4.06 | 50.03 | |
| Coix seed | 0.5 | 0.47 | 94.0 | 5.45 | 0.42 |
| 5.0 | 4.86 | 97.2 | 3.97 | 5.02 | |
| 50.0 | 52.40 | 104.8 | 3.16 | 50.03 | |
| Polygala root | 0.5 | 0.48 | 96.0 | 4.81 | 0.47 |
| 5.0 | 4.71 | 94.2 | 5.63 | 5.02 | |
| 50.0 | 47.49 | 95.0 | 3.32 | 49.89 |
4. Conclusions
In summary, a “signal-on” electrochemical biosensor for highly selective and sensitive detection of AFB1 based on the specific aptamer and HCR signal amplification has been developed. In this work, the aptamer was employed as the recognition element to provide a high selectivity for AFB1. Meanwhile, the introduction of HCR carried large amounts of MB to achieve signal amplification, ensuring the sensitivity of the electrochemical aptasensor. It has to be mentioned that this “signal-on” style electrochemical aptasensor possessed many advantages over the “signal-off” ones, including unlimited signal gain, lower interference, less “false positive” problems, and lower background signal.44,45 Besides, the proposed sensing platform did not require the involvement of any enzyme. What's more, all oligonucleotides used in this aptasensor were non-labeled except for cDNA, which makes the method easy to operate and low-cost. Under the optimal conditions, the LOD of the AFB1 detection was down to 2.84 fg mL−1, and the aptasensor was also successfully applied to AFB1 detection in corn and two kinds of traditional Chinese medicine samples. Therefore, this electrochemical aptasensor showed great potential for detecting AFB1 in practical samples including grain crops and Chinese herbal medicines with advantages of low-cost, high sensitivity, simple operation, high selectivity and micromotion. More importantly, the proposed method can be utilized to detect other target molecules by replacing the corresponding aptamers, indicating the potential versatility for on-site food safety detection. Certainly, because the MB molecules can be embedded in both double stranded and single stranded DNA, the background signal of this method is not low enough. Nanomaterials can be combined with this HCR strategy to further reduce the detection limit and background signal in the future.Author contributions
Hongyan Zhang: conceptualization, methodology, investigation, funding acquisition, writing – original draft; Siying Ye: data curation, formal analysis, writing – original draft; Lishan Huang: visualization, investigation; Shen Fan: resources, investigation; Weiwei Mao: methodology, data curation; Yijin Hu: validation; Yuyan Yu: funding acquisition, resources, supervision, writing – review & editing; Fengfu Fu: resources, supervision, writing – review & editing.Conflicts of interest
The authors declare that they have no conflict of interest.Acknowledgements
The authors gratefully acknowledge the financial support of NSFC (81703695), Fujian Provincial Department of Science and Technology (2021J01921 and 2022J01359), the Program for new century innovative talents of Fujian Provincial Department, the Open Project of Fujian Key Laboratory of Chinese Materia Medica (X2019009), and the Key Research Program of Fujian University of Traditional Chinese Medicine (X2019008).References
- S. Marchese, A. Polo, A. Ariano, S. Velotto, S. Costantini and L. Severino, Toxins, 2018, 10, 214 CrossRef.
- I. Ałtyn and M. Twarużek, Toxins, 2020, 12, 182 CrossRef.
- G. Miklós, C. Angeli, Á. Ambrus, A. Nagy, V. Kardos, A. Zentai, K. Kerekes, Z. Farkas, Á. Jóźwiak and T. Bartók, Front. Microbiol., 2020, 11, 1916 CrossRef.
- I. Pecorelli, N. Guarducci, C. von Holst, R. Bibi, M. Pascale, B. Ciasca, A. F. Logrieco and V. M. T. Lattanzio, Toxins, 2020, 12, 270 CrossRef.
- R. Rushing and I. Selim, Food Chem. Toxicol., 2019, 124, 81–100 CrossRef PubMed.
- H. Li, S. Li, H. Yang, Y. Wang, J. Wang and N. Zheng, Toxins, 2019, 11, 226 CrossRef PubMed.
- S. Schaarschmidt and C. Fauhl-Hassek, Compr. Rev. Food Sci. Food Saf., 2018, 17, 556–593 CrossRef.
- N. Yadav, S. S. Yadav, A. K. Chhillar and J. S. Rana, Food Chem. Toxicol., 2021, 152, 112201 CrossRef CAS.
- M. Wei, F. Zhao and Y. Xie, Talanta, 2020, 209, 120599 CrossRef PubMed.
- C. Wang, J. Qian, K. An, X. Huang, L. Zhao, Q. Liu, N. Hao and K. Wang, Biosens. Bioelectron., 2017, 89, 802–809 CrossRef PubMed.
- L. Wu, M. Zhou, Y. Wang and J. Liu, J. Hazard. Mater., 2020, 399, 123154 CrossRef PubMed.
- L. Wu, F. Ding, W. M. Yin, J. Ma, B. R. Wang, A. X. Nie and H. Y. Han, Anal. Chem., 2017, 89, 7578–7585 CrossRef PubMed.
- C. Liu, T. Wu, W. Zeng, J. M. Liu, B. Hu and L. Wu, Sens. Actuators, B, 2022, 371, 132494 CrossRef.
- F. Hong, C. Huang, L. Wu, M. Wang, Y. Chen and Y. She, Biosens. Bioelectron., 2021, 192, 113489 CrossRef CAS PubMed.
- M. Qing, Z. Sun, L. Wang, S. Z. Du, J. Zhou, Q. Tang, H. Q. Luo and N. B. Li, Sens. Actuators, B, 2021, 348, 130713 CrossRef CAS.
- S. Forouzanfar, F. Alam, N. Pala and C. Wang, Biosens. Bioelectron., 2020, 170, 112598 CrossRef CAS PubMed.
- L. Wang, X. Peng, H. Fu, C. Huang, Y. Li and Z. Liu, Biosens. Bioelectron., 2020, 147, 111777 CrossRef CAS PubMed.
- X. Guo, F. Wen, N. Zheng, M. Saive, M. L. Fauconnier and J. Wang, Front. Chem., 2020, 8, 195 CrossRef CAS PubMed.
- W. Wu, C. Yu, Q. Wang, F. Zhao, H. He, C. Liu and Q. Yang, Crit. Rev. Food Sci. Nutr., 2020, 60, 2353–2368 CrossRef CAS.
- S. Mousavi Nodoushan, N. Nasirizadeh, J. Amani, R. Halabian and A. A. Imani Fooladi, Biosens. Bioelectron., 2019, 127, 221–228 CrossRef CAS PubMed.
- Q. Guo, Y. Yu, H. Zhang, C. Cai and Q. Shen, Anal. Chem., 2020, 92, 5302–5310 CrossRef CAS PubMed.
- R. Lin, Q. Feng, P. Li, P. Zhou, R. Wang, Z. Liu, Z. Wang, X. Qi, N. Tang, F. Shao and M. Luo, Nat. Methods, 2018, 15, 275–278 CrossRef CAS.
- NB Inc., DNA Ligands for Aflatoxin and Zearalenone, PCT/CA2010/001292, 2012 Search PubMed.
- S. Bi, S. Yue and S. Zhang, Chem. Soc. Rev., 2017, 46, 4281–4298 RSC.
- H. Hua, Y. Liu, X. Guan and Y. Li, Mikrochim. Acta, 2018, 185, 152 CrossRef PubMed.
- D. Long, M. Li, H. Wang, H. Wang, Y. Chai and R. Yuan, Biosens. Bioelectron., 2019, 142, 111579 CrossRef.
- F. Mo, M. Han, X. Weng, Y. Zhang, J. Li and H. Li, Anal. Chem., 2021, 93, 1764–1770 CrossRef PubMed.
- T. Meng, D. Zhao, H. Ye, Y. Feng, H. Wang and Y. Zhang, J. Colloid Interface Sci., 2020, 578, 164–170 CrossRef PubMed.
- H. Su, S. Li, M. Terebiznik, C. Guyard and K. Kerman, Sensors, 2018, 18, 2668 CrossRef PubMed.
- H. Li, Y. Hu, A. Li, X. Wang, P. Hou, C. Wang, K. Chen and C. Zhao, RSC Adv., 2017, 7, 54416–54421 RSC.
- Z. Wang, A. Murphy, A. O’Riordan and I. O’Connell, Sensors, 2021, 21, 3259 CrossRef PubMed.
- Z. Huang, Z. Zhang, X. Qi, X. Ren, G. Xu, P. Wan, X. Sun and H. Zhang, Nanoscale, 2016, 8, 13273–13279 RSC.
- E. Bakker and K. Chumbimuni-Torres, J. Braz. Chem. Soc., 2008, 19, 621–629 CrossRef PubMed.
- Y. Qian, C. Wang and F. Gao, Biosens. Bioelectron., 2015, 63, 425–431 CrossRef.
- L. L. Wang, W. Q. Chen, Y. R. Wang, L. P. Zeng, T. T. Chen, G. Y. Chen and J. H. Chen, Biosens. Bioelectron., 2020, 169, 112555 CrossRef CAS.
- V. Nirbhaya, D. Chauhan, R. Jain, R. Chandra and S. Kumar, Bioelectrochemistry, 2021, 139, 107738 CrossRef CAS.
- Y. Jin, Y. Luan, Z. Wu, W. Wen, X. Zhang and S. Wang, Anal. Chem., 2021, 93, 13204–13211 CrossRef CAS PubMed.
- X. Liu, Y. Wen, W. Wang, Z. Zhao, Y. Han, K. Tang and D. Wang, Mikrochim. Acta, 2020, 187, 352 CrossRef CAS.
- S. Wu, M. Wei, W. Wei, Y. Liu and S. Liu, Biosens. Bioelectron., 2019, 129, 58–63 CrossRef CAS.
- A. K. Singh, T. K. Dhiman, G. Lakshmi and P. R. Solanki, Bioelectrochemistry, 2021, 137, 107684 CrossRef CAS.
- C. Wang, J. Qian, K. An, X. Lu and X. Huang, Analyst, 2019, 144, 4772–4780 RSC.
- U. S. Patil, S. King, S. Holleran, K. White, C. Stephenson and J. Reuther, J. AOAC Int., 2019, 102, 1689–1694 CrossRef CAS.
- T. Lin and Y. Shen, J. Electroanal. Chem., 2020, 870, 114247 CrossRef CAS.
- X. Gao, L. Qi, K. Liu, C. Meng, Y. Li and H. Z. Yu, Anal. Chem., 2020, 92, 6229–6234 CrossRef CAS PubMed.
- X. Wang, A. Jiang, T. Hou and F. Li, Analyst, 2014, 139, 6272–6278 RSC.
Footnote |
| † These authors contributed equally to this work. |
| This journal is © The Royal Society of Chemistry 2023 |

