 Open Access Article
Overcoming a solid solution system on chiral resolution: combining crystallization and enantioselective dissolution†
Ryusei
Oketani‡
 *,
Koki
Shiohara‡
and
Ichiro
Hisaki
 *
*
Division of Chemistry, Graduate School of Engineering Science, Osaka University, 1-3 Machikaneyama, Toyonaka, Osaka 560-8531, Japan. E-mail: r.oketani.es@osaka-u.ac.jp; i.hisaki.es@osaka-u.ac.jp
First published on 17th April 2023
Abstract
Chiral resolution of rac-4-cyano-1-aminoindane, a key intermediate of ozanimod, was successfully achieved through a combination of crystallization and enantioselective dissolution with up to 96% ee. The disastereomeric salt with di-p-toluoyl-L-tartaric acid was characterized by the construction of a binary phase diagram and ternary isotherm. Enantioselective dissolution was then employed to further enrich the enantiomer.
The chirality of active pharmaceutical ingredients is of great importance in the fields of chemistry and life sciences. For example, the anti-malarial drug mefloquine shows significant differences in properties between its two enantiomers: (+)-(11S,12R)-mefloquine acts as an effective anti-malarial drug whereas (−)-(11R, 12S)-mefloquine causes side effects on the central nervous system.1 Therefore, it is important to separate the two enantiomers and investigate their respective properties. In this context, chiral resolution by crystallization methods such as preferential crystallization,2 diastereomeric salt formation,3 co-crystallization4 and deracemization5 has been widely utilized due to its economic advantages and simplicity of operation. However, these methods require crystallization conditions that yield precipitates containing only the desired enantiomer, such as in a eutectic system. As a result, the formation of solid solutions with non-stoichiometric compositions is recognized as one of the significant challenges in chiral resolution (Fig. 1a). Although solid solutions are not frequently observed according to the statistics, it is difficult to identify the crystal structure when encountered, because a solid solution appears to be of a single composition in X-ray structural analysis or other analytical techniques. In practice, this can be determined by constructing a phase diagram using thermal analysis at various compositions, i.e., a solid solution system exhibits a continuous change in melting point or solubility along with the composition change (Fig. 1a).
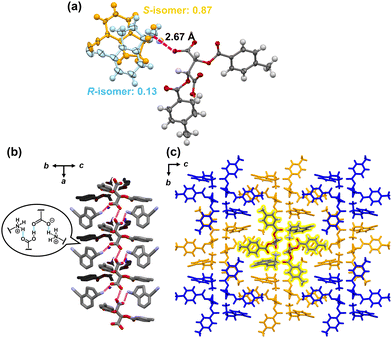
Herein, we report a new chiral resolution method for addressing solid solution crystals by combining crystallization and enantioselective dissolution. We discovered that the key intermediate of ozanimod (ZEPOSIA®), 4-cyano-1-aminoindane 1, forms a diastereomeric complete solid solution with di-p-toluoyl-L-tartaric acid, and chiral resolution was successfully achieved based on phase diagram studies and enantioselective dissolution. Access to enantiopure S-1 has been achieved by asymmetric synthesis using chiral Ellman's auxiliary6 and enzymatic methods.7 However, while salt formation with tartaric acid has been described,8 the chiral resolution of the racemic form and its crystal structure have not yet been reported. In this approach, after purification to moderate optical purity by thermodynamic equilibrium in a complete solid solution of the diastereomeric pair, the kinetically metastable diastereomeric pair is dissolved by immersing in the solvent for a short time. This combination overcomes the optical purity of the solid solution achieved by thermodynamic equilibrium (Fig. 1b). The synthesis of 1 was carried out in seven steps from naphthalene with some modifications to the method described by Uttoff and co-workers.7 Crystallization of racemic 1 and di-p-toluoyl-L-tartaric acid was performed from a methanol solution to yield single crystals. Single crystal X-ray analysis revealed a crystal structure of the diastereomeric salt composed of S-1 and L-acid with the composition ratio of S and R isomers of 87/13, as shown in Fig. 2. In the crystal structure, the amine moiety of 1 was fully protonated regardless of its chirality and one of the carboxylic acids on the tartaric acid was deprotonated, while the other one remained protonated (Fig. 2a).
The charge-assisted hydrogen bonding was confirmed between the amine and acid with an NH/O distance of 2.67 Å. The overall stoichiometric ratio of 1![[thin space (1/6-em)]](https://www.rsc.org/images/entities/char_2009.gif) :
:![[thin space (1/6-em)]](https://www.rsc.org/images/entities/char_2009.gif) L-acid is 1
L-acid is 1![[thin space (1/6-em)]](https://www.rsc.org/images/entities/char_2009.gif) :
:![[thin space (1/6-em)]](https://www.rsc.org/images/entities/char_2009.gif) 1. The ammonium and the carboxylate formed a columnar structure with a 2-fold axis along the a-axis (Fig. 2b and c). The carboxylic acid formed a hydrogen bond with the neighboring carboxylate. The negative charge per molecule of tartaric acid was 1, suggesting that the charge was not localized to one carboxylic acid and might be delocalized across both of the carboxylic acids. The average bond lengths of C–O and C
1. The ammonium and the carboxylate formed a columnar structure with a 2-fold axis along the a-axis (Fig. 2b and c). The carboxylic acid formed a hydrogen bond with the neighboring carboxylate. The negative charge per molecule of tartaric acid was 1, suggesting that the charge was not localized to one carboxylic acid and might be delocalized across both of the carboxylic acids. The average bond lengths of C–O and C![[double bond, length as m-dash]](https://www.rsc.org/images/entities/char_e001.gif) O on carboxyl groups were 1.25 and 1.26 Å, indicating that these groups are in a similar environment.
O on carboxyl groups were 1.25 and 1.26 Å, indicating that these groups are in a similar environment.
Interestingly, the ee varied in the bulk sample and 56% ee was obtained for the entire sample. Noatbly, the ee in the crystals was never close to 100% in a single crystallization, even when the solution was manipulated to avoid drying up during crystallization. In general, ideal diastereomeric salts give a eutectic mixture, allowing the optical purity to be close to 100%. In the present system, crystal structures somewhat enriched with the S-isomer were obtained, but the presence of the R-isomer was identified as a disordered structure. These findings suggest that this system forms a solid solution and further investigation of the crystallization is required to achieve efficient chiral resolution.
The true solid-state landscape of the salt can be revealed by constructing a melting point phase diagram and a ternary isotherm including solvents. The binary melting phase diagram of S-1![[thin space (1/6-em)]](https://www.rsc.org/images/entities/char_2009.gif) :
:![[thin space (1/6-em)]](https://www.rsc.org/images/entities/char_2009.gif) L-acid (SL) and R-1
L-acid (SL) and R-1![[thin space (1/6-em)]](https://www.rsc.org/images/entities/char_2009.gif) :
:![[thin space (1/6-em)]](https://www.rsc.org/images/entities/char_2009.gif) L-acid (RL) was constructed using DSC measurements and PXRD measurements. Crystalline solids with different compositions were prepared by repeatedly crystallizing crystals containing 1 and L-acid. The crystals were gradually enriched to SL, whereas the solution phase was enriched toward RL; the crystalline phase with an excess of RL was obtained by evaporating the solution phase remaining from the previous crystallization.
L-acid (RL) was constructed using DSC measurements and PXRD measurements. Crystalline solids with different compositions were prepared by repeatedly crystallizing crystals containing 1 and L-acid. The crystals were gradually enriched to SL, whereas the solution phase was enriched toward RL; the crystalline phase with an excess of RL was obtained by evaporating the solution phase remaining from the previous crystallization.
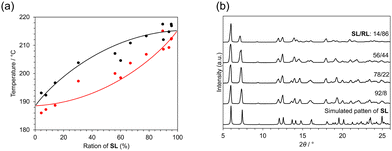
The onset and peak temperatures in DSC measurements, corresponding to solidus and liquidus, respectively, were distributed between 186 °C and 215 °C as shown in Fig. 3a and Fig. S5 (ESI†). These temperatures increased with enrichment of SL and no clear eutectic point could be detected. This is typical behavior of the complete solid solution. The higher melting point in SL-enriched solids also indicated that SL is a more stable form than RL. This is consistent with the crystallization behavior of rac-1 and L-acid, which yield S-enriched crystals. The difference of intermolecular interaction energy between the two diastereomers also supports the relative stability of SL against RL (Fig. S8, ESI†). Compound 1 is a waxy solid at room temperature, melts at 60 °C, and begins to decompose or sublime around 150 to 170 °C (Fig. S6, ESI†). This means that the decomposition of 1 is observed in the thermal events simultaneously with the fusion of the salt crystals. In the PXRD measurements, most of the peaks are identical despite the various compositions (Fig. 3b). However, some peaks change slightly in 2-θ position with compositional changes.
The intensity of a peak at 13.7° gradually decreases with the enrichment of RL. This peak can be assigned to the diffraction from the (112) plane, which is along the direction between amine molecules in the adjacent columns (Fig. S1, ESI†). These continuous changes suggest that the S and R enantiomers can substitute each other without impairing the periodicity of the crystal lattice. The overlapped peaks at 16° clearly split into 15.5° and 16.0° with the enrichment of RL. These changes occurred continuously, suggesting that the S- and R-isomers are continuously replaced in the crystal and the overall periodicity is retained. This behavior supports the formation of a solid solution. Similar behavior was observed in the solid solution of racemic salt.9 These observations in the phase diagram and PXRD measurements indicate that both SL and RL were incorporated in the same crystal, confirming the formation of a solid solution in the entire composition range.
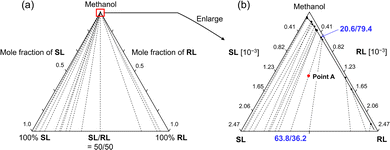
In order to quantitatively design the chiral resolution process by crystallization using this complete solid solution system, a quasi-ternary isotherm, SL/RL/methanol, was constructed. After solubility tests with various solvents, methanol was selected for isotherm construction and chiral resolution study due to the moderate solubility of 1. The construction of the ternary isotherm was conducted by the gravimetric solubility measurement at various compositions. Most of the tie lines connecting the solubility curve and the compositions of deposited crystals did not intersect (Fig. 4), indicating that sufficient thermodynamic equilibrium had been achieved during measurement. The solubility curves can be connected smoothly for all compositions. The compositions of the solution and crystalline phases connected by tie lines are drawn continuously, varying from 0/100 to 100/0. This is a feature of the tie line in a complete solid solution system.10
To understand the possible enrichment pathway and potential problems, the crystallization behavior is simulated based on the isotherm. For example, considering a supersaturated solution with an overall composition at point A in Fig. 4b, if crystals precipitate from this solution, the composition of the solution phase is 20.6/79.4 and the crystalline phase is 63.8/36.2 (28% ee) at the thermodynamic equilibrium. Once this equilibrium is achieved, the compositions of the crystalline and solution phases remain constant, although there may be fluctuations due to the dynamic exchange of substances. This means that if crystallization is conducted under these conditions, the maximum optical purity of the crystals at thermodynamic equilibrium is 28% ee. In other words, chiral enrichment is certainly achieved by crystallization in the present system, but the enrichment rate in a single crystallization is small.
This simulation is also confirmed by experiments (Fig. S9, ESI†). Based on the isotherm, the optical purity of the crystals can be gradually increased by repeated crystallization with the appropriate amounts of solvent. When rac-1 (800 mg) was crystallized from methanol (15 mL), the ee of 1 in the crystal at thermodynamic equilibrium reached 24%. Then, the crystals were collected by filtration and recrystallized from methanol twice. The ee of 1 in the crystals reached 42%. Eventually, we repeated the crystallization four times and the final ee of 1 in the crystals reached up to 80%. These enrichment paths rely on the tie-lines of the isotherm. The ternary isotherm indicates that the ee in the crystal can be gradually enriched by repeated crystallization, even starting from the racemate. However, the yield is very low and the operation time is inefficient.
The steep slope of the tie line in the ternary isotherm inspired enantioselective dissolution as a more efficient enrichment method beyond the limitations given by thermodynamics. The enriched crystalline phase, in thermodynamic equilibrium, is subsequently immersed in a new solvent to selectively dissolve the minor diastereomeric salt. Pioneering work was reported by Levilain and coworkers.11 They applied enantioselective dissolution in the saturated solution with a single enantiomer during preferential crystallization. In the diastereomeric systems of SL and RL, RL is less stable than SL and is expected to show a higher dissolution rate.
The crystals collected at thermodynamic equilibrium, starting from various compositions (20 mg), were immersed in methanol (1.0 mL) at 50 °C and collected after stirring for 5 min. The mass of the crystal and the ee of 1 in the crystalline phase were measured after drying.
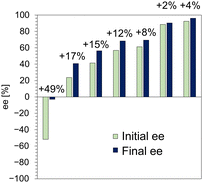
Fig. 5 summarizes the enrichment of the ee of 1 in the crystals by enantioselective dissolution. We succeeded in improving the ee of 1 in crystals with a wide range of ee by immersing them in methanol for 5 min, toward the S-isomer. Notably, even crystals with an ee as high as 92% could be improved to 96% ee in a short time. The amount of enrichment also tended to increase with the amount of R-isomer in the initial crystals, i.e., lower initial ee yielded greater enrichment. This observation indicates that the R-isomer is selectively eluted from the crystals and its rate increases with the amount of R-isomer. The elution rate of the R-isomer from SL was monitored and a dramatic dissolution occurred in the first 5 min (Fig. S10, ESI†), followed by gradual dissolution over a longer time toward a new thermodynamic equilibrium state. The behavior of the enantioselective dissolution clearly reflects the relative stability of SL and RL. Consequently, enantioselective dissolution overcomes the limitations of thermodynamics in a short time and is expected to become a powerful technique for chiral resolution of solid solutions.
This study developed a novel chiral resolution method for solid solutions by combining the thermodynamics of crystallization and the kinetics of enantioselective dissolution. The demonstration was conducted with the key intermediate of ZEPOSIA® and di-p-toluoyl-L-tartaric acid, which form a complete solid solution. A thorough phase diagram study revealed the limitations of chiral enrichment by crystallization. Further enrichment beyond the thermodynamic limitation was achieved by subsequent enantioselective dissolution. The combination of the crystallization and dissolution processes successfully provided S-1 in excellent optical purity. We believe that this demonstration pioneers a method to rapidly achieve excellent enantioselective purity in solid solution systems. The results offer an innovative solution for engineers and researchers who need to economically pursue process development with limited time and physical resources when encountering solid solutions.
The authors would like to thank Dr K. Hirose for the initial assessment of chiral HPLC analysis with a CD detector. This work is supported by KAKENHI (JP21K20534) from JSPS and a project JPNP20004 by NEDO. I. H. thanks Hoansha for their financial support. R. O. and I. H. thank the Multidisciplinary Research Laboratory System for Future Developments, Osaka University. The PXRD measurement were performed at the Analytical Instrument Facility, Graduate School of Science, Osaka University. Theoretical calculations were conducted through SQUID at the Cybermedia Centre, Osaka University.
Conflicts of interest
There are no conflicts to declare.Notes and references
- J. Ding and D. G. Hall, Angew. Chem., Int. Ed., 2013, 52, 8069–8073 CrossRef CAS PubMed.
- (a) L. C. Harfouche, C. Brandel, Y. Cartigny, S. Petit and G. Coquerel, Chem. Eng. Technol., 2020, 43, 1093–1098 CrossRef CAS; (b) A. S. Dunn, B. Szilagyi, J. H. ter Horst and Z. K. Nagy, Cryst. Growth Des., 2020, 20, 7726–7741 CrossRef CAS; (c) F. Cascella, E. Temmel, A. Seidel-Morgenstern and H. Lorenz, Org. Process Res. Dev., 2020, 24, 50–58 CrossRef CAS; (d) F. Zhou, O. Shemchuk, M. D. Charpentier, C. Matheys, L. Collard, J. H. ter Horst and T. Lessens, Angew. Chem., Int. Ed., 2021, 60, 20264–20268 CrossRef CAS PubMed; (e) J. Mahieux, M. Sanselme, S. Harthong, C. Melan, C. Aronica, L. Guy and G. Coquerel, Cryst. Growth Des., 2013, 13, 3621–3631 CrossRef CAS; (f) G. Coquerel, R. Bouaziz and M. J. Brienne, Chem. Lett., 1988, 1081–1084 CrossRef CAS.
- (a) F. Zhou, L. Collard, K. Robeyns, T. Leyssens and O. Shemchuk, Chem. Commun., 2022, 58, 8560–8563 RSC; (b) M. H. T. Kwan, J. Breen, M. Bowden, L. Conway, B. Crossley, M. F. Jones, R. Munday, N. P. B. Pokar, T. Screen and A. J. Blacker, J. Org. Chem., 2021, 86, 2458–2473 CrossRef CAS PubMed; (c) N. Uemura, Y. Yoshida, T. Mino and M. Sakamoto, Tetrahedron, 2020, 76, 131166 CrossRef CAS; (d) D. F. Bánhegyi, D. Szolcsányi, J. Madarász and E. Pálovics, Chirality, 2022, 34, 374–395 CrossRef PubMed; (e) L. Marc, S. Guillemer, J.-M. Schneider and G. Coquerel, Chem. Eng. Res. Des., 2022, 178, 95–110 CrossRef CAS.
- (a) M. Guillot, J. de Meester, S. Huynen, L. Collard, K. Robeyns, O. Riant and T. Leyssens, Angew. Chem., Int. Ed., 2020, 59, 11303–11306 CrossRef CAS PubMed; (b) W. Li, M. De Groen, H. J. M. Kramer, R. Gelder, P. Tinnemans, H. Meekes and J. H. ter Horst, Cryst. Growth Des., 2021, 21, 112–124 CrossRef CAS; (c) O. Shemchuk, F. Grepioni, T. Leyssens and D. Braga, Isr. J. Chem., 2021, 61, 563–572 CrossRef CAS.
- (a) K. Sanada, A. Washio, H. Ishikawa, Y. Yoshida, T. Mino and M. Sakamoto, Angew. Chem., Int. Ed., 2022, 61, e202201268 CrossRef CAS PubMed; (b) R. Oketani, F. Marin, P. Tinnemans, M. Hoquante, A. Laurent, C. Brandel, P. Cardinael, H. Meekes, E. Vlieg, Y. Geerts and G. Coquerel, Chem. – Eur. J., 2019, 25, 13890–13898 CrossRef CAS PubMed; (c) G. Valenti, P. Tinnemans, I. Baglai, W. L. Noorduin, B. Kaptein, M. Leeman, J. H. Ter Horst and R. M. Kellogg, Angew. Chem., Int. Ed., 2021, 60, 5279–5282 CrossRef CAS PubMed.
- E. Martinborough, M. F. Boehm, A. R. Yeager, J. Tamiya, L. Huang, E. Brahmachary, M. Moorjani, G. A. Timony, J. L. Brooks, R. Peach, F. L. Scott and M. A. Hanson, Selective Sphingosine 1 Phosphate Receptor Modulators and Combination Therapy Therewith, 2015, 2015066515A1 Search PubMed.
- F. Uthoff, J. Löwe, C. Harms, K. Donsbach and H. Gröger, J. Org. Chem., 2019, 84, 4856–4866 CrossRef CAS PubMed.
- C. Cianferotti, G. Barreca, V. Bollabathini, L. Carcone, D. Grainger, S. Staniland and M. Taddei, Eur. J. Org. Chem., 2021, 1924–1930 CrossRef CAS.
- A. Mbodji, G. Gbabode, M. Sanselme, Y. Cartigny, N. Couvrat, M. Leeman, V. Dupray, R. M. Kellogg and G. Coquerel, Cryst. Growth Des., 2020, 20, 2562–2569 CrossRef CAS.
- In the case of eutectic systems, solubility increases at the eutectic composition and the crystalline phase is of a single composition when the composition in solution changes. Further details of the phase diagram of eutectic systems are described in the following reviews. (a) G. Coquerel, Polymorphism in the Pharmaceutical Industry, Wiley-VCH Verlag GmbH & Co. KGaA, Weinheim, Germany, 2018, pp. 91–132 Search PubMed; (b) G. Coquerel, in Advances in Organic Crystal Chemistry: Comprehensive Reviews, ed. R. Tamura, M. Miyata, Springer Japan, Tokyo, 2015, pp. 393–420 Search PubMed.
- G. Levilain, M. J. Eicke and A. Seidel-Morgenstern, Cryst. Growth Des., 2012, 12, 5396–5401 CrossRef CAS.
Footnotes |
| † Electronic supplementary information (ESI) available: Details of synthesis, crystallographic data, thermal analysis, theoretical calculations, and experimental procedure of chiral resolution. CCDC 2236669. For ESI and crystallographic data in CIF or other electronic format see DOI: https://doi.org/10.1039/d3cc01352a |
| ‡ These authors equally contributed to the work. All the authors agreed to switch the order of the first and second authors in their respective CVs. |
| This journal is © The Royal Society of Chemistry 2023 |


