A multi-faceted structural, thermodynamic, and spectroscopic approach for investigating ethanol dehydration over transition phase aluminas†
Nicholas A.
Strange
 *a,
Sourav
Adak
ae,
Zachary
Stroupe
a,
Christopher A.
Crain
a,
Eric C.
Novak
 b,
Luke L.
Daemen
b and
J. Z.
Larese
acd
aDepartment of Chemistry, University of Tennessee, Knoxville, TN 37996, USA. E-mail: nstrange@slac.stanford.edu
bNeutron Scattering Division, Oak Ridge National Laboratory, Oak Ridge, Tennessee 37831, USA
cJoint Institute for Advanced Materials, Knoxville, TN 37920, USA
dShull-Wollan Center, a Joint Institute for Neutron Sciences, Oak Ridge, TN 37831, USA
eLovely Professional University, Phagwara, Punjab 144001, India
First published on 9th December 2022
Abstract
Understanding the role that the surface of a material plays in the mediation of a chemical reaction at the atomic level is paramount to the optimization and improvement of catalytic materials. While this area of research has matured over several decades, few techniques are sensitive enough to directly examine and differentiate the behavior of molecular adsorbates during the course of the chemical reaction with a substrate. In this study, a combined approach which involves structural characterization techniques, volumetric adsorption, temperature programmed desorption, and inelastic neutron scattering (INS) was used to investigate the mechanism of ethanol dehydration on the surface of transition phase aluminas. The alumina samples employed were extensively characterized using X-ray diffraction, solid-state 27Al nuclear magnetic resonance spectroscopy, and thermogravimetric analysis with differential scanning calorimetry. A high-precision volumetric adsorption apparatus was used to characterize the surface area and to controllably dose ethanol onto the surface of the aluminas. A modified temperature programmed desorption (TPD) method which samples the molecular composition of the vapor at discrete temperatures in a closed cell is described. INS results were used to confirm adsorption of ethanol on γ- and θ-alumina and show the reaction of ethanol and subsequent formation of ethylene as a function of temperature. The TPD and INS results affirm that the dehydration reaction and subsequent formation of ethylene on both γ- and θ-aluminas occur rapidly at 300 °C, though ethanol is still observed on θ-alumina indicating fewer active sites. These results demonstrate the value of a multi-faceted characterization approach, featuring INS, towards providing a detailed understanding of the ethanol dehydration mechanism on θ-alumina and further provide the basis for extending this approach to other systems in heterogeneous catalysis and areas where molecule-substrate interactions are poorly understood.
Introduction
Adsorption plays a critical role in several technologically important chemical processes and industries,1,2 particularly for reactions which are mediated by substrates/sorbents.3,4 Although many industrially relevant heterogeneous catalytic reactions are well characterized from a macroscopic standpoint, a comprehensive understanding of fundamental interactions between reactant molecules and active sites is often limited.5 As a result, the full complexity of surface-catalyzed reactions often goes unrecognized. For example, in the heterogeneous catalytic cycle, a reactant molecule first adsorbs (chemically or physically) to the substrate with some degree of reversible dissociation. If an active site is not accessible, molecular diffusion along the substrate is necessary until an active site is reached, wherein a chemical reaction may occur, occasionally with a thermal activation barrier. The resulting product molecule then diffuses across the surface and/or completes the cycle with desorption.This multi-step process is frequently characterized using indirect methods (e.g., temperature programmed desorption) whereby information about the catalytic reaction is inferred by spectroscopic identification of products as a function of temperature. Direct techniques such as X-ray absorption spectroscopy (XAS) can be used to observe the electronic structure of metal sites/clusters6 or reactant/product molecules.7 However, XAS is insensitive to low-Z elements and ultra-high vacuum environments necessary for measurements at soft X-ray absorption edges present significant experimental challenges. As such, XAS is more often performed at the X-ray absorption edge of the metal active site and information about the adsorbate is inferred.8 Optical spectroscopies, which probe the microscopic behavior of the surface species, e.g., infrared (IR), Raman, and UV-Vis spectroscopies, are often restricted to systems where an active transition can be identified within the available instrumental sensitivity and resolution.9 Limited control over experimental variables (e.g., adsorption coverage) during these types of in situ measurements can also lead to misconstrued results and variability in the literature. In the discussion below, a comprehensive and highly reproducible approach towards understanding the surface-catalyzed dehydration of ethanol over the surface of transition phase aluminas is described. In this study, a high-resolution volumetric adsorption apparatus is used to introduce precise quantities of ethanol to various transition phase alumina substrates. The vapor-phase products were characterized as a function of reaction temperature using a modified approach to temperature programmed desorption (TPD). Inelastic neutron scattering (INS) is then used to examine the reactants, surface-bound intermediates, and products by a temperature-limited approach.
Aluminas are widely used commercial catalysts and catalyst supports for dehydration reactions. Some of the more common minerals used to generate catalytically active aluminas include gibbsite, boehmite, and bayerite. These minerals are composed of aluminum oxide hydroxides which transition through a variety of metastable phases upon thermal treatment before ultimately rearranging to form the stable corundum phase (α-alumina), as illustrated in Fig. 1. It is important to note that the structure and attendant chemical activity of the transition phase aluminas are strongly dependent on the starting minerals (which includes defects, morphologies, purity, etc.) and conditions of sample preparation and handling. Consequently, there is a longstanding degree of uncertainty in the literature about the exact bulk and surface structures of the transition phase aluminas.
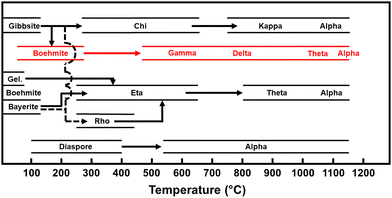 | ||
| Fig. 1 Calcination sequence for a selection of aluminum oxide hydroxide-based minerals, adapted from Wefers and Misra.49 The calcination route used in this study is highlighted in red. | ||
The catalytic activities of the transition phase aluminas have been previously examined for a number of chemical reactions over the course of decades10–13 and as a result, a number of active surface sites have been proposed. The debate in the literature tends to primarily involve surface Lewis and Brønsted acid sites. Lewis acid sites are coordinatively-unsaturated aluminum sites created by surface-terminated bonding. These sites have been labeled AlIII, AlIV, and AlV by Digne et al.14 (the subscript refers to the coordination number). A greater degree of coordinative unsaturation is related to an increase in Lewis acidity. Conversely, Brønsted acid sites are formed by isolated surface hydroxyls or hydroxyl regions that are segregated within the specific alumina phase based on the local chemical environment. Multiple reports15–17 have suggested that the Brønsted sites are not acidic enough to protonate a weakly basic alcohol, based on the determination that reaction with a stronger base, such as pyridine, is more favorable; a finding consistent with theoretical predictions.18 However, the role of hydroxyls during catalytic dehydration over transition phase aluminas remains unclear, even though they are known to exist at the surface or within the bulk crystal until the fully dehydroxylated α-phase is attained at temperatures near 1100 °C. A model proposed by Digne et al.14,19 is frequently used to describe the relative availability of Lewis and Brønsted acid surface sites on the 100, 110, and 111 facets of γ-alumina as a function of temperature. No comparable models have been proposed for the surfaces of δ- or θ-phases which have sequentially lower quantities of residual hydroxylation. The δ- and θ-alumina phases are much less studied, highlighting a gap in knowledge of how the phase (and by extension, the degree of hydroxylation) of the alumina substrate influences the dehydration reactivity.
The primary focus of the discussion presented here involves the dehydration of ethanol over the transition phase aluminas, with a specific focus on how the reaction behavior over θ-alumina differs from the γ-phase (i.e., the more preferred/examined substrate). Dehydration of ethanol over aluminas can yield two different products, ethylene and diethyl ether, both of which have been observed experimentally. Calculations employing density functional theory (DFT) have indicated that an E2-elimination reaction is the most favorable pathway for dehydration of ethanol to ethylene18 on the surface of γ-alumina. Alternatively, diethyl ether is reported to form by reaction of an Al-bound ethoxide, hydroxyl, and a local ethanol molecule via an SN2-type reaction mechanism. Experimental results suggest that diethyl ether selectivity is preferred at high ethanol concentrations and low reaction temperatures.20,21 The formation of diethyl ether is reversible, and can re-associate with a surface-terminated aluminum and adjacent oxygen, followed by the E2-type mechanism proposed for ethylene formation. Unfortunately, no experimental data is available to confirm either of these proposed mechanisms. Unraveling the complex nature of these surface sites and their catalytic reaction mechanisms at a fundamental level requires (1) extensive characterization of aluminas bulk and surface structures, (2) a well-controlled and reproducible approach for introducing ethanol to the substrate, and (3) sufficient sensitivity and resolution for monitoring the state of the reactant and product molecules.
In the following discussion, a multi-faceted approach that includes characterization of the structure, dynamics, thermodynamics, and adsorption properties of ethanol dehydration on the surface of transition phase aluminas is described. A recipe is provided for calcining the transition phase aluminas. Thermogravimetric analysis and differential scanning calorimetry (TGA-DSC) were used to determine the water loss and thermodynamics associated with structural phase transformations. X-ray diffraction (XRD) and solid-state magic angle spinning aluminum nuclear magnetic resonance spectroscopy (27Al SS-MAS NMR) measurements were used to characterize the bulk and surface structures of the transition phase aluminas for each of the calcination procedures. A volumetric isothermal adsorption technique provided a highly precise and reproducible method for introducing ethanol to the surface of the aluminas. Previous work22 demonstrated that the prolonged counting times required for INS are incompatible with in operando flow-based techniques as the substrate changes at a rate faster than the timescale of the measurement. A modification to conventional TPD methods is described, which enables INS measurements where the ethanol-alumina system remains unchanged over time. Using a modified TPD method, conclusions about the temperature dependence of the dehydration reaction can be made by nominally fixing the surface coverage during the measurement and uncoupling the bias from a constantly decreasing number of molecules. Results from TPD measurements are used to guide reaction conditions which were used in inelastic neutron scattering (INS) measurements.
The use of INS is a relatively new avenue for studying these types of thermally activated surface-catalyzed reactions and the increased flux of modern spallation-based neutron sources provides the ability to measure millimolar quantities of surface-limited molecular species. INS offers advantages over other spectroscopic techniques because of the large neutron incoherent scattering cross section of the hydrogen atom over a broad energy transfer range (ca. 1 to >4000 cm−1). The inelastic incoherent scattering cross section for hydrogen in the thermal neutron energy range is over an order of magnitude greater than any other element/isotope.23 In contrast to X-ray spectroscopic techniques, INS is sensitive to the local environment of protons and hydrogen-bearing molecules during catalytic reactions, provided a steady-state can be found. Infrared spectroscopy is an impractical option for aluminas at lower wavenumbers due to severe absorption below ∼1200 cm−1 due to phonon modes.24 Here, we use INS to provide the broadband INS spectrum of γ- and θ-aluminas and determine how the structural phase influences the reaction with adsorbed ethanol.
Experimental
Material preparation & characterization
The mineral boehmite was obtained in powdered form from BASF (G-250 medium density pseudoboehmite catalyst substrate) with greater than 99% purity. All alumina samples examined in these studies originated from the same initial boehmite batch. Procedurally, the transition phase aluminas (γ, δ, θ) and the final corundum phase (α) were all calcined in air using a top-loading furnace (Lindberg Blue). The heating procedures for calcination of boehmite to the transition phase aluminas are detailed in Table 1. After calcination, the powders were immediately transferred to an argon glovebox in order to limit the formation of surface hydroxyls by reaction with atmospheric moisture. The powders were degassed at 300 °C under high vacuum prior to use. All transition phase aluminas were rigorously characterized using XRD, 27Al SS-MAS NMR, TGA-DSC, and surface area measurements. Detailed characterization was employed to establish procedural reproducibility among these alumina materials and to confirm that the powders used in this study are comparable to those used in prior reports.25–27| Alumina phase | Calcination temperature (°C) | Time (hour) |
|---|---|---|
| Boehmite | — | — |
| γ-Alumina | 600 | ≥8 |
| δ-Alumina | 600, 800, 600 | 8, 2, 2 |
| θ-Alumina | 1050 | ≥8 |
| α-Alumina | 1200 | ≥8 |
190-Proof ethanol was purchased from Fischer Scientific and azeotropically distilled over three cycles to eliminate residual water content. The dried ethanol was subjected to further purification using a freeze-pump-thaw distillation cycle to remove soluble gases from the liquid. The purity of the ethanol was verified using gas chromatography with a thermal conductivity detector prior to use in adsorption measurements.
XRD measurements were performed on a Panalytical Empyrean powder diffractometer outfitted with a Cu-Kα source and a rotating sample stage. All XRD patterns were measured at room temperature in θ–2θ Bragg-Brentano geometry. Solid-state 27Al SS-MAS NMR measurements were performed on a Varian INOVA 400 MHz NMR equipped with Doty XC4 CP/MAS 4 mm probe spun at 20 kHz. TGA-DSC measurements were conducted in a Netzsch Jupiter STA-449 instrument. Boehmite powders were loaded into a heat-treated alumina crucible in air and transferred into the TGA-DSC unit. The calcination procedure used for TGA-DSC measurements employed a linear heating ramp until the desired calcination temperature was reached. While holding the temperature fixed, the mass loss and structural phase transformation thermodynamics were recorded as a function of time.
Volumetric adsorption
Volumetric isothermal adsorption of methane at 77 K (in liquid nitrogen) were performed using a custom-built, automated, high-resolution apparatus described elsewhere28 to determine the surface capacity and relative changes in surface area of the various alumina powders. Methane was used as a substitute for nitrogen (i.e., the typical adsorbate in BET measurements) since it is commonly used to determine the surface areas of uniform substrates, based on the known monolayer solid structure.29 A series of ethanol adsorption isotherms were also performed at room temperature in order to calibrate the monolayer surface coverage necessary for the TPD and INS experiments. The Point-B method30 was used to determine the relative adsorption capacity (mmol gram−1) of ethanol adsorption on the aluminas at room temperature. Fresh samples were used in each adsorption measurement to guarantee a pristine surface in each trial.Temperature programmed desorption
A “modified” approach to TPD was employed to examine the identity and quantity of vapor phase molecules as a function of temperature. The setup for TPD included a temperature-calibrated top-loading furnace, custom-built gas handling manifold, and an HP 5890 gas chromatography (GC) system outfitted with a thermal conductivity detector. The entire setup is shown schematically in Fig. S1 (ESI†). The GC was equipped with a 2 m long, 2.2 mm inner diameter stainless steel column packed with Hayesep T porous polymers. Additional parameters for the GC are available in Table S1 (ESI†). The modified procedure (relative to conventional TPD) involves maintaining a closed sample cell during heating to maintain a nominally constant number of molecules throughout the entire measurement. In these measurements, minute aliquots of the vapor phase molecules were sampled by leaking approximately 10 Torr of sample into a gas line with small volume (∼1 mL) which also serves as a sample loop for the GC inlet. Because the volume of the gas line is small relative to that of the sample cell, the moles of vapor removed can be maintained well below 1% for the entire experiment. This sampling procedure was repeated between room temperature and 350 °C in 25 °C steps. At each temperature, a ten-minute thermal equilibrium period was employed prior to sampling. The detector signal was scaled by the quantity of the sampled aliquots.Inelastic neutron scattering
INS measurements were performed using the VISION31 spectrometer (BL-16B) at the Spallation Neutron Source (Oak Ridge National Laboratory). γ- and θ-alumina samples (2.80 and 2.85 g, respectively) were loaded in aluminum sample holders (20 mm diameter × 60 mm height), sealed at both ends by ConFlat flanges using copper gaskets, which enables sample heating up to 300 °C. A ø 0.25 in × 4 in length stainless-steel tube was welded to one of the ConFlat flanges and a valve was attached to the top of the tubing. The activated alumina powders were loaded in the sample holders in a dry, helium glovebox and transported to the beam line without exposure to air. The holders were then attached to a standard sample stick and connected to a gas handling manifold through a stainless-steel capillary line. After evacuation of the capillary line, ethanol was controllably dosed onto the alumina samples using adsorption coverages pre-determined by the isotherm measurements.Quantities of ethanol adsorbed were calculated based on the specific surface areas of the samples as measured with a Micromeritics Gemini VII instrument. The BET isotherm for the γ-alumina sample showed a specific surface area of ∼220 m2 g−1, whereas the θ-alumina sample had a smaller specific surface area, of ∼85 m2 g−1. A molecular cross section of 19 Å2 molecule−1 was assumed for ethanol. For both γ- and θ-alumina samples, fractional coverages of 0.8 of the ethanol monolayer capacities were adsorbed at room temperature.
Heating of ethanol adsorbed on alumina was performed with a band heater placed around the sample holder. A standard benchtop temperature controller was used to control the sample temperature during heat treatments. The valve on top of the sample holder remained closed during and after the high temperature reactions to prevent loss of reaction products. Ethanol physisorption occurred with the samples at room temperature. Mild heating (40 °C) of the sample for 10–15 minutes was performed after adsorption to ensure uniform distribution of ethanol in the samples. The sample was then placed in the closed-cycle refrigerator at the VISION beam line and cooled to 5 K for data collection. The dehydration reaction took place in a similar manner by removing the sample from the refrigerator, warming up to room temperature, placing the sample in a band heater for a predetermined amount of time, as explained above. Blank measurements were performed for the bare alumina materials and were subtracted from the ethanol-dosed spectra collected subsequently. Mantid Workbench 6.1 was used for data reduction, background subtraction, and data processing.
Results & discussion
Structural characterization
The process used to produce the transition phase aluminas involves calcination of the original pure boehmite mineral at increasing temperatures which results in a series of topotactic structural transformations accompanied by dehydration. The initial boehmite material is an orthorhombic aluminum oxide hydroxide (AlOOH).32 Powder XRD patterns for the starting boehmite material and the γ-, θ- and α-phases are displayed in Fig. 2. The assigned structures were found to be in good agreement with the lattice parameters reported in the literature19,33 and the resulting powders were observed to be single phase. These assignments were made on the basis of structural refinements using the Rietveld method in GSAS-II.34 The details of these Rietveld refinements can be found in the ESI† (see Fig. S2–S5).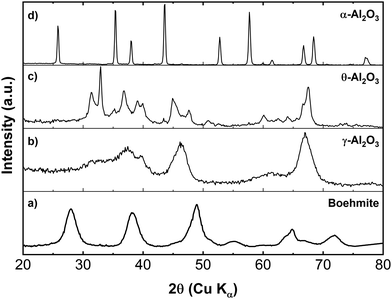 | ||
| Fig. 2 XRD patterns from (a) boehmite, (b) γ-, (c) θ-, and (d) α-alumina powders. The transition phase aluminas were calcined from boehmite material. | ||
Although the exact structure of γ-alumina is debated in literature, a Rietveld refinement of the γ-alumina XRD data using a non-spinel, monoclinic structure established agreement with reports in the literature.19 By subsequently heating the γ-alumina to temperatures greater than ∼800 °C but less than 1000 °C, the γ-alumina passes through a series of complex phase transitions (not shown in Fig. 2), where the most notable of these is the monoclinic δ-phase.35,36 However, when the alumina material is heated to ∼1050 °C a high-purity θ-alumina phase forms. The θ-alumina structure displays monoclinic symmetry with a space group that is isomorphic with β-Ga2O3.37,38 It should be noted here that a recent structural study by Kovarik et al.33 suggests that the θ-alumina phase derived from boehmite may be structurally more complex than previously believed. They contend that the actual structure is more accurately represented by the intergrowth of the β-Ga2O3 structure with a monoclinic variant of the δ-alumina phase, denoted δ3. We note that although our Rietveld refinement of the θ-phase alumina only includes the C2/m space group symmetry, it is recognized that a small, undetermined, amount of the δ3-alumina structure may be present in the bulk powder and more importantly at the surface.
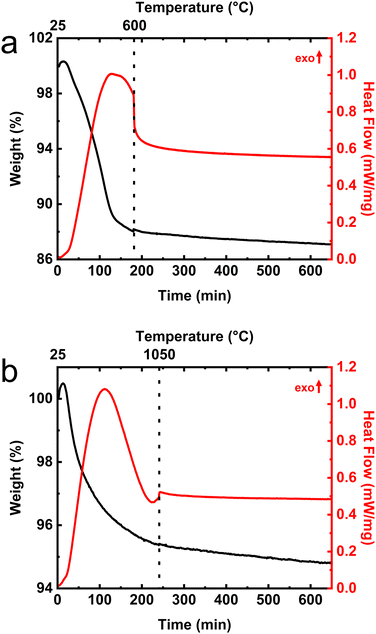
A companion set of characterizations using TGA-DSC were performed to monitor the structural phase transformations which accompany the calcination of these materials. DSC traces provided a sensitive measure of the temperature and time dependences of the phase transitions while the simultaneously recorded TGA signals track the mass loss associated with the structural transformations. The primary goal of the TGA-DSC measurements was to ensure that the calcination procedures would reproducibly generate the desired alumina phase. TGA-DSC data from the calcination of boehmite to γ-alumina phase are shown in Fig. 3a. Because the temperature program involves extended periods of time at constant temperature (i.e., it is not a linear function of time), dashed vertical lines identify the locations of the temperature ramps and are labeled on the upper axis. Most of the observed decrease in sample mass in the TGA traces can be attributed to water loss since dehydration is known to accompany the structural transformations between boehmite and α-alumina phases. Note that an endothermic feature in the DSC trace is observed in Fig. 3a just before the calcination temperature (600 °C) is reached, clearly indicating that the boehmite to γ-alumina crystalline phase transformation occurred. TGA indicates that the initial boehmite material exhibits a 13% loss of mass during the transformation to γ-alumina. The γ-alumina sample was used as the starting material for calcining the θ-alumina material. TGA-DSC data for the calcination of δ-alumina is provided in Fig. S6 (ESI†). The TGA-DSC data for the γ- to θ-calcination procedure shown in Fig. 3b displays an endothermic turnover in the DSC trace, observed near 550 °C, which turns over just prior to reaching the 1050 °C set point. The γ- to θ-phase transformation coincides with a mass loss of approximately 5% in the TGA which amounts to an aggregate loss of 18% mass, relative to the starting boehmite material. TGA-DSC for the θ- to α-phase transition can be observed in the Fig. S7 (ESI†). It is worth noting that less than 1% mass loss is observed upon calcination from the θ-phase to the fully dehydrated corundum phase which suggests that θ-alumina contains very little residual water content and/or surface hydroxyls. This observation has significance for the interpretation of the vibrational spectra from the bare alumina substrates as will be discussed later.
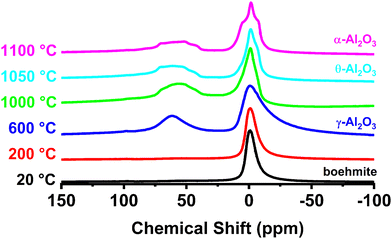
Solid-state 27Al NMR measurements were performed to characterize the local structure of transition phase aluminas used in this investigation primarily because the technique is highly sensitive to local structural distortions, coordination number, and complementary to the XRD results described previously. More importantly, NMR is capable of identifying and distinguishing un-saturated aluminum cations at the surface. Solid-state 27Al NMR spectra from the aluminas as a function of calcination temperature are shown in Fig. 4. Signals from tetrahedral (AlIV) and octahedral (AlVI) aluminum environments in 27Al NMR have been identified previously by several groups.39,40 The signal near 0 ppm from the octahedrally coordinated aluminum sites is the only contribution to the 27Al NMR from boehmite. Octahedrally coordinated Al appears in all the transition phase aluminas present in Fig. 4. Changes to the 27Al NMR spectrum associated with the structural reorganization that accompanies the transition from boehmite to γ-phase are illustrated in the blue spectrum (representative of the starting boehmite material heated to 600 °C). The appearance of the peak in the NMR spectrum near 60 ppm signals the formation of tetrahedrally coordinated aluminum sites associated with the γ-alumina structure. Further changes to the NMR signal are noted as a function of increasing calcination temperature, including a broadened distribution centered at 50 ppm as the material is heated above 600 °C.
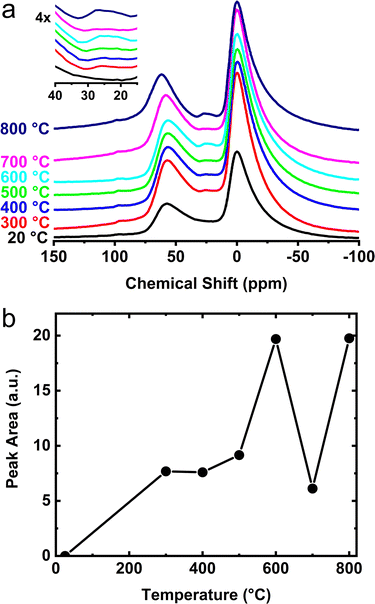
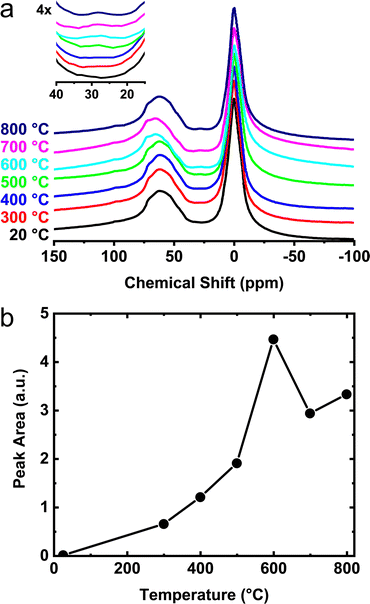
A more detailed view of the 27Al NMR spectral changes is provided for the γ- and θ-phase aluminas in Fig. 5a and 6a. For these measurements, γ- and θ-alumina were heat treated between 300 and 800 °C in order to determine the temperatures necessary for activation (e.g., removal of species bound to the active sites) and optimization of the number of reactive surface sites. As the temperatures of these materials are increased above ∼300 °C, a third peak becomes apparent at 25 ppm corresponding to increased numbers of penta-coordinated aluminum sites, AlV (i.e., onefold-unsaturated octahedral Al3+ sites). The integrated areas associated with these AlV signals, shown in Fig. 5b and 6b, clearly demonstrate the increase in concentration of the penta-coordinated sites as the calcination temperature is raised above 300 °C. In Fig. 5b, two maxima are observed, first corresponding to the formation of AlV on γ-alumina at 600 °C, and a second formation of AlV presumably associated with the structural transformation to δ-alumina at 800 °C. Previous data from Hu et al.41 suggested that the penta-coordinated aluminum site contribution is decreased during the δ- to θ-alumina transformation. It is not clear if this observed decay is a consequence of the decreased surface area of θ-alumina (relative to γ- and δ-alumina) due to sintering or if there is a decreased areal density of AlV sites. Notwithstanding, the NMR data shown in Fig. 6a and b, highlight the formation of an AlV site in the θ-phase material after heat-treatment at 300 °C and above, which confirms θ-alumina exposes surface Lewis acidic aluminum sites. The AlV sites in both γ- and θ-alumina phases appear to be reactive at room temperature and have a relatively short lifetime if handled in air. These findings suggest transition phase alumina powders should be handled in an inert atmosphere after calcination or heat-treatment in order to prevent loss of active AlV sites and prohibit surface reactions with atmospheric moisture.
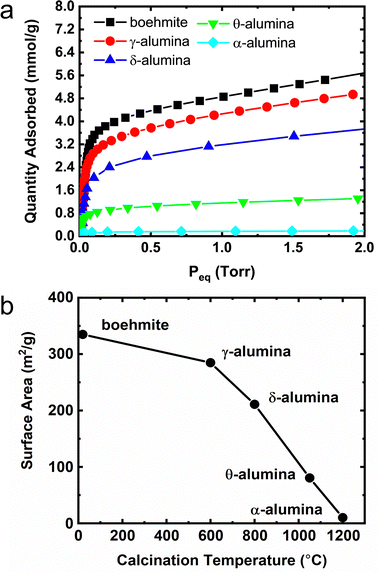
Adsorption isotherms
A summary of methane adsorption measurements for all alumina phases used in this study is provided in Fig. 7a. The Point-B method30 was used to determine the number of moles in an adsorbed monolayer and calculate the mass normalized adsorption capacity as a function of calcination temperature. Using the van der Waals radius of methane42 and the number of molecules in a monolayer, the surface areas of the transition phase aluminas were estimated as shown in Fig. 7b. The monolayer coverages for the δ- and θ-transition phases exhibit significant decreases relative to the boehmite material which corresponds to a decay in specific surface areas. The terminal α-phase alumina was found to have a surface area less than 10% of the initial boehmite capacity, presumably a result of sintering and decrease in porosity. Companion ethanol adsorption isotherms used to calibrate surface coverage for TPD and INS measurements are summarized in Fig. S8 (ESI†). Which largely replicates the trend observed in Fig. 7a and b for methane adsorbed on the aluminas.In a previous study,20 a correlation was made between increased surface ethoxide concentration and decreased selectivity toward ethylene formation. The overwhelming majority of studies on alcohol dehydration over aluminas utilize flow-based methods to introduce ethanol to the alumina substrate where the partial pressure of ethanol is varied to adjust the nominal surface coverage (e.g., flow concentrations of ∼2% ethanol in 1 mL s−1 He gas).21 Unfortunately, there is no reliable method for relating eluent concentration in a flow to static adsorption coverage. The flow-based approach presumably results in sub-monolayer coverages because the adsorption kinetics are slow, a fact underpinned by long equilibration times (>10 min) observed in the volumetric adsorption isotherm measurements presented above. The most important aspect of the flow-approach is the assumption that the ethanol partial pressure reaches a steady state at a fixed ethanol![[thin space (1/6-em)]](https://www.rsc.org/images/entities/char_2009.gif) :
:![[thin space (1/6-em)]](https://www.rsc.org/images/entities/char_2009.gif) helium ratio. However, the time-averaged surface coverage is a function of the ethanol partial pressure, helium flow rate, total pressure of the system, and length of the exposure time. An additional degree of uncertainty associated with flow method is caused by the amount of unquantifiable residual, weakly-bound ethanol removed by a post-loading helium purge. This situation complicates the thermodynamic analysis because a precise relationship between the surface ethanol concentration and steady state flow related ethanol partial pressure may depend strongly on the exact experimental conditions used. Furthermore, in situ flow measurements on substrates, which exhibit losses in catalytic activity (and attendant changes in surface structure/dynamics) over time, are not readily adaptable for neutron spectroscopic studies where counting times can last up to several hours.22 “Static” volumetric adsorption-based methods offer reproducible (i.e., easily replicated across labs), high precision control over the surface coverage. The equilibrium state of this “closed cell” experiment can also be maintained for extended periods of time necessary for long duration measurements, as is the case for INS.
helium ratio. However, the time-averaged surface coverage is a function of the ethanol partial pressure, helium flow rate, total pressure of the system, and length of the exposure time. An additional degree of uncertainty associated with flow method is caused by the amount of unquantifiable residual, weakly-bound ethanol removed by a post-loading helium purge. This situation complicates the thermodynamic analysis because a precise relationship between the surface ethanol concentration and steady state flow related ethanol partial pressure may depend strongly on the exact experimental conditions used. Furthermore, in situ flow measurements on substrates, which exhibit losses in catalytic activity (and attendant changes in surface structure/dynamics) over time, are not readily adaptable for neutron spectroscopic studies where counting times can last up to several hours.22 “Static” volumetric adsorption-based methods offer reproducible (i.e., easily replicated across labs), high precision control over the surface coverage. The equilibrium state of this “closed cell” experiment can also be maintained for extended periods of time necessary for long duration measurements, as is the case for INS.
Temperature programmed desorption
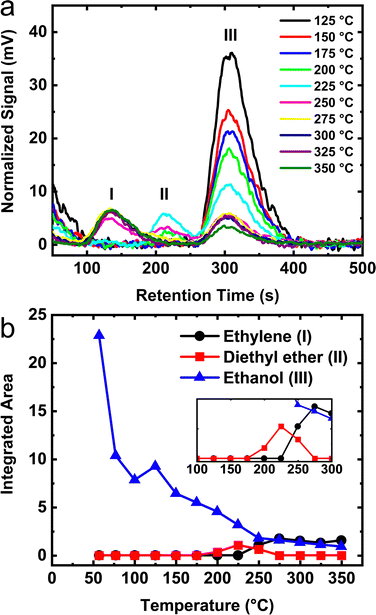
TPD measurements using a modified method were performed for monolayer coverage ethanol adsorbed on the starting boehmite mineral, transition phase aluminas, and final α-phase material. Kwak et al.21,27 reported TPD data that reveals ethanol dissociation from the surface at temperatures of ∼50 °C. In order to obtain detailed knowledge of the dehydration reaction using TPD, we aimed to develop a method whereby the molecular concentration of both the reactants and products within our experimental cell did not change by a loss of molecules due to desorption and subsequent removal by pumping the gas phase species into a mass spectrometer for analysis. Standard TPD determinations of the reaction enthalpy by Lee et al.21 do not account for the removal of these gas phase species. The adapted TPD method was employed because it offers the following advantages: (1) accurate temperature determination without needing to account for heat transfer during a linear ramp (which can vary among TPD instruments), (2) a sample environment that fixes the chemical potential and maintains a molecular composition of the gas phase of the system including the retention of reversible intermediates species (i.e. diethyl ether) at each discrete temperature thereby establishing a reliable description of the reaction thermodynamics, and (3) provides for an experimental protocol with thermodynamic conditions suitable for INS measurements or other characterization techniques requiring long data acquisition times.Fig. 8a shows the vapor phase signal as a function of increasing sample temperature for a monolayer of ethanol adsorbed on γ-alumina. Data below 125 °C are not shown because only un-reacted, reversibly dissociated ethanol is observed. The signal remains virtually unchanged until ∼175 °C. As the temperature is raised above 175 °C, a signal from diethyl ether appears in the gas chromatogram. An additional increase in temperature to 225 °C reveals the onset temperature of ethylene formation in the gas phase. Maximum ethylene desorption near 275 °C is about 50 °C higher than measurements made by Peden et al.27 for ethanol on γ-alumina. The slight increase in desorption temperature is not too surprising considering that our closed-cell measurements do not pump away the gas phase molecules in contrast to typical TPD methods. In this study, molecules present in the gas phase increase the effective pressure on adsorbed species thereby shifting surface desorption to higher temperatures. Such phenomena would not have been observed in measurements that employ conventional TPD.
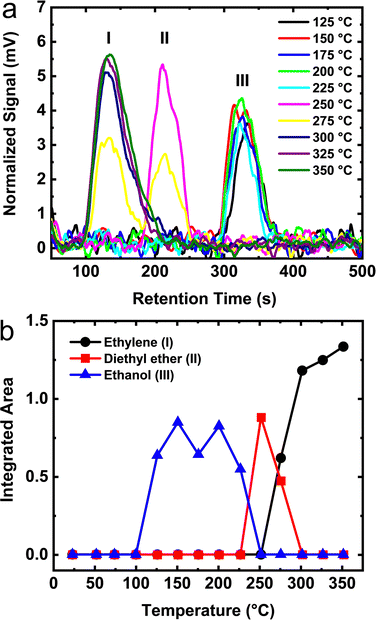
The TPD results from monolayer ethanol adsorbed on θ-alumina are shown in Fig. 9a. The integrated areas in Fig. 9b, clearly show that the surface of θ-alumina exhibits the lowest quantity of dissociated ethanol relative to the γ- and δ-phases discussed above. Surprisingly, no desorption signal is observed until ∼125 °C. Furthermore, the temperature range over which unreacted ethanol and diethyl ether desorb narrowed substantially relative to the other aluminas. Ethylene begins to desorb above 250 °C which is ∼25 °C higher than on γ- and δ-alumina, a direct consequence of the higher thermal activation barrier on the θ-alumina sites. Fig. 9b, shows that at ∼300 °C the temperature is high enough to initiate the surface reaction of ethanol on θ-alumina and that only ethylene is produced.
TPD of ethanol from δ-alumina is presented in Fig. S9 (ESI†), and largely replicates the behavior observed from θ-alumina. For completeness, TPD from α-alumina was also recorded and the data is available in Fig. S10 (ESI†). Interestingly, a single unidentified product was observed from the α-phase which appears in the gas chromatogram with a retention time between ethylene and diethyl ether. It is plausible that the basicity of the α-Al2O3 surface facilitated a hydrogen transfer reaction and the subsequent formation of ketene as suggested in other work,13 but is outside the scope of this study.
Inelastic neutron scattering
Using INS, we exploit the ability to examine the spectra of both bare aluminas and adsorbed ethanol over broad ranges of energy. Comparison of results from INS to existing IR data validates reproducibility of previous reports, highlights similarities between the two techniques, and establishes areas where INS is more advantageous. Ethanol dehydration over γ- and θ-alumina provides a direct comparison between a well-described interaction (ethanol on γ-alumina) and a far less studied system (ethanol on θ-alumina).INS spectra from the bare γ- and θ-alumina substrates are displayed in Fig. 10a and b. IR data on γ-alumina available in the literature is limited to energies greater than 300 cm−1. However, the reported IR spectra markedly differs from the INS data where significantly more excitations are observed. The vibrational modes observed in the low energy spectra (Fig. 10a) are largely associated with correlated lattice modes (e.g., phonons and librations). Łodziana and Parliński43 calculated the phonon dispersion relations and density of states (DOS) for θ-alumina and interpreted the results using MgAl2O4 as a model system. Again, there is little agreement between the simulated vibrational DOS (or partial DOS for the sublattices), which suggests existing structural models for the transition phase aluminas are deficient, as detailed elsewhere.44 Undoubtedly, any proton dynamics present in the γ- and θ-alumina lattices are magnified in the INS, compared to earlier IR results due to the immense incoherent neutron scattering cross section of hydrogen. Although outside the scope of the current manuscript, we suggest that the phonon and librational modes present in the INS can be used in combination with density functional theory to further refine the structures of the transition phase aluminas, and at the very least resolve uncertainties regarding whether hydroxyls are found in the bulk alumina structures.
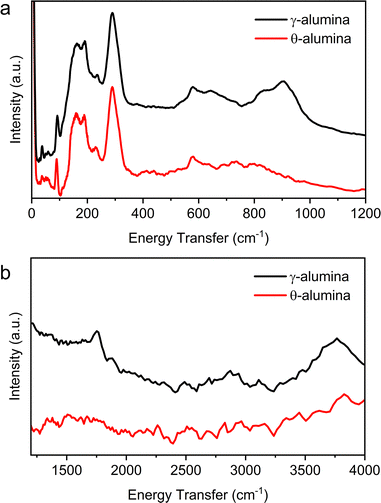 | ||
| Fig. 10 INS from the bare γ- and θ-alumina powders in the (a) low energy transfer (0–1200 cm−1) and (b) high energy transfer (1250–4000 cm−1) regions. | ||
The higher energy transfer regions (1250–4000 cm−1 in Fig. 10b) display fewer excitations in the INS compared to IR but remain consistent with earlier spectroscopic reports. The feature at ∼1750 cm−1 has not been observed in prior IR data, but notably disappears following the transition from γ- to θ-alumina. A series of hydroxyl modes overlapped between 3500 and 3850 cm−1 have been isolated and described by prior DFT calculations.19 Understandably, the band associated with hydroxyl motions decreases in intensity in the θ-alumina spectrum, a consequence of additional dehydration and preservation of the materials in an inert environment.
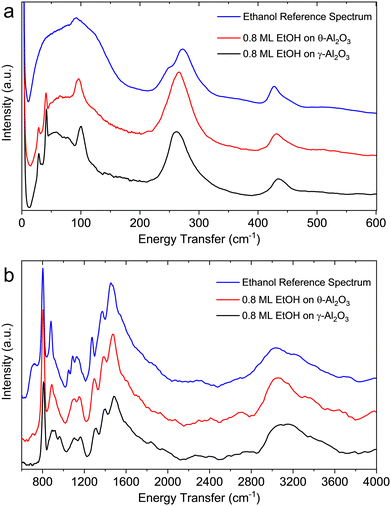
Fig. 11a shows the background subtracted neutron vibrational spectra of ethanol on γ- and θ-alumina below 600 cm−1, a spectral region largely inaccessible to (or unstudied by) IR spectroscopy. The vibrational mode at ∼268 cm−1 in solid ethanol, associated with the methyl torsional mode, is shifted to lower wavenumbers in the adsorbed layers. The shift of this vibrational mode to lower wavenumbers (∼258 cm−1 for γ-alumina and ∼262 cm−1 for θ-alumina), relative to bulk solid ethanol is caused by the ethanol-alumina interaction. Below 200 cm−1, solid ethanol primarily shows a broad band, whereas the spectra from adsorbed ethanol layers exhibit discrete peaks associated with so-called “riding modes”. These discrete modes are present in the neutron vibrational spectrum from the pristine γ-alumina material (see Fig. S11, ESI†), albeit significantly weaker. In the INS data from the initial γ-alumina sample, the intensities associated with these modes are weak because of the small scattering cross sections of Al and O (i.e., the only atoms moving in the pure alumina sample). Upon adsorption of ethanol, the intensity of these modes increases since hydrogenous species move in concert with the alumina surface. Because of the large cross section of hydrogen, the alumina surface phonons become strongly “highlighted”. The large mass of ethanol/ethoxide shifts the alumina surface modes very slightly. The shifting of the torsional mode and the presence of discrete modes below 200 cm−1 suggest that ethanol is present as an adsorbed layer (as opposed to bulk ethanol) in both alumina samples. These riding modes represent one such feature where INS displays particular sensitivity to the ethanol-alumina interaction.
Fig. 11b shows the neutron vibrational spectra of ∼0.8 ML ethanol adsorbed on γ- and θ-alumina in the 600–2000 cm−1 range. There are small differences in peak positions and relative intensities compared to the spectrum of solid ethanol, again indicative of the ethanol-alumina interaction. For the most part, excitations observed in the solid ethanol spectrum within this energy range are largely due to hydrogen bonding interactions among ethanol molecules. A summary of these excitations is presented in Table 2. The intermolecular forces among ethanol molecules on the transition aluminas are presumably weaker than in the bulk solid since the adsorbed molecules are largely coordinated with well-separated reactive surface sites, which causes a few notable differences in the observed vibrational spectra compared to bulk ethanol. There are only minute differences between the spectra of ethanol on γ- and θ-aluminas which indicates the local environments of ethanol molecules on both surfaces are rather similar. The only notable differences between the two spectra are observed between 700 and 1000 cm−1, where adsorption on θ-alumina appears to represent the bulk solid signal. This difference is perhaps a consequence of weaker binding environments on θ-alumina or slight over-saturation of ethanol forming bulk ethanol. Excitations observed for ethanol on θ-alumina are also regularly lower in wavenumber than the γ-alumina counterpart.
| Wavenumbers (cm−1) | Mode | Ref. | ||
|---|---|---|---|---|
| Solid EtOH | EtOH on γ-alumina | EtOH on θ-alumina | ||
| — | 28.5 | 28.8 | Riding modes | This paper |
| — | 41.7 | 41.0 | Riding modes | This paper |
| 92 | 100 | 95 | This paper | |
| 272 | 262 | 265 | Methyl torsion | This paper |
| 427 | 436 | 431 | This paper | |
| 802 | 809 | 805 | δ(C-O-H) | 45 |
| 881 | 890* | 888 | ν(CC) | 46 |
| 1087 | 1102 | 1100 | ν(CO), ν(CC) | 47 |
| 1137 | 1165 | 1154 | ν(CO), ν(CC) | 47 |
| 1274 | 1308 | 1297 | ν(CH) | 48 |
| 1372 | 1395 | 1387 | δs(CH3) | 47 |
| 1462 | 1488 | 1473 | δa(CH3), νs(OCO) | 47 |
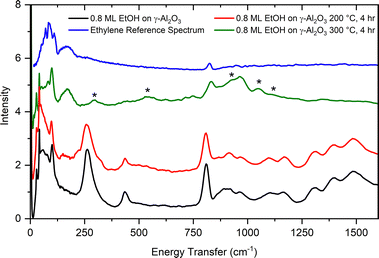
As suggested by previous reports20,21 and confirmed by our TPD results, ethanol dehydration on aluminas is expected to produce ethylene and diethyl ether in relative quantities that depend on the alumina surface characteristics and reaction conditions. Fig. 12 shows the INS spectrum of ethanol adsorbed on γ-alumina, as well as the spectra obtained after reaction at 200 °C (4 hours) and 300 °C (4 hours). A small decrease in the overall INS intensity is apparent in the sample reacted at 200 °C, indicating the start of a reaction consuming ethanol, as well as a broadening of the methyl torsional mode at 262 cm−1. The spectrum from the sample reacted at 300 °C shows more dramatic changes. Comparison with a reference spectrum for ethylene unambiguously shows its presence in the sample reacted at 300 °C (broad band at 172 cm−1 and sharper peak at ∼830 cm−1). Given that the vibrational modes associated with ethanol are absent in the 300 °C spectrum, it can be inferred that the initial amount of ethanol in the sample has been converted to other products. A series of new bands appear in the 300 °C spectrum: 296, 545, 935, 1054, and 1109 cm−1, with the band at 935 cm−1 being particularly broad. These new peaks do not match the vibrational spectrum of diethyl ether particularly well. The absence of diethyl ether spectral signatures in the INS data and contrast with TPD results may be due to the low temperature (5 K) used in the INS measurements which drives the equilibrium between the adsorbed and vapor phases towards the adsorbed phase. Additionally, the formation of diethyl ether has been predicted to be reversible when re-adsorbed onto the transition phase aluminas.18 The modes observed following heat treatment at 300 °C are more likely to be associated with surface ethoxides, sorbed water, or surface/subsurface hydroxyls, though additional analyses are needed.
From the results shown in Fig. 9, it is clear that ethanol dehydration over θ-alumina is slow at 200 °C, but proceeds relatively quickly at 300 °C. The same sequence of measurements outlined above was repeated for ethanol adsorbed on θ-alumina, but the 300 °C reaction was stopped after 2 hours in order to collect a neutron vibrational spectrum. The reaction was continued for another 2 hours at 300 °C, followed by the collection of another spectrum. The results of these measurements are compiled in Fig. 13.
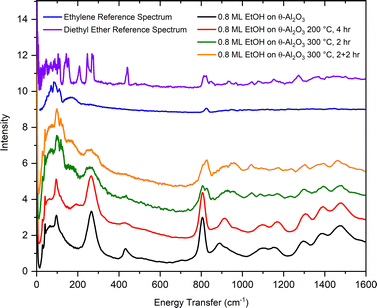 | ||
| Fig. 13 Vibrational spectra of ethanol adsorbed on θ-alumina (black), following reaction at 200 °C for 4 hours (red), reaction at 300 °C for 2 hours (green), then reaction at 300 °C for an additional 2 hours (orange). The top curves are the reference INS spectra for bulk ethylene (blue) and diethyl ether (purple).50 | ||
At 200 °C, Fig. 13 shows a softening of the C–C–O bending mode at 430 cm−1. This softening is much less apparent in the corresponding spectrum from ethanol adsorbed on γ-alumina. After 2 hours at 300 °C, most ethanol modes are still observable in the spectrum, but the main features of the ethylene spectrum are already apparent. Unreacted ethanol is still present in the sample. The broad band around 935 cm−1 and sharper peaks around 1054 cm−1 are also present, as observed previously in the 300 °C spectrum of γ-alumina. After 2 + 2 hours at 300 °C, the ethylene peak at 830 cm−1 has grown slightly, but unreacted ethanol remains observable in the spectrum, suggesting the presence of fewer active sites in θ-alumina relative to the γ-alumina sample, since the adsorption coverages were scaled by their respective SSAs. Fewer active sites per unit area on θ-alumina is a reasonable hypothesis considering only cleavage at the 100 plane yields penta-coordinated aluminum atoms (assuming only one degree of un-saturation), presumed to be the active Lewis acid site on aluminas. It is also intriguing that the ethanol and ethylene signals on θ-alumina appear more similar to the corresponding bulk reference spectra than the analogous spectrum for ethanol on γ-alumina, suggesting interactions with the substrate are dominated by weaker physisorption forces before and after reaction. Alternatively, one could argue that because θ-alumina contains less native hydration than γ-alumina, fewer protons (e.g., Brønsted acid sites adjacent to Lewis acid sites) are available to facilitate the dehydration reaction. Additional strategically conducted (deuterated ethanol to differentiate contributions from adsorbate and substrate) INS measurements with higher resolution above 2000 cm−1 would be needed to test these hypotheses.
Conclusions
In this study, we have demonstrated how INS can be used in tandem with structural characterization techniques, volumetric adsorption, and TPD to provide a highly reliable and controlled method for examining the surface-catalyzed dehydration of ethanol using a temperature-limited approach. Structural measurements confirmed the calcined aluminas were consistent with prior literature reports and 27Al NMR data showed an elevated concentration of surface penta-coordinated Al3+ sites on the γ- and δ-phases. TPD data indicated that the conversion of chemisorbed ethanol to ethylene on θ-alumina proceeded rapidly at 300 °C, approximately 25 °C higher than on the γ- and δ-phases.INS data was presented for the bare γ- and θ-alumina substrates which covered a broad range of excitations exceeding that of previously reported IR data. We identified the presence of phonon and librational modes which can be used in combination with density functional theory to further understand the structures of the transition aluminas. INS also confirmed the presence of adsorbed ethanol as determined by the shift in energy of the bulk ethanol torsion mode as well as the presence of discrete modes associated with ethanol “riding modes”. Upon heating to 200 °C, the INS spectra from the ethanol dosed γ- and θ-alumina samples show a decrease in overall intensity suggesting that the ethanol had reacted with the surface. After heating the samples to 300 °C, the formation of ethylene was unambiguously determined by comparing the INS signal to a bulk ethylene reference spectrum. These spectroscopic results suggest that although the dehydration reaction begins at temperatures as low as 200 °C, the reaction is significantly faster at 300 °C, a finding consistent with the TPD results. Although ethylene is readily apparent in the INS, on θ-alumina, ethanol is still observable at 200 and 300 °C, after both 2 and 4 hour reaction times indicating longer reaction times are necessary for full dehydration of ethanol over θ-alumina. The results of this comprehensive study underscore the potential of INS techniques for directly probing adsorbates during surface-mediated chemical reactions. Future work will focus on applying this approach to other prototypical catalytic/surface reactions.
Conflicts of interest
There are no conflicts to declare.Acknowledgements
JZL recognizes useful interactions with Chuck Sumner from Eastman Chemical as well as the unrestricted funds that Eastman Chemical provided. A portion of this research used resources from BL-16B (VISION) at the Spallation Neutron Source, a DOE Office of Science User Facility operated by the Oak Ridge National Laboratory. XRD used to confirm the structure of the transition phase alumina powders was conducted at the Center for Nanophase Materials Sciences, which is a DOE Office of Science User Facility.Notes and references
- Y. Ding and E. Alpay, Adsorption-enhanced steam-methane reforming, Chem. Eng. Sci., 2000, 55, 3929–3940 CrossRef CAS.
- P. Pullumbi, F. Brandani and S. Brandani, Gas separation by adsorption: technological drivers and opportunities for improvement, Curr. Opin. Chem. Eng., 2019, 24, 131–142 CrossRef.
- D. Rosenthal, Functional surfaces in heterogeneous catalysis: a short review, Phys. Status Solidi A, 2011, 208, 1217–1222 CrossRef CAS.
- A. Sandoval, A. Gómez-Cortés, R. Zanella, G. Díaz and J. M. Saniger, Gold nanoparticles: support effects for the WGS reaction, J. Mol. Catal. A: Chem., 2007, 278, 200–208 CrossRef CAS.
- S. T. Marshall and J. W. Medlin, Surface-level mechanistic studies of adsorbate-adsorbate interactions in heterogeneous catalysis by metals, Surf. Sci. Rep., 2011, 66, 173–184 CrossRef CAS.
- A. S. Hoffman, D. Sokaras, S. Zhang, L. M. Debefve, C. Y. Fang, A. Gallo, T. Kroll, D. A. Dixon, S. R. Bare and B. C. Gates, High-Energy-Resolution X-ray Absorption Spectroscopy for Identification of Reactive Surface Species on Supported Single-Site Iridium Catalysts, Chem. – Eur. J., 2017, 23, 14760–14768 CrossRef CAS PubMed.
- J. A. Rodriguez, T. Jirsak, J. Dvorak, S. Sambasivan and D. Fischer, Reaction of NO2 with Zn and ZnO: Photoemission, XANES, and Density Functional Studies on the Formation of NO3, J. Phys. Chem. B, 2000, 104, 319–328 CrossRef CAS.
- S. Bordiga, E. Groppo, G. Agostini, J. A. Van Bokhoven and C. Lamberti, Reactivity of surface species in heterogeneous catalysts probed by in situ X-ray absorption techniques, Chem. Rev., 2013, 113, 1736–1850 CrossRef CAS.
- M. E. Z. Velthoen, S. Nab and B. M. Weckhuysen, Probing acid sites in solid catalysts with pyridine UV-Vis spectroscopy, Phys. Chem. Chem. Phys., 2018, 20, 21647–21659 RSC.
- A. R. Mcinroy, D. T. Lundie, J. M. Winfield, C. C. Dudman, P. Jones, S. F. Parker and D. Lennon, The interaction of alumina with HCl: an infrared spectroscopy, temperature-programmed desorption and inelastic neutron scattering study, Catal. Today, 2006, 114, 403–411 CrossRef CAS.
- S. Carre, N. Suor, R. Revel and P. Magnoux, Characterization of the acid – base properties of transition aluminas by model reaction, Appl. Catal., A, 2008, 348, 71–78 CrossRef CAS.
- H. Adkins and P. P. Perkins, Dehydration of alcohols over alumina, J. Am. Chem. Soc., 1925, 47, 1163–1167 CrossRef CAS.
- P. Kostestkyy, J. Yu, R. J. Gorte and G. Mpourmpakis, Structure-activity relationships on metal-oxides: alcohol dehydration, Catal. Sci. Technol., 2014, 4, 3861–3869 RSC.
- M. Digne, P. Sautet, P. Raybaud, P. Euzen and H. Toulhoat, Hydroxyl Groups on γ-Alumina Surfaces: A DFT Study, J. Catal., 2002, 211, 1–5 CrossRef CAS.
- G. Busca, The surface of transitional aluminas: a critical review, Catal. Today, 2014, 226, 2–13 CrossRef CAS.
- J. F. DeWilde, C. J. Czopinski and A. Bhan, Ethanol dehydration and dehydrogenation on γ-Al2O3: mechanism of acetaldehyde formation, ACS Catal., 2014, 4, 4425–4433 CrossRef CAS.
- S. Roy, G. Mpourmpakis, D. Hong, D. G. Vlachos, A. Bhan and R. J. Gorte, Mechanistic Study of Alcohol Dehydration on γ-Al2O3, ACS Catal., 2012, 2, 1846–1853 CrossRef CAS.
- M. A. Christiansen, G. Mpourmpakis and D. G. Vlachos, Density Functional Theory-Computed Mechanisms of Ethylene and Diethyl Ether Formation from Ethanol on γ-Al2O3(100), ACS Catal., 2013, 3, 1965–1975 CrossRef CAS.
- M. Digne, P. Sautet, P. Raybaud, P. Euzen and H. Toulhoat, Use of DFT to achieve a rational understanding of acid–basic properties of γ-alumina surfaces, J. Catal., 2004, 226, 54–68 CrossRef CAS.
- H. Arai, J.-I. Take, Y. Saito and Y. Yoneda, Ethanol Dehydration on Alumina Catalysts I. The Thermal Desorption of Surface Compounds, J. Catal., 1967, 9, 146–153 CrossRef CAS.
- J. Lee, J. Szanyi and J. H. Kwak, Ethanol dehydration on γ-Al2O3: effects of partial pressure and temperature, Mol. Catal., 2017, 434, 39–48 CrossRef CAS.
- S. Tan, Y. Cheng, L. L. Daemen and D. A. Lutterman, Design of a facility for the in situ measurement of catalytic reaction by neutron scattering spectroscopy, Rev. Sci. Instrum., 2018, 89, 014101 CrossRef.
- V. F. Sears, Neutron scattering lengths and cross sections, Neutron News, 1992, 3, 26–37 CrossRef.
- A. R. Mcinroy, D. T. Lundie, J. M. Winfield, C. C. Dudman, P. Jones, S. F. Parker, W. Taylor and D. Lennon, An infrared and inelastic neutron scattering spectroscopic investigation on the interaction of η-alumina and methanol, Phys. Chem. Chem. Phys., 2005, 7, 3093–3101 RSC.
- J. H. Kwak, J. Hu, A. Lukaski, D. H. Kim, J. Szanyi and C. H. F. Peden, Role of pentacoordinated Al3+ ions in the high temperature phase transformation of γ-Al2O3, J. Phys. Chem. C, 2008, 112, 9486–9492 CrossRef CAS.
- J. H. Kwak, J. Hu, D. Mei, C. W. Yi, D. H. Kim, C. H. F. Peden, L. F. Allard and J. Szanyi, Coordinatively unsaturated Al3+ centers as binding sites for active catalyst phases of platinum on γ-Al2O3, Science, 2009, 325, 1670–1673 CrossRef CAS PubMed.
- J. H. Kwak, D. Mei, C. H. F. Peden, R. Rousseau and J. Szanyi, (100) facets of γ-Al2O3: the active surfaces for alcohol dehydration reactions, Catal. Lett., 2011, 141, 649–655 CrossRef CAS.
- Z. Mursic, M. Y. M. Lee, D. E. Johnson and J. Z. Larese, A computer-controlled apparatus for performing high-resolution adsorption isotherms, Rev. Sci. Instrum., 1996, 67, 1886–1890 CrossRef CAS.
- A. Freitag and J. Z. Larese, Layer growth of methane on MgO: an adsorption isotherm study, Phys. Rev. B: Condens. Matter Mater. Phys., 2000, 62, 8360–8365 CrossRef CAS.
- S. Brunauer and P. H. Emmett, The Use of Low Temperature van der Waals Adsorption Isotherms in Determining the Surface Areas of Various Adsorbents, J. Am. Chem. Soc., 1937, 59, 2682–2689 CrossRef CAS.
- P. A. Seeger, L. L. Daemen and J. Z. Larese, Resolution of VISION, a crystal-analyzer spectrometer, Nucl. Instrum. Methods Phys. Res., Sect. A, 2009, 604, 719–728 CrossRef CAS.
- X. Bokhimi, J. Sánchez-Valente and F. Pedraza, Crystallization of sol-gel boehmite via hydrothermal annealing, J. Solid State Chem., 2002, 166, 182–190 CrossRef CAS.
- L. Kovarik, M. Bowden, D. Shi, N. M. Washton, A. Andersen, J. Z. Hu, J. Lee, J. Kwak and C. H. F. Peden, Unraveling the Origin of Structural Disorder in High Temperature Transition Al2O3: Structure of θ-Al2O3, Chem. Mater., 2015, 27, 7042–7049 CrossRef CAS.
- B. H. Toby and R. B. Von, Dreele, GSAS-II: the genesis of a modern open-source all purpose crystallography software package, J. Appl. Crystallogr., 2013, 46, 544–549 CrossRef CAS.
- L. Kovarik, M. Bowden, A. Genc, C. H. F. Peden and J. H. Kwak, Structure of δ-Alumina: Toward the Atomic Level Understanding of Transition Alumina Phases, J. Phys. Chem. C, 2014, 118, 18051–18058 CrossRef CAS.
- L. Kovarik, M. Bowden, D. Shi, J. Szanyi and C. H. F. Peden, Structural Intergrowth in δ-Al2O3, J. Phys. Chem. C, 2019, 123, 9454–9460 CrossRef CAS.
- G. Yamaguchi and W.-C. Chiu, Delta and Theta Al2O3 under Hydrothermal Conditions, Bull. Chem. Soc. Jpn., 1967, 41, 741–744 CrossRef.
- A. P. Borosy, B. Silvi, M. Allavena and P. Nortier, Structure and bonding of bulk and surface θ-alumina from periodic Hartree-Fock calculations, J. Phys. Chem., 1994, 98, 13189–13194 CrossRef CAS.
- J. H. Kwak, J. Z. Hu, D. H. Kim, J. Szanyi and C. H. F. Peden, Penta-coordinated Al3+ ions as preferential nucleation sites for BaO on γ-Al2O3: an ultra-high-magnetic field 27Al MAS NMR study, J. Catal., 2007, 251, 189–194 CrossRef CAS.
- L. A. O’Dell, S. L. P. Savin, A. V. Chadwick and M. E. Smith, A 27Al MAS NMR study of a sol-gel produced alumina: identification of the NMR parameters of the θ-Al2O3 transition alumina phase, Solid State Nucl. Magn. Reson., 2007, 31, 169–173 CrossRef.
- J. Zhi, S. Xu, J. Hun, M. Y. Hu, C. Wan, Z. Zhao, J. Szanyi, X. Bao, X. Han, Y. Wang, C. H. F. F. Peden, J. Z. Hu, S. Xu, J. H. Kwak, M. Y. Hu, C. Wan, Z. Zhao, J. Szanyi, X. Bao, X. Han, Y. Wang and C. H. F. F. Peden, High field 27Al MAS NMR and TPD studies of active sites in ethanol dehydration using thermally treated transitional aluminas as catalysts, J. Catal., 2016, 336, 85–93 CrossRef.
- C. W. Kammeyer and D. R. Whitman, Quantum mechanical calculation of molecular radii. I. Hydrides of elements of periodic groups IV through VII, J. Chem. Phys., 1972, 56, 4433–4439 CrossRef.
- Z. Łodziana and K. Parliński, Dynamical stability of the α and θ phases of alumina, Phys. Rev. B: Condens. Matter Mater. Phys., 2003, 67, 1–7 CrossRef.
- C. Wolverton and K. C. Hass, Phase stability and structure of spinel-based transition aluminas, Phys. Rev. B: Condens. Matter Mater. Phys., 2000, 63, 024102 CrossRef.
- A. Aldiyarov, M. Aryutkina, A. Drobyshev, M. Kaikanov and V. Kurnosov, Low Temperature Physics, American Institute of Physics Inc., 2009, vol. 35, pp. 251–255 Search PubMed.
- J. R. Durig and R. A. Larsen, Torsional vibrations and barriers to internal rotation for ethanol and 2,2,2-trifluoroethanol, J. Mol. Struct., 1990, 238, 195–222 CrossRef CAS.
- S. Golay, R. Doepper and A. Renken, In-situ characterisation of the surface intermediates for the ethanol dehydration reaction over γ-alumina under dynamic conditions, Appl. Catal., A, 1998, 172, 97–106 CrossRef CAS.
- NIST Standard Reference Database Number 101, 2022.
- K. Wefers and C. Misra, Oxides and Hydroxides of Aluminum, Alcoa Technical Paper, 1987, 19, 1–100 Search PubMed.
- E. Bennett, T. Wilson, P. J. Murphy, K. Refson, A. C. Hannon, S. Imberti, S. K. Callear, G. A. Chass and S. F. Parker, How the Surface Structure Determines the Properties of CuH, Inorg. Chem., 2015, 54, 2213–2220 CrossRef CAS.
Footnote |
| † Electronic supplementary information (ESI) available: The supplementary information contains additional details about the modified TPD method and supporting XRD and TGA-DSC data for δ- and α-aluminas. See DOI: https://doi.org/10.1039/d2cp04016f |
| This journal is © the Owner Societies 2023 |

