Theoretical prediction of superconductivity in two-dimensional MXenes of molybdenum carbides†
Hao-Dong
Liu
a,
Hong-Yan
Lu
 a,
Na
Jiao
a,
Meng-Meng
Zheng
a,
Ya-Ping
Li
a,
Liu
Yang
a,
Bao-Tian
Wang
a,
Na
Jiao
a,
Meng-Meng
Zheng
a,
Ya-Ping
Li
a,
Liu
Yang
a,
Bao-Tian
Wang
 *bcd and
Ping
Zhang
*ae
aSchool of Physics and Physical Engineering, Qufu Normal University, Qufu 273165, China. E-mail: zhang_ping@iapcm.ac.cn
bInstitute of High Energy Physics, Chinese Academy of Sciences, Beijing 100049, China. E-mail: wangbt@ihep.ac.cn
cSpallation Neutron Source Science Center, Dongguan 523803, China
dCollaborative Innovation Center of Extreme Optics, Shanxi University, Taiyuan, Shanxi 030006, China
eInstitute of Applied Physics and Computational Mathematics, Beijing 100088, China
First published on 29th November 2022
Abstract
Theoretically and experimentally, MXenes consisting of Mo and C have aroused much interest due to superconductivity in their films and even monolayer forms. Here, based on first-principles calculations, we systematically calculate the electronic structure, phonon dispersion, and electron–phonon coupling (EPC) of monolayer Mo2C (both T- and H-phases), Mo3C2, and Mo3C3. The results show that H-MoxCy (x = 2 or 3, y = 1–3) always have lower total energies than their corresponding T phase and other configurations. All these two-dimensional (2D) molybdenum carbides are metals and some of them display weak phonon-mediated superconductivity at different superconducting transition temperatures (Tc). The Mo 4d-orbitals play a critical role in their electronic properties and the Mo atomic vibrations play a dominant role in their low-frequency phonons, EPC, and superconductivity. By comparison, we find that increasing the Mo content can enhance the EPC and Tc. Besides, we further explore the impact of strain engineering on their superconducting related physical quantities. With increasing biaxial stretching, the phonon dispersions are gradually softened to form some soft modes, which can trigger some peaks of α2F(ω) in the low-frequency region and evidently increase the EPC λ. The Tc of H-Mo2C can be increased up to 11.79 K. Upon further biaxial stretching, charge density waves may appear in T-Mo2C, H-Mo3C2, and H-Mo3C3.
1 Introduction
Since the successful fabrication of graphene1 and monolayers of transition metal dichalcogenides (TMDs),2 two-dimensional (2D) materials have attracted much attention due to their fascinating and exotic electronic, optical, mechanical, magnetic, and thermal properties. Among them, 2D transition metal carbides, carbonitrides, and nitrides (MXenes) have expanded rapidly since the discovery of Ti3C2 in 2011.3 The mechanical flexibility, easy coating capability, superb carrier anisotropic mobility, hydrophilic nature, and high conductivity enable their good applications in energy storage,4 electromagnetic interference shielding,5 (photo)electrocatalysis,6etc.In condensed matter physics, quantum states of superconductivity7 and charge density waves (CDW)8 in 2D materials are fascinating subjects. In recent years, due to the development of the low-dimensional nanostructure technology, such as chemical vapor deposition (CVD)9 and molecular beam epitaxy,10 superconductivity has been observed in ultrathin films of Mo2C9,11,12 and Nb2 C MXenes.13,14 In spite of the fact that experimental observation of superconductivity is still difficult for materials in the monolayer limit,15 in theoretical aspects, many 2D MXenes have been predicted to be superconductors. For example, the T phase Mo2C monolayer has been predicted as an electron–phonon-mediated superconductor with a critical temperature Tc of about 6 K and its electron–phonon coupling (EPC) can be enhanced by bromine absorption.16 Monolayers W2C, Sc2C, Mo2N, and Ta2N have also been predicted to be superconducting with the highest Tc of 16 K.17 Superconductivity in Nb2CT2 (T = O, S, Se, or Te) MXenes was also theoretically analyzed and the Tc can be enhanced by biaxial tensile strain.18 In addition, multigap superconductivity in Mo2 N was reported by applying strain19 and superconductivity in Mo2 N, W2N,20 and 2H-Mo2C321 can be greatly enhanced through hydrogenation. As for the CDW state, it has been theoretically analyzed in MXene W2N by comparing phonon spectra using different broadening factors of the Fermi–Dirac smearing function.17 A commensurate CDW phase was reported in V2CO2.22
Along with further development of nanotechnology, more and more high-quality and large-area MXenes should be synthesized and abundant quantum states should also be detected. In fact, large scale synthesis of 2D Mo2CTx has been achieved by selectively etching gallium from Mo2Ga2C.23,24 Moreover, a large-area and uniform Mo2C film can be grown on graphene in one step by ambient pressure CVD.25 By salt-assisted CVD, a lattice spacing of 0.23 nm, which is very close to the thickness of the monolayer T-Mo2C (2.32 Å) according to our present calculations, corresponding to the (101) plane of hexagonal Mo2C and a clean surface without carbon deposition were observed.26. Theoretically, one more energetically stable structure of Mo2C (H-Mo2C) was found and extended to many other MXenes.27,28 Growing Mo2C crystals consisting of mixed polymorphs and polytypes and explaining phase transitions by the gliding of the Mo layer along the Mo-armchair (〈10![[1 with combining macron]](https://www.rsc.org/images/entities/char_0031_0304.gif) 0〉) direction were reported by combination of experiment and theoretical simulations.29 Structurally, both T and H phases of Mo2C are constructed using a ‘Mo–C–Mo’ sandwich. For multilayer Mo2C, the possible stacking styles are –Mo2CX2–Mo2CX2 – and Mo–C–Mo–C–Mo in experiments.30–34 The former case has been investigated widely and the latter case has been less studied.
0〉) direction were reported by combination of experiment and theoretical simulations.29 Structurally, both T and H phases of Mo2C are constructed using a ‘Mo–C–Mo’ sandwich. For multilayer Mo2C, the possible stacking styles are –Mo2CX2–Mo2CX2 – and Mo–C–Mo–C–Mo in experiments.30–34 The former case has been investigated widely and the latter case has been less studied.
In the present work, based on first-principles density functional theory (DFT), we calculate the energies of the T and H phases of Mo2C and also few-atom-thick Mo–C systems (Mo3C2 and Mo3C3). The stacking of H-Mo2C is found to be always stable for different proportions of Mo![[thin space (1/6-em)]](https://www.rsc.org/images/entities/char_2009.gif) :
:![[thin space (1/6-em)]](https://www.rsc.org/images/entities/char_2009.gif) C. We then carefully calculate and investigate the electronic structures, phonon dynamics, and EPC of monolayer T(H)-Mo2C and H phase of Mo3C2 and Mo3C3. The results indicate that the Mo 4d orbitals play an important role in their metallic features. T-Mo2C exhibits stronger EPC than H-Mo2C. The Mo atomic vibrations in the low-frequency region are mainly responsible for their EPC and superconductivity. After increasing the C content, contribution of the C-2p orbitals at the Fermi energy level is increased while the superconductivity is suppressed. Fortunately, superconductivity can be modulated by applying biaxial tensile strain in H-Mo3C2 and H-Mo3C3, and H-Mo2C can be changed to a strong conventional superconductor. Upon further applying tensile strain, possible CDW states may emerge in T-Mo2C, H-Mo3C2, and H-Mo3C3.
C. We then carefully calculate and investigate the electronic structures, phonon dynamics, and EPC of monolayer T(H)-Mo2C and H phase of Mo3C2 and Mo3C3. The results indicate that the Mo 4d orbitals play an important role in their metallic features. T-Mo2C exhibits stronger EPC than H-Mo2C. The Mo atomic vibrations in the low-frequency region are mainly responsible for their EPC and superconductivity. After increasing the C content, contribution of the C-2p orbitals at the Fermi energy level is increased while the superconductivity is suppressed. Fortunately, superconductivity can be modulated by applying biaxial tensile strain in H-Mo3C2 and H-Mo3C3, and H-Mo2C can be changed to a strong conventional superconductor. Upon further applying tensile strain, possible CDW states may emerge in T-Mo2C, H-Mo3C2, and H-Mo3C3.
2 Computational details
We performed our DFT calculations using the well-established Quantum-ESPRESSO package.35 The Perdew–Burke–Ernzerhof (PBE)36 parameterized generalized-gradient approximation (GGA)37,38 was used to describe the exchange-correlation interaction. The projector-augmented wave (PAW) potentials were utilized to describe the interaction between electrons and ionic cores. To avoid coupling within the periodic images, a sufficient vacuum space of 25 Å along the z direction was adopted in the structural models. The plane-wave kinetic-energy cutoff and the energy cutoff for charge density were set as 80 and 800 Ry, respectively, which have been tested for convergence. The convergence criteria of force and energy were set as 10−6 and 10−7 Ry a.u.−1, respectively. In our calculations, the Gaussian smearing method with σ = 0.02 Ry was used. The density functional perturbation theory (DFPT)39 was used to calculate the phonon dispersions. A 12 × 12 × 1 q-point grid and a denser 48 × 48 × 1 k-point, which have been carefully tested, were set for the EPC calculation.The phonon linewidth that is extremely related to the strength of the EPC can be defined as
 | (1) |
 | (2) |
![[small xi, Greek, circumflex]](https://www.rsc.org/images/entities/char_e0b9.gif) is the phonon eigenvector, and û is atomic displacement.
is the phonon eigenvector, and û is atomic displacement.
We can obtain the EPC constant λ(ω) from the Eliashberg spectral function
 | (3) |
 | (4) |
 | (5) |
 | (6) |
The superconducting transition temperature Tc can be estimated by the Allen–Dynes-modified McMillan formula:40,41
 | (7) |
 | (8) |
3 Results and discussion
3.1 Crystal structures
Monolayers T- and H-Mo2C possess a honeycomb-like lattice with space groups of P![[3 with combining macron]](https://www.rsc.org/images/entities/char_0033_0304.gif) m1 (No. 164) and P
m1 (No. 164) and P![[6 with combining macron]](https://www.rsc.org/images/entities/char_0036_0304.gif) m2 (No. 187), respectively [see Fig. 1(a)–(d)]. Similarly, these Mo2C systems consist of three atomic layers within a hexagonal cell: two Mo layers and one C layer. Each C atom has six nearest-neighbor Mo atoms and each Mo atom has three nearest-neighbor C atoms. In a unit cell, there are two Mo atoms and one C atom, which is shown as black dashed lines in Fig. 1(a)–(d). Meanwhile, there is only one kind of Mo–C bond length with the same value in each Mo2C. Differently, the lattice constants of T- and H-Mo2C are 3.00 and 2.85 Å,27 respectively. The Mo–C bond lengths in T- and H-Mo2C are 2.09 and 2.14 Å, respectively. The perpendicular distances between two Mo layers on the different sides in T- and H-Mo2C are 2.32 and 2.72 Å, respectively. Moreover, the total energy per atom for H-Mo2C is lower by about 67 meV than that of T-Mo2C, consistent with the previous DFT results.27
m2 (No. 187), respectively [see Fig. 1(a)–(d)]. Similarly, these Mo2C systems consist of three atomic layers within a hexagonal cell: two Mo layers and one C layer. Each C atom has six nearest-neighbor Mo atoms and each Mo atom has three nearest-neighbor C atoms. In a unit cell, there are two Mo atoms and one C atom, which is shown as black dashed lines in Fig. 1(a)–(d). Meanwhile, there is only one kind of Mo–C bond length with the same value in each Mo2C. Differently, the lattice constants of T- and H-Mo2C are 3.00 and 2.85 Å,27 respectively. The Mo–C bond lengths in T- and H-Mo2C are 2.09 and 2.14 Å, respectively. The perpendicular distances between two Mo layers on the different sides in T- and H-Mo2C are 2.32 and 2.72 Å, respectively. Moreover, the total energy per atom for H-Mo2C is lower by about 67 meV than that of T-Mo2C, consistent with the previous DFT results.27
In addition to pristine T- and H-Mo2C, we also study two different proportions of Mo and C atoms: Mo3C2 and Mo3C3. We consider different stacking ways of these few-atom-thick Mo–C systems, which are shown in the ESI,†![[thin space (1/6-em)]](https://www.rsc.org/images/entities/char_2009.gif) 44 and find that the most stable configuration of these Mo–C systems are stacked by H-Mo2C, in stead of T-Mo2C. The H phase of Mo3C2 and Mo3C3 has the lowest energy and there are no imaginary phonon modes for them. The structures are shown in Fig. 1(e)–(h). Although many MXenes have been synthesized in the T phase,30–34 the functionalized derivatives of the monolayer Mo2C are energetically more stable in the H phase.28 Of course, our present results still need to be further verified via experiments.
44 and find that the most stable configuration of these Mo–C systems are stacked by H-Mo2C, in stead of T-Mo2C. The H phase of Mo3C2 and Mo3C3 has the lowest energy and there are no imaginary phonon modes for them. The structures are shown in Fig. 1(e)–(h). Although many MXenes have been synthesized in the T phase,30–34 the functionalized derivatives of the monolayer Mo2C are energetically more stable in the H phase.28 Of course, our present results still need to be further verified via experiments.
As shown in Fig. 1(e) and (f), H-Mo3C2 possesses a honeycomb lattice in the P![[6 with combining macron]](https://www.rsc.org/images/entities/char_0036_0304.gif) m2 (No. 187) space group. After structural optimizing, the perpendicular distances between adjacent Mo and C layers are 2.79 and 2.89 Å, respectively. The Mo–C bond lengths on the side and in the middle are 2.13 and 2.20 Å, respectively. As shown in Fig. 1(g) and (h), H-Mo3C3 possesses a honeycomb lattice with the P3m1 (No. 156) space group. The perpendicular distances between Mo layers from top to bottom are 2.79 and 2.87 Å, respectively. The perpendicular distances between the C layers from top to bottom are 2.83 and 2.60 Å, respectively. The Mo–C bond lengths from top to bottom are 2.14, 2.24, 2.16, 2.27, and 2.01 Å, respectively.
m2 (No. 187) space group. After structural optimizing, the perpendicular distances between adjacent Mo and C layers are 2.79 and 2.89 Å, respectively. The Mo–C bond lengths on the side and in the middle are 2.13 and 2.20 Å, respectively. As shown in Fig. 1(g) and (h), H-Mo3C3 possesses a honeycomb lattice with the P3m1 (No. 156) space group. The perpendicular distances between Mo layers from top to bottom are 2.79 and 2.87 Å, respectively. The perpendicular distances between the C layers from top to bottom are 2.83 and 2.60 Å, respectively. The Mo–C bond lengths from top to bottom are 2.14, 2.24, 2.16, 2.27, and 2.01 Å, respectively.
3.2 Electronic structure
The electronic orbital-resolved band structures of T- and H-Mo2C are plotted in Fig. 2. It is clearly seen that both the T and H phases of Mo2C are metallic, with several bands crossing the Fermi level. As shown in Fig. 2(a) and (b), there are three bands crossing the EF: one at the middle along the Γ–M and K–Γ directions, another at the middle along the Γ–M and M–K directions, and the last one near the Γ point along the K–Γ direction. Near the Fermi level, the Mo-4d orbitals are dominant with limited contributions from the C-p orbitals.16 As for H-Mo2C, there are four bands crossing the EF: two around the M point forming the hole pockets and two others around the Γ and K points forming the electron pockets. Similar to T-Mo2C, the Mo-4d orbitals are dominant near the Fermi level.28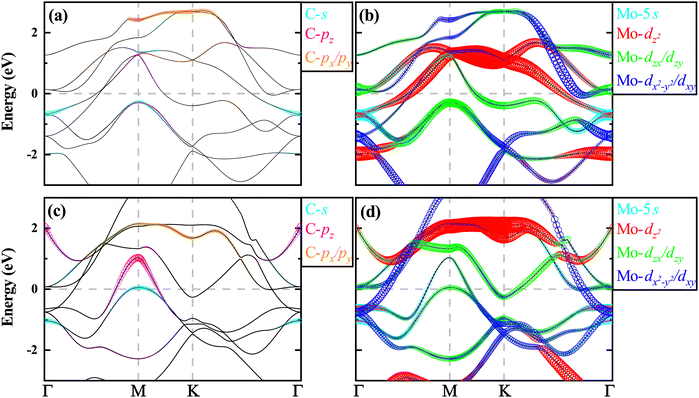 | ||
| Fig. 2 Electronic orbital-resolved band structure along high-symmetry lines of Γ–M–K–Γ for (a and b) T-Mo2C and (c and d) H-Mo2C. The Fermi level indicated by the dotted line is set at 0 eV. | ||
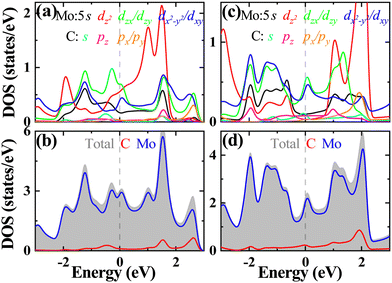
The total and projected density of states (TDOS and PDOSs) of T- and H-Mo2C are plotted in Fig. 3. Consistent with the results of the band structures, the Mo-4d orbitals are dominant near the Fermi level and play a critical role in their metalic properties.16,28 The contributions from C-sp are negligible. For T-Mo2C, the Mo-4dz2dzxdzy orbitals contribute the most, while for H-Mo2C, Mo-4dzxdzydx2−y2dxy contribute dominantly. We calculate the Fermi surfaces (FSs) of T- and H-Mo2C and plot them in the first Brillouin zone (BZ) in Fig. 4. From the FSs, one can see clearly the electronic states at the Fermi level. For T-Mo2C, there are three categories of FSs: one is the large regular Γ-centered circular electron pocket originating mainly from the Mo-4dz2 orbital; one is the M-centered hole pocket originating from Mo-4dzxdzy orbitals; and the last one is the six small circular electron pockets originating from Mo-4dxydxz orbitals along the path from K to Γ. For H-Mo2C, there are five categories of FSs: one consists of a regular Γ-centered circular electron pocket originating from Mo-4dx2−y2dxy orbitals; one is the horseshoed K-centered electron pocket originating from Mo-4dzxdzy orbitals; two hole pockets with different sizes appear around the M-point contributed mainly from C-pz and C-s orbitals; and the last one is a small horseshoed electron pocket originating from Mo-4dzxdzydx2−y2dxy along the path from K to Γ.
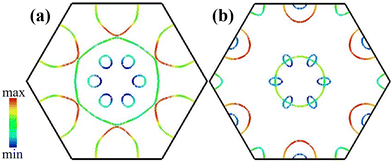 | ||
| Fig. 4 The FSs of (a) T- and (b) H-Mo2C with the colour drawn proportional to the magnitude of the Fermi velocity νF. | ||
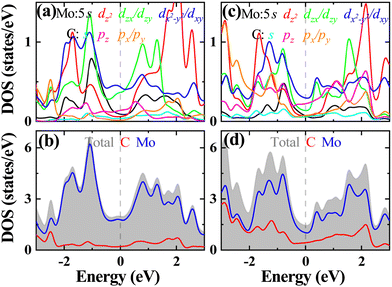
Comparing the electronic structures of H-Mo2C, the results of H-Mo3C2 and H-Mo3C3, as shown in Fig. 5–7, exhibit some similarities and also some differences. The electronic structures of H-Mo3C2 are almost same as those of H-Mo2C. Increasing the content of C only increases slightly the C-p orbital occupation at the Fermi level, mainly at the hole pockets near the M point. The electronic states near the Fermi level are still governed by the Mo-4dzxdzydx2−y2dxy orbitals. There are still four bands crossing the Fermi level. The electron pockets are still near the K point and around the Γ point. After further increasing the C content, in the case of H-Mo3C3, the metallic properties, as indicated by N(EF), are further decreased. The C-p orbitals occupation is dominant, both at the hole and electron pockets. The electronic states near the Fermi level are mainly contributed by Mo-4dzxdzydx2−y2dxy as well as the C-2pz orbitals. One hole pocket near the M point is lowered down in the valence bands and one electron pocket around the Γ point is raised up in the conduction bands. There are only two bands crossing the Fermi level. A new hole pocket or FS appears near the Γ point. The total Fermi velocity νF is decreased to some extent.
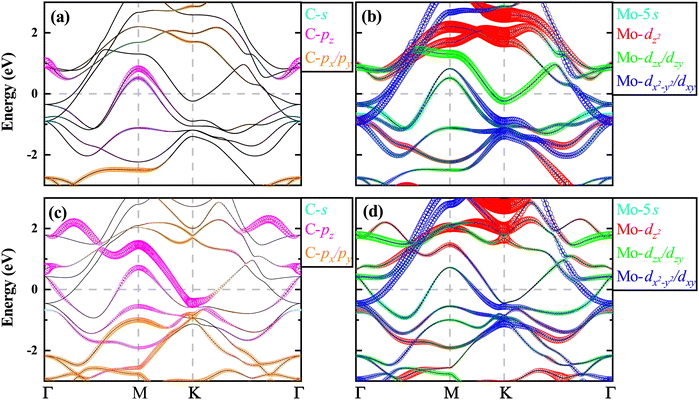 | ||
| Fig. 5 Electronic orbital-resolved band structures of (a and b) H-Mo3C2 and (c and d) H-Mo3C3 along the high-symmetry line of Γ–M–K–Γ. The Fermi level indicated by the dotted line is set to 0 eV. | ||
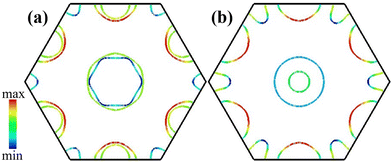 | ||
| Fig. 7 The FSs of (a) H-Mo3C2 and (b) H-Mo3C3 with the colour drawn proportional to the magnitude of the Fermi velocity νF. | ||
3.3 EPC and superconductivity
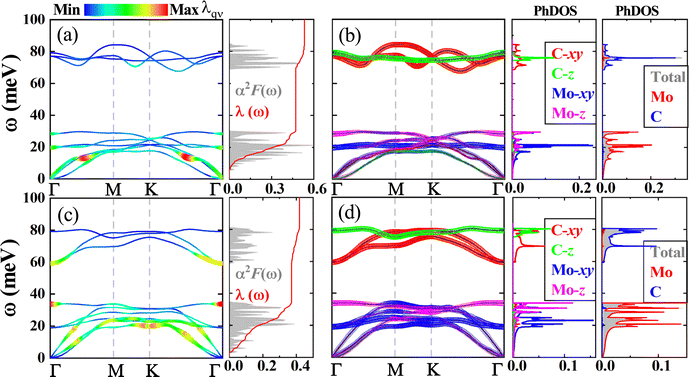
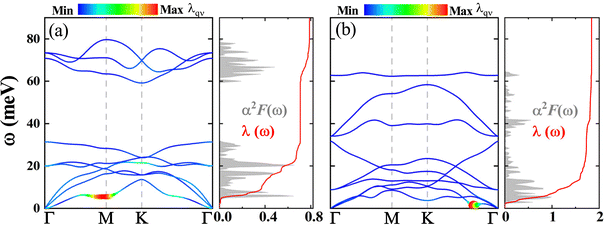
In order to investigate the EPC and superconductivity of T- and H-Mo2C, H-Mo3C2, and H-Mo3C3, we calculate their phonon dispersions, phonon density of state (PhDOS), Eliashberg spectral function α2F(ω), and λ(ω) and present the results in Fig. 8 and 9. As shown, all these 2D molybdenum carbides are dynamically stable.For T-Mo2C, the low-frequency phonons (below 30 meV), mainly associated with the Mo atomic vibrations, account for about 88% of the total EPC (λ = 0.533). These results are consistent with previous DFT work.16 Specifically, the in-plane vibrations of Mo atoms in frequency at about 20 meV are responsible for the main peak of the Eliashberg spectral function α2F(ω) and PhDOS. The out-of-plane vibrations of Mo atoms at about 29 meV also trigger a high peak of α2F(ω). The high-frequency phonons, in the frequency range of 67 to 85 meV, are mainly contributed by the C atomic vibrations. The out-of-plane vibrations of C atoms are relatively flat. Similar to Cu2Si45 and Pb-intercalated 1T-TiSe2,8 the EPC induced by high-frequency phonons is almost negligible. In addition, there is a large optic–optic phonon gap of about 37 meV between the C- and Mo-dominant vibrations, which accords well with the previously reported result of 300 cm−1.16 The highest phonon frequency, 85 meV, is larger than that of Cu2Si (52 meV),45 but still much smaller than those of β12-B (149 meV)46,47 and B2C (154 meV),48 indicating weak ionic or metallic bonding between Mo and C atoms. A total λ of about 0.5 clearly indicates that T-Mo2C is a weak conventional superconductor. Using a typical value of the effective screened Coulomb repulsion constant μ* = 0.1 as well as our calculated α2F(ω) and λ, based upon the Bardeen–Cooper–Schrieffer (BCS) theory,49 we calculate the logarithmic average frequency ωlog and the superconducting transition temperature Tc to be 235.7 and 3.66 K, respectively, which are close to the previously reported results of 250 and 5.9 K.16
As for H-Mo2C, its phonon and superconducting properties are similar with those of the T phase. The Mo atomic vibrations dominate the low-frequency phonon below 35 meV and contribute about 88% of the total EPC (λ = 0.418). Contributions from the C atomic vibrations in the high-frequency region of 59–81 meV are limited. The longitudinal optical (LO)–transverse optical (TO) splitting near the Γ point in BZ, which is related to its polarization effect, is more pronounced than that of T-Mo2C. This feature is consistent with our previous DFT results.27 Such difference originates from their different symmetry and bond lengths. By analytically solving the Allen–Dynes-modified McMillan formula derived from the microscopic theory of BCS, the Tc and ωlog are calculated to be 1.19 and 221.3 K, respectively. H-Mo2C is also a weak BCS superconductor.
After increasing the C content, from H-Mo2C to the H phase of Mo3C2 and Mo3C3, the EPC is evidently decreased to about 0.2 (see Table 1). Such small values of λ (0.244 and 0.197 for Mo3C2 and Mo3C3, respectively) make them normal metals, not superconductors. Thus, we can conclude that the superconductivity in 2D molybdenum carbides is mainly controlled by Mo atoms. Increasing the C content can effectively suppress the superconductivity. These results are helpful for experiments. Although the superconductivity has never been observed or reported in truly monolayer of Mo2C,25 only in the film form,11 we wish our present results can provide guidance for superconducting experiments in the monolayer form of 2D molybdenum carbides.26
| Comp. | Strain | N(EF) | ω log | λ | T c | Ref. |
|---|---|---|---|---|---|---|
| T-Mo2C | 0 | 19.33 | 235.7 | 0.533 | 3.66 | This work |
| 0 | — | 250 | 0.56 | <5.9 | 16 | |
| 4 | 19.76 | 147.2 | 0.789 | 6.71 | This work | |
| H-Mo2C | 0 | 14.30 | 221.3 | 0.418 | 1.19 | This work |
| 0 | — | — | 0.5 | 3.2 | 28 | |
| 10 | 22.79 | 86.8 | 1.845 | 11.79 | This work | |
| H-Mo3C2 | 0 | 14.17 | 310.7 | 0.244 | 0.01 | This work |
| 11 | 20.00 | 162.2 | 0.585 | 3.43 | This work | |
| H-Mo3C3 | 0 | 10.45 | 415.7 | 0.197 | 0 | This work |
| 8 | 22.04 | 239.8 | 0.606 | 5.66 | This work |
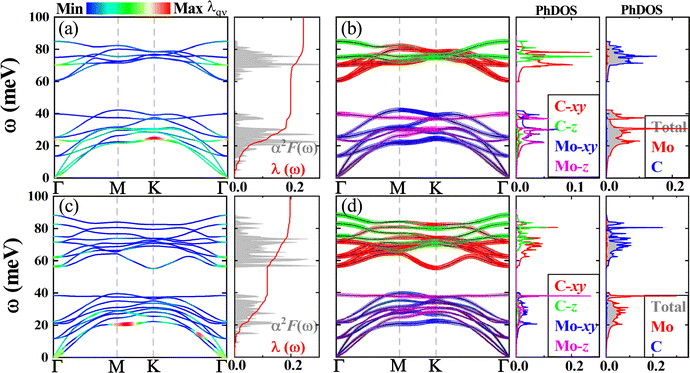
As indicated in Fig. 9, the main contributions to the EPC for H-Mo3C2 are still from Mo atomic vibrations, while for H-Mo3C3 the C atomic contributions cannot be neglected. The highest phonon frequencies are still in the level of 80–90 meV. The optic–optic phonon gap is decreased from 37 meV to about 17.7 (15.2) meV for H-Mo3C2 (H-Mo3C3). For H-Mo3C2, the Tc and ωlog are calculated to be 0.01 and 310.7 K, respectively, while for H-Mo3C3 they are 0 and 415.7 K, respectively. We find that increasing the C content can increase ωlog. It is understandable that light element would generate high phonon frequencies and enable large values of ωlog.50
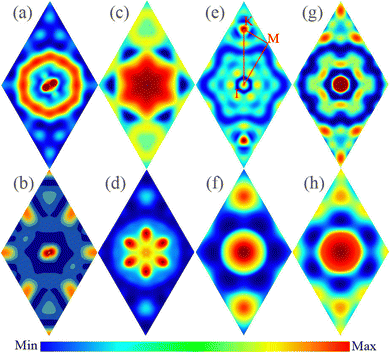
As indicated by the λqν-weighted phonon spectra in Fig. 8 and 9 as well as the integrated EPC, which is  at a given q, distributions in the plane of qz = 0 in Fig. 10 for our studied four 2D MoxCy, we can clearly analyze the specific characteristic of EPC and its relation with superconductivity. For T-Mo2C, the largest EPC region appears at the half way from Γ to the BZ boundary, forming a circle. Such large values of EPC are mainly contributed by the in-plane acoustic vibrations of Mo atoms. The second largest EPC region is around the Γ point, mainly from Mo vibrations in low-frequency acoustic and optic phonons. As for H-Mo2C, the largest EPC region is around the Γ point, mainly from the out-of-plane optic phonon vibrations of Mo atoms. A snowflake-like distribution of the large EPC is formed in 2D BZ. Only near the M point, the EPC is small. For H-Mo3C2 and H-Mo3C3, the large EPC regions in the BZ are obviously small, when comparing with those of the T(H)-Mo2C. The largest EPC region appears at the K point for H-Mo3C2 and around Γ and M points for H-Mo3C3.
3.4 Strain engineering
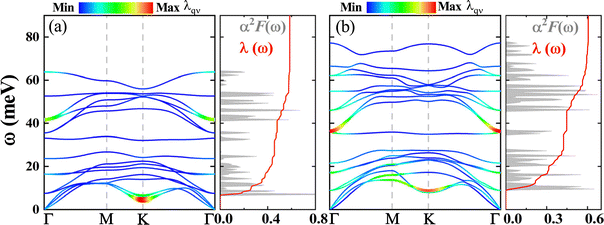
Inspired by previous successes in modulating the electronic properties as well as the superconductivity of 2D systems by strain engineering,47,51–57 also considering their experimental synthesis on different substrates,45 here we also want to investigate their effects on the superconducting related physical quantities of our four studied 2D MoxCy. By changing the lattice parameters, we apply biaxial tensile strain ε on them, where ε is defined as (a − a0)/a0 × 100%. Here a0 and a are the lattice constants of the unstrained and strained structures.The maximal biaxial tensile strains ε for T-Mo2C, H-Mo2C, H-Mo3C2, and H-Mo3C3 are 4%, 10%, 11%, and 8%, respectively, over which they are stretched to dynamically unstable. We present their corresponding phonon dispersions, α2F(ω), and λ(ω) in Fig. 11 and 12. Applying biaxial tensile strain can weaken the atomic force constant and soften the phonon modes.53,54 In our present study, we also find soft acoustic phonon modes in T-Mo2C (around M point), H-Mo2C (around  Γ K), H-Mo3C2 (around K point), and H-Mo3C3 (around K point). The soft mode for T(H)-Mo2C is in its out-of-plane flexural (ZA) acoustic branch, while for H-Mo3C2 and H-Mo3C3 it is in in-plane transverse acoustic (TA) and ZA branches as well as the TO modes at around 40 meV and near Γ point. The full phonon spectra are wholly softened. As shown, the highest phonon frequencies of H-Mo2C and H-Mo3C2 are lowered down to around 62 meV. The two high-frequency TO branches of H-Mo2C are greatly lowered.
The softening of phonon is beneficial to increasing the EPC λ and Tc. As shown, the peaks of α2F(ω) are red shifted and low-frequency proportion becomes more important. The EPC is redistributed in BZ (see Fig. 10). The large values of EPC are still mainly in the low-frequency region. At ε = 4%, the λ and Tc of T-Mo2C are enhanced to 0.789 and 6.71 K, respectively, although ωlog is decreased to 147.2 K due to the softening of phonons. The Tc is almost doubled by biaxial tensile strain. As for H-Mo2C, since the maximal biaxial tensile strain ε is up to 10%, its λ and Tc are greatly increased up to 1.845 and 11.79 K, respectively, making it a strong BCS superconductor. Its ωlog is lowered down to 86.8 K. Such evident modulations of the superconducting-related properties by stain engineering have also been reported in graphene,53 monolayer h-BN,54 aluminum-deposited graphene AlC8,56 and HPC3.57 For H-Mo3C2 (H-Mo3C3), its λ and Tc are increased to 0.585 (0.606) and 3.43 (5.66) K, respectively, at a strain of 11% (8%). They are transformed from normal metals to weak BCS superconductors. Their ωlog are decreased to 162.2 and 239.8 K, respectively. The detail data can be found in Table 1. In addition, we show the strain-dependent behaviors of ωlog, N(EF), Tc, and λ in Fig. S3 in the ESI.†![[thin space (1/6-em)]](https://www.rsc.org/images/entities/char_2009.gif) 44 As shown, N(EF), Tc, and λ increase steadily under biaxial tensile strains, while only ωlog exhibits decreasing behavior. H-Mo2C can only be tuned as a strong BCS superconductor at ε = 10%, lower strains which all the λ are smaller than 1. As for H-Mo3C2 and H-Mo3C3, they can be tuned from normal metals to superconductors at ε beyond 6% and 3%, respectively. These strain-dependent behaviors of the superconducting-related properties clearly indicate that Tc is tightly related to EPC and N(EF). In order to increasing Tc, one must increase N(EF) first, such as modulating the Fermi level to a van Hove singularity.58
44 As shown, N(EF), Tc, and λ increase steadily under biaxial tensile strains, while only ωlog exhibits decreasing behavior. H-Mo2C can only be tuned as a strong BCS superconductor at ε = 10%, lower strains which all the λ are smaller than 1. As for H-Mo3C2 and H-Mo3C3, they can be tuned from normal metals to superconductors at ε beyond 6% and 3%, respectively. These strain-dependent behaviors of the superconducting-related properties clearly indicate that Tc is tightly related to EPC and N(EF). In order to increasing Tc, one must increase N(EF) first, such as modulating the Fermi level to a van Hove singularity.58
By further applying biaxial tensile strains ε beyond their maximal amplitudes, H-Mo2C becomes dynamically unstable, while T-Mo2C, H-Mo3C2, and H-Mo3C3 exhibit characteristics of CDW.44,59 As shown in Fig. S4 in the ESI,†![[thin space (1/6-em)]](https://www.rsc.org/images/entities/char_2009.gif) 44 similar to the normal structure of the monolayer 1T-TiSe2,8 an imaginary phonon mode at vector qM for the acoustic mode is observed for T-Mo2C under ε = 5%. Thus, the superlattice of its CDW state may similar to that of 1T-TiSe2. Similarly, unstable phonon mode at qM and possible CDW have also been reported and discussed in T phase MXene W2N.17 As for H-Mo3C2 and H-Mo3C3, their imaginary phonon mode is at the vector of qK. The CDW superlattices of them may be more complicated than that of 1T-TiSe2.60 We may study carefully the CDW states of these 2D MoxCy in our future studies.
44 similar to the normal structure of the monolayer 1T-TiSe2,8 an imaginary phonon mode at vector qM for the acoustic mode is observed for T-Mo2C under ε = 5%. Thus, the superlattice of its CDW state may similar to that of 1T-TiSe2. Similarly, unstable phonon mode at qM and possible CDW have also been reported and discussed in T phase MXene W2N.17 As for H-Mo3C2 and H-Mo3C3, their imaginary phonon mode is at the vector of qK. The CDW superlattices of them may be more complicated than that of 1T-TiSe2.60 We may study carefully the CDW states of these 2D MoxCy in our future studies.
4 Conclusion
In summary, we have calculated the electronic structures, phonon dispersions, and EPC of the T and H phases of monolayer Mo2C and have checked the stacking style of the 2D Mo–C systems in Mo:C ratios of 3![[thin space (1/6-em)]](https://www.rsc.org/images/entities/char_2009.gif) :
:![[thin space (1/6-em)]](https://www.rsc.org/images/entities/char_2009.gif) 2 and 3
2 and 3![[thin space (1/6-em)]](https://www.rsc.org/images/entities/char_2009.gif) :
:![[thin space (1/6-em)]](https://www.rsc.org/images/entities/char_2009.gif) 3. We find that the most stable configurations of the Mo–C systems are stacked by the component of H-Mo2C, which is energetically more stable than T-Mo2C. Although many MXenes have been synthesized in the T phase,30–34 the H phase of 2D MoxCy may be synthesized in the future. According to our calculations, similar to our recent study of the MoSH monolayer61 and MoP2,62 the Mo 4d orbitals are dominant at the Fermi level, while the C2p orbitals are negligible for most our studied 2D molybdenum carbides. Only in H-Mo3C3, when the C content is increased, the C 2pz orbital also contributes dominantly. From Mo2C to Mo3C3, the metallic properties are weakened and the superconductivity is suppressed by increasing the C content. The EPC in these systems is mainly controlled by the Mo atomic vibrations, in the low-frequency region. The pristine T(H)-Mo2C is a weak conventional superconductor while pristine H-Mo3C2 and H-Mo3C3 are normal metals. By applying biaxial tensile strain, H-Mo2C can be modulated to a strong EPC superconductor with a large λ of about 1.85 and H-Mo3C2 and H-Mo3C3 can be changed to weak BCS superconductors. By further applying a biaxial tensile strain, CDW states may appear in T-Mo2C, H-Mo3C2, and H-Mo3C3. Our present study can provide guidance for superconducting experiments in the monolayer form of 2D molybdenum carbides and is also beneficial for further theoretical and experimental studies of electronic structures and superconductivity in 2D forms of metal carbides.
3. We find that the most stable configurations of the Mo–C systems are stacked by the component of H-Mo2C, which is energetically more stable than T-Mo2C. Although many MXenes have been synthesized in the T phase,30–34 the H phase of 2D MoxCy may be synthesized in the future. According to our calculations, similar to our recent study of the MoSH monolayer61 and MoP2,62 the Mo 4d orbitals are dominant at the Fermi level, while the C2p orbitals are negligible for most our studied 2D molybdenum carbides. Only in H-Mo3C3, when the C content is increased, the C 2pz orbital also contributes dominantly. From Mo2C to Mo3C3, the metallic properties are weakened and the superconductivity is suppressed by increasing the C content. The EPC in these systems is mainly controlled by the Mo atomic vibrations, in the low-frequency region. The pristine T(H)-Mo2C is a weak conventional superconductor while pristine H-Mo3C2 and H-Mo3C3 are normal metals. By applying biaxial tensile strain, H-Mo2C can be modulated to a strong EPC superconductor with a large λ of about 1.85 and H-Mo3C2 and H-Mo3C3 can be changed to weak BCS superconductors. By further applying a biaxial tensile strain, CDW states may appear in T-Mo2C, H-Mo3C2, and H-Mo3C3. Our present study can provide guidance for superconducting experiments in the monolayer form of 2D molybdenum carbides and is also beneficial for further theoretical and experimental studies of electronic structures and superconductivity in 2D forms of metal carbides.
Conflicts of interest
There are no conflicts to declare.Acknowledgements
This work was supported by the National Natural Science Foundation of China (Grant No. 12074213, 12074381, 11574108), the Major Basic Program of Natural Science Foundation of Shandong Province (Grant No. ZR2021ZD01), Guangdong Basic and Applied Basic Research Foundation (Grant No. 2021A1515110587), and the Project of Introduction and Cultivation for Young Innovative Talents in Colleges and Universities of Shandong Province.Notes and references
- K. S. Novoselov, A. K. Geim, S. V. Morozov, D. Jiang, Y. Zhang, S. V. Dubonos, I. V. Grigorieva and A. A. Firsov, Science, 2004, 306, 666–669 CrossRef CAS PubMed.
- K. S. Novoselov, D. Jiang, F. Schedin, T. J. Booth, V. V. Khotkevich, S. V. Morozov and A. K. Geim, Proc. Natl. Acad. Sci. U. S. A., 2005, 102, 10451–10453 CrossRef CAS PubMed.
- M. Naguib, M. Kurtoglu, V. Presser, J. Lu, J. Niu, M. Heon, L. Hultman, Y. Gogotsi and M. W. Barsoum, Adv. Mater., 2011, 23, 4248–4253 CrossRef CAS PubMed.
- B. Anasori, M. R. Lukatskaya and Y. Gogotsi, Nat. Rev. Mater., 2017, 2, 16098 CrossRef CAS.
- F. Shahzad, M. Alhabeb, C. B. Hatter, B. Anasori, S. M. Hong, C. M. Koo and Y. Gogotsi, Science, 2016, 353, 1137–1140 CrossRef CAS PubMed.
- J. Peng, X. Chen, W.-J. Ong, X. Zhao and N. Li, Chem, 2019, 5, 18–50 CAS.
- X.-H. Tu, P.-F. Liu, W. Yin, J.-R. Zhang, P. Zhang and B.-T. Wang, Mater. Today Phys., 2022, 24, 100674 CrossRef CAS.
- B.-T. Wang, P.-F. Liu, J.-J. Zheng, W. Yin and F. Wang, Phys. Rev. B, 2018, 98, 014514 CrossRef CAS.
- D. Geng, X. Zhao, L. Li, P. Song, B. Tian, W. Liu, J. Chen, D. Shi, M. Lin, W. Zhou and K. P. Loh, 2D Mater., 2016, 4, 011012 CrossRef.
- K. Chang, P. Deng, T. Zhang, H.-C. Lin, K. Zhao, S.-H. Ji, L.-L. Wang, K. He, X.-C. Ma, X. Chen and Q.-K. Xue, EPL, 2015, 109, 28003 CrossRef.
- C. Xu, L. Wang, Z. Liu, L. Chen, J. Guo, N. Kang, X.-L. Ma, H.-M. Cheng and W. Ren, Nat. Mater., 2015, 14, 1135–1141 CrossRef CAS PubMed.
- L. Wang, C. Xu, Z. Liu, L. Chen, X. Ma, H.-M. Cheng, W. Ren and N. Kang, ACS Nano, 2016, 10, 4504–4510 CrossRef CAS PubMed.
- V. Kamysbayev, A. S. Filatov, H. Hu, X. Rui, F. Lagunas, D. Wang, R. F. Klie and D. V. Talapin, Science, 2020, 369, 979–983 CrossRef CAS PubMed.
- K. Wang, H. Jin, H. Li, Z. Mao, L. Tang, D. Huang, J.-H. Liao and J. Zhang, Surf. Interfaces, 2022, 29, 101711 CrossRef CAS.
- M. Liao, Y. Zang, Z. Guan, H. Li, Y. Gong, K. Zhu, X.-P. Hu, D. Zhang, Y. Xu, Y.-Y. Wang, K. He, X.-C. Ma, S.-C. Zhang and Q.-K. Xue, Nat. Phys., 2018, 14, 344–348 Search PubMed.
- J.-J. Zhang and S. Dong, J. Chem. Phys., 2017, 146, 034705 CrossRef PubMed.
- J. Bekaert, C. Sevik and M. V. Milošević, Nanoscale, 2020, 12, 17354–17361 RSC.
- S.-Y. Wang, C. Pan, H. Tang, H.-Y. Wu, G.-Y. Shi, K. Cao, H. Jiang, Y.-H. Su, C. Zhang, K.-M. Ho and C.-Z. Wang, J. Phys. Chem. C, 2022, 126, 3727–3735 CrossRef CAS.
- Z. S. Pereira, G. M. Faccin and E. Z. da Silva, Nanoscale, 2022, 14, 8594–8600 RSC.
- J. Bekaert, C. Sevik and M. V. Milošević, Nanoscale, 2022, 14, 9918–9924 RSC.
- N. Jiao, H.-D. Liu, L. Yang, Y.-P. Li, M. Zheng, H.-Y. Lu and P. Zhang, Europhys. Lett., 2022, 138, 46002 CrossRef.
- S. Bae, Y.-G. Kang, M. Khazaei, K. Ohno, Y.-H. Kim, M. Han, K. Chang and H. Raebiger, Mater. Today Adv., 2021, 9, 100118 CrossRef CAS.
- R. Meshkian, L.-Å. Näslund, J. Halim, J. Lu, M. W. Barsoum and J. Rosen, Scr. Mater., 2015, 108, 147–150 CrossRef CAS.
- J. Halim, S. Kota, M. R. Lukatskaya, M. Naguib, M.-Q. Zhao, E. J. Moon, J. Pitock, J. Nanda, S. J. May, Y. Gogotsi and M. W. Barsoum, Adv. Funct. Mater., 2016, 26, 3118–3127 CrossRef CAS.
- D. Geng, X. Zhao, Z. Chen, W. Sun, W. Fu, J. Chen, W. Liu, W. Zhou and K. P. Loh, Adv. Mater., 2017, 29, 1700072 CrossRef PubMed.
- M. Qiang, X. Zhang, H. Song, C. Pi, X. Wang, B. Gao, Y. Zheng, X. Peng, P. K. Chu and K. Huo, Carbon, 2022, 197, 238–245 CrossRef CAS.
- W. Sun, Y. Li, B. Wang, X. Jiang, M. I. Katsnelson, P. Korzhavyi, O. Eriksson and I. D. Marco, Nanoscale, 2016, 8, 15753–15762 RSC.
- J. Lei, A. Kutana and B. I. Yakobson, J. Mater. Chem. C, 2017, 5, 3438–3444 RSC.
- X. Zhao, W. Sun, D. Geng, W. Fu, J. Dan, Y. Xie, P. R. C. Kent, W. Zhou, S. J. Pennycook and K. P. Loh, Adv. Mater., 2019, 31, 1808343 CrossRef PubMed.
- L. Gao, C. Li, W. Huang, S. Mei, H. Lin, Q. Ou, Y. Zhang, J. Guo, F. Zhang, S. Xu and H. Zhang, Chem. Mater., 2020, 32, 1703–1747 CrossRef CAS.
- C. J. Zhang, Y. Ma, X. Zhang, S. Abdolhosseinzadeh, H. Sheng, W. Lan, A. Pakdel, J. Heier and F. Nüesch, Energy Environ. Mater., 2020, 3, 29–55 CrossRef CAS.
- F. Ming, H. Liang, G. Huang, Z. Bayhan and H. N. Alshareef, Adv. Mater., 2020, 33, 2004039 CrossRef PubMed.
- J. Chen, Y. Ding, D. Yan, J. Huang and S. Peng, SusMat, 2022, 2, 293–318 CrossRef.
- X. Wu, S. Xiao, Y. Long, T. Ma, W. Shao, S. Cao, X. Xiang, L. Ma, L. Qiu, C. Cheng and C. Zhao, Small, 2022, 18, 2105831 CrossRef CAS PubMed.
- P. Giannozzi, S. Baroni, N. Bonini, M. Calandra, R. Car, C. Cavazzoni, D. Ceresoli, G. L. Chiarotti, M. Cococcioni, I. Dabo, A. D. Corso, S. de Gironcoli, S. Fabris, G. Fratesi, R. Gebauer, U. Gerstmann, C. Gougoussis, A. Kokalj, M. Lazzeri, L. Martin-Samos, N. Marzari, F. Mauri, R. Mazzarello, S. Paolini, A. Pasquarello, L. Paulatto, C. Sbraccia, S. Scandolo, G. Sclauzero, A. P. Seitsonen, A. Smogunov, P. Umari and R. M. Wentzcovitch, J. Phys.: Condens. Matter, 2009, 21, 395502 CrossRef PubMed.
- J. P. Perdew, K. Burke and M. Ernzerhof, Phys. Rev. Lett., 1996, 77, 3865–3868 CrossRef CAS PubMed.
- P. E. Blöchl, Phys. Rev. B: Condens. Matter Mater. Phys., 1994, 50, 17953–17979 CrossRef PubMed.
- P. E. Blöchl, O. Jepsen and O. K. Andersen, Phys. Rev. B: Condens. Matter Mater. Phys., 1994, 49, 16223–16233 CrossRef PubMed.
- S. Baroni, S. de Gironcoli, A. Dal Corso and P. Giannozzi, Rev. Mod. Phys., 2001, 73, 515–562 CrossRef CAS.
- R. Dynes, Solid State Commun., 1972, 10, 615–618 CrossRef CAS.
- P. B. Allen and R. C. Dynes, Phys. Rev. B: Solid State, 1975, 12, 905–922 CrossRef CAS.
- P. B. Allen and B. Mitrović, Solid State Physics, Elsevier, 1983, pp. 1–92 Search PubMed.
- J. Kortus, I. I. Mazin, K. D. Belashchenko, V. P. Antropov and L. L. Boyer, Phys. Rev. Lett., 2001, 86, 4656–4659 CrossRef CAS PubMed.
- See ESI† at xxx for (I) the structures and energy comparison of Mo3C2 and Mo3C3 with different configurations, (II) superconductive parameters of N(EF), ωlog, λ, and Tc under different biaxial tensile strains, and (III) phonon spectra of 2D MoxCy at and beyond the maximal biaxial tensile strains.
- L. Yan, P.-F. Liu, T. Bo, J. Zhang, M.-H. Tang, Y.-G. Xiao and B.-T. Wang, J. Mater. Chem. C, 2019, 7, 10926–10932 RSC.
- M. Gao, Q.-Z. Li, X.-W. Yan and J. Wang, Phys. Rev. B, 2017, 95, 024505 CrossRef.
- C. Cheng, J.-T. Sun, H. Liu, H.-X. Fu, J. Zhang, X.-R. Chen and S. Meng, 2D Mater., 2017, 4, 025032 CrossRef.
- J. Dai, Z. Li, J. Yang and J. Hou, Nanoscale, 2012, 4, 3032 RSC.
- J. Bardeen, L. N. Cooper and J. R. Schrieffer, Phys. Rev., 1957, 108, 1175–1204 CrossRef CAS.
- D. Duan, Y. Liu, Y. Ma, Z. Shao, B. Liu and T. Cui, Natl. Sci. Rev., 2016, 4, 121–135 CrossRef.
- G. Li, Y. Zhao, S. Zeng, M. Zulfiqar and J. Ni, J. Phys. Chem. C, 2018, 122, 16916–16924 CrossRef CAS.
- D. Campi, S. Kumari and N. Marzari, Nano Lett., 2021, 21, 3435–3442 CrossRef CAS PubMed.
- C. Si, Z. Liu, W. Duan and F. Liu, Phys. Rev. Lett., 2013, 111, 196802 CrossRef PubMed.
- X.-T. Jin, X.-W. Yan and M. Gao, Phys. Rev. B, 2020, 101, 134518 CrossRef CAS.
- T. Bo, P.-F. Liu, L. Yan and B.-T. Wang, Phys. Rev. Materials, 2020, 4, 114802 CrossRef CAS.
- H.-Y. Lu, Y. Yang, L. Hao, W.-S. Wang, L. Geng, M. Zheng, Y. Li, N. Jiao, P. Zhang and C. S. Ting, Phys. Rev. B, 2020, 101, 214514 CrossRef CAS.
- Y.-P. Li, L. Yang, H.-D. Liu, N. Jiao, M.-Y. Ni, N. Hao, H.-Y. Lu and P. Zhang, Phys. Chem. Chem. Phys., 2022, 24, 9256–9262 RSC.
- E. R. Margine and F. Giustino, Phys. Rev. B: Condens. Matter Mater. Phys., 2014, 90, 014518 CrossRef CAS.
- J.-G. Si, W.-J. Lu, Y.-P. Sun, P.-F. Liu and B.-T. Wang, Phys. Rev. B, 2022, 105, 024517 CrossRef CAS.
- P. Chen, Y. H. Chan, X. Y. Fang, Y. Zhang, M. Y. Chou, S. K. Mo, Z. Hussain, A. V. Fedorov and T. C. Chiang, Nat. Commun., 2015, 6, 8943 CrossRef CAS PubMed.
- P.-F. Liu, F. Zheng, J. Li, J.-G. Si, L. Wei, J. Zhang and B.-T. Wang, Phys. Rev. B, 2022, 105, 245420 CrossRef CAS.
- X.-H. Tu, T. Bo, P.-F. Liu, W. Yin, N. Hao and B.-T. Wang, Phys. Chem. Chem. Phys., 2022, 24, 7893–7900 RSC.
Footnote |
| † Electronic supplementary information (ESI) available: (I) The structures and energy comparison of Mo3C2 and Mo3C3 with different configurations, (II) superconductive parameters of N(EF), ωlog, λ, and Tc under different biaxial tensile strains, and (III) phonon spectra of 2D MoxCy at and beyond the maximal biaxial tensile strain. See DOI: https://doi.org/10.1039/d2cp04306h |
| This journal is © the Owner Societies 2023 |


