 Open Access Article
Creative Commons Attribution 3.0 Unported Licence
Discovering atomistic pathways for supply of metal atoms from methyl-based precursors to graphene surface†
Davide G.
Sangiovanni
 a,
Ricardo
Faccio
 b,
Gueorgui Kostov
Gueorguiev
 a and
Anelia
Kakanakova-Georgieva
 *a
*a
aDepartment of Physics, Chemistry and Biology (IFM), Linköping University, 581 83, Linköping, Sweden. E-mail: anelia.kakanakova@liu.se
bÁrea Física & Centro Nanomat, DETEMA, Facultad de Química, Universidad de la República, Av. Gral. Flores 2124, C.P., 11800, Montevideo, Uruguay
First published on 1st December 2022
Abstract
Conceptual 2D group III nitrides and oxides (e.g., 2D InN and 2D InO) in heterostructures with graphene have been realized by metal–organic chemical vapor deposition (MOCVD). MOCVD is expected to bring forth the same impact in the advancement of 2D semiconductor materials as in the fabrication of established semiconductor materials and device heterostructures. MOCVD employs metal–organic precursors such as trimethyl-indium, -gallium, and -aluminum, with (strong) metal–carbon bonds. Mechanisms that regulate MOCVD processes at the atomic scale are largely unknown. Here, we employ density-functional molecular dynamics – accounting for van der Waals interactions – to identify the reaction pathways responsible for dissociation of the trimethylindium (TMIn) precursor in the gas phase as well as on top-layer and zero-layer graphene. The simulations reveal how collisions with hydrogen molecules, intramolecular or surface-mediated proton transfer, and direct TMIn/graphene reactions assist TMIn transformations, which ultimately enables delivery of In monomers or InH and CH3In admolecules, on graphene. This work provides knowledge for understanding the nucleation and intercalation mechanisms at the atomic scale and for carrying out epitaxial growth of 2D materials and graphene heterostructures.
Introduction
Exploration and development of materials exhibiting new compositions and/or peculiar structural and electronic properties in ever-scaling-down dimensionality undergoes continuous improvements. Group III nitrides (AlN, GaN, and InN), for example, are some of the most viable semiconductor material systems for tunable optoelectronic devices. Thin (multi)layers of group III nitrides in a wurtzite structure have been intensively developed using metal–organic chemical vapor deposition (MOCVD) processes leading to “the invention of efficient blue light-emitting diodes which has enabled bright and energy-saving white light sources” (The Nobel Prize in Physics, 2014).1 Group III nitrides are being further researched at the nanoscale. The electronic and exitonic properties of various 2D and bulk crystals of InN have been compared based on density functional theory calculations.2 It has been predicted using first-principles calculations that the band gap of 2D group III nitrides in a honeycomb monolayer structure across the compositional range of BN, AlN, GaN, InN, and TlN can be tuned from the UV to the IR region, and even further to the THz frequency range.3,4 2D InGaN and InTlN have further been suggested for efficient light harvesting thus boosting opportunities for photovoltaic applications.3 It is to be noted that InN, in its 2D sp2-bonded honeycomb monolayer structure and also in its sp3-bonded wurtzite bulk crystal, exhibits the smallest effective electron mass among the group III nitrides.3 In general, the small effective electron mass is related to the high electron mobility and saturation drift velocity which are properties of crucial importance for enabling evermore high-speed and high-frequency performance of (nano)electronic devices. Similar prospects are being held by 2D InO which – among a group of several monolayer metal oxides of various atomic structures – has also been predicted using first-principles calculations to exhibit ultrahigh electron mobility.5 It is noteworthy that by now, both 2D InN6 and the 2D InO7 have crossed over the realm of predictive first-principles calculations to their material realization in confinement at graphene/SiC interfaces via MOCVD. Epitaxial graphene has also been used to investigate the realization of InN-based van der Waals structures via MOCVD processes.8MOCVD employs metal–organic precursors such as trimethyl-indium, -gallium, and -aluminum, which contain (strong) metal–carbon bonds. Therefore, it is of crucial importance to identify the mechanisms responsible for metal–organic precursor/graphene reactions which can deliver group-III adatoms or group-III-containing admolecules on the graphene surface from common gas-phase methyl-based precursors. Atomistic pathways that control MOCVD processes are largely unknown.
In this work, we use ab initio molecular dynamics (AIMD) accounting for van der Waals corrections to simulate trimethylindium (CH3)3In (or TMIn)/graphene reactions and to gain knowledge about the reaction dynamics for supply of indium (In) atoms to the graphene surface. We extend a model which incorporates SiC-supported graphene which is of relevance for understanding the reactions of MOCVD precursors on regions of zero (buffer-layer) graphene directly exposed to the gas phase. We perform, in addition, a comparison with our recent ab initio molecular dynamics simulations which have revealed atomistic and electronic mechanisms that govern the surface reactions of trimethylaluminum (CH3)3Al (or TMAl) with defect-free self-standing graphene and produce isolated Al adatoms.9 We note that other classical molecular dynamics simulations supported by experiments indicate plausible atomistic pathways for Ga atom intercalation across extended defects in graphene.10
Methods and computational details
Born–Oppenheimer ab initio molecular dynamics simulations are carried out with the VASP code11 using the local density approximation (LDA)12 and the projector augmented wave13 method. The approximation proposed by Grimme14 is employed to describe van der Waals interactions. At each AIMD time step (0.1 fs), the total energy is evaluated to an accuracy of 10−5 eV per supercell using Γ-point sampling of the reciprocal space and a planewave energy cutoff of 300 eV. kBT Gaussian smearing of electronic states is used to mimic the electronic temperature.We have performed a set of investigations of TMIn + 9H2 gas molecules impinging on a graphene/SiC substrate at 3500 K. The use of high temperatures is justified by the relatively low chemical reactivity of TMIn and by the fact that Born–Oppenheimer molecular dynamics is highly computationally intensive. However, the structural stability of graphene at these temperatures is ensured throughout our AIMD runs [see Fig. S1 in the ESI†]. Although the temperature of our simulations is much higher than in MOCVD (≈500–1800 K), the AIMD data may also serve as a training set for machine-learning interatomic potentials (MLIP). In forthcoming studies, we intend to use MLIP-MD to collect statistics for the rate of competing reactions at actual experimental temperatures. Gaining statistical confidence for chemical reaction rates via direct AIMD simulations would be unfeasible.
In preliminary AIMD simulations carried out at temperatures of 3500 K and above, we also tested whether the generalized gradient approximation of Perdew–Burke–Ernzerhof15 would indicate higher reaction rates. For a total simulation time of ≈30 ps, we recorded no TMIn/graphene reaction. In view of our results, discussed in the following sections, this observation supports the fact that the LDA approximation does not overbind molecules relevant for the present study. In addition, AIMD/GGA simulations show qualitatively the same behavior of TMIn on graphene, with molecular physisorption mediated by the In atom. Complementary 2 ps-long AIMD/GGA simulations are also carried out to specifically verify the stability of InH gas molecules at 3500 K.
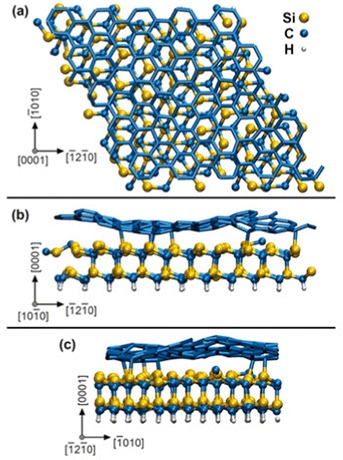
In our AIMD supercell model, the SiC substrate is passivated underneath by static H atoms and bonded on top to a zero-layer graphene – known also as a buffer layer or an interfacial layer – which is a result to the formation mechanism of graphene by thermal decomposition of SiC.16 The initial surface slab 4√3 × 4√3 R30° graphene/SiC, illustrated in Fig. 1, is obtained by full structural relaxation at 0 K via density-functional theory (DFT) using total-energy and force convergence criteria of 10−5 eV per supercell and 0.01 eV Å−1, respectively. The graphene/SiC slab is formed of 246 C, 96 Si, and 48 H atoms and has a lateral size of 2.47 nm. Although our SiC slab is not sufficiently thick to distinguish between hexagonal or cubic stacking sequences, we will refer to this layer as SiC (0001), which is indicative of a typical surface termination of hexagonal SiC used in MOCVD experiments. Our simulation box (graphene/SiC substrate + gas molecules (9H2 and (CH3)3In) contains 421 atoms in total.
The methods used to simulate TMAl reactions on defect-free graphene are detailed in ref. 9. An analogous procedure is employed here to simulate the TMIn precursor reactions on free-standing graphene as well as on graphene/SiC substrates. First, the geometries of chemical precursors are optimized via 0 kelvin DFT energy minimization. Assigned random velocities to each atom (translational kinetic energy corresponding to an initial temperature of 300 K), the dynamics of the precursors is followed for ≈2 ps using microcanonical NVE sampling and 0.1 fs timesteps. In parallel (separate simulations), the graphene/SiC substrate is equilibrated at 3500 K using NVT sampling (Nose–Hoover thermostat), while retaining static H atoms that passivate the bottom SiC layer. Hence, the precursor internal atomic positions and velocities, as well as the positions and velocities of the graphene/SiC slab obtained from initial AIMD runs, are used as input for AIMD simulations of MOCVD processes.
AIMD simulations of MOCVD start with precursor molecules placed at random positions on a (0001) plane at a vertical distance midway between substrate replicas along [0001] (see crystallographic directions in Fig. 1). Given that input-velocities are taken from NVE simulations of molecules in a vacuum, the gas precursors initially have zero mass-centrum drift. Therefore, during the initial 10 fs of AIMD/MOCVD simulations, the precursors are accelerated toward the surface using constant gentle forces (10−2, 10−3 and 10−4 eV Å−1 for In, C and H atoms, respectively). This feature is implemented in in-house modified VASP code.14 Then, the forces are removed, and the dynamics of the gas molecules is integrated on an NVE scheme, while the substrate is subject to thermostatting at 3500 K. The possibility of combining NVE (for precursors) and NVT (for graphene/SiC) sampling within the same AIMD simulation is implemented in our modified version of VASP.17 Directly coupling the internal degrees of freedom of the molecules with a thermostat would alter their dynamics, thus causing artifacts such as sudden molecule splitting (as, e.g., relatively facile N2 dissociation in the gas phase18). Note that, during our AIMD simulations, the molecules reach thermal equilibrium via collisions with the substrate.
AIMD snapshots and figures are generated using the VMD software.19 In figures, “dynamic bonds” have a typical cut-off length of 2.2 Å. Note, however, that some bonds are manually removed to facilitate the visualization of molecular structures. Our descriptions of molecular reactions are based on own interpretations of electron transfer processes: it is known that density-functional theory is inherently limited (treats the electron density, not individual electrons) in the description of dissociation of asymmetric molecules.20
Results and discussion
Our investigation focuses on a model which incorporates the zero-layer graphene exposed to TMIn and hydrogen molecules. This is the interfacial (buffer) layer between the SiC (0001) substrate and the 1st graphene layer, and it is a result to the mechanism of formation of graphene by thermal decomposition of SiC.6,16 Therefore, besides providing knowledge to understand the precursor reactions responsible for nucleation phenomena, the results of our simulations are also the starting point for dedicated atomic-scale investigation of intercalation phenomena. In this regard, we note that the zero-layer graphene is directly exposed to the gas near SiC surface steps (see illustration in Fig. 6 of ref. 21) or at local terminations of the top graphene layer (schematic illustration in Fig. 6–8 of ref. 22). Adatoms or admolecules – produced via MOCVD on the zero-layer graphene – may find intercalation pathways at defective sites of the zero-graphene layer. Conversely, the reactivity of the top (1st) graphene layer can be well described by a free-standing graphene sheet (the interactions of graphene with an underlying graphene layer is weak). The results of TMIn reactions on self-standing defect-free graphene can be found in the ESI.† In general, it is expected that zero-layer graphene is more reactive than self-standing graphene due to bonding with underlying Si atoms of the SiC substrate.We carry out 7 independent simulations at 3500 K, for a total simulated time of 77 ps (770 000 configurations considering a time step = 0.1 fs). Each simulation has approximately the same duration (≈11 ps). In 3 out of 7 simulations (which we name Simulation #5, #6, and #7), the TMIn precursor does not dissociate for the entire duration of the AIMD run. During these simulations – which correspond to a total simulated time of approximately 30 ps – we record 16 TMIn/graphene adsorption and desorption events. Isolated indium adatoms and/or methyl–In admolecules form in 4 out of 7 cases (Simulation #1, #2, #3, and #4). Thus, our AIMD simulations reveal that TMIn + H2 + graphene reactions lead to the formation of products including indium hydride (InH), methane, ethane, ethene, and propane.
Simulation#1
In the initial 8.2 ps of this simulation, the trimethylindium (CH3)3In (TMIn), precursor impinges on graphene on five occasions without reacting. During this time, however, the TMIn molecule remains near (bounces on) the graphene surface. This is probably due to the unoccupied electrophile sp3 indium orbital, which temporarily accepts electrons from graphene π states or unsaturated carbon sp3 orbitals (note that some graphene C atoms are bonded to Si). TMIn/graphene interactions – either of van der Waals type or direct molecule/surface collisions – excite vibrational states of the molecule which ultimately activate the first TMIn reaction. The sequence of events illustrated in Fig. 2 occurs for a timeframe of ≈5 ps. The reactions start with H+ detachment from a methyl group, Fig. 2a, which produces a (CH3)2In− = CH2 negative gas ion and protonation of graphene, Fig. 2b. Then, a methyl group detaches from the central indium atom to attach to the CH2 group (Fig. 2c). The reaction, interpreted in Fig. 3a and b, is the result of various electron-transfer events. A pair of electrons – one transferred from the π In(pz)–CH2(pz) HOMO state and the other from the σ In(sp2)–Methyl(sp3) state – forms a CH2(sp3)–Methyl(sp3) bond, thus producing a H3C–In−–CH2–CH3 ion. The intramolecular transfer of a methyl group leaves two free electrons on indium. In principle, each of these electrons may occupy an individual non-bonding sp3 orbital to minimize Coulombic repulsion. However, due to vicinity of a proton (adsorbed on graphene) the electrons pair up in one of the sp3 dangling orbitals, as shown in Fig. 2b. The free electron pair attracts the proton, which thus desorbs from the graphene surface and bonds with the indium atom (Fig. 2c, 3c and d). The process leads to the formation of a H3C–InH–CH2–CH3 neutral molecule, with all orbitals hybridized sp3, Fig. 3d. Soon after (<1 ps), however, the H3C–InH–CH2–CH3 species dissociates into H3CIṅH and ĊH2CH3 radical molecules (see Fig. 3e, f and 2d). After temporarily (≈0.5 ps) bonding to graphene (Fig. 2e), the ĊH2CH3 radical attacks the methyl group of H3CIṅH, Fig. 3g. The reaction leads to the formation of indium hydride (InH) and propane (C3H8) molecules as shown in Fig. 3h, which float away from the surface as shown in Fig. 2f and g.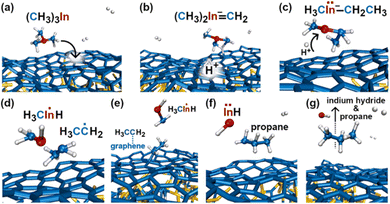 | ||
| Fig. 2 (Simulation#1) Sequence of trimethylindium (CH3)3In reactions on graphene/SiC (0001) as observed in AIMD simulations at 3500 K. The dynamic bonds have cutoff lengths of 2.2 Å. | ||
 | ||
| Fig. 3 (Simulation#1) Trimethylindium (CH3)3In/graphene reactions lead to formation of indium hydride and propane gas molecules. | ||
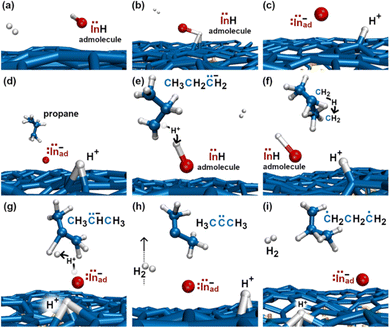
To gain insights into the reactivity of an InH gas molecule (Fig. 4a) with graphene, the simulation is extended for ≈4.5 additional ps. After two InH molecule bounces, the proton of the InH molecule is attracted by the π electron cloud of graphene (Fig. 4b) and detaches from the In ion (In−). Both the proton and In− ion remain on graphene as adspecies (Fig. 4c). After a fraction of ps, the propane gas molecule (previously formed, see Fig. 2f and g) approaches the In− adspecies and donates a proton from one of its terminal methyl groups. The reaction produces an InH admolecule (Fig. 4d and e), while the electron pair formerly occupying the C–H bond transfers to a non-bonding sp3 carbon orbital of the CH3CH2![[C with combining umlaut]](https://www.rsc.org/images/entities/char_0043_0308.gif) −H2 molecule (Fig. 4e). Then, within one ps, the sp3 electron pair of
−H2 molecule (Fig. 4e). Then, within one ps, the sp3 electron pair of ![[C with combining umlaut]](https://www.rsc.org/images/entities/char_0043_0308.gif) − takes a proton from the central CH2 group (Fig. 4f), thus producing CH3
− takes a proton from the central CH2 group (Fig. 4f), thus producing CH3![[C with combining umlaut]](https://www.rsc.org/images/entities/char_0043_0308.gif) −HCH3 (Fig. 4g). Accidentally, the CH3
−HCH3 (Fig. 4g). Accidentally, the CH3![[C with combining umlaut]](https://www.rsc.org/images/entities/char_0043_0308.gif) −HCH3 species flies near the InH admolecule. The H atom of the central C–H bond detaches from the molecule and bonds to the proton of InH (Fig. 4g). The reaction leads to the elimination of a H2 gas molecule and an In− monomer is formed again (Fig. 4h). This process also produces a highly reactive CH3–
−HCH3 species flies near the InH admolecule. The H atom of the central C–H bond detaches from the molecule and bonds to the proton of InH (Fig. 4g). The reaction leads to the elimination of a H2 gas molecule and an In− monomer is formed again (Fig. 4h). This process also produces a highly reactive CH3–![[C with combining umlaut]](https://www.rsc.org/images/entities/char_0043_0308.gif) –CH3 molecule, which quickly transforms in a ĊH2CH2ĊH2 double radical via intramolecular hydrogen transfer (Fig. 4i).
–CH3 molecule, which quickly transforms in a ĊH2CH2ĊH2 double radical via intramolecular hydrogen transfer (Fig. 4i).
Simulation#2
In this simulation we observe three collisions of TMIn onto graphene for 8.5 ps. The remaining 3.5 ps of this simulation reveal several intricate reaction pathways which ultimately lead to the formation of an In− monomer or an InH admolecule on graphene.The first relevant reaction event of Simulation#2 starts with a hydrogen molecule hitting a methyl group of TMIn (Fig. 5a and b). The momentum transfer causes bending of methyl–In–methyl chemical bonds, thus leading one methyl group to rapidly approach, and to react with another methyl (Fig. 5c). This process produces an ethane molecule (C2H6) and a methyl–In molecule (Fig. 5d and e). In Fig. 5 and 6, we observe several intra- and inter-molecular proton transfer events which are mediated by indium.
 | ||
| Fig. 5 (Simulation#1) Trimethylindium (CH3)3In/graphene reactions lead to formation of indium hydride and propane gas molecules. | ||
Starting, for example, from the configuration shown in Fig. 5e, the indium atom of the CH3In molecule takes a proton (to later give it back) from the underlying ethane molecule. Due to these frequent proton exchanges, the ethane molecule transforms back and forth into a C−H2CH3 species, which is relatively strongly bonded to graphene.
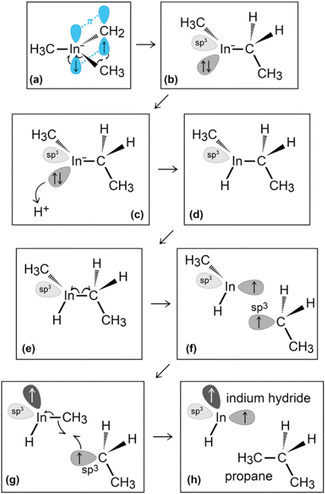
Then, we observe a rapid proton exchange between the two molecules: an H+ leaves a methyl group of ethane to attach to the In atom, thus temporarily forming a CH3In+H molecule (figure not shown). After 0.2 ps, the proton returns to its former position, assisting detachment of the ethane molecule from graphene (Fig. 5e and 6a). The subsequent approach of C2H6 to InCH3 induces intramolecular proton transfer within the ethane molecule (H+ jump indicated by arrow in Fig. 6b). The reaction is interpreted as described by Fig. 7. The electron pair on In overlaps with the antibonding σ* sp3(C)–sp3(C) molecular orbital of ethane (represented by orange lobes in Fig. 7a).
The electron occupation of the σ* state weakens the C–C bond and assists proton transfer from one carbon to the other (Fig. 7b). The reaction ultimately leads to formation of methane and H2C![[double bond, length as m-dash]](https://www.rsc.org/images/entities/char_e001.gif) InCH3 molecules (Fig. 7c and d), which rapidly leave the graphene surface (Fig. 6c and d).
InCH3 molecules (Fig. 7c and d), which rapidly leave the graphene surface (Fig. 6c and d).
During the subsequent 0.5 ps, the H2C![[double bond, length as m-dash]](https://www.rsc.org/images/entities/char_e001.gif) InCH3 molecule undergoes several transformations, as illustrated in Fig. 8. Within 0.1 ps, we observe two back-and-forth proton exchanges from the methyl group to the In atom, temporarily forming a ĊH2InHĊH2 double radical (not shown). After ≈0.2 ps, however, a proton permanently leaves the methyl group (Fig. 8a and b), thus producing
InCH3 molecule undergoes several transformations, as illustrated in Fig. 8. Within 0.1 ps, we observe two back-and-forth proton exchanges from the methyl group to the In atom, temporarily forming a ĊH2InHĊH2 double radical (not shown). After ≈0.2 ps, however, a proton permanently leaves the methyl group (Fig. 8a and b), thus producing ![[C with combining umlaut]](https://www.rsc.org/images/entities/char_0043_0308.gif) H2 and a H2C
H2 and a H2C![[double bond, length as m-dash]](https://www.rsc.org/images/entities/char_e001.gif) InH molecules (Fig. 8c). The highly reactive
InH molecules (Fig. 8c). The highly reactive ![[C with combining umlaut]](https://www.rsc.org/images/entities/char_0043_0308.gif) H2 molecule quickly attacks a graphene carbon atom (indicated as CG in Fig. 8d) to form a C–CG bond. We attribute the formation of this bond to both C and CG atoms contributing one electron each, which produces a free radical electron on the admolecule. The dangling CH2 group is prone to react with the near H2C
H2 molecule quickly attacks a graphene carbon atom (indicated as CG in Fig. 8d) to form a C–CG bond. We attribute the formation of this bond to both C and CG atoms contributing one electron each, which produces a free radical electron on the admolecule. The dangling CH2 group is prone to react with the near H2C![[double bond, length as m-dash]](https://www.rsc.org/images/entities/char_e001.gif) InH gas molecule. Indeed, the subsequent ≈0.1 ps of the simulation shows that: first, the H2C
InH gas molecule. Indeed, the subsequent ≈0.1 ps of the simulation shows that: first, the H2C![[double bond, length as m-dash]](https://www.rsc.org/images/entities/char_e001.gif) InH molecule bonds to the CH2 group attached on graphene (Fig. 8e); then, the two CH2 groups form an ethene molecule which rapidly desorbs, leaving an InH admolecule on graphene (Fig. 8f and g). The atomistic pathways shown in Fig. 8e–g are rationalized by the reaction diagram of Fig. 9. The Ċ atom of the ĊH2 radical attached on graphene attacks the π orbital of the H2C
InH molecule bonds to the CH2 group attached on graphene (Fig. 8e); then, the two CH2 groups form an ethene molecule which rapidly desorbs, leaving an InH admolecule on graphene (Fig. 8f and g). The atomistic pathways shown in Fig. 8e–g are rationalized by the reaction diagram of Fig. 9. The Ċ atom of the ĊH2 radical attached on graphene attacks the π orbital of the H2C![[double bond, length as m-dash]](https://www.rsc.org/images/entities/char_e001.gif) InH molecule (Fig. 9a). The transition state depicted in Fig. 9b evolves into HC
InH molecule (Fig. 9a). The transition state depicted in Fig. 9b evolves into HC![[double bond, length as m-dash]](https://www.rsc.org/images/entities/char_e001.gif) CH and InH products (Fig. 9c). However, while ethene leaves the surface, the InH molecule remains adsorbed on graphene for the remaining part (≈2 ps) of the simulation. During this timeframe, we repeatedly (three events) observe InH admolecule splitting followed by In− and H+ adspecies recombination (Fig. 8h and i). Likely due to electrostatic attraction, In− and H+ adspecies remain within few Å from each other.
CH and InH products (Fig. 9c). However, while ethene leaves the surface, the InH molecule remains adsorbed on graphene for the remaining part (≈2 ps) of the simulation. During this timeframe, we repeatedly (three events) observe InH admolecule splitting followed by In− and H+ adspecies recombination (Fig. 8h and i). Likely due to electrostatic attraction, In− and H+ adspecies remain within few Å from each other.
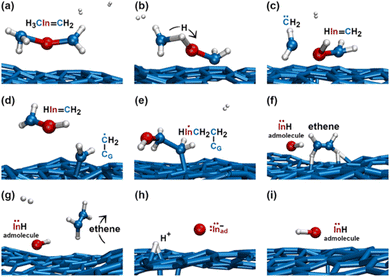 | ||
| Fig. 8 (Simulation#2) AIMD snapshots of reactions leading to the formation of InH, In−, and H+ adspecies. | ||
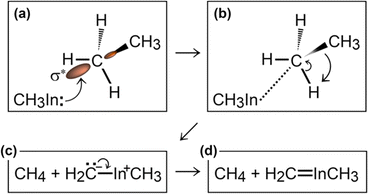 | ||
Fig. 9 (Simulation#2) Interpretation of reactions between a ĊH2 radical adsorbed on graphene and a H2C![[double bond, length as m-dash]](https://www.rsc.org/images/entities/char_e001.gif) InH gas molecule leading to the formation of InH. InH gas molecule leading to the formation of InH. | ||
Simulation#3
The first relevant TMIn reaction occurs in the gas phase, at a simulation time of ≈3 ps, when a H2 molecule hits TMIn (Fig. 10b). The impact assists detachment of a methyl group (Fig. 10c), which adsorbs on graphene for ≈1 ps, while the (CH3)2In molecule remains in the gas phase (Fig. 10d). Note that TMIn dissociation induced by collision with a H2 molecule may be an artefact of the very high temperature used in the simulations. At a simulation time of ≈4.1 ps, the methyl radical desorbs from graphene (Fig. 10e) attaches to graphene and further reacts with a hydrogen molecule (Fig. 10f and g), thus producing methane (CH4) and atomic hydrogen (Fig. 10h). Nearly at the same time, TMIn adsorbs on graphene (Fig. 10i). The interaction with the surface excites vibrational modes which promote the detachment of a methyl group (Fig. 10j). Both the methyl and CH3In molecules remain adsorbed and migrate on graphene. However, after 0.7 ps, the methyl radical flies away from the surface (Fig. 10k). Finally, the CH3In admolecule reacts further by eliminating the remaining methyl group. The latter reaction leaves a neutral In adatom which migrates on graphene during the remaining simulation time of ≈2 ps (Fig. 10l). Conversely, the ĊH3 adspecies diffuses on the surface for 0.4 ps and then desorbs (Fig. 10l).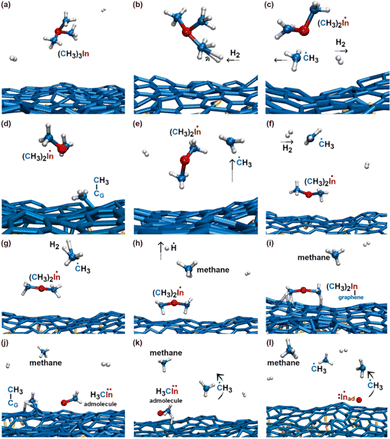 | ||
| Fig. 10 (Simulation#3) Sequential elimination of methyl groups from TMIn leads to the formation of an electrically neutral In adatom on graphene. | ||
Simulation#4
The first TMIn/graphene collision (Fig. 11a and b) – which occurs ≈1 ps after thermal equilibration of the gas/substrate system – leads directly to the elimination of a methyl radical from TMIn (Fig. 11c). The In(CH3)2 molecule remains adsorbed on graphene (Fig. 11d). However, after ≈1.5 ps, the interaction with graphene's surface causes elimination of an additional ĊH3 group (Fig. 11d and e). The methyl molecule attaches and diffuses on graphene for ≈2.3 ps. Then it desorbs from the surface (Fig. 11f). It is worth noting that the methyl gas molecule exchanges a proton with a H2 molecule which flies nearby (figure not shown). The transition state of the exchange-reaction is a molecular complex formed of methane and atomic hydrogen. During the remaining 9.2 ps of Simulation#4, the methyl–indium admolecule bounces on the surface 5 times without dissociating.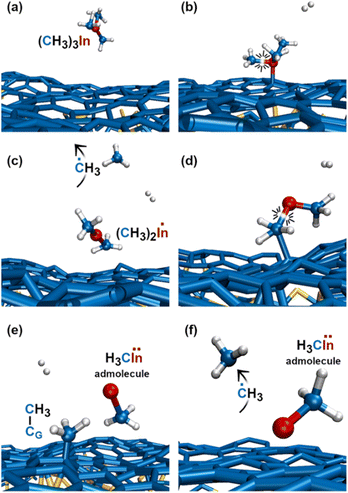 | ||
| Fig. 11 (Simulation#4) After 4.1 ps, all reactions have occurred and the methyl–In remains as the admolecule for the remaining 9.2 ps of the simulation. | ||
To summarize, relevant intermediate and final products of TMIn + H2 reactions on graphene/SiC (0001) in Simulation#1 are: InH gas molecules (Fig. 2f and g) and admolecules (Fig. 4a and f), charged In− and H+ adatoms (Fig. 4c, d and h), H2 (Fig. 4h) and propane (Fig. 2f and g) gas molecules. Simulation#2 also yields InH admolecules – that dissociate (and recombine) in In− + H+ adspecies Fig. 8h and i) – as products of TMIn/graphene/SiC(0001) reactions. However, at variance with Simulation#1, the first reaction of Simulation#2 is triggered by a collision between a H2 molecule and TMIn in the gas phase (Fig. 5a and b).
In addition, Simulation#2 evidences the formation of ethane (Fig. 6a), methane (Fig. 6d), and ethene (Fig. 8g) gas molecules. Simulation#3 shows the formation of electrically neutral In adatoms on graphene (Fig. 10l). In this case, formation of an In adatom stems from sequential elimination of methyl-group radicals from the TMIn molecule. Analogous to Simulation#2, transformation of TMIn initiates (first detachment of a ĊH3 group) in the gas phase due to collision with a H2 molecule (Fig. 10b and c). The graphene layer catalyzes elimination of the other two ĊH3-groups (Fig. 10i–l). In addition, it is worth underlining a gas-phase reaction between a ĊH3 radical (formerly part of the TMIn precursor) and a H2 molecule which produces methane and atomic hydrogen (Fig. 10g and h). In Simulation#4, TMIn reacts only on the graphene surface. The simulation shows two relatively rapid (within 4.1 ps) eliminations of ĊH3 groups (Fig. 11). In this case, however, the remaining methyl–In admolecule diffuses on the graphene surface without reacting for the remaining part of the simulation (≈9.2 ps).
Since the MOCVD process involves the trimethylindium precursor in the presence of molecular hydrogen, in this work both species are considered for achieving realistic descriptions of reactions in the gas phase and on the surface. At variance with what was observed during TMAl9 and TMIn reactions on self-standing defect-free graphene (see the ESI†), our present simulation model that includes H2 gas molecules allows us to gain insights into the effects of hydrogen in the MOCVD processes of TMIn on graphene. AIMD simulations show that TMIn reactions are mediated not only by the graphene surface, but in some occasions, TMIn reactions are also triggered in the gas phase by the energy transfer provided through collision with a hydrogen molecule (Fig. 5b–d and 10b, c). These events underline the role of hydrogen in providing the energy needed for precursor molecules to enter into a transition state. The contribution of hydrogen to the reactivity of TMIn on graphene is also indicated by transfer of a proton (previously adsorbed on graphene) to In-containing molecules that fly proximate to the surface (see, e.g., Fig. 2b–d). Proton bonding to indium is observed to facilitate the elimination of organic functional groups (Fig. 2d).
Generally, it is observed that indium exhibits relatively high affinity for protons. An example is provided in Fig. 8b, in which the indium atom of a H3CIn![[double bond, length as m-dash]](https://www.rsc.org/images/entities/char_e001.gif) CH2 molecule takes a proton from the vicinal methyl group, thus leading to formation of a
CH2 molecule takes a proton from the vicinal methyl group, thus leading to formation of a ![[C with combining umlaut]](https://www.rsc.org/images/entities/char_0043_0308.gif) H2 double radical and an HIn
H2 double radical and an HIn![[double bond, length as m-dash]](https://www.rsc.org/images/entities/char_e001.gif) CH2 molecule (Fig. 8c). It is also worth noting that due to its larger size (extended valence electron shells, with 4d105s25p1 configuration), indium is a softer ion in comparison to gallium or aluminum. Thus, indium can relatively easily charge as In− both as an isolated anion or as a molecule. This explains the stronger propensity of In (in relation to Al) to form indium-hydride functional groups in a molecule (Fig. 2c and d) or form individual InH admolecules (Fig. 4e and f) and gas molecules (Fig. 2f). Accordingly, InH molecules are prone to or donate protons (Fig. 4g and h) or dissociate into In− ad-anion and H+ adproton on the surface (Fig. 4b, c and 8h, i). Analogous arguments suggest that In–C bonds are weaker than Al–C bonds. Plausible implications of different In vs. Al (ref. 9) reactivity with carbon are (i) relatively quick stripping of the TMIn molecule of its methyl groups (see Fig. 10 and 11), which contributes to the formation of hydrocarbons in the gas phase; (ii) more rare formation of new In–C bonds in comparison to the formation of new Al–C bonds observed previously (see Fig. 6 in ref. 9).
CH2 molecule (Fig. 8c). It is also worth noting that due to its larger size (extended valence electron shells, with 4d105s25p1 configuration), indium is a softer ion in comparison to gallium or aluminum. Thus, indium can relatively easily charge as In− both as an isolated anion or as a molecule. This explains the stronger propensity of In (in relation to Al) to form indium-hydride functional groups in a molecule (Fig. 2c and d) or form individual InH admolecules (Fig. 4e and f) and gas molecules (Fig. 2f). Accordingly, InH molecules are prone to or donate protons (Fig. 4g and h) or dissociate into In− ad-anion and H+ adproton on the surface (Fig. 4b, c and 8h, i). Analogous arguments suggest that In–C bonds are weaker than Al–C bonds. Plausible implications of different In vs. Al (ref. 9) reactivity with carbon are (i) relatively quick stripping of the TMIn molecule of its methyl groups (see Fig. 10 and 11), which contributes to the formation of hydrocarbons in the gas phase; (ii) more rare formation of new In–C bonds in comparison to the formation of new Al–C bonds observed previously (see Fig. 6 in ref. 9).
Before conclusions, we briefly discuss the results of our simulations in relation to previous experimental observations of TMIn pyrolysis in a hot-wall flow-tube reactor (see ref. 23). The experiments were carried out in various chemical environments and temperatures ranging between 573 and 723 K. Consistent with our results, ref. 23 reports relatively large concentrations of CH4 and C2H6 hydrocarbons as final products of TMIn decomposition (a summary of reaction products recorded during AIMD simulations is given in Table 1). However, the experiments indicated that formation of methane is considerably less frequent than formation of C2H6 when the reactor does not contain H2 gas. Despite the absence of H2, our AIMD simulations of TMIn on free-standing graphene described in the ESI† show the formation of methane in 3 out of 3, and of ethane in 2 out of 3, cases (see Table 1). The discrepancy with experiments may be due to much higher temperature used in AIMD simulations and to low confidence on the statistical relevance of competing reactions. Among other relevant similarities with experimental results, we highlight the frequent formation of methyl radical groups as well as of longer chain radicals C2H7 and C3H7. In addition, also in experiments, TMIn exhibited higher reactivity in the presence of H2, thus confirming the chemical affinity between In and hydrogen species.
| Simulation | Stable or intermediate products | ||||||||||
|---|---|---|---|---|---|---|---|---|---|---|---|
| In | InH | InCH3 | CH4 | C2H6 | C3H8 | HC![[double bond, length as m-dash]](https://www.rsc.org/images/entities/char_e001.gif) CH CH |
H2 | H+ | H | ||
| TMIn + H2 @ graphene/SiC(0001) | #1 | x | x | x | x | x | |||||
| 3500 K | #2 | x | x | x | x | x | x | x | x | ||
| #3 | x | x | x | ||||||||
| #4 | x | ||||||||||
| TMIn @ graphene | #S1 | x | x | x | x | x | |||||
| 4300 K | #S2 | x | x | x | x | x | x | x | x | x | |
| #S3 | x | x | x | x | x | x | x | ||||
Conclusions
We carry out ab initio molecular dynamics simulations of TMIn on graphene supported by SiC in a H2 atmosphere and on free-standing graphene. The simulations reveal the atomistic pathways for TMIn transformations which ultimately lead to the formation of isolated In or InH species on graphene. More specifically, we clarify the role played by H2 in promoting TMIn reactions, show that collisions of TMIn with the graphene surface can activate sequential elimination of methyl radical groups, and illustrate mechanisms for the formation of hydrocarbons as methane, ethane, ethene, and propane. Our results are of relevance to interpret or guide experiments that involve MOCVD of TMIn on graphene, or possibly other surfaces.Conflicts of interest
There are no conflicts to declare.Acknowledgements
All simulations were carried out using the resources provided by the Swedish National Infrastructure for Computing (SNIC) – partially funded by the Swedish Research Council through Grant Agreement N° VR-2015-04630 – on the Clusters located at the National Supercomputer Centre (NSC) in Linköping, the Center for High Performance Computing (PDC) in Stockholm, and at the High Performance Computing Center North (HPC2N) in Umeå, Sweden. D. G. S. gratefully acknowledges financial support from the Swedish Research Council (VR) through Grant N° VR-2021-04426 and the Competence Center Functional Nanoscale Materials (FunMat-II) (Vinnova Grant No. 2016-05156). A. K.-G. and G. K. G. acknowledge support from the Swedish Research Council (VR) through project VR 2017-04071. RF and A. K.-G. acknowledge support from The Swedish Foundation for International Cooperation in Research and Higher Education STINT, project IB2018-7520.References
- http://www.nobelprize.org/prizes/physics/2014 .
- D. Liang, R. Quhe, Y. Chen, L. Wu, Q. Wang, P. Guan, S. Wangef and P. Lu, RSC Adv., 2017, 7, 42455 RSC.
- M. S. Prete, A. M. Conte, P. Gori, F. Bechstedt and O. Pulci, Appl. Phys. Lett., 2017, 110, 012103 CrossRef.
- V. Wang, Z. Q. Wu, Y. Kawazoe and W. T. Geng, J. Phys. Chem. C, 2018, 122, 6930 CrossRef CAS.
- Y. Guo, L. Ma, K. Mao, M. Ju, Y. Bai, J. Zhao and X. C. Zeng, Nanoscale Horiz., 2019, 4, 592 RSC.
- B. Pécz, G. Nicotra, F. Giannazzo, R. Yakimova, A. Koos and A. Kakanakova-Georgieva, Adv. Mater., 2021, 33, 202006660 CrossRef PubMed.
- A. Kakanakova-Georgieva, F. Giannazzo, G. Nicotra, I. Cora, G. K. Gueorguiev, P. O. Å. Persson and B. Pécz, Appl. Surf. Sci., 2021, 548, 149275 CrossRef CAS.
- A. G. Bhuiyan, D. Ishimaru and A. Hashimoto, Cryst. Growth Des., 2020, 20, 1415 CrossRef CAS.
- D. G. Sangiovanni, G. K. Gueorguiev and A. Kakanakova-Georgieva, Phys. Chem. Chem. Phys., 2018, 20, 17751 RSC.
- N. Nayir, M. Y. Sengul, A. L. Costine, P. Reinke, S. Rajabpour, A. Bansal, A. Kozhakhmetov, J. Robinson, J. M. Redwing and A. van Duin, Carbon, 2022, 190, 276 CrossRef CAS.
- G. Kresse and J. Hafner, Phys. Rev. B: Condens. Matter Mater. Phys., 1993, 47, 558 CrossRef CAS PubMed.
- D. M. Ceperley and B. J. Alder, Phys. Rev. Lett., 1980, 45, 566 CrossRef CAS; J. P. Perdew and A. Zunger, Phys. Rev. B: Condens. Matter Mater. Phys., 1981, 23, 5048 CrossRef.
- P. E. Blöchl, Phys. Rev. B: Condens. Matter Mater. Phys., 1994, 50, 17953 CrossRef PubMed.
- S. Grimme, J. Comput. Chem., 2006, 27, 1787 CrossRef CAS PubMed.
- J. P. Perdew, K. Burke and M. Ernzerhof, Phys. Rev. Lett., 1997, 78, 1396 CrossRef CAS.
- C. Riedl, C. Coletti, T. Iwasaki, A. A. Zakharov and U. Starke, Phys. Rev. Lett., 2009, 103, 246804 CrossRef CAS PubMed.
- D. G. Sangiovanni, O. Hellman, B. Alling and I. A. Abrikosov, Phys. Rev. B, 2016, 93, 094305 CrossRef.
- D. G. Sangiovanni, A. B. Mei, L. Hultman, V. Chirita, I. Petrov and J. E. Greene, J. Phys. Chem. C, 2016, 120, 12503 CrossRef CAS.
- W. Humphrey, A. Dalke and K. Schulten, J. Mol. Graphics Modell., 1996, 14, 33 CrossRef CAS PubMed.
- A. J. Cohen, P. Mori-Sanchez and W. T. Yang, Science, 2008, 321, 792 CrossRef CAS PubMed.
- S. Chen, P. A. Thiel, E. Conrad and M. C. Tringides, Phys. Rev. Mater., 2020, 4, 124005 CrossRef CAS.
- Y. Han, J. W. Evans and M. C. Tringides, Phys. Rev. Mater., 2021, 5, 074004 CrossRef CAS.
- A. H. McDaniel and M. D. Allendorf, Chem. Mater., 2000, 12, 450 CrossRef CAS.
Footnote |
| † Electronic supplementary information (ESI) available. See DOI: https://doi.org/10.1039/d2cp04091c |
| This journal is © the Owner Societies 2023 |

