Evidence of direct Z-scheme triazine-based g-C3N4/BiOI (001) heterostructures: a hybrid density functional investigation
Received
1st October 2022
, Accepted 28th November 2022
First published on 29th November 2022
Abstract
In this work, we systematically investigate the photocatalytic mechanism of g-C3N4/BiOI (001) through hybrid functional calculations based on first-principles theory. The staggered band structure is observed in the g-C3N4/BiOI (001); meanwhile, a built-in electric field exists from the g-C3N4 monolayer to the BiOI surface at the interface. BiOI has lower band edges, which bend downward at the interface; whereas g-C3N4 has higher band edges, which bend upward. With Coulomb interaction and the built-in electric field, photo-generated electrons in the conduction bands (CB) of BiOI recombine with photo-generated holes in the valence bands (VB) of g-C3N4. Meanwhile, the stronger reduction capacity for photo-excited electrons in the g-C3N4's CB and the stronger oxidation capacity for photo-generated holes in the BiOI (001)'s VB are retained. Therefore, a direct Z-scheme heterostructure character is presented. As a result, the electrons and holes generated by the photons can be separated and migrate highly effectively at the interface. The separated electrons and holes can effectively participate in the redox reactions with water/pollutants to produce the photocatalytically reactive species superoxide ions (˙O2−) and hydroxyl radicals (˙OH), respectively. This is consistent with the experimental results. It is also worth noting that the g-C3N4/BiOI (001) heterostructure shows a larger difference in the effective mass of carriers. Therefore, the direct Z-scheme charge transfer and separation mechanism and the larger effective mass difference of carriers lead to the superior photocatalytic activity of the g-C3N4/BiOI (001) in experiments. A few speculations and controversies that arose from the experiments are clarified.
1. Introduction
The rapid development of industry in recent decades has led to a gradual decrease in the earth's energy reserves, while pollution has become increasingly severe due to the rapid development of industry. Nowadays, how to solve the energy shortage and environmental pollution problems are significant and urgent challenges for scientists, scholars, and governments and have drawn a great deal of attention and research.1–5 In this regard, semiconductor-based photocatalysis technology has become essential to solving these severe problems. This is because this technology exhibits excellent potential for splitting water to produce hydrogen and oxygen and transforming all kinds of liquid and gaseous pollutants into harmless matter, even valuable chemicals and fuels, using the inexhaustible solar energy source as a driving force.6–10 Generally, adequate light absorption, effective photo-generated carrier separation, and high mobility of charge carriers are several critical factors for the applications of semiconductor photocatalysis.11,12 However, satisfying all these conditions for a single and pure semiconductor photocatalyst is not easy. Therefore, a variety of strategies such as element doping,13–15 heterostructure construction,16–19 metal deposition,20–22 and defect control23,24 are applied to improve the separation efficiency of the electron–hole pairs generated by the photocatalysis and to increase the absorption of visible light so that more photocatalytic activity can take place. Among these methods, constructing a heterostructure16–19 is considered the most promising method for enhancing photocatalytic performances.
The two-dimensional (2D) material g-C3N4 has a graphene-like structure but has an appropriate bandgap of about 2.7 eV for photocatalytic performance in experiments.25–29 At the same time, g-C3N4 has high chemical and thermal stability and significant optical and photoelectrochemical properties as well as low cost.30–32 It is a promising material for photocatalytic hydrogen production and decomposition of organic pollutants.16 More importantly, 2D g-C3N4 (001 or 002 crystal facet) is an excellent candidate for heterostructure construction with other 2D semiconductor nanosheets. For example, g-C3N4/SnS2,33 g-C3N4/ZnO,34,35 and g-C3N4/TiO236 present excellent photocatalytic activities in experiments, in contrast to their single counter parts. On the other hand, BiOI has also attracted great interest from researchers as a promising photocatalytic material because of its special merits, such as an appropriate band gap around 2 eV and a built-in electrical field between the cation (Bi2O2)2+ slab layer and anion I1− slap layer.37–39 However, similar to the cases of many individual semiconductors, including g-C3N4, as mentioned above, BiOI material is also limited in its ability to be used as a photocatalyst due to some disadvantages. Among these disadvantages, the two major challenges are the slow charge migration and high recombination probability of the electrons and holes that are generated in response to photons. Building heterostructures (such as the direct Z-scheme) with other appropriate 2D semiconductors is the major way to enhance the activity of BiOI.40 At the same time, because of the layered structure of BiOI materials and the stronger visible light absorption, BiOI is also an excellent candidate for building heterostructures with other appropriate 2D semiconductors to improve the activities, for example, BiOI/Bi2O3,41,42 BiOI/SnS,43 BiOI/SrTiO3,44 BiOI/MoS2,45 and so on.
A great deal of g-C3N4-based and BiOI-based heterostructures, the g-C3N4/BiOI, including the different crystal facet conjunctions, the different preparation methods, and the different ratios between g-C3N4 and BiOI, have been extensively investigated in experiments.25,26,28,29,46–55 For the different crystal facet conjunctions, the BiOI (001) and BiOI (110) crystal facets are mostly considered for building the heterostructures between BiOI and g-C3N4. Despite this, Tian et al.50 reported that the photocatalytic performance of the g-C3N4/BiOI (001) is obviously superior to that of the g-C3N4/BiOI (110) in experiments. However, the photocatalytic mechanism for the significant g-C3N4/BiOI (001) heterojunction is unclear and controversial in experiments. Alam et al.25 and Tian et al.50 reported that the g-C3N4/BiOI (001) presents type II band alignment, while Zhang et al.47 and He et al.49 reported that the g-C3N4/BiOI (001) is the direct Z-scheme heterojunction. In view of the fact that the systematic and accurate first principles investigations and understandings of the mechanisms governing the photocatalytic reaction are lacking for g-C3N4/BiOI (001), it is desired to explore the reason for the high photocatalytic performance of the g-C3N4/BiOI (001) through first-principles calculations so that the experimental findings on the g-C3N4/BiOI(001) can be further clarified and our understanding can be further enhanced.
We propose using hybrid functional calculations to explore the photocatalytic mechanism of the heterojunction between the BiOI(001) and the g-C3N4 monolayer by building a reasonable model. This paper will discuss the interfacial interactions, the effective masses of electrons and holes, charge transfer, the projected band structure, the work function, and the band alignment for the g-C3N4/BiOI(001).
2. Computational method
All calculations are carried out using the Vienna ab initio simulation package (VASP) with the projector augmented wave (PAW) approach, which is based on density functional theory.56,57 The geometrical optimization is carried out via the generalized gradient approximation (GGA) of Perdew et al.58 The DFT-D3(BJ) method59 of Becke–Jonson is applied to describe the long-range effect of van der Waals (VdW) forces. The vacuum region of 20 Å is used in this study in order to avoid the interaction between the layers.60 There is a set cut-off energy of 500 eV for the plane-wave basis. The k-point mesh of 4 × 2 × 1 is adopted for the heterojunction g-C3N4/BiOI (001) supercell model. The structural optimizations are finished when each atom's energy is less than 1.0 × 10⁻⁴ eV and all residual forces are less than 0.03 eV Å−1. As we all know, the traditional DFT-GGA method usually underestimates the bandgap value of the semiconductor. Therefore, we use the Heyd–Scuseria–Ernzerhof (HSE) hybrid function61 to calculate the electronic structures accurately. As short-range Hartree–Fock exchange parameters, we applied 0.2 and 0.18 for bulk BiOI and monolayer g-C3N4. This led to the theoretical band gaps for bulk BiOI and monolayer g-C3N4 (001) being 2.04 and 2.79 eV, respectively, which are in good agreement with the corresponding experimental data 1.77–2.2242,62 and 2.75–2.8 eV,26,46,48 respectively. Thus, an average value α = 0.19 is used for the heterojunction. The thermostability of the heterojunction is evaluated by ab initio molecular dynamic simulation (AIMD)63 with a canonical (NVT) ensemble and a simulation temperature of 300 K. The Anderson thermostat is employed, with a time step of 1 fs and the total AIMD time is 8 ps.
The optical absorption coefficient A(ω) of the 2D material is obtained from the formula A(ω) = ωLε2(ω)/c (where L is the thickness of vacuum and c is the speed of light in a vacuum).64 The dielectric constant calculation is performed with this method in the module “Linear Optical Spectra for Two Dimensional Semiconductors” of the VASPKIT code.65
3. Results and discussion
3.1 Geometric structural model of g-C3N4/BiOI(001) heterojunctions
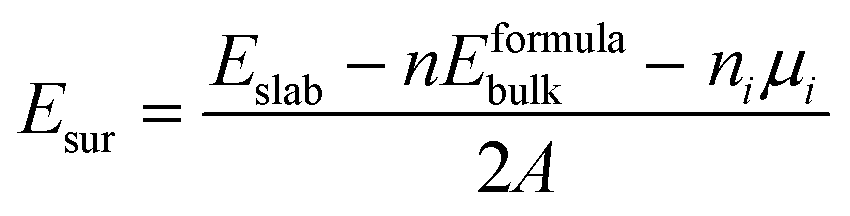
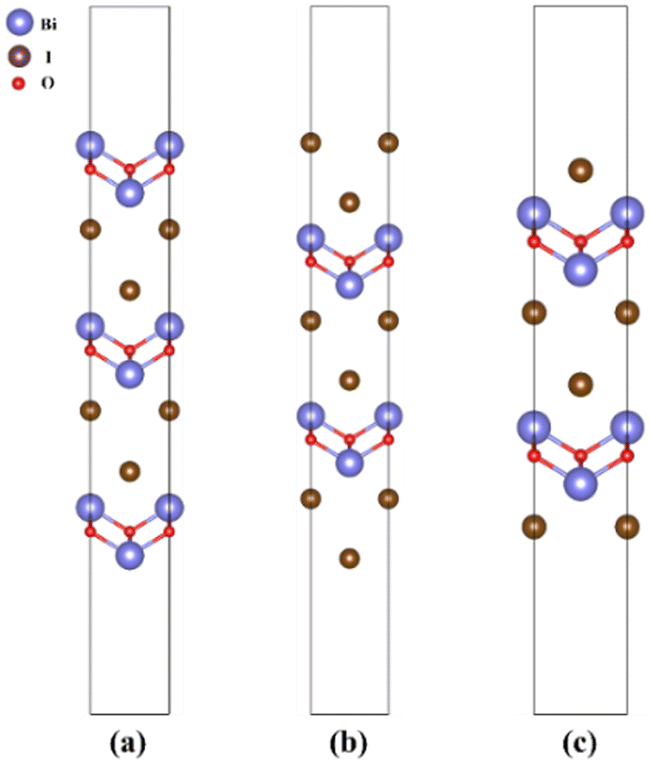
In order to construct the appropriate g-C3N4/BiOI (001) structural model, the surface termination problem is first discussed and determined. This is due to the fact that the band alignment and type of heterostructure could potentially be affected by the different surface terminations.66 For the termination surface of g-C3N4, there is only one termination circumstance including in triazine and heptazine structures, because of its 2D character. While the (001) crystal facet of BiOI is characterized by three different terminations, BiO, 2I and 1I, which are shown in Fig. 1(a)–(c), respectively. The relative stability of the different termination surfaces is judged via the calculations and comparisons of the surface energies:67| |  | (1) |
where Eslab is the total energy of the slab, Eformulabulk is the energy per formula unit in bulk, n represents the number of formula units in the slab, ni represents the excess atoms of species i, and A represents its surface area. Obviously, the chemical potential μi has to be decided before calculating the surface energy.
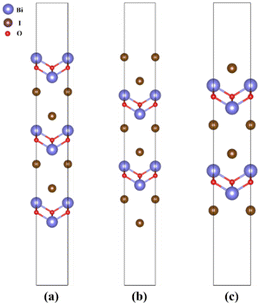 |
| | Fig. 1 The slab models employed for the surface energy calculations of (a) BiO-terminated, (b) 2I-terminated, and (c) 1I-terminated BiOI (001) surfaces. | |
Under thermodynamic constraints, the chemical potentials of μBi, μO and μI are required to satisfy the following equation in order to avoid the formation of pure elemental phases in BiOI.
| | | ΔμBi ≤ 0, ΔμI ≤ 0, ΔμO ≤ 0 | (2) |
where Δ
μBi =
μBi −
EBi, Δ
μI =
μI −
EI and Δ
μO =
μO −
EO are defined as the change in chemical potential with reference to the energy of the elemental bulk/gaseous state, depending on the growth environment;
EBi is the energy of a Bi atom in the trigonal Bi-metal,
EO is half of the energy of an isolated O
2 molecule,
EI is the energy of a I atom in the space group of
Cmca. We can express the optimized static energy
EBiOI per formula unit in BiOI as
EBiOI =
EBi +
EO +
EI + Δ
Hf(BiOI), where Δ
Hf(BiOI) is the formation enthalpy for per formula BiOI. With the conditions of thermal equilibrium growth, the chemical potential of BiOI is equal to the optimized static energy per formula unit in BiOI, namely
μBiOI =
EBiOI. On the other hand, the equation
μBi +
μO +
μI =
μBiOI is required.
67 Then, we have the equation:
| | | ΔHf(BiOI) = (μBi − EBi) + (μI − EI) + (μO − EO) = ΔμBi + ΔμI + ΔμO | (3) |
Additionally, Δ
μBi, Δ
μI, and Δ
μO must satisfy further constraints to avoid the formation of secondary phases Bi
2O
3 and BiI
3:
| | | 2ΔμBi + 3ΔμO < ΔHf(Bi2OI3) | (4) |
| | | ΔμBi + 3ΔμI < ΔHf(BiI3) | (5) |
where Δ
Hf(Bi
2OI
3) and Δ
Hf(BiI
3) represent the formation enthalpy in every formula unit for Bi
2O
3 and BiI
3, respectively. The calculated formation enthalpies in every formula BiOI, Bi
2O
3 and BiI
3 are listed in
Table 1. The acquired formation enthalpies through HSE approximation are consistent with the experimental data from the database (https://oqmd.org).
Table 1 Compared the ΔHf (eV) in every formula unit from calculation results through HSE approximations and experimental data
|
|
ΔHHSEf |
ΔHEXPf |
| BiOI |
−2.89 |
−3.49 |
| Bi2O3 |
−5.74 |
−5.91 |
| BiI3 |
−2.12 |
−1.56 |
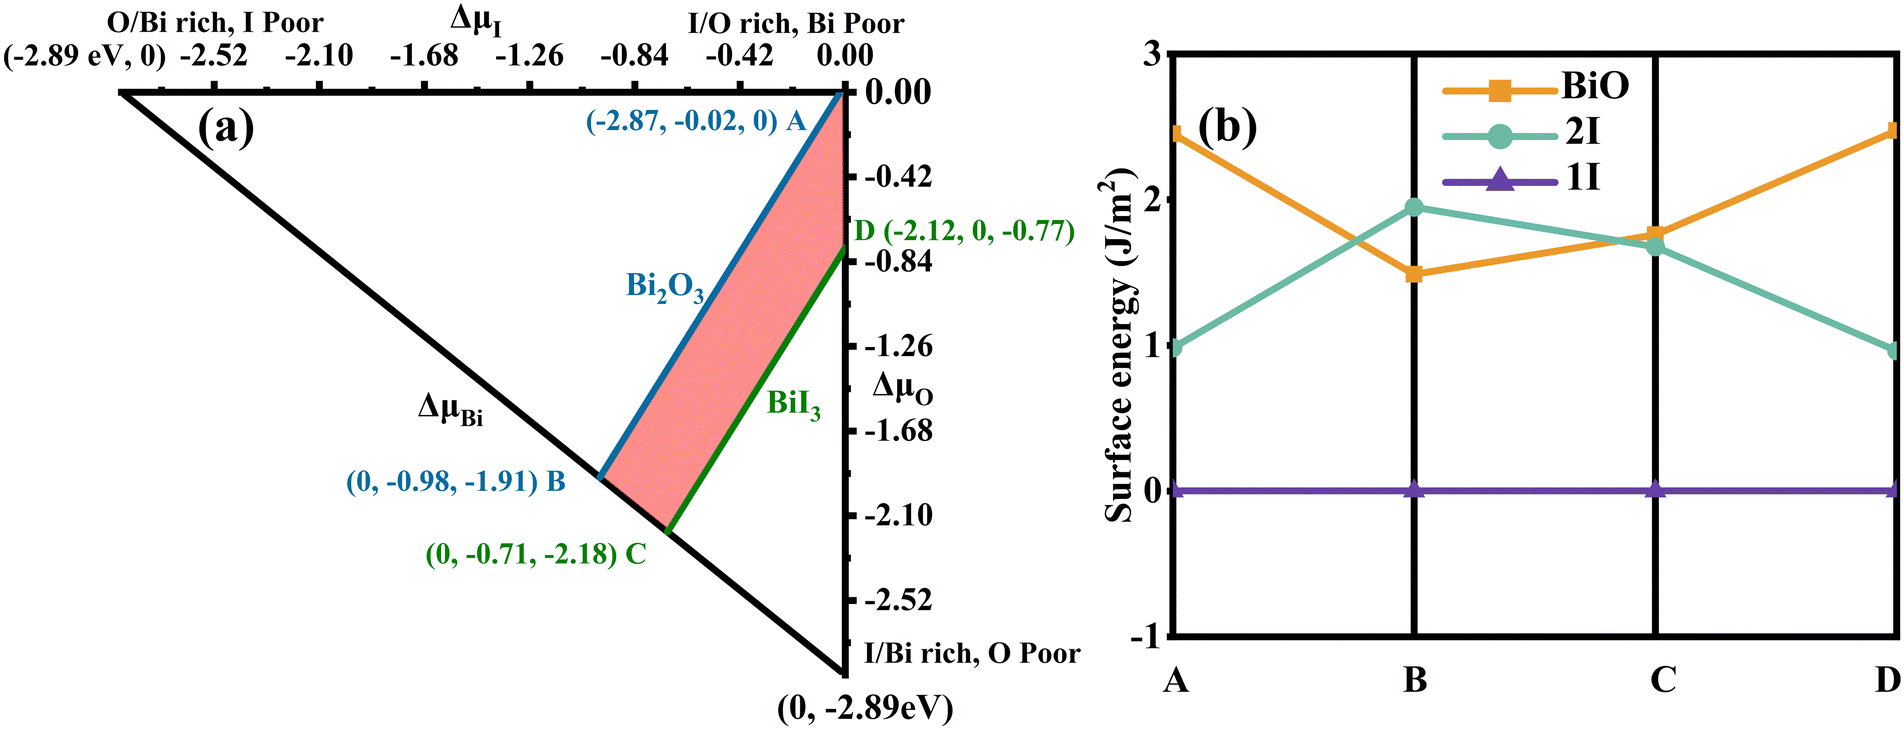
Fig. 2(a) shows the allowed chemical domain (shaded region) for BiOI in the ΔμI and ΔμO plane. The calculated values at four representative chemical potential points are labelled as A (O-rich, Bi/I-poor), B (Bi-rich, O/I-poor), C (Bi-rich, O/I-poor), and D (I-rich, Bi/O-poor) in Fig. 2(a). The ΔμBi, ΔμI and ΔμO are −2.87, −0.02 and 0 eV for A conditions, respectively, while 0, −0.98 and −1.91 eV for B conditions, 0, −0.71 and −2.18 eV for C conditions, and −2.12, 0 and −0.77 eV for D conditions. Furthermore, the corresponding chemical potentials for μBi, μI and μO can be acquired. Then the surface energies for each of the atomic termination surfaces on the BiOI (001) are calculated in order to assess their feasibility. In Fig. 2(b), we show the results of our calculations. Under all four growth conditions (points A, B, C, and D), the 1I-terminated surface has been observed to have the lowest surface energy among all three surface types. Based on this, the BiOI (001) with 1I termination has the highest stability and is the easiest to expose and form among these termination surfaces. This conclusion is consistent with the results of BiOCl (001) via similar calculations.67 At the same time, it also agrees with Kong et al.'s calculations68 about the surface energy of the BiOI (001) facet using other judgment methods. Thus, only the 1I-terminated BiOI (001) surface is considered for constructing the heterostructure model between the BiOI and g-C3N4(001). The corresponding model is denoted as g-C3N4/BiOI (001).
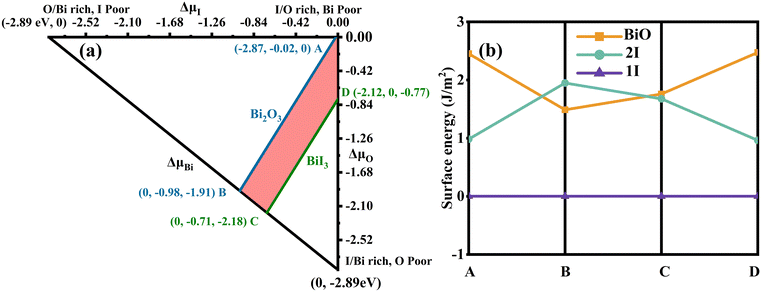 |
| | Fig. 2 (a) An accessible range of chemical potentials (red/shaded region) for the equilibrium growth conditions of BiOI using the HSE functional. Specific points A, B, C and D are chosen as the representative chemical potentials (eV) for the following surface energy calculations. The A condition is O-rich, Bi/I-poor; the B and C conditions are Bi-rich, O/I-poor; the D condition is I-rich, O/Bi-poor. (b) Under four representative chemical potential growth conditions (A, B, C and D), the calculated surface energies (J m−2) for various atomic termination surfaces of BiOI (001). | |
In experiments, g-C3N4/BiOI nanocomposites were prepared with the use of triazine-based g-C3N4.25,26,28,29,46–55 A triazine structure is found in the hexagonal system of g-C3N4, and its space group can be described as P![[6 with combining macron]](https://www.rsc.org/images/entities/char_0036_0304.gif) m2. The relaxed lattice parameters for bulk g-C3N4 are a = b = 4.78 Å, c = 7.08 Å and the angles are α = β = 90°, γ = 120°. Those of tetragonal BiOI with space group P4/nmms are a = b = 3.98 Å, c = 9.13 Å and α = β = γ = 90°. To construct a reasonable heterojunction model, we cleave the (001) crystal facet of bulk g-C3N4 and redefine the lattices of g-C3N4 (001) to a = 8.29 Å, b = 4.78 Å, and α = β = γ = 90°. As a result, for the g-C3N4/BiOI (001) interface, a monolayer 1 × 5 g-C3N4 (001) surface (containing 70 atoms C30N40) is used to match a three-layer 2 × 6 BiOI (001) surface with 1I termination (containing 72 atoms Bi24O24I24). The lattice mismatches of the g-C3N4/BiOI (001) interface along a and b directions are only 3.92% and 0.07%, respectively. The structural models for the g-C3N4/BiOI (001) before relaxation and after relaxation are presented in Fig. 3. As a measure of the stability of the heterojunction, the binding energy (Eb) of g-C3N4/BiOI(001) is calculated according to the following equation:69
m2. The relaxed lattice parameters for bulk g-C3N4 are a = b = 4.78 Å, c = 7.08 Å and the angles are α = β = 90°, γ = 120°. Those of tetragonal BiOI with space group P4/nmms are a = b = 3.98 Å, c = 9.13 Å and α = β = γ = 90°. To construct a reasonable heterojunction model, we cleave the (001) crystal facet of bulk g-C3N4 and redefine the lattices of g-C3N4 (001) to a = 8.29 Å, b = 4.78 Å, and α = β = γ = 90°. As a result, for the g-C3N4/BiOI (001) interface, a monolayer 1 × 5 g-C3N4 (001) surface (containing 70 atoms C30N40) is used to match a three-layer 2 × 6 BiOI (001) surface with 1I termination (containing 72 atoms Bi24O24I24). The lattice mismatches of the g-C3N4/BiOI (001) interface along a and b directions are only 3.92% and 0.07%, respectively. The structural models for the g-C3N4/BiOI (001) before relaxation and after relaxation are presented in Fig. 3. As a measure of the stability of the heterojunction, the binding energy (Eb) of g-C3N4/BiOI(001) is calculated according to the following equation:69
| | | Eb = (Eg-C3N4/BiOI − Eg-C3N4 − EBiOI)/Sheter | (6) |
where
Eg-C3N4/BiOI is the total energy of the g-C
3N
4/BiOI heterostructure,
Sheter is the cross-sectional area of the heterostructure, and
Eg-C3N4 and
EBiOI are the total energies of the isolated g-C
3N
4 and BiOI, respectively. It has been calculated that the binding energies of the heterojunction g-C
3N
4/BiOI (001) is −32.05 meV Å
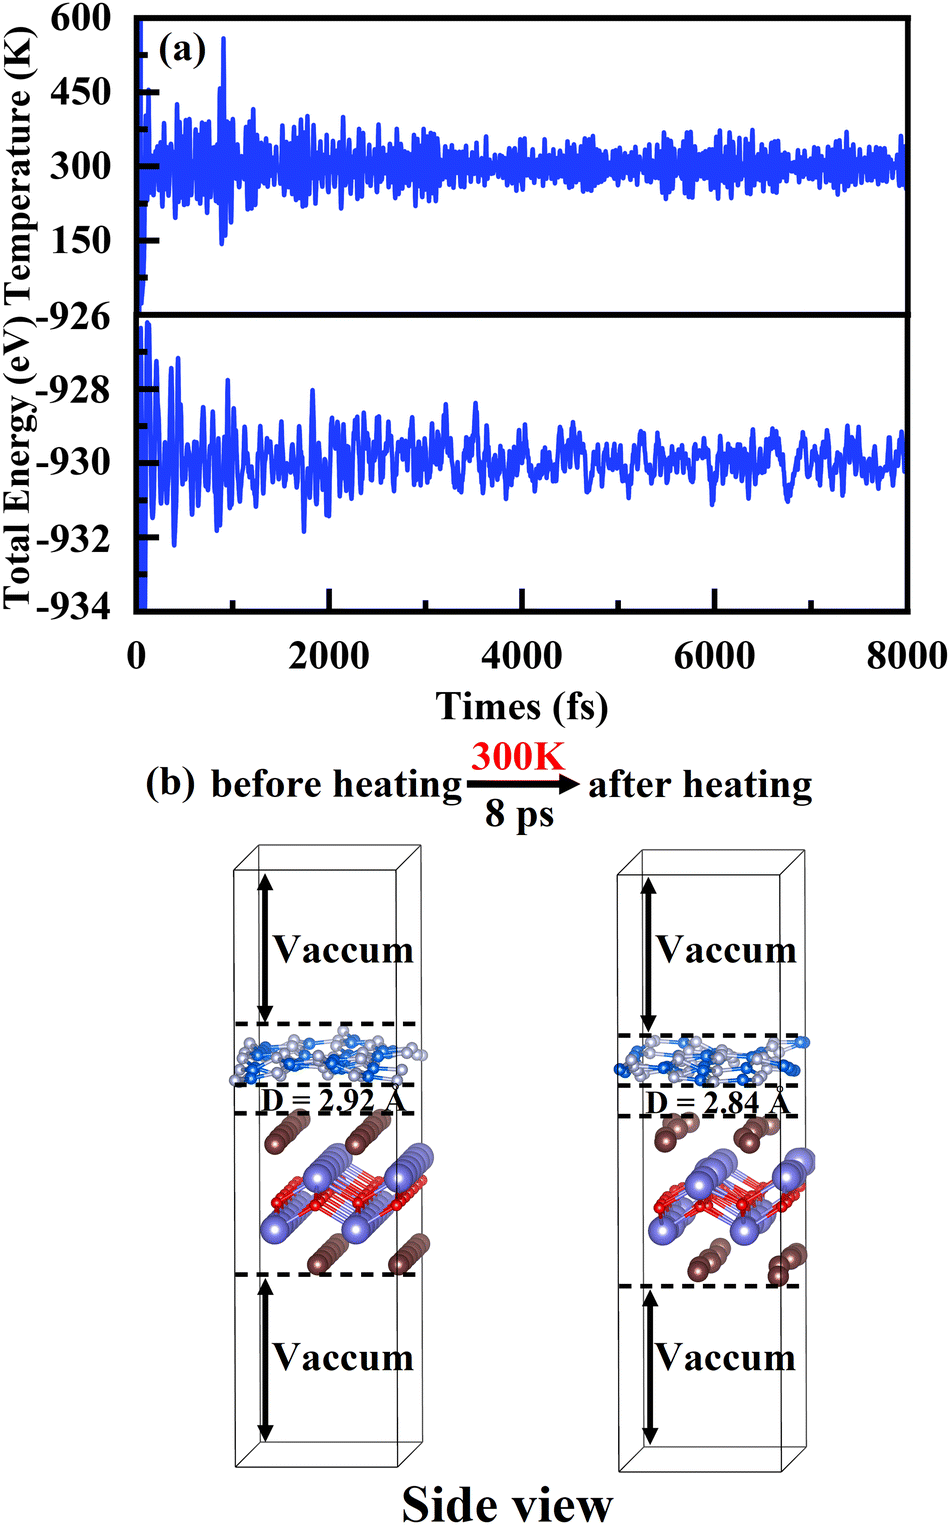
−2. Due to the negative binding energy, this heterostructure is thermodynamically stable, which means it can be prepared or grown in a practical way.
70,71 Indeed, the thermostability of the heterojunction g-C
3N
4/BiOI (001) is verified
via an AIMD simulation at 300 K, shown in
Fig. 4(a) and (b). The temperature and total energy of the heterostructure system fluctuate stably with small ups and downs in
Fig. 4(a).
63 At the same time, it is seen clearly in
Fig. 4(b) that the atoms are only displaced slightly near their equilibrium positions. No structural corruption is observed
via the structure comparison before and after heating.
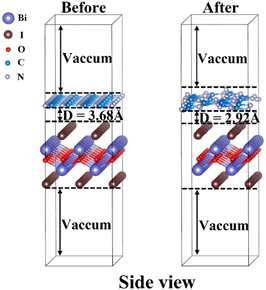 |
| | Fig. 3 Side view of the g-C3N4/BiOI (001) heterostructure models before relaxation and after relaxation. The gray, brown, red, white and blue balls represent bismuth, iodine, oxygen, nitrogen and carbon atoms, respectively. | |
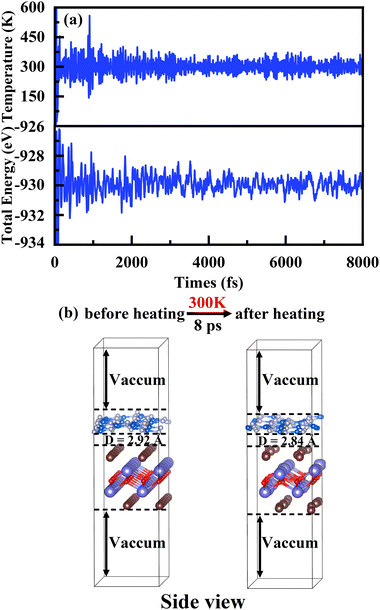 |
| | Fig. 4 (a) Variations of temperature and energy plotted as a function of time for AIMD simulations of g-C3N4/BiOI(001), under 300 K for 8 ps with a time step of 1 fs. (b) The bottom parts show the g-C3N4/BiOI(001) structures at 0 ps and 8 ps. | |
3.2 Electronic structure, charge transfer, band alignment and optical absorption spectrum of the g-C3N4/BiOI(001) heterojunction
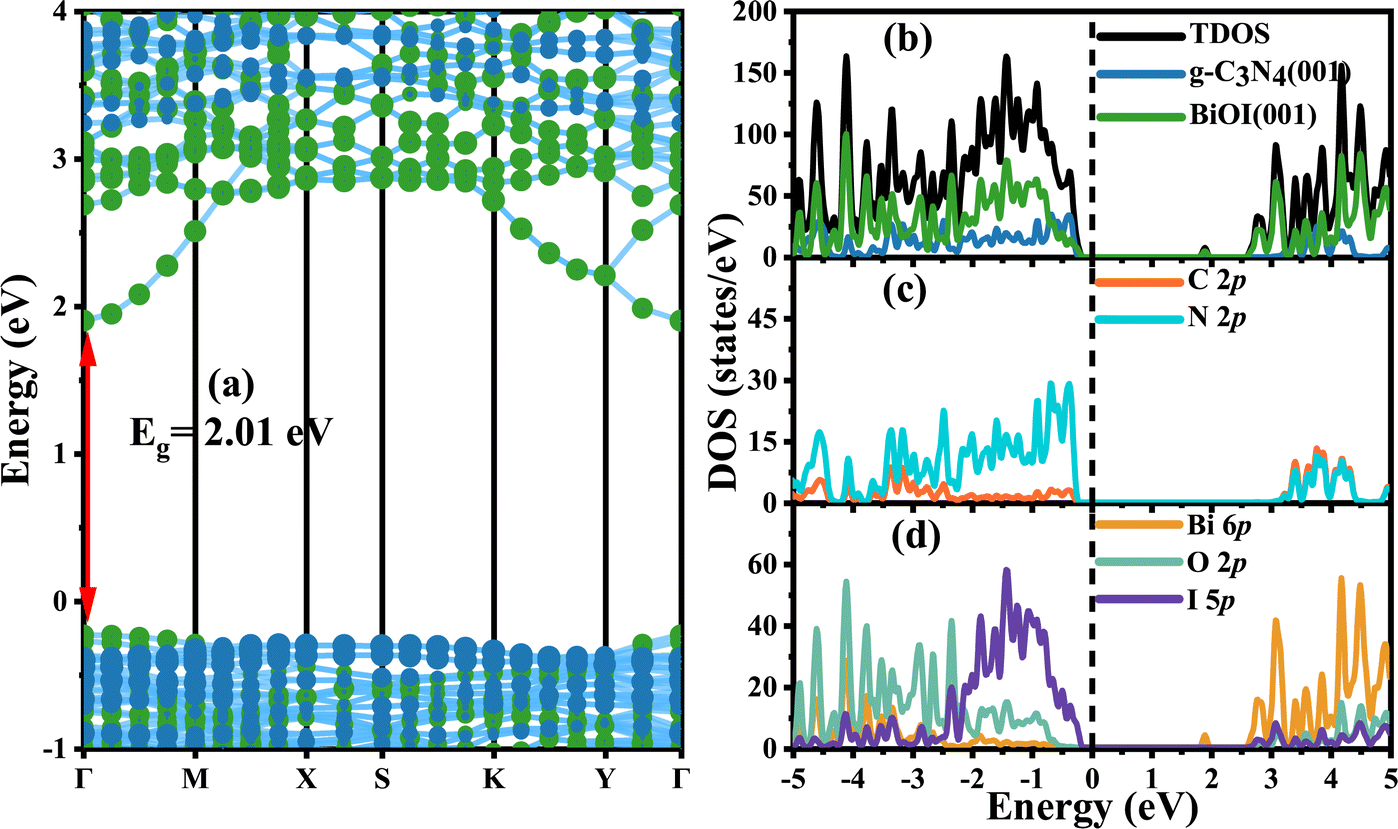
First, the calculated band structures, the total density of states (TDOS) and the projected density of states (PDOS) for the individual g-C3N4 (001) and BiOI (001) surfaces are shown in Fig. 5(a) and (b), respectively. It is seen that both monolayer 1 × 5 g-C3N4 (001) and 2 × 6 three-layer BiOI (001) surface slabs present the direct band gap at the high symmetry point Γ. Their direct band gap values from the HSE functional calculations are 2.48 and 2.01 eV, respectively, in contrast to the corresponding experimental data 2.7–2.8 eV26,46,48 and 1.77–2.22 eV.42,62 The valence band top of g-C3N4 is mostly composed of N 2p orbitals, while the conduction band bottom majorly comes from the contribution of C 2p and N 2p orbitals. For the BiOI (001), the valence band top is mainly composed of I 5p orbitals, and the conduction band bottom mainly originates from the Bi 6p orbitals. These results are in agreement with other calculations.18,72
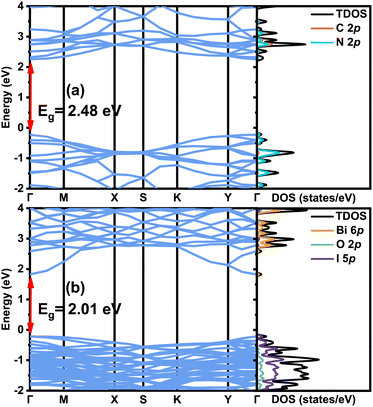 |
| | Fig. 5 The band structures, TDOS and PDOS for (a) monolayer 1 × 5 g-C3N4, and (b) three-layer 2 × 6 BiOI (001) surface with 1I termination. In order to make comparisons easier, the Fermi energy level is placed at 0 eV for the sake of convenience. | |
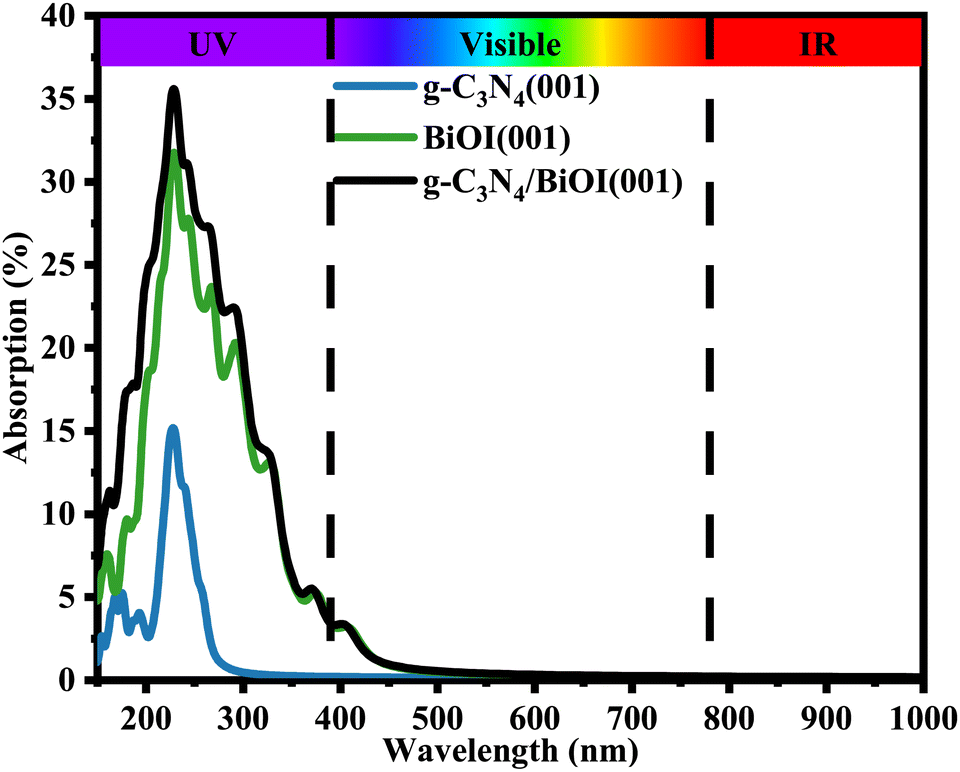
It is more interesting to explore the projected band structures (Fig. 6(a)) and TDOS and PDOS (Fig. 6(b)–(d)) for the coupled heterostructure g-C3N4/BiOI (001). The projected band structures indicate that the theoretical band gaps for g-C3N4 and BiOI (001) in the heterostructure are 3.24 and 2.01 eV, respectively. The interaction between the g-C3N4 and BiOI (001) layer seems to be clearly changing the band structure of the g-C3N4 and enhancing the conduction band minimum (CBM) level. This is similar to the case of g-C3N4/ZnO.17 Nevertheless, the band gap of the g-C3N4 part should not be increased markedly, in contrast to that before building the heterojunction. In experiments, the band gap of every component in a heterojunction is usually considered the same as the corresponding one before building.26,46,48 Therefore, the acquired band gap of the g-C3N4 from the projected band structure should be overestimated. In contrast, the heterostructure's band gap is almost the same as the BiOI part but much smaller than the g-C3N4 part. Furthermore, the visible light absorption intensity and range of the g-C3N4/BiOI (001) in Fig. 7 are almost the same as the BiOI. As a result, visible light absorption should not be the significant factor in enhancing the photocatalytic performance in the g-C3N4/BiOI (001) in experiments,25,47,49,50 in contrast to the individual BiOI. The efficient separation and migration of the photo-generated electrons and holes should be primarily responsible for the improvement. However, how does the process occur?
 |
| | Fig. 6 Projected band structures, TDOS, and PDOS of the g-C3N4/BiOI (001) heterostructure from HSE functional calculations. The green and blue circles represent the contribution from BiOI and g-C3N4, respectively. The position of the Fermi energy level is set at 0 eV. | |
 |
| | Fig. 7 Optical absorption spectra of isolated g-C3N4, BiOI (001), and g-C3N4/BiOI (001) from HSE hybrid functional calculations. | |
Fig. 6(a)–(d) show clearly that the conduction band bottom of the g-C3N4/BiOI (001) is determined by the contribution of the Bi 6p orbitals and I 5p orbitals in BiOI. Meanwhile, the N 2p orbitals in g-C3N4 mainly determine the valence band top of the heterostructure. There is no doubt that the conduction band minimum level (CBM) of the BiOI is lower than the CBM level of the g-C3N4. Comparing the average values of the highest valence band energies at the different K points for the g-C3N4 and BiOI in the heterostructure, the valence band maximum (VBM) level of the g-C3N4 part is considered to be about 0.15 eV higher than that of the BiOI part. The circumstance is similar to the case of the g-C3N4/2BN-Gyne.73 Therefore, the valence band top and conduction band bottom originate from the different parts in the g-C3N4/BiOI (001), and a staggered projected band structure is presented. This is very expected for the applications of photocatalysis. Depending on the charge transfer, the staggered projected band structure could be a direct Z-scheme or type II band alignment.74
To investigate the charge transfer in the interface between the g-C3N4 and the BiOI (001), we calculated the work functions of the monolayer g-C3N4 and three-layer BiOI (001) utilizing the HSE hybrid functional. This value is the difference between the vacuum level and Fermi level and can be calculated by using the formula:72,75,76
where
Φ,
Evac and
EF represent the energy of work function, vacuum level, and Fermi level, respectively. The calculated work functions of the monolayer g-C
3N
4 and three-layer BiOI (001) are 4.88 and 6.58 eV, respectively, which are consistent with other HSE calculations,
72,75,76 but are overestimated in contrast to the experimental data 4.3 (g-C
3N
4) and 5.02 eV (BiOI (001).
49 The overestimation could partially originate from the HSE hybrid functional calculation itself; if the Perdew–Burke–Ernzerhof (PBE) functional is applied, the calculated work functions for the monolayer g-C
3N
4 and three-layer BiOI (001) are 3.86 eV and 5.99 eV, respectively, which are closer to the experimental data. It is seen that both the HSE results and PBE results are qualitatively in accord with the experimental data. Thus, the electron will translate from g-C
3N
4 to BiOI when they are contacted. As can be affirmed from the calculations of the charge density difference, which can be expressed as follows:
63,72,75,76| | Δρ = ρ(g-C3N4/BiOI)/BiOI![[thin space (1/6-em)]](https://www.rsc.org/images/entities/char_2009.gif) (001) − ρg-C3N4 − ρBiOI(001) (001) − ρg-C3N4 − ρBiOI(001) | (8) |
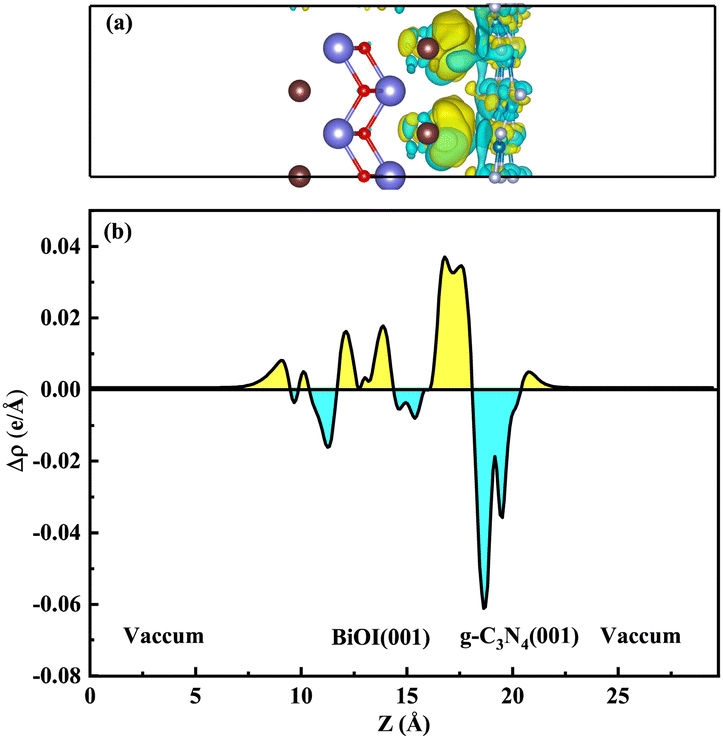
Among them, ρg-C3N4/BiOI, ρg-C3N4 and ρBiOI(001) represent the charge densities of the g-C3N4/BiOI (001) heterojunction, monolayer g-C3N4 and three-layer BiOI (001), respectively. Fig. 8(a) displays the calculated results. The cyan area is used to represent electron depletion, and the yellow area is used to represent electron accumulation. The cyan colour dominates a major portion of g-C3N4's surface area, and the yellow colour covers a minor proportion. The yellow area dominates the BiOI (001) surface, but a few parts of the area are covered by cyan. This indicates that electrons are consumed in the g-C3N4 and accumulated in the BiOI (001). For a more visual response to the electron transfer, the planar-averaged charge density difference along the Z-axis of the g-C3N4/BiOI (001) heterostructure is also calculated. It is shown in Fig. 8(b). The positive value means the accumulation of electrons, and the negative value means the decrease of electrons in Fig. 8(b). In contrast to Fig. 8(a), it is seen that the positive value dominates the region of BiOI, but the negative value dominates the region of g-C3N4. Taking the above work function analysis into account, these results are in agreement with the above analysis. Consequently, in the g-C3N4/BiOI (001) heterostructure, there is a built-in electric field from the g-C3N4 to the BiOI, leading to band edge bending. On the low-Fermi-level semiconductor BiOI, the band edges bend downward at the interface; while on the high-Fermi-level semiconductor g-C3N4, the band edges bend upward at the interface.
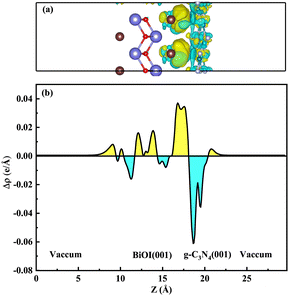 |
| | Fig. 8 (a) The charge density difference of the g-C3N4/BiOI (001) heterojunction, and (b) the planar-averaged differential charge density along the Z direction. The cyan region represents electron depletion, and the yellow region represents electron accumulation. The gray, brown, red, white, and blue balls represent bismuth, iodine, oxygen, nitrogen, and carbon atoms, respectively. The isovalues are 0.00175 e Å−3. | |
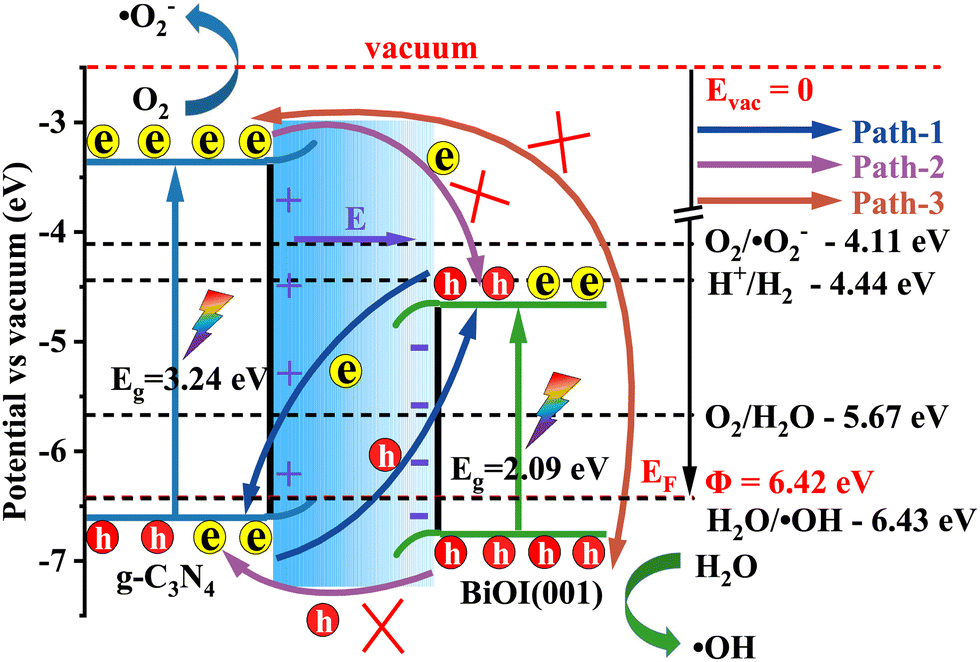
As a result, the staggered projected band structure in Fig. 6 corresponds to a direct Z-scheme band alignment.40 In conjunction with the calculated work function and the projected band structures, the direct Z-scheme band alignment and the charge separation schematic diagram are presented in Fig. 9, in contrast to the vacuum level.5,16 It is noted that under sunlight irradiation, the electrons are excited from the valence bands (VB) to the conduction bands (CB). At the same time, the holes are generated in the VB. For the photo-generated electrons in the CB of g-C3N4/BiOI (001), except for going back to the VB and recombining with the corresponding holes (intralayer recombination), there are three possible migration paths between g-C3N4 and BiOI (Fig. 9). In path 1, the photo-generated electrons in the CB of the BiOI transfer towards the VB of the g-C3N4 and recombine with the photo-generated holes in the VB of the g-C3N4 under the action of the built-in electric field and Coulomb attraction between holes and electrons (interlayer recombination77–79). In path 2, the photo-generated electrons in the CB of the g-C3N4 migrate towards the CB of the BiOI because of the conduction band offset (CBO) potential; similarly, the photo-generated holes in the VB of the BiOI migrate towards the VB of the g-C3N4 because of the valence band offset (VBO) potential (type II transfer mode40). In path 3, the photo-generated electrons in the CB of the g-C3N4 migrate towards the VB of the BiOI because of Coulomb attraction. Comparing three possible transfer paths, path 1 is the most favourable, given the reasons mentioned above. In contrast, path 2 is suppressed with the operation of the built-in electric field from the g-C3N4 to BiOI. In addition to this, the suppression is also caused by the Coulomb repulsion between the electrons in BiOI's CB (holes in BiOI's VB) and the electrons in g-C3N4's CB (holes in g-C3N4's VB), as well as the extra potential barrier that is induced by band bending.77–79 Regarding the long distance between the VBM level of the BiOI and the CBM level of the g-C3N4, pathway 3 is the least favourable.80 In addition, there is no built-in electric field in the BiOI or g-C3N4 for intralayer recombination and the energy gap between the respective VBM level and CBM level is also larger than that between the VBM level of the g-C3N4 and the CBM level of the BiOI. Therefore, the intralayer recombination probability of the photo-generated electrons and holes should be much smaller than the interlayer recombination probability.
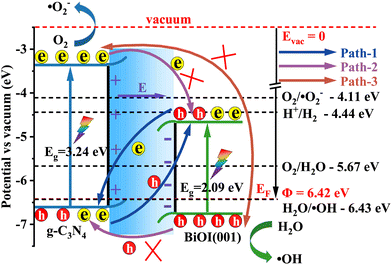 |
| | Fig. 9 The schematic diagram of the band alignment and the charge separation at the interface of the g-C3N4/BiOI (001). | |
The photo-excited electrons with higher reduction capacity in the g-C3N4's CB (the g-C3N4's CBM level is obviously higher than the reduction potential of O2/˙O2− (−4.11 eV)53 in Fig. 9) as well as the photo-generated holes with the stronger oxidation capacity in the BiOI (001)'s VB (the VBM level is much lower than the oxidation potential of H2O/˙OH (−6.43 eV)53 in Fig. 9) are retained. Furthermore, the photo-excited electrons in the g-C3N4's CB have enough reduction ability to reduce O2 to ˙O2− and the photo-generated hole in the BiOI (001)'s VB has a strong oxidation ability to produce ˙OH. Then, the produced superoxide ions (˙O2−) and hydroxyl radical (˙OH) as the photocatalytic reactive species can degrade organic pollutants. In contrast, the electrons with the weaker reduction capacity and the holes with the weaker oxidation capacity are eliminated in the heterostructure. This way, the photo-generated electrons and holes can be separated and migrate efficiently. In addition, the separated electrons and holes in the heterostructure g-C3N4/BiOI (001) have been shown to be capable of taking part in reduction and oxidation reactions with water or pollutants in an effective manner. This analysis agrees with the experimental results of Zhang et al.47 and He et al.,49 where superoxide ions (˙O2−), hydroxyl radicals (˙OH) and holes (h+) were affirmed as the main photocatalytic reactive species for pollutant degradation. In contrast, if the g-C3N4/BiOI (001) band alignment follows that of the type II band alignment, then the electrons accumulating in the CB of BiOI (Fig. 9) do not have enough reduction capacity to reduce O2 to ˙O2−. This is not consistent with experimental findings.47,49,50 Therefore, the hybrid density functional calculations evidence the direct Z-scheme experimental speculation of Zhang et al.47 and He et al.,49 but negate the type II photocatalytic mechanism explanations in the experiment of Alam et al.25 and in the experiment from Tian et al.50 where ˙O2− and ˙OH were also reported as the main active species for pollutant degradation.
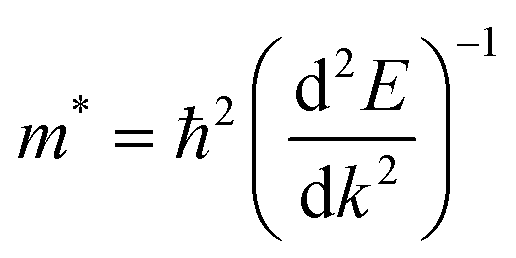
On the other hand, the large difference in electron–hole mobility and directional separation is also vital for improving photo-conversion efficiency.81 The mobility of carriers can be judged by calculating their effective masses. In this case, the effective masses of the electrons and holes in monolayer g-C3N4, three-layer BiOI (001) surface, and g-C3N4/BiOI (001) heterojunction are calculated, and they are expressed as follows:16
| | 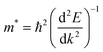 | (9) |
where
E is the band edge energy,
k is the wave vector, and
ħ is the reduced Planck constant. The calculated results are shown in
Table 2. The ‘averaged’ means the arithmetic mean value of the effective masses along the different directions.
82 From the calculated average value of the effective masses, it is seen that an obvious change after constructing a heterojunction is the significant increase in the difference between the electron and hole's effective masses. While the larger difference in the effective masses of electrons and holes means that they are easier to separate. This is beneficial in decreasing their recombination rate and improving the photocatalytic activity.
81,83 Therefore, the direct Z-scheme charge transfer and separation mechanism, as well as the larger effective mass difference of carriers, excellently explains the superior photocatalytic activity of the g-C
3N
4/BiOI (001) in experiments.
25,47,49,50
Table 2 Calculated effective masses of electrons and holes in monolayer g-C3N4 (001), monolayer BiOI (001), and g-C3N4 (001)/BiOI (001) heterojunction
4. Conclusions
Hence, we concluded that the structural model for the heterostructure g-C3N4/BiOI (001) could be reasonably determined. Employing first-principles hybrid functional calculations, the mechanism of the photocatalytic performance of g-C3N4/BiOI (001) has been systematically investigated. We find that the g-C3N4/BiOI (001) structure exhibits a staggered projected band structure with a built-in electric field from the g-C3N4 surface to the BiOI surface as a result of our calculations. High-Fermi-level semiconductor g-C3N4 has higher band edges, which bend upward, while low-Fermi-level semiconductor BiOI has lower band edges, which bend downward at the interface. The electrons with weaker reduction capacity in the valence bands (VB) of the g-C3N4 and the holes with weaker oxidation capacity in the conduction bands (CB) in the BiOI are eliminated in the heterostructure. In contrast, the photo-excited electrons with higher reduction capacity in the CB of the g-C3N4 and the photo-generated holes with greater oxidation capacity in the VB of the BiOI (001) are retained. Therefore, it can be said that the g-C3N4/BiOI (001) heterostructure has a direct Z-scheme character, and the photo-generated electrons and holes can be separated and migrate highly effectively. The separated electrons and holes can effectively participate in the reduction and oxidation reactions with water/pollutants to produce the photocatalytically reactive species of superoxide ions (˙O2−) and hydroxyl radicals (˙OH), respectively. This is consistent with the experimental results. On the other hand, it is found that an obvious change after constructing a heterojunction is the significant increase in the difference between the electron and hole's effective masses. The direct Z-scheme charge transfer and separation mechanism as well as the larger effective mass difference of carriers excellently explain the superior photocatalytic activity of the g-C3N4/BiOI (001) in experiments. In contrast, the theory does not support the speculation from some experiments that the g-C3N4/BiOI (001) is attributed to the type II heterostructure.
Conflicts of interest
The authors declare that there are no known competing financial interests or personal relationships that could have appeared to influence the work reported in this paper.
Acknowledgements
This work is supported by the Doctor Research Fund of China West Normal University (Grants No. 412773), the Sichuan Youth Science and Technology Innovation Research (Grant No. 21XTD0038), the Sichuan Natural Science Foundation (Grant No. 2022NSFSC1841), and the National Natural Science Foundation of China (Grant No. 52262031). This work is carried out at the Shanxi Supercomputing Center of China, and the calculations are performed on TianHe-2. The authors also thank the Supercomputing Center of USTC for providing the computational time.
Notes and references
- A. Kubacka, M. Fernandez-Garcia and G. Colon, Chem. Rev., 2012, 112, 1555–1614 CrossRef CAS PubMed.
- J. Fu, J. Yu, C. Jiang and B. Cheng, Adv. Energy Mater., 2018, 8, 1701503 CrossRef.
- H. Khojasteh, M. Salavati-Niasari, H. Safajou and H. Safardoust-Hojaghan, Diamond Relat. Mater., 2017, 79, 133–144 CrossRef CAS.
- H. Haghjoo, F. S. Sangsefidi and M. Salavati-Niasari, J. Mol. Liq., 2017, 247, 345–353 CrossRef CAS.
- C. Li, Y. Xu, W. Sheng, W. J. Yin, G. Z. Nie and Z. Ao, Phys. Chem. Chem. Phys., 2020, 22, 615–623 RSC.
- J. Fu, B. Zhu, C. Jiang, B. Cheng, W. You and J. Yu, Small, 2017, 13, 1603938 CrossRef PubMed.
- J. Low, B. Cheng, J. Yu and M. Jaroniec, Energy Storage Mater., 2016, 3, 24–35 CrossRef.
- J. Jin, J. Yu, D. Guo, C. Cui and W. Ho, Small, 2015, 11, 5262–5271 CrossRef CAS PubMed.
- S. Sorcar, Y. Hwang, C. A. Grimes and S.-I. In, Mater. Today, 2017, 20, 507–515 CrossRef CAS.
- X. Li, J. Wen, J. Low, Y. Fang and J. Yu, Sci. China Mater., 2014, 57, 70–100 CrossRef.
- R. M. Navarro Yerga, M. C. Alvarez Galvan, F. del Valle, J. A. Villoria de la Mano and J. L. Fierro, ChemSusChem, 2009, 2, 471–485 CrossRef CAS PubMed.
- K. Maeda and K. Domen, J. Phys. Chem. C, 2007, 111, 7851–7861 CrossRef CAS.
- G. Dong, K. Zhao and L. Zhang, Chem. Commun., 2012, 48, 6178–6180 RSC.
- F. Hu, W. Luo, Y. Hu, H. Dai and X. Peng, J. Alloys Compd., 2019, 794, 594–605 CrossRef CAS.
- F. Raziq, M. Humayun, A. Ali, T. Wang, A. Khan, Q. Fu, W. Luo, H. Zeng, Z. Zheng, B. Khan, H. Shen, X. Zu, S. Li and L. Qiao, Appl. Catal., B, 2018, 237, 1082–1090 CrossRef CAS.
- J. Liu and E. Hua, J. Phys. Chem. C, 2017, 121, 25827–25835 CrossRef CAS.
- J. Cui, S. Liang, S. Sun, X. Zheng and J. Zhang, J. Phys.: Condens. Matter, 2018, 30, 175001 CrossRef PubMed.
- F. Ling, W. Li and L. Ye, Appl. Surf. Sci., 2019, 473, 386–392 CrossRef CAS.
- X. Yu, J. Xie, Q. Liu, H. Dong and Y. Li, Colloids Interface Sci., 2021, 593, 133–141 CrossRef CAS PubMed.
- Y. Fu, T. Huang, L. Zhang, J. Zhu and X. Wang, Nanoscale, 2015, 7, 13723–13733 RSC.
- K. Li, Z. Zeng, L. Yan, S. Luo, X. Luo, M. Huo and Y. Guo, Appl. Catal., B, 2015, 165, 428–437 CrossRef CAS.
- Z. Jin and L. Zhang, J. Mater. Sci. Technol., 2020, 49, 144–156 CrossRef.
- J. Liao, W. Cui, J. Li, J. Sheng, H. Wang, X. a Dong, P. Chen, G. Jiang, Z. Wang and F. Dong, Chem. Eng. J., 2020, 379, 122282 CrossRef CAS.
- Y. Li, M. Gu, T. Shi, W. Cui, X. Zhang, F. Dong, J. Cheng, J. Fan and K. Lv, Appl. Catal., B, 2020, 262, 118281 CrossRef CAS.
- K. M. Alam, P. Kumar, P. Kar, U. K. Thakur, S. Zeng, K. Cui and K. Shankar, Nanoscale Adv., 2019, 1, 1460–1471 RSC.
- X. Zhou, C. Shao, S. Yang, X. Li, X. Guo, X. Wang, X. Li and Y. Liu, ACS Sustainable Chem. Eng., 2018, 6, 2316–2323 CrossRef CAS.
- K. Dai, L. Lu, C. Liang, G. Zhu, Q. Liu, L. Geng and J. He, Dalton Trans., 2015, 44, 7903–7910 RSC.
- J. Jiang, Z. Mu, P. Zhao, H. Wang and Y. Lin, Mater. Chem. Phys., 2020, 252, 123194 CrossRef CAS.
- S. Vinoth, P. M. Rajaitha and A. Pandikumar, New J. Chem., 2021, 45, 2010–2018 RSC.
- W. Zhang, Z. Zhao, F. Dong and Y. Zhang, Chin. J. Catal., 2017, 38, 372–378 CrossRef CAS.
- X. Bai, L. Wang, R. Zong and Y. Zhu, J. Phys. Chem. C, 2013, 117, 9952–9961 CrossRef CAS.
- B. Lin, S. Chen, F. Dong and G. Yang, Nanoscale, 2017, 9, 5273–5279 RSC.
- T. Di, B. Zhu, B. Cheng, J. Yu and J. Xu, J. Catal., 2017, 352, 532–541 CrossRef CAS.
- X. Tan, X. Wang, H. Hang, D. Zhang, N. Zhang, Z. Xiao and H. Tao, Opt. Mater., 2019, 96, 109266 CrossRef CAS.
- Y. Zhang, S.-M. Zhao, Q.-W. Su and J.-L. Xu, Rare Met., 2019, 40, 96–104 CrossRef CAS.
- R. Hao, G. Wang, H. Tang, L. Sun, C. Xu and D. Han, Appl. Catal., 2016, 187, 47–58 CrossRef CAS.
- X. Xiao and W.-D. Zhang, RSC Adv., 2011, 1, 1099–1105 RSC.
- X. Xiao, R. Hao, M. Liang, X. Zuo, J. Nan, L. Li and W. Zhang, J. Hazard. Mater., 2012, 233–234, 122–130 CrossRef CAS PubMed.
- X. Yu, J. Yang, K. Ye, X. Fu, Y. Zhu and Y. Zhang, Inorg. Chem. Commun., 2016, 71, 45–49 CrossRef CAS.
- Q. Xu, L. Zhang, J. Yu, S. Wageh, A. A. Al-Ghamdi and M. Jaroniec, Mater. Today, 2018, 21, 1042–1063 CrossRef CAS.
- J. Bai, Y. Li, P. Wei, J. Liu, W. Chen and L. Liu, Small, 2019, 15, e1900020 CrossRef PubMed.
- S. Han, J. Li, K. Yang and J. Lin, Chin. J. Catal., 2015, 36, 2119–2126 CrossRef CAS.
- S. Juntrapirom, D. Tantraviwat, S. Suntalelat, O. Thongsook, S. Phanichphant and B. Inceesungvorn, J. Colloid Interface Sci., 2017, 504, 711–720 CrossRef CAS PubMed.
- X.-J. Wen, C.-G. Niu, L. Zhang, C. Liang and G.-M. Zeng, J. Catal., 2017, 356, 283–299 CrossRef CAS.
- S. Guo, H. Luo, Y. Li, J. Chen, B. Mou, X. Shi and G. Sun, J. Alloys Compd., 2021, 852, 157026 CrossRef CAS.
- H. An, B. Lin, C. Xue, X. Yan, Y. Dai, J. Wei and G. Yang, Chin. J. Catal., 2018, 39, 654–663 CrossRef CAS.
- J. Zhang, J. Fu, Z. Wang, B. Cheng, K. Dai and W. Ho, J. Alloys Compd., 2018, 766, 841–850 CrossRef CAS.
- J. Di, J. Xia, S. Yin, H. Xu, L. Xu, Y. Xu, M. He and H. Li, J. Mater. Chem. A, 2014, 2, 5340–5351 RSC.
- R. He, K. Cheng, Z. Wei, S. Zhang and D. Xu, Appl. Surf. Sci., 2019, 465, 964–972 CrossRef CAS.
- N. Tian, H. Huang, S. Wang, T. Zhang, X. Du and Y. Zhang, Appl. Catal., B, 2020, 267, 118697 CrossRef CAS.
- H. Zhang, J. Yang, L. Guo, R. Wang, S. Peng, J. Wang, J. Wan and J. Xu, Chem. Phys. Lett., 2021, 762, 138143 CrossRef CAS.
- J. Hou, T. Jiang, X. Wang, G. Zhang, J.-J. Zou and C. Cao, J. Cleaner Prod., 2021, 287, 125072 CrossRef CAS.
- C. R. Chen, X. D. Wang, S. L. Wang, J. L. Zhang and B. Z. Tian, ChemistrySelect, 2020, 5, 15084–15090 CrossRef CAS.
- R. Wang, J. Wu, X. Mao, J. Wang, Q. Liu, Y. Qi, P. He, X. Qi, G. Liu and Y. Guan, Appl. Surf. Sci., 2021, 556, 149804 CrossRef CAS.
- J. C. Wang, H. C. Yao, Z. Y. Fan, L. Zhang, J. S. Wang, S. Q. Zang and Z. J. Li, ACS Appl. Mater. Interfaces, 2016, 8, 3765–3775 CrossRef CAS PubMed.
- G. Kresse and J. Furthmuller, Phys. Rev. B: Condens. Matter Mater. Phys., 1996, 54, 11169–11186 CrossRef CAS PubMed.
- G. Kresse and J. Furthmüller, Comput. Mater. Sci., 1996, 6, 15–50 CrossRef CAS.
- J. P. Perdew, K. Burke and M. Ernzerhof, Phys. Rev. Lett., 1996, 77, 3865–3868 CrossRef CAS PubMed.
- S. Grimme, S. Ehrlich and L. Goerigk, J. Comput. Chem., 2011, 32, 1456–1465 CrossRef CAS PubMed.
- Z. Zhang, Q. Qian, B. Li and K. J. Chen, ACS Appl. Mater. Interfaces, 2018, 10, 17419–17426 CrossRef CAS PubMed.
- J. Heyd, G. E. Scuseria and M. Ernzerhof, J. Chem. Phys., 2003, 118, 8207–8215 CrossRef CAS.
- C. Chang, H.-C. Yang, N. Gao and S.-Y. Lu, J. Alloys Compd., 2018, 738, 138–144 CrossRef CAS.
- H. Guo, Z. Zhang, B. Huang, X. Wang, H. Niu, Y. Guo, B. Li, R. Zheng and H. Wu, Nanoscale, 2020, 12, 20025–20032 RSC.
- L. Matthes, P. Gori, O. Pulci and F. Bechstedt, Phys. Rev. B: Condens. Matter Mater. Phys., 2013, 87, 035438 CrossRef.
- V. Wang, N. Xu, J.-C. Liu, G. Tang and W.-T. Geng, Comput. Phys. Commun., 2021, 267, 108033 CrossRef CAS.
- G. Di Liberto, L. A. Cipriano, S. Tosoni and G. Pacchioni, Chemistry, 2021, 27, 13306–13317 CrossRef CAS PubMed.
- T. Jing, Y. Dai, X. Ma, W. Wei and B. Huang, Phys. Chem. Chem. Phys., 2016, 18, 7261–7268 RSC.
- T. Kong, X. Wei, G. Zhu and Y. Huang, J. Mater. Sci., 2017, 52, 5686–5695 CrossRef CAS.
- M.-Y. Yan, Z.-Y. Jiang, J.-M. Zheng, Y.-M. Lin and Z.-Y. Zhang, Appl. Surf. Sci., 2020, 531, 147318 CrossRef CAS.
- B. Kong, Z. Liu, J. Wang, T. Chen, M. Zhang, T. Zeng and W. Wang, J. Phys. Chem. C, 2022, 126, 11788–11799 CrossRef CAS.
- H. Chen, J. Zhao, X. Wang, X. Chen, Z. Zhang and M. Hua, Nanoscale, 2022, 14, 5551–5560 RSC.
- J. Wang, Y. Huang, J. Guo, J. Zhang, X. Wei and F. Ma, J. Solid State Chem., 2020, 284, 121181 CrossRef CAS.
- J. Yun, Y. Zhang, Y. Ren, P. Kang, J. Yan, W. Zhao, Z. Zhang and H. Guo, Sol. Energy Mater. Sol. Cells, 2020, 210, 110516 CrossRef CAS.
- Z. Zhang, B. Huang, Q. Qian, Z. Gao, X. Tang and B. Li, APL Mater., 2020, 8, 041114 CrossRef CAS.
- J. Liu, B. Cheng and J. Yu, Phys. Chem. Chem. Phys., 2016, 18, 31175–31183 RSC.
- W. Yao, J. Zhang, Y. Wang and F. Ren, Appl. Surf. Sci., 2018, 435, 1351–1360 CrossRef CAS.
- J. Abdul Nasir, A. Munir, N. Ahmad, T. U. Haq, Z. Khan and Z. Rehman, Adv. Mater., 2021, 33, e2105195 CrossRef PubMed.
- L. Zhang, J. Zhang, H. Yu and J. Yu, Adv. Mater., 2022, 34, e2107668 CrossRef PubMed.
- X. Li, C. Garlisi, Q. Guan, S. Anwer, K. Al-Ali, G. Palmisano and L. Zheng, Mater. Today, 2021, 47, 75–107 CrossRef CAS.
- X. Jiang, Q. Gao, X. Xu, G. Xu, D. Li, B. Cui, D. Liu and F. Qu, Phys. Chem. Chem. Phys., 2021, 23, 21641–21651 RSC.
- Y. Liu, P. Lv, W. Zhou and J. Hong, J. Phys. Chem. C, 2020, 124, 9696–9702 CrossRef CAS.
- S. Tian, Y. F. Ding, M. Q. Cai, L. Chen, C. T. Au and S. F. Yin, Phys. Chem. Chem. Phys., 2021, 23, 17894–17903 RSC.
- M. Dong, J. Zhang and J. Yu, APL Mater., 2015, 3, 104404 CrossRef.
|
| This journal is © the Owner Societies 2023 |
Click here to see how this site uses Cookies. View our privacy policy here. 
 a,
Jincheng
Wang
a,
Jincheng
Wang