Phosphorus doped and defect modified graphitic carbon nitride for boosting photocatalytic hydrogen production†
Lu
Chen
 *a,
Guiyang
Yan
 a,
Xiyao
Liu
a,
Shaoming
Ying
a,
Xiyao
Liu
a,
Shaoming
Ying
 a,
Yuzhou
Xia
a,
Shangbo
Ning
a,
Yuzhou
Xia
a,
Shangbo
Ning
 *b and
Xuxu
Wang
 *c
*c
aDepartment of Chemistry, Fujian Province University Key Laboratory of Green Energy and Environment Catalysis, Ningde Normal University, Ningde 352100, P. R. China
bHebei Key of Optic-electronic information and materials, the college of physics science and technology, Hebei University, Baoding, 071002, P. R. China
cState Key Laboratory of Photocatalysis on Energy and Environment, Fuzhou University, Fuzhou 350002, P. R. China
First published on 28th November 2022
Abstract
The enhancement of photogenerated carrier separation efficiency is a significant factor in the improvement of photocatalyst performance in photocatalytic hydrogen evolution. Heteroatom doping and defect construction have been considered valid methods to boost the photocatalytic activity of graphitic carbon nitride. Herein, we report graphitic carbon nitride modified with P doping and N defects (PCNx), and the effects of doping and defects were investigated in photocatalytic H2 evolution. Its hydrogen evolution rate can reach up to about 59.1 μmol h−1, which is more than 123.1 times higher than pristine graphitic carbon nitride under visible light irradiation. Importantly, the apparent quantum efficiency reaches 8.73% at 420 nm. The excellent performance of the PCNx photocatalyst was attributed to the following aspects: (I) the large BET surface area of PCNx affords more active sites for H2 production and (II) the introduction of P and N defects can accelerate the charge carrier separation and transfer efficiency, leading to more efficient photocatalytic hydrogen production. The photocatalyst showed obviously enhanced activities.
1. Introduction
Hydrogen is one of the most promising energy carriers for replacing nonrenewable and toxic energy sources due to its high energy density and zero carbon emissions.1–3 Photocatalytic water splitting is widely considered as a prospective way to store solar energy as green hydrogen energy and developing semiconductor photocatalysts with high activity and good stability is a critical requirement for realizing efficient energy conversion. Up to now, among various researched photocatalysts, graphitic carbon nitride is of particular interest due to its nontoxicity, chemical stability, low cost, and appealing electronic properties.4–6 However, the photocatalytic performance of g-C3N4 was hindered by various factors. The major constraints of g-C3N4 are the limited quick recombination of photogenerated carriers, insufficient visible light response, low specific surface area, and sluggish reaction kinetics.7,8 Therefore, it is of significant interest to construct a novel g-C3N4 photocatalyst with enhanced charge separation, a narrower band gap, and migration along with a large surface area.To date, much research has been dedicated to enhancing the photocatalytic activity of pristine g-C3N4 such as the construction of heterojunctions with other semiconductors,9,10 elemental doping,11,12 cocatalyst loadings,13–15 electronic structure modification,16 nanostructure design,5,17 defect engineering,18–20 dye sensitization and molecule incorporation.21 Particularly, the heteroatom doping of g-C3N4 was developed recently as an effective method to increase photocatalytic activity. The heteroatom doping strategy plays a significant role in tuning the electronic structure, extending the light-harvesting, accelerating the charge separation and creating more active sites. Doping elements with different electronegativities into g-C3N4 can improve the electronic structure to improve the separation and accumulation of photogenerated carriers. Several elements have been successfully doped into the g-C3N4 framework such as B, Br, S and O.22–26 Recently, many studies reported that phosphorus doping could enhance the photocatalytic performance of g-C3N4, which was attributed to the electron-rich P atom being able to act as an electron donor. For example, Xu et al. reported P doped into a g-C3N4 framework to form P–N bands, which exhibited an accelerated charge transfer efficiency and enhanced hydrogen evolution.27 Qiao et al. reported a novel method combining P doping and thermal exfoliation to construct novel porous P-doped g-C3N4 nanosheets, which exhibited a large surface area and a shortened charge migration to surface length.28 Besides single elemental doping, introducing defects seems to be an effective strategy to enhance photocatalytic performance.
Nitrogen defects in g-C3N4 play a significant role in modifying the energy band structure to introduce additional energy levels and expand the light absorption range. Meanwhile, the defects can serve as trapping sites to enhance charge carrier separation. For instance, Zhu et al. prepared a g-C3N4 system with abundant nitrogen defects through a thermal polycondensation strategy to reveal the role of trap states, which exhibited a 20-fold enhanced H2 evolution efficiency relative to pristine g-C3N4.29 Novel bridging-nitrogen defects modified holey graphitic carbon nitride nanosheets were prepared via solid-state polymerization and successively thermal annealing with melamine and HMTA for photocatalytic hydrogen production by Tang et al.30 However, the photocatalytic performance of a single defect modification is poor. Thus, it is imperative to find a novel and efficient method to simultaneously modify the elemental doping and defects in g-C3N4.
In summary, phosphorus doping and nitrogen defects modification in g-C3N4 synergistically enhance hydrogen production. Compared with pristine g-C3N4, the PCNx photocatalyst shows a remarkable photocatalytic hydrogen production rate of 59.1 μmol h−1, almost 123.1 times higher than that of g-C3N4, achieving an apparent quantum efficiency of 8.73% under visible light of 420 nm. Meanwhile, the photocatalyst was subjected to 5 successive cycles and exhibited excellent photostability. This outstanding photocatalytic activity is ascribed to the enhanced surface area and decreased conduction band position. Experimental results indicate that phosphorus replaced C to form a P–N species and nitrogen defects regulated the electronic structure of g-C3N4, thus accelerating separation of the photogenerated electron–hole pairs. This work provided a novel strategy to employ P and nitrogen defects into the g-C3N4 framework to tune the electronic structure and facilitate separation of photogenerated carriers.
Catalyst preparation
Materials: melamine (C3H6N6), H2PtCl6·6H2O (purity: 37.5 wt% Pt basis), potassium chloride (KCl), lithium chloride monohydrate (LiCl·H2O) and 2-aminoethylphosphonic acid (AEP) were purchased from Sinopharm Chemical Reagent Co., Ltd. FTO glass was purchased from Wuhan Jinge-Solar Energy Technology Co., Ltd.Catalyst characterization
The crystal structure of the photocatalyst can be examined by a Bruker D8 advanced X-ray diffractometer with Cu Kα radiation. The morphology and microstructure of the samples were observed by a field-emission scanning electron microscope (FE-SEM, JEOL JSM-6701F) and Tecnai Model G2 F20 S-TWIN instrument. X-ray photoelectron spectroscopy measurements were conducted on a VG ESCALAB 250 spectrometer with a monochromatized Al Kα X-ray source. All the binding energies were calibrated by the adventitious C 1s peak at 284.8 eV. The BET specific surface area was determined by nitrogen adsorption–desorption isothermal measurements at 77 k. The UV-vis absorption spectra were measured on a Cary 500 spectrophotometer using BaSO4 as the reflectance standard. FTIR spectra were recorded on a Nicolet 670 within the wavenumber range of 400–4000 nm. Raman spectra were measured on an Invia Reflex Raman Microscope with an incident laser wavelength of 325 nm. The photoluminescence (PL) was measured on a FL/FS 920 TCSPC fluorescence spectrophotometer with a 400 nm excitation wavelength.Photoelectrochemical measurements
Photoelectrochemical measurements were performed with a three-electrode cell using an electrochemical workstation (ZAHNES CAB120) with a Pt wire as the counter electrode and Ag/AgCl (saturated KCl) as the reference electrode. The working electrode was prepared by injecting a photocatalyst solution onto a FTO glass substrate and drying in air. The transient photocurrent test was measured in the Na2SO4 electrolyte (0.5 M). The electrochemical impedance spectra (EIS) were also tested over a frequency range of 0.01–105 Hz. A 10 mM K3[Fe(CN)6]/K4[Fe(CN)6] aqueous solution was the electrolyte.Photocatalytic test
The photocatalytic hydrogen evolution experiment was carried out in a Pyrex reaction cell connected to a closed gas circulation and evacuation system (Labsolar 6A, Perfectlight, Beijing, China). 30 mg of the photocatalyst was dispersed in 100 ml of aqueous solution containing 10% triethanolamine (TEOA) as a sacrificial agent and 0.26 g NaCl. 3 wt% Pt (theoretical amount) was loaded onto the photocatalysts as the co-catalyst by an in situ photo-deposition method (1 h) with H2PtCl6·6H2O as the precursor. The reactor was evacuated for 30 min to remove the air before the photocatalytic test. The reactor cell temperature was maintained at 5 °C and irradiated by a 300 W Xenon lamp equipped with a 420 nm cut-off filter. The production of gases was conducted by an online gas chromatography (PANNA, A91, Ar carrier TCD detector, China).The apparent quantum efficiency (AQE) for hydrogen evolution was measured under the same conditions. The reactor was irradiated by a 300 W xenon lamp equipped with a 420, 450, 500 and 600 nm bandpass filter. The following equation is used to calculate AQE:
2. Results and discussion
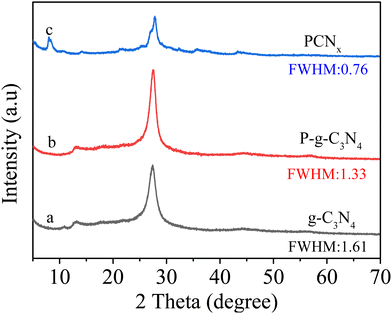
The PCNx sample was prepared in a two-step procedure (Scheme 1). In the first step, the melamine and 2-aminoethylphosphonic acid underwent thermal polymerization into a P-g-C3N4 photocatalyst; then, the P-g-C3N4 mixture with LiCl and KCl was annealed at 550 °C for 4 h under an N2 atmosphere; finally, the obtained PCNx sample was washed with boiled water and dried under vacuum overnight.The crystal structure of photocatalysts was examined by X-ray diffraction (XRD). As shown in Fig. 1a, the g-C3N4 sample exhibits two strong diffraction peaks at 27° and 13° corresponding to the (002) and (100) crystal facets, which was attributed to the interfacial stacking and in-planar packing of the g-C3N4 nanosheets.31–33 After P doping g-C3N4, the P-g-C3N4 sample has similar XRD patterns compared with pristine g-C3N4, and this means that P doping does not change the crystal structure of g-C3N4 (Fig. 1b). However, the intensity of these two peaks becomes lower and the peak broadens, which was ascribed to the P doping reducing the crystallinity of g-C3N4. Obviously, through the molten salt (LiCl/KCl) treatment, the (002) and (100) peaks locations of the P-g-C3N4 sample are shifted from 27° and 13° to 28° and 8°, which corresponds to the enhanced interaction among the layers and enlarged in-plane periodicity, respectively.34 Moreover, the PCNx photocatalyst maintains a layered structure after molten salt treatment. However, the in-plane periodicity of PCNx is different from the g-C3N4, indicating the reconstruction of the in-plane structure.35 In addition, the full width at half maximum (FWHM) of PCNx is obviously narrower than the P-g-C3N4 and g-C3N4 samples, revealing that the molten salts treatment can effectively solve the problem of g-C3N4 crystallinity reduction after P doping.
The morphology and microstructure of g-C3N4, P-g-C3N4 and PCNx samples were characterized by SEM and TEM. Fig. 2(a and b) shows the pristine g-C3N4 with several congregated layers. As shown in Fig S1 (ESI†), the P-g-C3N4 sample consists of stacked nanosheets, which further confirms that P doping did not change the g-C3N4 morphology substantially. As displayed in Fig. 2c, the PCNx sample consists of small fragments of two-dimensional (2D) nanosheets. The specific surface area of PCNx is 38.56 m2 g−1, which is 3.2 and 6.15 times higher than that of P-g-C3N4 and g-C3N4. The large surface area provides more active sites, facilitates mass transfer, and enhances photocatalytic activity (see the ESI† Fig. S2). The HRTEM images of PCNx are shown in Fig. 2d. The lattice fringe spacing was 1.04 nm, which could be indexed to the (100) plane. Furthermore, the element mapping of the PCNx sample displayed the distribution ions of elements C, N and P, which further confirmed that P was successfully doped into the g-C3N4 framework (Fig. 2e).
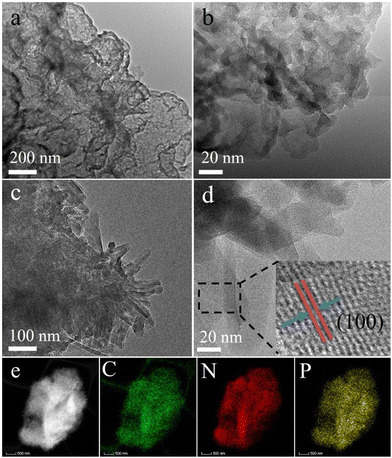 | ||
| Fig. 2 Typical TEM and HRTEM images of (a and b) g-C3N4 and (c and d) PCNx and (e) EDX mapping of the representative PCNx nanostructure. | ||
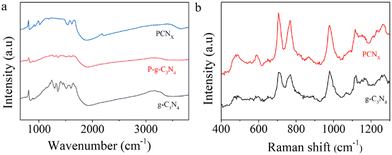
The molecular structures of the photocatalysts were evaluated by FTIR spectra and Raman spectra. As shown in Fig. 3a, the peaks in the range of 1200–1700 cm−1 were assigned to the aromatic C–N and C![[double bond, length as m-dash]](https://www.rsc.org/images/entities/char_e001.gif) N stretching vibrational model.36 The peak at 810 cm−1 belongs to heptazine heterocyclic ring (C6N7) heterocycles.37 The peak located at 3000–3500 cm−1 was ascribed to the vibrational absorptions of N–H bonds.38 After P doping g-C3N4, the FTIR signal of P-g-C3N4 and g-C3N4 showed a similar molecule structure. However, after the molten salt treatment, the PCNx sample spectrum showed several new peaks located at 990, 1150 and 2160 cm−1. The sharp peaks located at 990 and 1150 cm−1 can be assigned to the symmetric and asymmetric vibrations of NC2 bonds.39 The peak located at 2160 cm−1 was attributed to the asymmetric stretching vibration of the cyano groups.40,41Fig. 3b shows the Raman spectra of g-C3N4 and PCNx samples. The Raman peaks located at 703 and 982 cm−1 were ascribed to the in-plane bending vibration mode of heptazine linkage and symmetric N-breathing mode of heptazine units.42 In addition, the broad and asymmetric peaks from 1200 to 1300 cm−1 were assigned to C–N stretching vibrations.43,44 Moreover, the peak intensities of the PCNx sample were weaker than those of g-C3N4, revealing that the g-C3N4 crystallinity can be controlled by the molten salt method.
N stretching vibrational model.36 The peak at 810 cm−1 belongs to heptazine heterocyclic ring (C6N7) heterocycles.37 The peak located at 3000–3500 cm−1 was ascribed to the vibrational absorptions of N–H bonds.38 After P doping g-C3N4, the FTIR signal of P-g-C3N4 and g-C3N4 showed a similar molecule structure. However, after the molten salt treatment, the PCNx sample spectrum showed several new peaks located at 990, 1150 and 2160 cm−1. The sharp peaks located at 990 and 1150 cm−1 can be assigned to the symmetric and asymmetric vibrations of NC2 bonds.39 The peak located at 2160 cm−1 was attributed to the asymmetric stretching vibration of the cyano groups.40,41Fig. 3b shows the Raman spectra of g-C3N4 and PCNx samples. The Raman peaks located at 703 and 982 cm−1 were ascribed to the in-plane bending vibration mode of heptazine linkage and symmetric N-breathing mode of heptazine units.42 In addition, the broad and asymmetric peaks from 1200 to 1300 cm−1 were assigned to C–N stretching vibrations.43,44 Moreover, the peak intensities of the PCNx sample were weaker than those of g-C3N4, revealing that the g-C3N4 crystallinity can be controlled by the molten salt method.
To gain insight into the surface chemical composition and valence state of the elements in the photocatalyst, high-resolution C 1s and N 1s XPS spectra of g-C3N4 and PCNx photocatalysts were obtained. In addition, the signal of P 2p was observed in PCNx. The peak position in all of the XPS spectra was calibrated with C 1s at 284.8 eV. As shown in Fig. 4a, it can be seen that the g-C3N4 sample has three C1s peaks located at 284.8, 286.6 and 288.35 eV. The peak located at 284.8 eV can be ascribed to the physically absorbed carbon species or sp2 C–C bonds.45 The peak centered at 286.6 eV is assigned to the C–NH2 species, while the strong peak located at 288.35 eV corresponds to the sp2-bond carbon (N–C![[double bond, length as m-dash]](https://www.rsc.org/images/entities/char_e001.gif) N) of the g-C3N4 aromatic ring.46,47 As displayed in Fig. 4b, the N 1s high resolution spectra can be fitted into four peaks. The peak located at 398.75 eV is due to the sp2 hybridized nitrogen (C–N
N) of the g-C3N4 aromatic ring.46,47 As displayed in Fig. 4b, the N 1s high resolution spectra can be fitted into four peaks. The peak located at 398.75 eV is due to the sp2 hybridized nitrogen (C–N![[double bond, length as m-dash]](https://www.rsc.org/images/entities/char_e001.gif) C group),48 while the peak centered at 400.4 eV is related to the tertiary N (C3–N or C2–N–H).49 The peak centered at around 401.4 eV could be indexed to the positive charge localization in heterocycles N−H. In addition, the peak at 404.55 eV is ascribed to the amino functional group (C–N–H).50–52 Compared with pristine g-C3N4, the C1s and N1s binding energies of the PCNx sample were downshifted to a low binding energy. This phenomenon reveals that the P doping and nitrogen defect changes the surface electronic distribution. In Fig. 4d, the high-resolution P 2p spectra is fitted with a peak at 133.2 eV, which corresponds to the P–N bonds.53–55 The rapid charge carriers transfer was attributed to the P doping and defect modification, which could enhance g-C3N4 conductivity.
C group),48 while the peak centered at 400.4 eV is related to the tertiary N (C3–N or C2–N–H).49 The peak centered at around 401.4 eV could be indexed to the positive charge localization in heterocycles N−H. In addition, the peak at 404.55 eV is ascribed to the amino functional group (C–N–H).50–52 Compared with pristine g-C3N4, the C1s and N1s binding energies of the PCNx sample were downshifted to a low binding energy. This phenomenon reveals that the P doping and nitrogen defect changes the surface electronic distribution. In Fig. 4d, the high-resolution P 2p spectra is fitted with a peak at 133.2 eV, which corresponds to the P–N bonds.53–55 The rapid charge carriers transfer was attributed to the P doping and defect modification, which could enhance g-C3N4 conductivity.
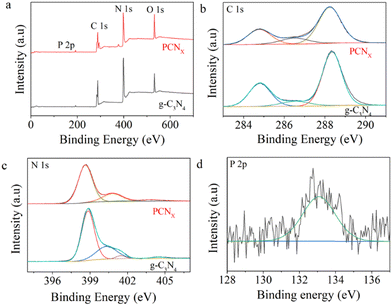 | ||
| Fig. 4 High-resolution XPS spectra of (a) survey, (b) C 1s, (c) N 1s, and (d) P 2p of g-C3N4 and PCNx samples. | ||
The UV-vis diffuse reflection spectra of pristine g-C3N4 and PCNx are shown in Fig. 5a. The light intense absorption peak of g-C3N4 is located at around 450 nm. The phosphorus-doping induced enhancement of visible light absorption. After the molten salt treatment, the absorption edge of PCNx exhibits a blue shift, which is attributed to the quantum effect. Meanwhile, the photocatalyst color changes from light yellow to brown (see the ESI,† Fig S3). The band gaps of pristine g-C3N4 and PCNx were obtained from the Kubelka–Munk plots. As depicted in Fig. 5b, the band gaps of g-C3N4 and PCNx were calculated as 2.75 and 2.72 eV, respectively. As shown in Fig. 5c, the VB potential of g-C3N4 and PCNx was detected by VB-XPS. According to the VB-XPS plots of g-C3N4 and PCNx, the VB potential of g-C3N4 and PCNx was calculated to be 2.0 and 1.85 eV, respectively. Therefore, the VB value of g-C3N4 and PCNx was measured as 2.1 and 1.95 eV, respectively, following the equation:
| EVB-NHE = ψ + EVB-XPS − 4.44 | (1) |
| ECB = EVB − Eg | (2) |
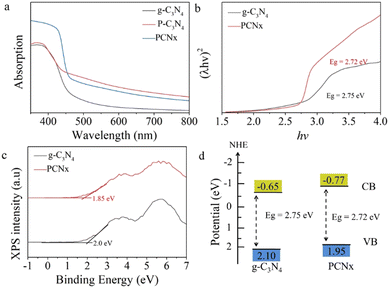 | ||
| Fig. 5 Optical properties: (a) UV-vis DRS spectra of g-C3N4, P-g-C3N4 and PCNx, (b) (λhν)2versus hν curves, (c) VB XPS spectra, and (d) band structure of g-C3N4 and PCNx samples. | ||
According to eqn (2), the conduction band of g-C3N4 and PCNx were calculated to be −0.65 and −0.77 eV (Fig. 5d), respectively. The conduction band shift means that the electrons in the conduction band possess a more reductive ability, which will be favorable for hydrogen generation.
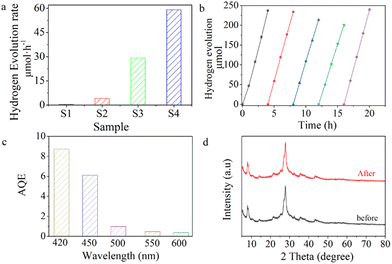
The photocatalytic hydrogen evolution performance of g-C3N4 and PCNx was examined with TEOA (10%) as a sacrificial agent and Pt (3 wt%) as a cocatalyst reagent under visible light irradiation. As shown in Fig. 6a, the hydrogen production of PCNx is about 59.1 μmol h−1, which is about 2, 14.3 and 123.1 times higher than that of CNx (29.1 μmol h−1), P-g-C3N4 (4.14 μmol h−1) and g-C3N4 (0.48 μmol h−1). The stability of the photocatalyst is an important parameter. As shown in Fig. 6b, it was subjected to 5 consecutive cycles of photocatalytic stability measurements. Each cycle lasted for four hours. It can be seen that the photocatalytic hydrogen evolution activity was reduced after the fourth cycle, which was attributed to the consumption of the sacrificial agent during the reaction. The hydrogen evolution rate recovers when fresh sacrificial agent is used for the 5th cycle's activity test, indicating that the PCNx sample shows an excellent photostability. The apparent quantum efficiencies are displayed in Fig. 6c, it can be seen that the AQE values of PCNx are 8.73, 6.12, 0.98, 0.47 and 0.37% at 420, 450, 500, 550 and 600 nm, respectively. The trends of the apparent quantum efficiencies were in good agreement with the UV-vis absorption spectra of PCNx, which confirms the important role of visible light absorption in determining the photocatalytic H2 evolution activity. From the XRD patterns, no obvious change can be observed when comparing the used and fresh PCNx, indicating the crystal structure of PCNx was maintained after the reaction (Fig. 6b).
The presence of structure defects is further examined by electron paramagnetic resonance (EPR) spectra. The EPR symmetrical signal at g = 2.003 can be assigned to the unpaired electrons on the aromatic rings. The g-C3N4, P-g-C3N4, CNx and PCNx samples show a single Lorentzian line. The EPR signals of PCNx were stronger than those of g-C3N4 and P-g-C3N4, providing higher delocalization of the conjugated network, which might be assigned to the partial elimination of nitrogen atoms (Fig. 7a). The nitrogen defects could perform as shallow trapping sites to promote charge separation, which is beneficial to photocatalysis.
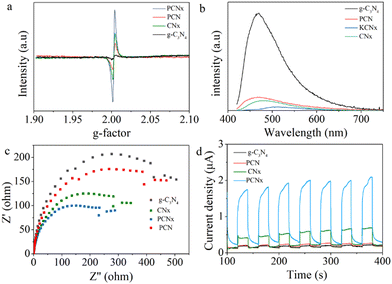 | ||
| Fig. 7 (a) EPR spectra, (b) PL spectra and (c and d) electrochemical analysis of g-C3N4, P-g-C3N4, KCNx and KCNx samples. | ||
To further demonstrate the separation and transfer efficiency of charge carriers, photoluminescence (PL) spectra were obtained. The excitation wavelength of the photocatalysts is 400 nm according to the previous reference. As shown in Fig. 7b, the g-C3N4 sample exhibits a higher PL emission peak. This may be due to the fast recombination of the photogenerated hole and electron pairs. The intensity of PL for PCNx is lower than that of g-C3N4, P-g-C3N4, and CNx, indicating that P doping and nitrogen defects could accelerate the separation of photogenerated carriers, thus the photocatalyst has the best photocatalytic activity.
To further gain insight into the charge transfer behavior in the photocatalysts, we studied the photocurrent response and electrochemical impedance spectroscopy of g-C3N4, P-g-C3N4, CNx and PCNx samples. As shown in Fig. 7c, the photocurrent response for PCNx was remarkably higher than that of pristine g-C3N4, P-g-C3N4 and CNx, which was attributed to the rapid separation and transfer of photogenerated carriers. Meanwhile, the PCNx sample exhibits a smaller arc radius than g-C3N4, P-g-C3N4 and CNx, revealing that the PCNx sample has a higher migration rate of photogenerated electron and smaller electron transfer resistance (Fig. 7d).
In conclusion, we have designed novel phosphorus doped and nitrogen defect modified g-C3N4 for H2 evolution. The PCNx sample exhibited an apparent quantum efficiency (AQE) of 8.73% at 420 nm and an excellent H2 production rate of 59.1 μmol h−1, which was 123.1, 14.3 and 2 times higher than that of g-C3N4, P-g-C3N4 and CNx samples. Moreover, the PCNx sample also shows excellent photocatalytic stability for five consecutive cycles. The excellent photocatalytic activity was attributed to the large surface area, enhanced visible light absorption, and much accelerated charge carrier separation and transfer. This work provides a new facile strategy to develop element doped and nitrogen defect modified graphitic carbon nitride with superior photocatalytic performance.
Conflicts of interest
There are no conflicts to declare.Acknowledgements
This work is funded by the National Nature Science Foundation of China (22108129), Natural Science Foundation of Fujian Province (2021J05253 and 2020J05225), and the Scientific Research Fund project of Ningde Normal University (2021Y05, 2021Q102, 2021ZDK09, 2019T03, and 2019Y15).References
- F. Chen, C. Wu, G. Zheng, L. Qu and Q. Han, Chin. J. Catal., 2022, 43, 1216–1229 CrossRef CAS.
- H. Chen, H. Shuang, W. Lin, X. Li, Z. Zhang, J. Li and J. Fu, ACS Catal., 2021, 11, 6193–6199 CrossRef CAS.
- L. Chen, Y. Zhao, J. Yang, D. Liu, X. Wei, X. Wang and Y. Zheng, Inorg. Chem., 2020, 59, 1566–1575 CrossRef CAS PubMed.
- X. Bai, X. Wang, X. Lu, S. Hou, B. Sun, C. Wang, T. Jia and S. Yang, CrystEngComm, 2021, 23, 1366–1376 RSC.
- V. Balakumar, R. Manivannan, C. Chuaicham, S. Karthikeyan and K. Sasaki, Chem. Commun., 2021, 57, 6772–6775 RSC.
- A. Beyhaqi, S. M. T. Azimi, Z. Chen, C. Hu and Q. Zeng, Int. J. Hydrogen. Energy, 2021, 46, 20547–20559 CrossRef CAS.
- H. Dong, X. Zhang, Y. Zuo, N. Song, X. Xin, B. Zheng, J. Sun, G. Chen and C. Li, Appl. Catal., A, 2020, 590, 117367 CrossRef CAS.
- S. Gao, X. Wang, C. Song, S. Zhou, F. Yang and Y. Kong, Appl. Catal., B, 2021, 295, 120272 CrossRef CAS.
- B. Chong, L. Chen, D. Han, L. Wang, L. Feng, Q. Li, C. Li and W. Wang, Chin. J. Catal., 2019, 40, 959–968 CrossRef CAS.
- W. Shi, M. Li, X. Huang, H. Ren, C. Yan and F. Guo, Chem. Eng. J., 2020, 382, 122960 CrossRef CAS.
- L. Chen, Y. Wang, S. Cheng, X. Zhao, J. Zhang, Z. Ao, C. Zhao, B. Li, S. Wang, S. Wang and H. Sun, Appl. Catal., B, 2022, 303, 120932 CrossRef CAS.
- L. Chen, D. Zhu, J. Li, X. Wang, J. Zhu, P. S. Francis and Y. Zheng, Appl. Catal., B, 2020, 273, 119050 CrossRef CAS.
- Z. Chen, K. Xia, X. She, Z. Mo, S. Zhao, J. Yi, Y. Xu, H. Chen, H. Xu and H. Li, Appl. Surf. Sci., 2018, 447, 732–739 CrossRef CAS.
- Z. Liang, S. Yang, X. Wang, H. Cui, X. Wang and J. Tian, Appl. Catal., B, 2020, 274, 119114 CrossRef CAS.
- L. Chen, H. Huang, Y. Zheng, W. Sun, Y. Zhao, P. S. Francis and X. Wang, Dalton Trans., 2018, 47, 12188–12196 RSC.
- L. Lei, W. Wang, Y. Shang, J. Li, A. Kumar Yadav, H. Wang, Q. Li and H. Fan, Appl. Surf. Sci., 2021, 563, 1150384 CrossRef.
- X. Chen, X. Li, X. Li, H. Lu, L. Wang, Q. Liu, H. Li, J. Ding, H. Wan and G. Guan, J. Mater. Chem. A, 2021, 9, 20664–20675 RSC.
- L. Chen, S. Ning, R. Liang, Y. Xia, R. Huang, G. Yan and X. Wang, Int. J. Hydrogen. Energy, 2022, 47, 14044–14052 CrossRef CAS.
- M. Luo, Q. Yang, W. Yang, J. Wang, F. He, K. Liu, H. Cao and H. Yan, Small, 2020, 16, 2001100 CrossRef CAS PubMed.
- Z. Yang, Y. Zhang, H. Zhang, J. Zhao, H. Shi, M. Zhang, H. Yang, Z. Zheng and P. Yang, J. Catal., 2022, 409, 12–23 CrossRef CAS.
- J. Xu, Y. Li, S. Peng, G. Lu and S. Li, Phys. Chem. Chem. Phys., 2013, 15, 7657–7665 RSC.
- H. Guo, Z. Shu, D. Chen, Y. Tan, J. Zhou, F. Meng and T. Li, Chem. Phys., 2020, 533, 110714 CrossRef CAS.
- Y. Hou, H. Guan, J. Yu and S. Cao, Appl. Surf. Sci., 2021, 563, 150310 CrossRef CAS.
- M. Wang, Y. Zeng, G. Dong and C. Wang, Chin. J. Catal., 2020, 41, 1498–1510 CrossRef CAS.
- P. Wang, C. Guo, S. Hou, X. Zhao, L. Wu, Y. Pei, Y. Zhang, J. Gao and J. Xu, J. Alloys Compd., 2018, 769, 503–511 CrossRef CAS.
- P. Babu, S. Mohanty, B. Naik and K. Parida, ACS Appl. Energy Mater., 2018, 1, 5936–5947 CrossRef.
- X.-X. Fang, L.-B. Ma, K. Liang, S.-J. Zhao, Y.-F. Jiang, C. Ling, T. Zhao, T.-Y. Cheang and A.-W. Xu, J. Mater. Chem. A, 2019, 7, 11506–11512 RSC.
- J. Ran, T. Y. Ma, G. Gao, X.-W. Du and S. Z. Qiao, Energy Environ. Sci., 2015, 8, 3708–3717 RSC.
- W. Li, Z. Wei, K. Zhu, W. Wei, J. Yang, J. Jing, D. L. Phillips and Y. Zhu, Appl. Catal., B, 2022, 306, 121142 CrossRef CAS.
- L. Luo, K. Wang, Z. Gong, H. Zhu, J. Ma, L. Xiong and J. Tang, Int. J. Hydrogen. Energy, 2021, 46, 27014–27025 CrossRef CAS.
- Z. Pan, M. Liu, G. Zhang, H. Zhuzhang and X. Wang, J. Phys. Chem. C, 2021, 125, 9818–9826 CrossRef CAS.
- R. Shen, J. Xie, X. Lu, X. Chen and X. Li, ACS Sustainable Chem. Eng., 2018, 6, 4026–4036 CrossRef CAS.
- S. Wang, X. Wang, B. Liu, X. Xiao, L. Wang and W. Huang, J. Colloid Interface Sci., 2022, 610, 495–503 CrossRef CAS PubMed.
- G. Zhang, Y. Xu, D. Yan, C. He, Y. Li, X. Ren, P. Zhang and H. Mi, ACS Catal., 2021, 11, 6995–7005 CrossRef CAS.
- Y. Wang, S. Zhao, Y. Zhang, J. Fang, Y. Zhou, S. Yuan, C. Zhang and W. Chen, Appl. Surf. Sci., 2018, 440, 258–265 CrossRef CAS.
- R. Zheng, C. Li, K. Huang, Y. Guan, B. Sun, W. Wang, L. Wang and J. Bian, Inorg. Chem. Front., 2021, 8, 2518–2531 RSC.
- J. Zhang, M. Zhang, C. Yang and X. Wang, Adv. Mater., 2014, 26, 4121–4126 CrossRef CAS PubMed.
- Y. Zhou, C. Liao, Y. Fan, S. Ma, M. Su, Z. Zhou, T.-S. Chan, Y.-R. Lu and K. Shih, Environ. Sci.: Nano, 2019, 6, 3324–3335 RSC.
- G. Zhang, L. Lin, G. Li, Y. Zhang, A. Savateev, S. Zafeiratos, X. Wang and M. Antonietti, Angew. Chem., Int. Ed., 2018, 57, 9372–9376 CrossRef CAS PubMed.
- L. Lin, H. Ou, Y. Zhang and X. Wang, ACS Catal., 2016, 6, 3921–3931 CrossRef CAS.
- L. Lin, W. Ren, C. Wang, A. M. Asiri, J. Zhang and X. Wang, Appl. Catal., B, 2018, 231, 234–241 CrossRef CAS.
- L. Chen, S. Ning, R. Liang, Y. Xia, R. Huang, G. Yan and X. Wang, Int. J. Hydrogen. Energy, 2022, 47, 14044–14052 CrossRef CAS.
- L. Chen, D. Zhu, J. Li, X. Wang, J. Zhu, P. S. Francis and Y. Zheng, Appl. Catal., B, 2020, 273, 119050 CrossRef CAS.
- B. Liu, L. Ye, R. Wang, J. Yang, Y. Zhang, R. Guan, L. Tian and X. Chen, ACS Appl. Mater. Interfaces, 2018, 10, 4001–4009 CrossRef CAS.
- P. Zhou, X. Meng, L. Li and T. Sun, J. Alloys Compd., 2020, 827, 154259 CrossRef CAS.
- T. Yu, T. Xie, W. Zhou, Y. Zhang, Y. Chen, B. Shao, W.-Q. Guo and X. Tan, ACS Sustainable Chem. Eng., 2021, 9, 7529–7540 CrossRef CAS.
- J. Zhang, S. Shao, D. Zhou, T. Di and T. Wang, ACS Appl. Energy Mater., 2021, 4, 6340–6347 CAS.
- C. Zhang, D. Qin, Y. Zhou, F. Qin, H. Wang, W. Wang, Y. Yang and G. Zeng, Appl. Catal., B, 2022, 303, 120904 CrossRef CAS.
- H. Zhai, P. Tan, L. Lu, H. Liu, Y. Liu and J. Pan, Catal. Sci. Technol., 2021, 11, 3914–3924 RSC.
- P. Yang, H. Ou, Y. Fang and X. Wang, Angew. Chem., Int. Ed., 2017, 56, 3992–3996 CrossRef CAS PubMed.
- B. Yang, Z. Wang, J. Zhao, X. Sun, R. Wang, G. Liao and X. Jia, Int. J. Hydrogen. Energy, 2021, 46, 25436–25447 CrossRef CAS.
- R. Shen, L. Zhang, N. Li, Z. Lou, T. Ma, P. Zhang, Y. Li and X. Li, ACS Catal., 2022, 12, 9994–10003 CrossRef CAS.
- L.-L. Liu, F. Chen, J.-H. Wu, W.-W. Li, J.-J. Chen and H.-Q. Yu, J. Mater. Chem. A, 2021, 9, 10933–10944 RSC.
- J. Ma, D. Jin, X. Yang, S. Sun, J. Zhou and R. Sun, Green Chem., 2021, 23, 4150–4160 RSC.
- R. Škuta, V. Matějka, K. Foniok, A. Smýkalová, D. Cvejn, R. Gabor, M. Kormunda, B. Smetana, V. Novák and P. Praus, Appl. Surf. Sci., 2021, 552, 149490 CrossRef.
Footnote |
| † Electronic supplementary information (ESI) available. See DOI: https://doi.org/10.1039/d2cp04791h |
| This journal is © the Owner Societies 2023 |


