
Photocatalytic disinfection of S. aureus using black TiO2−x under visible light
Lachlan
Campbell
,
Song Ha
Nguyen
,
Hayden K.
Webb
and
Daniel S.
Eldridge
 *
*
Department of Chemistry and Biotechnology, Swinburne University of Technology, PO Box 218, Hawthorn 3122, Australia. E-mail: deldridge@swin.edu.au
First published on 18th November 2022
Abstract
Bacteria, alongside many other microbial pathogens, have long been a threat to human health, and the evolution of antibiotic resistant bacteria presents a significant public health crisis. Effective and persistent disinfection and sterilization techniques are required to prevent the spread of pathogenic microorganisms. Photocatalytic materials that are not depleted on activation can meet these criteria and thereby be suitable for the disinfection of air, water and surfaces. This study reports on photocatalytic black TiO2−x (b-TiO2−x) with disinfecting abilities when activated by visible light. The photocatalytic black TiO2−x material was produced through a sol–gel combustion process. Characterization of the material demonstrated increased light harvesting capabilities when compared to commercially available anatase and rutile TiO2, with evidence of an amorphous/anatase structure and high surface area (343 m2 g−1). The synthesized b-TiO2−x proved capable of breaking down the organic dye methylene blue in only visible light, removing ∼78% of the dye in 210 minutes and ∼98% over the course of 24 hours. The b-TiO2−x also proved capable of completely sterilizing a ∼1.5 × 10³ CFU mL−1 solution of Staphylococcus aureus (ATCC25923), suspended in phosphate buffered saline (PBS), under visible light activation, demonstrating the potential for TiO2−x substances as antibacterial materials.
Introduction
The photocatalytic properties of titanium dioxide (TiO2) have been extensively researched since the observation of enhanced water splitting in 1972.1 This widespread research has led to applications in self-cleaning/anti-fogging and self-disinfecting coatings,2,3 hydrogen evolution,4,5 and dye-sensitized solar cells6 among others. The potential applications in environmental remediation, specifically in clean hydrogen fuel development by water splitting2,3,7,8 and water purification3,9,10 are an area of significant interest. These photocatalytic systems, however, have not been heavily commercialized due to limitations of the material.One major issue has been that TiO2 only exhibits photocatalytic activity under ultraviolet light. This heavily reduces its ability in solar light, which only contains ∼5% UV light11,12 and also limits its application in indoor environments. Doping of TiO2 with both metals and non-metals has been used to decrease the band gap and enhance visible light absorption.4,14–18 This can potentially make more effective materials, however, can also lead to issues with increasing electron–hole pair recombination (and thereby reduced catalytic efficiency) and increased material costs, especially with noble metal doping.4,16,19
In 2011, black titania was developed by Chen et al. and has been successfully used as an alternative to doped materials.20 As indicated by the colour, these materials have the ability to absorb light across the visible spectrum and into the IR region. After eleven years there are now many methods for developing black TiO2−x (b-TiO2−x) materials4 with synthesis-dependent structures and properties. The relevant differentiating characteristics of black-TiO2−x which have been identified to date are the development of surface defects containing one or more of: oxygen vacancies, titanium in lower oxidation states, other Magneli phases of titanium oxide, Ti–OH and Ti–H groups.19,21–23 These materials have been proven as effective photocatalysts in both visible and UV light, and are employed in established photocatalytic applications.4,8,24–26
The antimicrobial effects of conventional TiO2 materials have been well established, with the first such observations by Matsunaga et al. in 1985 (ref. 27) against E. coli and other bacterial species. Since then, TiO2 has been shown to be active against various microorganisms.14,15,28–30 Reactive oxygen species (ROS), developed on the surface of photocatalytic materials under irradiation, are thought to be the cause of these biocidal effects, inducing oxidation of cell membrane components.31–34 The mechanisms by which photocatalysts generate ROS have been well established:12,35 when light of sufficient energy irradiates a photocatalytic material there is a chance for electron–hole pair (EHP) formation. If these charge carriers can migrate to the surface of the material, they can generate redox reactions with water and molecular oxygen. The ROS generated from these reactions include superoxides, peroxides and hydroxyl radicals which provide the biocidal action.
As TiO2 only presents photocatalytic properties under ultraviolet light, its benefit as an antibacterial agent is limited, as UV irradiation is a well-established method for disinfection without the need for a photocatalyst.36 The b-TiO2−x however offers the possibility of photocatalytic disinfection without the need for UV light. This material could help lead the development of enhanced water treatment systems and self-disinfecting surfaces that could be used without the need for solar light or UV to be activated. This could extend its uses by helping reduce microbial load in environments such as hospitals, public bathrooms, childcare and aged care facilities among other places where vulnerable communities reside.
Until now, there is little information reported on any antimicrobial activity that black titania may have. The aim of this study was to develop a sample of b-TiO2−x using a facile, sol–gel method, that not only shows photocatalytic activity when exposed to visible light alone, but also acts as an effective antimicrobial under the same conditions. To assess this, the material was tested for its antibacterial efficacy against a common strain of Staphylococcus aureus under visible light.
Experimental
Black titania synthesis
The synthesis method was adapted from Zuo et al.37 with minor changes to the reducing agent, replacing 2-ethylimidazole with imidazole and decreasing the combustion temperature. A 10 g mass of absolute ethanol (Chem-Supply), 2.9 g of 32% HCl (Chem-Supply), and 1.6 g of imidazole (Sigma Aldrich) were mixed in a 200 mL beaker using a magnetic stirrer. Once a clear solution was formed, 2.0 g of titanium tetraisopropoxide (Chem-Supply 194702500) was added to the solution, dropwise. Mixing continued until a gel was formed. The gel was transferred to a crucible and placed in a muffle furnace, initially at room temperature. The heat was then increased at 5 °C min−1 to 300 °C and left for 5 hours to undergo combustion. The product was then removed from the furnace, cleaned, and ground into a fine powder using a mortar and pestle. The cleaning process involved sequentially washing the particles with distilled water, absolute ethanol, and diethyl ether, separating by centrifugation after each wash. The b-TiO2−x product was emptied onto a filter paper and dried using a vacuum pump. Anatase material (Merck 14027) and rutile samples were used as comparative materials for various characterizations. The rutile material was taken from stock synthesized in previous work.38Characterization
X-ray diffraction (XRD) analysis was conducted using a Bruker D8-Advance with a Cu X-ray source. The scan range and step size were 5–80° and 0.02° respectively with a 5 second collection time per step and at operating voltage and current of 40 kV and 40 mA respectively.Reflectance spectra were recorded using an Agilent Cary Eclipse spectrometer with fibre optic coupler. A synchronous scan was performed at 450 V between 350–800 nm. The probe was immersed in the solid material before collecting a spectrum and all data is reported as the intensity of light reflected.
Fourier Transform Infrared (FTIR) spectra were recorded using a Nicolet iS5 spectrometer. KBr pellets were made with anatase and rutile TiO2 at a ratio of 1![[thin space (1/6-em)]](https://www.rsc.org/images/entities/char_2009.gif) :100, and with b-TiO2−x at a ratio of 1:500 (sample:KBr). The decreased concentration for the black materials was deemed necessary due to the darker colour and reduced transmittance observed. Transmittance data was collected over 50 scans at a resolution of 4 cm−1.
:100, and with b-TiO2−x at a ratio of 1:500 (sample:KBr). The decreased concentration for the black materials was deemed necessary due to the darker colour and reduced transmittance observed. Transmittance data was collected over 50 scans at a resolution of 4 cm−1.
The specific surface area of the synthesized b-TiO2−x and TiO2 powders were determined by nitrogen gas adsorption and subsequent use of Brunauer Emmett Teller (BET) theory over the relative pressure range, P/P0 = 0.05–0.35. Pore size distribution data were calculated using the Barrett–Joyner–Halenda (BJH) model. The instrument was a Micromeritics Tristar II Plus with a Micromeritics Smart VacPrep for degassing at 110 °C. Between 0.1 and 0.3 g of the TiO2 and b-TiO2−x powders were accurately weighed for each analysis.
Reactive oxygen species detection
Aromatic hydroxylation of various compounds has been used in the past for the quantification of hydroxyl radicals.39–42 Aromatic hydroxylation of benzoic acid and subsequent fluorescence of the products, 2-, 3- and 4-hydroxybenzoic acid was used to prove development of hydroxyl radicals (˙OH) under visible light. A 50 mL sample of 0.4 mM benzoic acid (Unilab) solution was added to a beaker with ∼5 mg of b-TiO2−x. The suspension was stirred using a magnetic stirrer and irradiated under a 19 W, 2300 lumen Philips LED ‘cool daylight’ bulb for 24 h. Fluorescence spectroscopy was performed using a Cary Eclipse fluorescence spectrometer with an excitation wavelength of 305.93 nm, scanning for emission between 310 and 500 nm.Photocatalytic efficiency
Photocatalytic abilities were measured by degradation of the dye methylene blue (MB). This procedure has become standard practice when screening for photoreductive properties,12,24,43 despite some documented concerns,44 which have been accounted for in this study through aromatic hydroxylation experiments.39–42 Degradation took place under a 19 W, 2300 lumen Philips LED ‘cool daylight’ bulb. These LED bulbs have a colour temperature of 6500 K and do not emit UV light.45 A Thermo Scientific Helios Epsilon spectrometer was set to 665 nm and used for the assessment of dye degradation. A 100 mL portion of 0.01 mM MB solution was placed in a 250 mL beaker and 5 mg of b-TiO2−x was added to the solution. The suspension was mixed using a magnetic stirrer. Adsorption is an important consideration in these experiments, as dyes have been shown to readily adsorb onto a wide range of materials.46 A 60-minute dark time was used to allow for adsorption equilibrium to be reached before irradiation under the light source. The optical absorption was measured every 30 minutes over the course of 210 minutes after the light source was activated. After these data were collected, the experiment was left to run for a total of 24 hours to determine the extent of methylene blue degradation. A blank was also conducted in the absence of any TiO2 material to confirm that light alone did not result in photodegradation.Photoinduced antibacterial activity
Antibacterial activity was assessed based on the method used by Matsunaga et al.,27 and testing was conducted in a nutrient-poor phosphate-buffered saline (PBS) solution against Gram-positive Staphylococcus aureus (ATCC 25923). S. aureus has in the past proven to be susceptible to photocatalytic mechanisms and was therefore considered a good candidate to begin testing the b-TiO2−x material.47,48 The bacteria were cultured on nutrient agar plates and then suspended in 50 mL of PBS at a final concentration of ∼1500 CFU mL−1. A 2.5 mg mass of b-TiO2−x was added to the suspension, which was then irradiated under the same conditions as the dye degradation assay. Aliquots of 0.1 mL of the suspension were taken and spread onto triplicate nutrient agar plates per condition, every 60 minutes over the course of 9 hours. The plates were then wrapped in aluminium foil to avoid further light exposure and incubated for 18–24 hours at 37 °C, before counting the resulting colonies. Control experiments were performed in complete darkness as well as under illumination in the absence of b-TiO2−x.Results and discussion
The properties of the b-TiO2−x are related to its ability to absorb visible light. One of the immediately apparent signs of this capability is related to the physical appearance of the material. Fig. 1 shows photos of the anatase, rutile and the b-TiO2−x (pre- and post-grinding with the mortar and pestle). The anatase and rutile TiO2 samples are white in colour, whilst the b-TiO2−x has presented a much darker black colouration pre-grinding and a dark brown powder post grinding. This change in colour is expected to be attributed to the surface defects formed in these materials, including surface hydroxyl groups, oxygen vacancies, Ti–H bonds and the presence of Ti3+.4,49 The appearance of a dark colour is itself evidence of the material's ability to absorb photons across a wide range in the visible spectrum.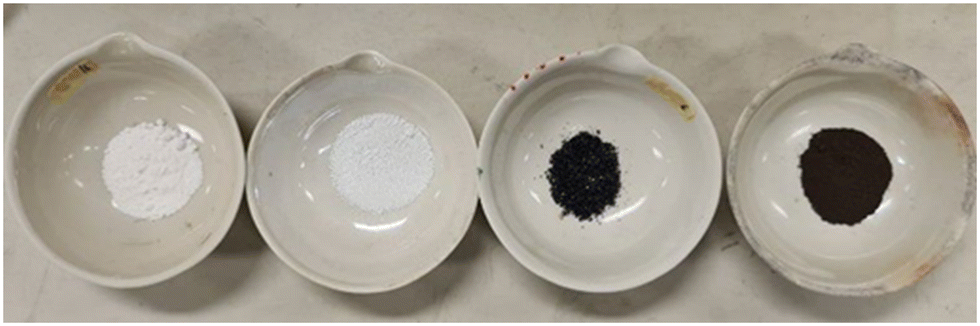 | ||
| Fig. 1 Left to right – anatase, rutile, b-TiO2−x pre-grind, b-TiO2−x post-grind. | ||
X-ray diffraction
The XRD diffraction patterns of b-TiO2−x, when compared with the anatase and rutile crystalline structures of TiO2 in Fig. 2, show some differences in crystallinity. The most notable features that appear in the b-TiO2−x are the noise and peak broadening compared to the anatase and rutile materials. The synthesis of TiO2−x material is expected to develop surface defects in the crystalline structure which are considered to be related to their desirable properties such as increased light absorption ability.19,21,23,50,51 These surface defects could be the cause of decreased crystallinity in the structure which would correspond with peak broadening and increased noise in the diffractogram.21,49,52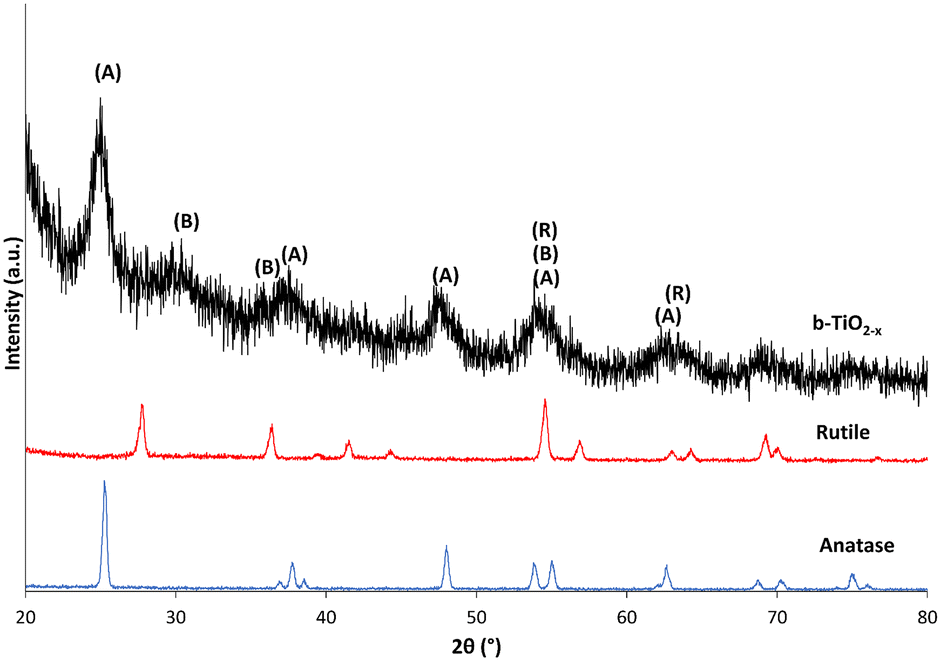 | ||
| Fig. 2 Diffractogram of b-TiO2−x, anatase and rutile samples between 20–80°. Intensity of anatase and rutile samples has been reduced by 90%. | ||
The limited crystallinity that is present appears to have developed in a mostly anatase structure. Whilst the peaks are all less defined than that of the pure material, most interatomic distances can be matched with the pure anatase spectra. The only peak which could not be directly compared to the anatase and rutile data developed at ∼30°. This peak is typical of the brookite spectrum, with some major defining and high intensity peaks for this structure occurring at 25.3°, 25.7°, 30.8°, 36.3° and 40.2° 2θ.53 This also may have contributed to band broadening observed at the 2θ values of approximately 25° and 38°. The definitive peaks for the b-TiO2−x appear similar to a diffractogram run by Chiarello et al.,54 which shows similar peak placement and broadening for an 82/18% anatase/brookite crystalline structure. Both the anatase and rutile structures correspond with defined peak values.55
Zuo et al.37 did find a mix of anatase and rutile crystal phase in their samples, with the rutile proportion increasing with increased use of 2-ethylimidazole. The difference in the current study may be due to the substitution of some reagents (namely, the imidazole), but most likely occurred due to the large difference in annealing temperatures (300 °C/500 °C). The temperature at which TiO2 is developed is known to impact the crystalline structure, particle size and other variables in these materials.56,57
Reflectance spectroscopy
The reflectance of electromagnetic radiation was examined to ascertain the b-TiO2−x sample's ability to absorb photons compared to anatase and rutile samples. Fig. 3 shows the intensity of the light reflected from the samples from 350–850 nm, encompassing the visible region (400–800 nm), as well as both UV-A (350–400 nm) and NIR (800–850 nm). Both the anatase and rutile spectra appear as expected, with the absorption edges of each measured at ∼375 nm and ∼410 nm respectively.24,58 Both materials are unable to absorb light effectively throughout the visible region of the spectrum and into the NIR region. Conversely, the b-TiO2−x sample shows a consistent ability to absorb throughout the UV-A and visible light regions and into the NIR region of the spectrum.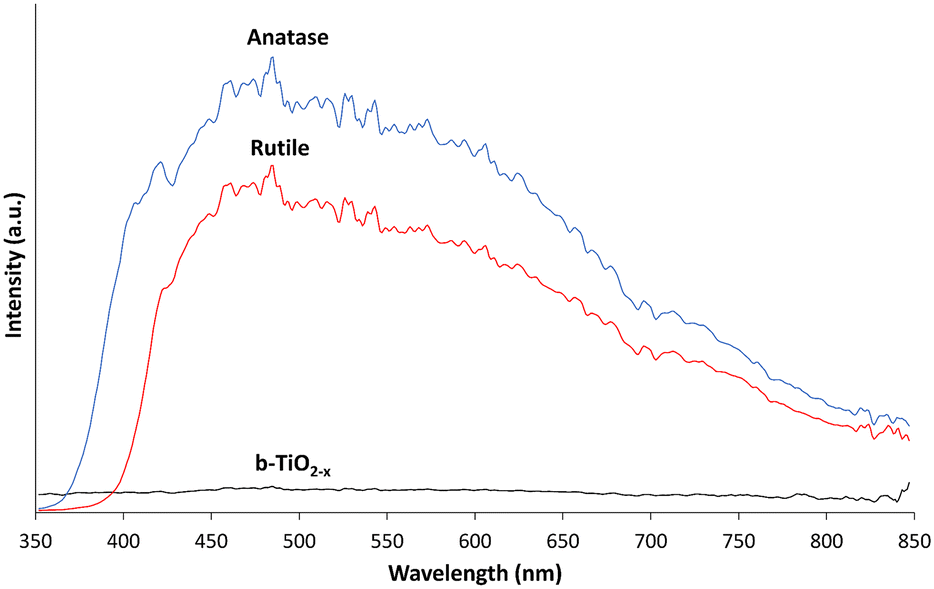 | ||
| Fig. 3 Reflectance spectra of b-TiO2−x, anatase and rutile samples from 350–850 nm smoothed over 6 nm. | ||
Absorption of photons across the UVA-Visible-NIR range is a highly desirable outcome, indicating that the material may have the potential to make use of a wide range of photon wavelengths during photoreactions. However, whilst this broad absorption profile is a desirable property of reduced TiO2 materials, the increased light absorption capabilities can be offset by other factors such as electron–hole pair recombination rates, which play a large factor in the efficacy of TiO2 materials.4,19,59 Direct photoreductive testing is required to prove its efficacy.
Fourier transform infrared spectroscopy
FTIR analysis was performed to investigate the chemical differences between the anatase and b-TiO2−x samples (Fig. 4). When forming the KBr pellets a decreased concentration of the black materials (5× lower) was deemed necessary due to the darker colour and reduced transmittance observed (data not shown).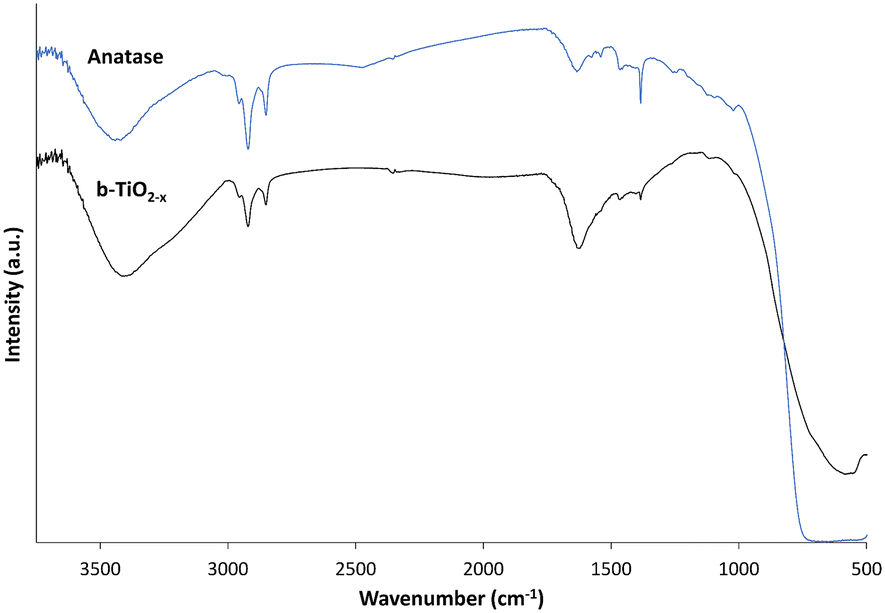 | ||
| Fig. 4 FTIR of b-TiO2−x and anatase TiO2. | ||
Both materials exhibit very similar features of absorption throughout the spectra. Each shows absorption bands at <1000 cm−1 appearing due to Ti–O symmetric stretching vibrations,60 and absorption bands for OH bending and stretching at ∼1630 cm−1 and ∼3400 cm−1 respectively. The b-TiO2−x material appears to present a more pronounced absorbance peak for the OH at ∼1630 cm−1 and a wider band at ∼3400 cm−1 than the anatase. Xia et al.61 presented a very similar example of a TiO2 with hydrogenated surface disorder, and attributed the wider band to a more diverse environment due to the surface disorder of the hydrogenated TiO2. The peaks appearing at ∼1380–1460 cm−1 and ∼2830–3000 cm−1 likely correspond to C–H interactions and show presence of hydrocarbon contamination.62 This contamination can be attributed to residues that have remained after the calcination process when synthesizing the b-TiO2−x, and can be seen in b-TiO2−x and other synthesized TiO2 materials.60,61,63 Carbon contamination in the commercial anatase was unexpected, however, there appear to be many instances in which hydrocarbon contamination has been previously observed in other commercial TiO2 samples.60,63–65
Surface area
Specific surface area has been shown to play an important role in improving optical absorption. Increasing surface area can strengthen the material's photocatalytic activity.48,66 This is due to the material having more reaction sites where ROS generation can occur. Increased concentration and the specific locations of defects such as Ti3+ in anatase can lead to larger specific surface area but are also deemed to be direct contributors to photocatalytic efficiency.67 Subsequently, surface area measurements indicate available surface area for ROS generation.The adsorption/desorption isotherms for N2 gas adsorption onto the b-TiO2−x are representative of a type IV isotherm (Fig. 5a), indicating that it is a mesoporous solid68 with the pore-size distribution being ∼5–12 nm (Fig. 5b). The shape of the hysteresis loop in Fig. 5a provides evidence of a narrow distribution of pore bodies with wide necks. This would contribute to the substantial increase in surface area compared to the other TiO2 materials. The anatase data (Fig. 5c) presents a type II isotherm, which is typical of a relatively non-porous material,68 and correlates well with the decrease in pore volume shown in Fig. 5d (note the differing scale) and the lower specific surface area (Table 1).
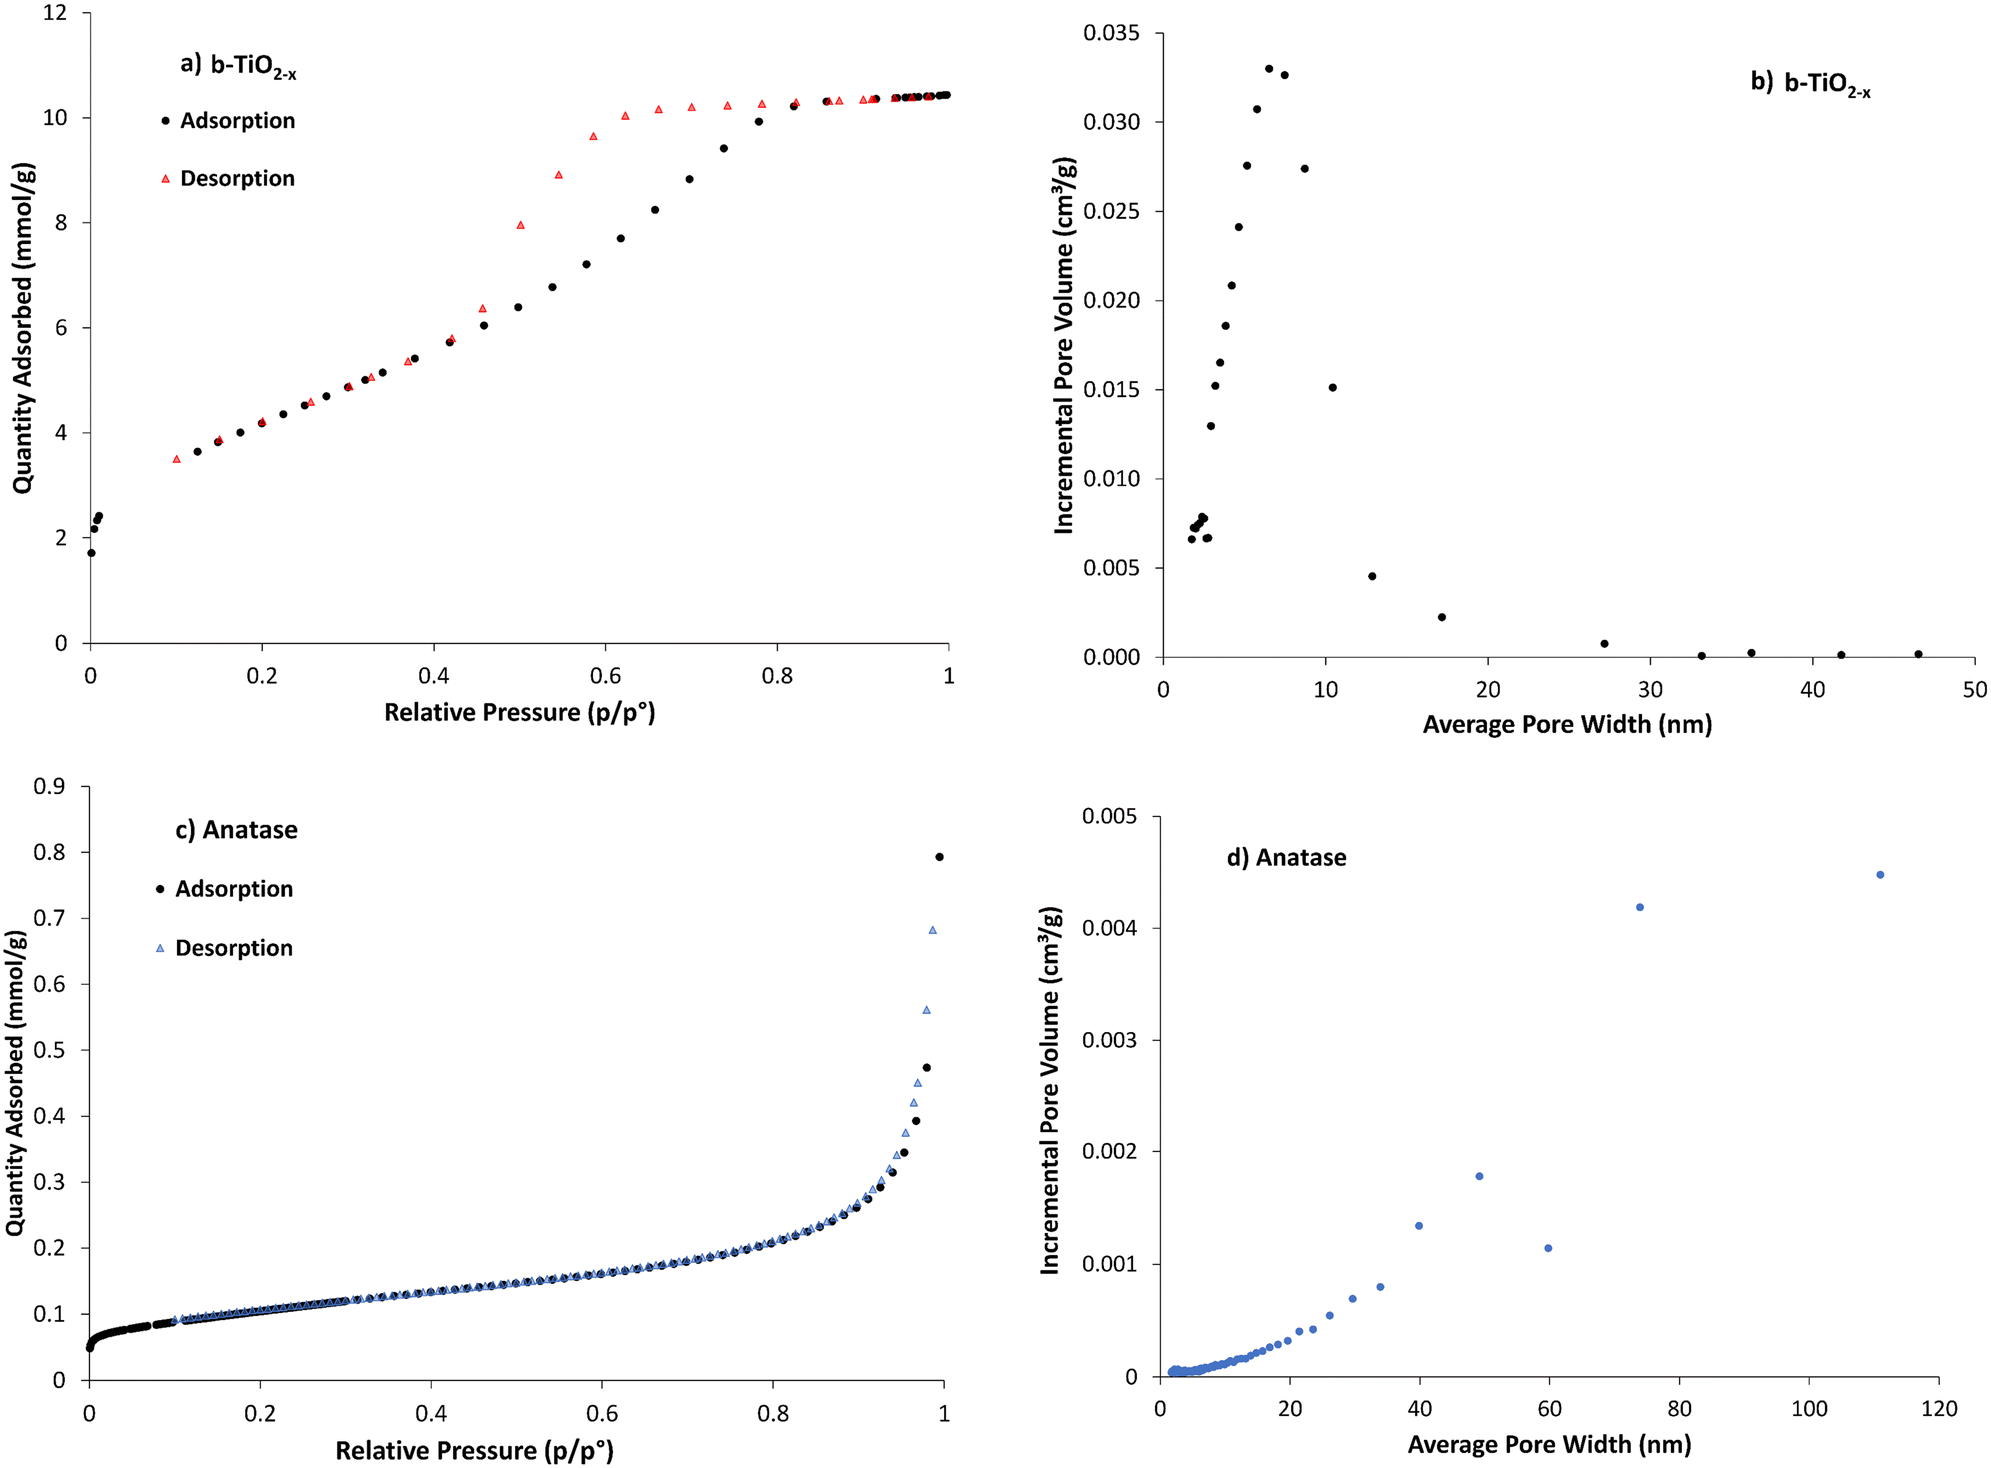 | ||
| Fig. 5 a) Adsorption isotherm and b) pore volume/distribution for b-TiO2−x, c) adsorption isotherm and d) pore volume/distribution for anatase TiO2 – pore volume/distribution graphs (b and d), use different scales on x–y axis. | ||
| Sample | BET surface area (m2 g−1) |
|---|---|
| Anatase | 8.4 |
| Rutile | 14.3 (ref. 38) |
| Black TiO2−x | 345 |
The surface area of TiO2 synthesized throughout the literature is wide ranging and can depend on many variables throughout the synthesis process. The anatase and rutile used in this study were found to be 8.4 and 14.3 m2 g−1 respectively, which are typical values for these materials,38,66 particularly so for the anatase when compared to others using the same source. The b-TiO2−x material was found to possess a considerably higher surface area of 345 m2 g−1. This is not outside materials ranging from ∼11 m2 g−1 (ref. 38) to 543 m2 g−1.59 This increase in specific surface area is seen as a promising development for ROS generation.
Given the synthesis is based on the method from Zuo et al.,37 it is interesting to note the extreme difference in surface area (11 m2 g−1 compared with 345 m2 g−1). The amount of 2-ethylimidazole used in the synthesis of these materials may have directly impacted on the particle size and surface area. The replacement of this reducing agent with imidazole in the current synthesis is another possible reason for this difference. However, calcination time and temperature are also known to have an impact on crystallite size and surface area, as has been evidenced on many occasions.59,66 Higher temperatures/longer calcination periods can lead to larger crystals with a smaller surface area. The materials in this study were calcined at a temperature 200 °C less than those by Zuo et al.,37 providing another possible explanation for the substantial increase in surface area. Zou et al.59 showed an example of calcination time impacting the surface area of the prepared paramagnetic-oxygen-vacancy self-modified TiO2 material, with the surface area dropping by a factor of almost 2 between the 1 hour and 18 hour calcination times (48.5 m2 g−1 compared to 27.4 m2 g−1). Atitar et al.56 developed mesoporous TiO2 materials showing substantial increases in surface area and pore volume with decreasing calcination temperatures (165 m2 g−1 at 400 °C compared with 15 m2 g−1 at 800 °C).
Hydroxyl radical production
While methylene blue has become something of a standard when assessing photodegradation,12,24,43 studies have warned against its use as the sole indicator of photodegradation due to its potential ability to degrade via dye sensitisation.44 To account for this, further evidence of ROS generation is required. To provide evidence of the development of ROS (specifically ˙OH species), the aromatic hydroxylation of benzoic acid was conducted. Aromatic hydroxylation for the confirmation of ˙OH ROS can be completed with a number of different compounds.69,70 Benzoic acid was used in this case as the hydroxylation of the molecule leads to the production of three isomers of hydroxybenzoic acid, which can be monitored by fluorescence in the UV-visible spectrum.39–42Fig. 6 shows the fluorescence of a 0.4 mM benzoic acid solution before and after being mixed with ∼5 mg of b-TiO2−x material and irradiated with visible light for 24 hours.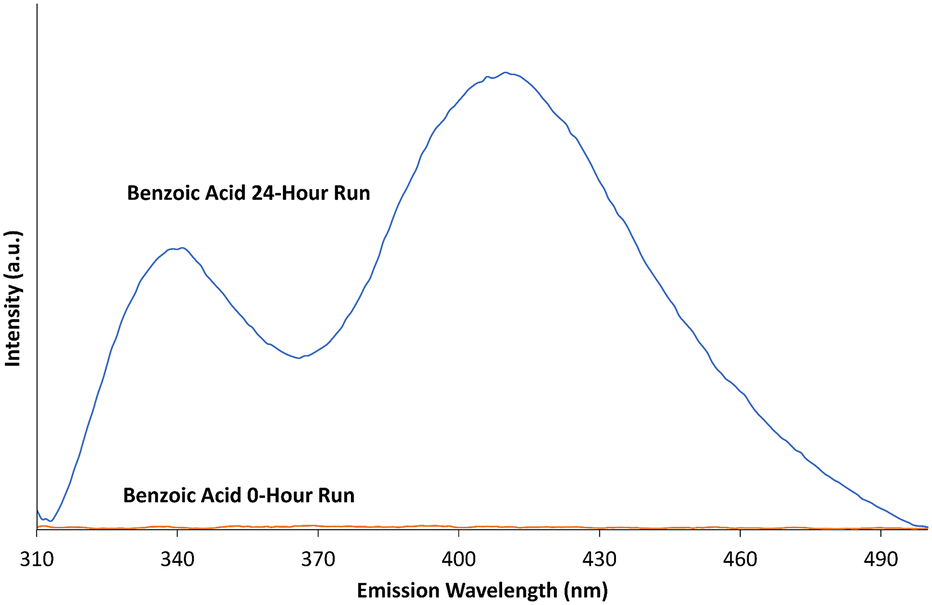 | ||
| Fig. 6 Fluorescence of benzoic acid before and after 24 hour photodegradation time in the presence of b-TiO2−x. Data smoothed over 5 nm. | ||
The fluorescence peaks at ∼340 and 408 nm closely match the fluorescence peaks for 2-, 3- and 4- hydroxybenzoic acid species.42,69 The multiple peaks provide evidence of a mixture of all three hydroxybenzoic acid isomers. With the initial benzoic acid solution showing no fluorescence, and given the production of the three hydroxybenzoic acid isomers after irradiation, the production of ˙OH reactive oxygen species by b-TiO2−x in visible light is confirmed.
Photodegradation of methylene blue
Photodegradation of organic dyes has been extensively used to test photocatalytic activity and efficiency of photocatalysts.13,24,25,49 In this study, MB degradation has been used primarily as a means of confirming the photocatalytic properties of the b-TiO2−x. A 50 mg L−1 concentration of the b-TiO2−x was chosen as higher concentrations of the powder have been detrimental to photocatalytic activity in suspension in the past.71 This is thought to be due to the increased particle density blocking light from interacting with particles deeper in the suspension.Data pertaining to the photodegradation of MB in the presence of anatase, rutile and the b-TiO2−x under visible light are shown in Fig. 7. When the b-TiO2−x/TiO2 material was added to the MB solution, 30 minutes of dark time was allowed to pass in order for any adsorption to occur. Any reduction in concentration prior to time zero in Fig. 7 is due to this adsorption process. The white anatase and rutile TiO2 samples only managed to degrade 4% and 6% of the MB respectively, over 120 minutes. The b-TiO2−x presented a ten-fold increase in efficiency over the same 2-hour period, degrading ∼49% of the dye. After 3.5 hours, an average of ∼78% of the MB was degraded with a peak degradation rate of 2.8 μM per hour. Zhu et al.72 was able to show similar results, degrading 50% of a methylene blue solution in 3 hours using a synthesized black brookite photocatalyst. Xin et al.67 was able to show an almost complete degradation of methylene blue under visible light with a self-doped black anatase TiO2−x sample.
 | ||
| Fig. 7 Methylene blue degradation under visible light by b-TiO2−x, anatase and rutile samples. Standard error used for error bars. | ||
The b-TiO2−x here has shown great promise in the photocatalytic degradation of methylene blue. It is difficult to directly compare these values to literature as the light sources for many of these experiments differ greatly from the 19 W commercially available LED used for these experiments to 300 W xenon globes using UV cutoff filters, simulated sunlight setups73 as well as direct sunlight.24 These large differences in power, as well as different wavelength outputs and dye concentrations, could cause changes in the efficiency of these photocatalysts. The study of photodegradation by reduced TiO2 would benefit from a systematic comparative assessment across multiple synthesised materials.
Whilst the b-TiO2−x shows enhanced activity in visible light, complete photodegradation of methylene blue does not take place in this 3 hour period. Instead, the MB appeared to be degrading into another product, appearing as a different shade of blue. This has been reported as possibly being azure A, a breakdown product likely formed during the known steps of photodegradation.74 Further evidence of this is shown in the UV-visible absorbance spectrum of the solution in Fig. 8, which closely matches that of azure A,75 showing a typical maximum at ∼623 nm, although the broader peak suggests methylene blue remains in the solution to some extent. Over a 24 hour irradiation period, the b-TiO2−x was able to remove 98.4% of the MB from the solution, although by-products do appear to remain in the solution, evidenced in Fig. 8. These by-products appear as a large peak in the UV-region, which match the next step in breakdown products after azure A suggested by Mondal et al.,74 and include acetanilide and mercaptobenzimidazole which show absorbance peaks between 200–330 nm76,77 and match the large peak shown by the post-degradation products between 200–350 nm in Fig. 8.
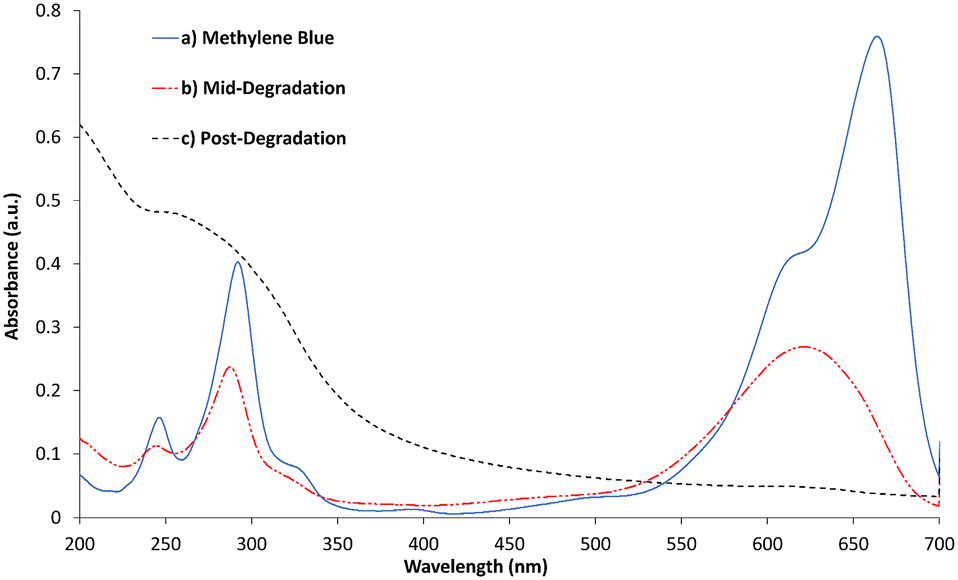 | ||
| Fig. 8 UV-visible absorbance of methylene blue, mid-degradation phase (3.5 hours) and post degradation (24 hours). | ||
Regeneration after methylene blue degradation
The b-TiO2 was tested for regeneration and re-use against fresh solutions of MB replaced every 24 hours and remained active throughout a seven day period as shown in Fig. 9. The material remained consistently able to degrade the MB solution over each 24 hour period. The MB solution was centrifuged after each 24 hour degradation period to allow for separation of the b-TiO2−x material which was then added into a fresh MB solution. The b-TiO2−x was tested again after storage for up to 6 months at room temperature and found to be similarly effective. This demonstrates that the b-TiO2−x material can be stored for long periods without losing any of its photocatalytic activity, similar to commercially available anatase and rutile products.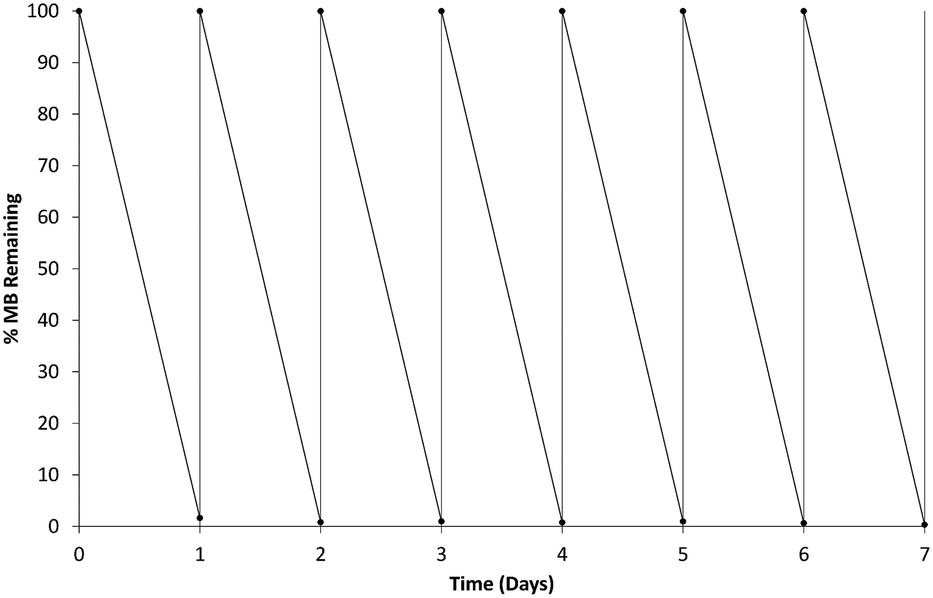 | ||
| Fig. 9 b-TiO2−x 24 hour methylene blue degradation and reusability testing. | ||
Photoinduced antibacterial activity
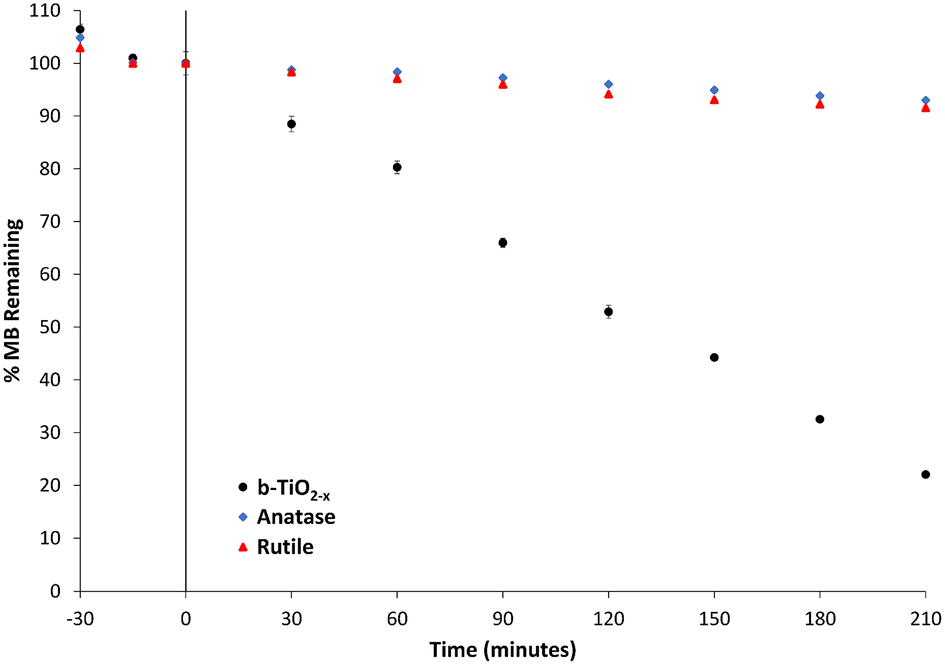
Fig. 10 shows the percentage of viable cells remaining as a function of time, after exposure to b-TiO2−x both under illumination and in the dark, as well as a test under illumination with visible light in the absence of b-TiO2−x. In PBS containing b-TiO2−x, under visible light, a gradual decline of viable cells is observed with complete sterilization of S. aureus occurring between 7–8 hours. Minimal decrease in cell numbers was observed in the absence of b-TiO2−x under the same conditions where the total surviving bacterial cells averaged 78%. No decrease at all was observed in the presence of b-TiO2−x when the solution was not irradiated with any light source.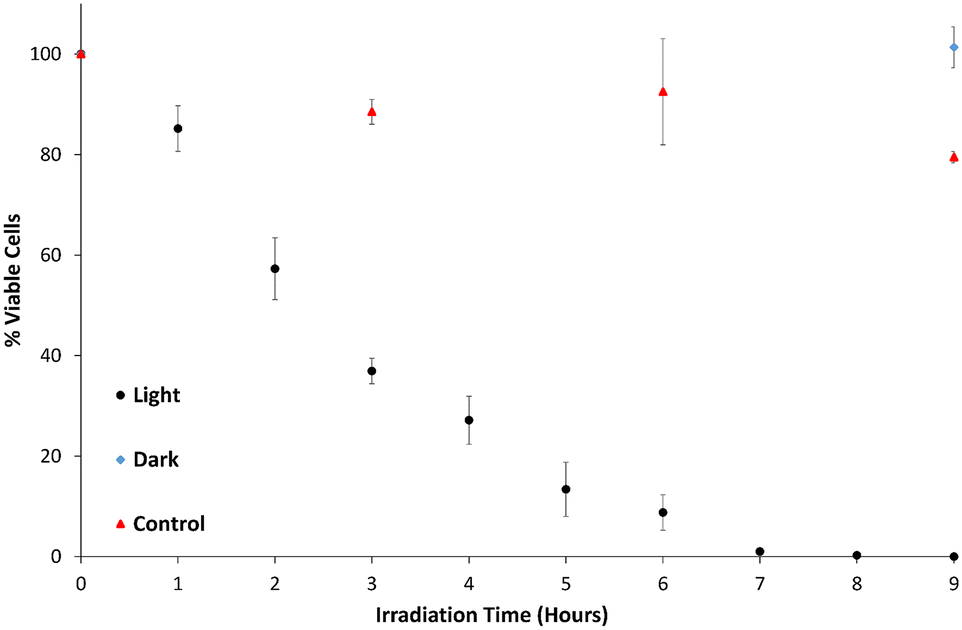 | ||
| Fig. 10 Percentage of viable cells in PBS solution under variable conditions – illumination in the presence of b-TiO2−x (light), in the presence of b-TiO2−x in the dark (dark) and illuminated in the absence of b-TiO2−x (control). Standard error used for error bars. | ||
As the viable cell count only substantially decreased in the illuminated suspensions containing the b-TiO2−x, it can be reasonably presumed that the cause of cell death is photocatalytic disinfection.78 The mechanism in which cell death occurs is almost certainly due to the development of ROS, which are thought to cause cell membrane damage via lipid peroxidation.31–34,71,79 Compromising the membrane may also allow the ROS to attack other important components inside the cells such as DNA and RNA.48,71 Given this mechanism of cell lysis, photocatalytic disinfection is considered a possible candidate for the elimination of antibiotic resistant bacteria.80
Visible-light photocatalysts have been tested as a technique for sterilization in the past.79–83 In a similar study, Ananpattarachai et al.,78 were able to show complete disinfection of E. coli and S. aureus using a nitrogen doped TiO2 in only visible light. Chen et al.,79 were able to achieve almost complete sterilization of E. coli and S. aureus over 80 minutes using a hydrogenated TiO2 film using a 350 W xenon lamp with UV cut off filter (<400 nm). Younas et al.81 used Ag-doped TiO2 particles to completely inactivate E. coli under visible light irradiation after 90 minutes, and only 30 minutes with the help of UV-A light. As with the methylene blue degradation, making direct comparisons of photocatalytic sterilization between studies is difficult. There are a wide variety of experimental methods and light sources used for this task, with each having an unknown impact on sterilization time and effectiveness. This study appears to be one of the first to show ‘black’ TiO2−x as a capable material in visible light photocatalytic disinfection.
Conclusions
A mesoporous black TiO2−x that showed evidence of an amorphous/anatase structure with high surface area and the ability to absorb photons through the UV-visible-IR electromagnetic spectrum was developed via sol–gel combustion. This work demonstrated the visible light-activated photocatalytic ability of this b-TiO2−x through degradation of methylene blue dye and aromatic hydroxylation of benzoic acid. Further evidence of methylene blue degradation was provided through UV-visible spectra, which indicated the possibility of known by-products appearing from the degradation process. The b-TiO2−x was also shown to be easily recovered and used for multiple degradation cycles without affecting its performance.The material also proved capable of sterilizing solutions of PBS containing 1500 CFU mL−1 of S. aureus under visible light irradiation, likely via oxidative stress by oxygen free radicals. Given oxidative stress is placed on the outer layers of the bacterial cells, further testing on Gram-negative strains of bacteria (e.g. P. aeruginosa, E. coli) is required to show effects on cell walls with different compositions. Regardless, these materials clearly represent an exciting antibacterial prospect. Traditional antibiotic agents become depleted as they perform their role, however regeneration tests shown here demonstrate that the material is effectively regenerated on producing ROS. More than that, being easily activated by lower energy radiation ensures that the material is active for greater time periods. ‘Black’ TiO2−x materials therefore may be suitable for providing sustained, effective antimicrobial action in a range of applications.
Author contributions
Lachlan Campbell: conceptualisation, methodology, investigation, validation, formal analysis, writing – original draft, review and editing, visualisation. Song Ha Nguyen: supervision, conceptualisation, formal analysis. Hayden K. Webb: supervision, conceptualisation, visualisation, formal analysis, writing – review & editing. Daniel S. Eldridge: supervision, conceptualisation, visualisation, formal analysis, writing – review & editing.Conflicts of interest
There are no conflicts to declare.Acknowledgements
We gratefully acknowledge the Australian Government Research Training Program Scholarship awarded to Lachlan Campbell in order to complete this research.References
- A. Fujishima and K. Honda, Nature, 1972, 238, 37 CrossRef CAS.
- A. Fujishima and X. Zhang, C. R. Chim., 2006, 9, 750 CrossRef.
- D. D. Dionysiou, G. L. Puma, J. Ye, J. Schneider and D. Bahnemann, Photocatalysis: Applications, Royal Society of Chemistry, United Kingdom, 2016 Search PubMed.
- S. G. Ullattil, S. B. Narendranath, S. C. Pillai and P. Periyat, Chem. Eng. J., 2018, 343, 708 CrossRef.
- W. Zhou, W. Li, J.-Q. Wang, Y. Qu, Y. Yang, Y. Xie, K. Zhang, L. Wang, H. Fu and D. Zhao, J. Am. Chem. Soc., 2014, 136, 9280 CrossRef.
- C. Zhang, Y. Xie, J. Ma, J. Hu and C. Zhang, Chem. Commun., 2015, 51, 17459 RSC.
- P. Chowdhury, H. Gomaa and A. K. Ray, Int. J. Hydrogen Energy, 2011, 36, 13442 CrossRef.
- W. Hu, W. Zhou, K. Zhang, X. Zhang, L. Wang, B. Jiang, G. Tian, D. Zhao and H. Fu, J. Mater. Chem. A, 2016, 4, 7495 RSC.
- Z. Xiong, J. Ma, W. J. Ng, T. D. Waite and X. S. Zhao, Water Res., 2011, 45, 2095 CrossRef CAS.
- M. Sillanpää, M. C. Ncibi and A. Matilainen, J. Environ. Manage., 2018, 208, 56 CrossRef PubMed.
- M. D. Hernández-Alonso, F. Fresno, S. Suárez and J. M. Coronado, Energy Environ. Sci., 2009, 2, 1231 RSC.
- M. Pelaez, N. T. Nolan, S. C. Pillai, M. K. Seery, P. Falaras, A. G. Kontos, P. S. M. Dunlop, J. W. J. Hamilton, J. A. Byrne, K. O'Shea, M. H. Entezari and D. D. Dionysiou, Appl. Catal., B, 2012, 125, 331 CrossRef CAS.
- A. R. Khataee, M. N. Pons and O. Zahraa, J. Hazard. Mater., 2009, 168, 451 CrossRef CAS.
- C. Sun, Q. Li, S. Gao, L. Cao, J. K. Shang and J. K. Shang, J. Am. Ceram. Soc., 2010, 93, 3880 CrossRef CAS.
- Q. Li, R. Xie, Y. W. Li, E. A. Mintz and J. K. Shang, Environ. Sci. Technol., 2007, 41, 5050 CrossRef CAS.
- A. Zaleska, Recent Pat. Eng., 2008, 2, 157 CrossRef CAS.
- S. A. Ansari, M. M. Khan, M. O. Ansari and M. H. Cho, New J. Chem., 2016, 40, 3000 RSC.
- J. Li, X. Wu and S. Liu, Acta Phys.-Chim. Sin., 2021, 37, 2009038–2009040 Search PubMed.
- T. S. Rajaraman, S. P. Parikh and V. G. Gandhi, Chem. Eng. J., 2020, 389, 123918 CrossRef.
- X. Chen, L. Liu, P. Y. Yu and S. S. Mao, Science, 2011, 331, 746 CrossRef.
- M. Tian, C. Liu, J. Ge, D. Geohegan, G. Duscher and G. Eres, J. Mater. Res., 2019, 34, 1138 CrossRef.
- L. Li, L. Song, L. Zhu, Z. Yan and X. Cao, Catal. Sci. Technol., 2018, 8, 1277 RSC.
- M. Tian, M. Mahjouri-Samani, G. Eres, R. Sachan, M. Yoon, M. F. Chisholm, K. Wang, A. A. Puretzky, C. M. Rouleau, D. B. Geohegan and G. Duscher, ACS Nano, 2015, 9, 10482 CrossRef CAS.
- S. G. Ullattil and P. Periyat, J. Mater. Chem. A, 2016, 4, 5854 RSC.
- S. Chen, Y. Xiao, Y. Wang, Z. Hu, H. Zhao and W. Xie, Nanomaterials, 2018, 8, 245 CrossRef CAS.
- J. Chen, Z. Ding, C. Wang, H. Hou, Y. Zhang, C. Wang, G. Zou and X. Ji, ACS Appl. Mater. Interfaces, 2016, 8, 9142 CrossRef CAS.
- T. Matsunaga, R. Tomoda, T. Nakajima and H. Wake, FEMS Microbiol. Lett., 1985, 29, 211 CrossRef CAS.
- O. T. Alaoui, Q. T. Nguyen, P. Schaetzel and C. Mbareck, Catal. Sci. Technol., 2011, 1, 1412 RSC.
- A. Fujishima, T. N. Rao and D. A. Tryk, J. Photochem. Photobiol., C, 2000, 1, 1 CrossRef CAS.
- M. Altikatoglu Yapaoz and A. Attar, Mater. Res. Express, 2019, 6, 55039 CrossRef.
- O. K. Dalrymple, E. Stefanakos, M. A. Trotz and D. Y. Goswami, Appl. Catal., B, 2010, 98, 27 CrossRef.
- J. Kiwi and V. Nadtochenko, J. Phys. Chem. B, 2004, 108, 17675 CrossRef.
- M. Cho, H. Chung, W. Choi and J. Yoon, Water Res., 2004, 38, 1069 CrossRef.
- C. Chawengkijwanich and Y. Hayata, Int. J. Food Microbiol., 2008, 123, 288 CrossRef PubMed.
- S. K. Kansal, P. Kundu, S. Sood, R. Lamba, A. Umar and S. K. Mehta, New J. Chem., 2014, 38, 3220 RSC.
- N. G. Reed, Public Health Rep., 2010, 125, 15 CrossRef PubMed.
- F. Zuo, L. Wang and P. Feng, Int. J. Hydrogen Energy, 2014, 39, 711 CrossRef.
- D. S. Eldridge, PhD thesis, Swinburne University of Technology, 2011 Search PubMed.
- W. Li, R. Liang, A. Hu, Z. Huang and Y. N. Zhou, RSC Adv., 2014, 4, 36959 RSC.
- J. Qian, K. Mopper and D. J. Kieber, Deep Sea Res., Part I, 2001, 48, 741 CrossRef.
- X. Zhou and K. Mopper, Mar. Chem., 1990, 30, 71 CrossRef.
- D. Vulpius, G. Geipel and G. Bernhard, Spectrochim. Acta, Part A, 2010, 75, 558 CrossRef PubMed.
- X. Liu and Y. Bi, Catal. Sci. Technol., 2018, 8, 3876 RSC.
- D. Mitoraj, U. Lamdab, W. Kangwansupamonkon, M. Pacia, W. Macyk, N. Wetchakun and R. Beranek, J. Photochem. Photobiol., A, 2018, 366, 103 CrossRef.
- E. V. Ellis, E. W. Gonzalez, D. A. Kratzer, D. L. McEachron and G. Yeutter, ARCC Conference Repository, 2014, p. 465 Search PubMed.
- I. Anastopoulos, A. Hosseini-Bandegharaei, J. Fu, A. C. Mitropoulos and G. Z. Kyzas, J. Dispersion Sci. Technol., 2018, 39, 836 CrossRef.
- S. Petti and G. A. Messano, J. Hosp. Infect., 2016, 93, 78 CrossRef PubMed.
- T.-D. Pham and B.-K. Lee, J. Photochem. Photobiol., A, 2015, 307–308, 16 CrossRef.
- C. Fan, C. Chen, J. Wang, X. Fu, Z. Ren, G. Qian and Z. Wang, Sci. Rep., 2015, 5, 11712 CrossRef.
- V.-A. Glezakou and R. Rousseau, Nat. Mater., 2018, 17, 856 CrossRef.
- X. Chen, L. Liu and F. Huang, Chem. Soc. Rev., 2015, 44, 1861 RSC.
- V. A. Lebedev, D. A. Kozlov, I. V. Kolesnik, A. S. Poluboyarinov, A. E. Becerikli, W. Grünert and A. V. Garshev, Appl. Catal., B, 2016, 195, 39 CrossRef CAS.
- Y. Wang, L. Li, X. Huang, Q. Li and G. Li, RSC Adv., 2015, 5, 34302 RSC.
- G. L. Chiarello, A. D. Paola, L. Palmisano and E. Selli, Photochem. Photobiol. Sci., 2011, 10, 355 CrossRef CAS.
- W. Li, R. Liang, A. Hu, Z. Huang and Y. N. Zhou, RSC Adv., 2014, 4, 36959 RSC.
- M. Faycal Atitar, A. A. Ismail, S. A. Al-Sayari, D. Bahnemann, D. Afanasev and A. V. Emeline, Chem. Eng. J., 2015, 264, 417 CrossRef CAS.
- L. Velardi, L. Scrimieri, A. Serra, D. Manno and L. Calcagnile, Appl. Phys. A: Mater. Sci. Process., 2019, 125, 1 CrossRef CAS.
- D. Reyes-Coronado, G. Rodríguez-Gattorno, M. E. Espinosa-Pesqueira, C. Cab, R. de Coss and G. Oskam, Nanotechnology, 2008, 19, 145605 CrossRef CAS PubMed.
- X. Zou, J. Liu, J. Su, F. Zuo, J. Chen and P. Feng, Chem. – Eur. J., 2013, 19, 2866 CrossRef CAS.
- Z. Wang, C. Yang, T. Lin, H. Yin, P. Chen, D. Wan, F. Xu, F. Huang, J. Lin, X. Xie and M. Jiang, Adv. Funct. Mater., 2013, 23, 5444 CrossRef CAS.
- T. Xia, W. Zhang, W. Li, N. A. Oyler, G. Liu and X. Chen, Nano Energy, 2013, 2, 826 CrossRef CAS.
- S. H. Szczepankiewicz, A. J. Colussi and M. R. Hoffmann, J. Phys. Chem. B, 2000, 104, 9842 CrossRef CAS.
- M. Šćepanović, B. Abramović, A. Golubović, S. Kler, M. Grujić-Brojčin, Z. Dohčević-Mitrović, B. Babić, B. Matović and Z. V. Popović, J. Sol-Gel Sci. Technol., 2012, 61, 390 CrossRef.
- S. Sandeep, K. L. Nagashree, T. Maiyalagan and G. Keerthiga, Appl. Surf. Sci., 2018, 449, 371 CrossRef CAS.
- N. I. Mohd Razip, K. M. Lee, C. W. Lai and B. H. Ong, Mater. Res. Express, 2019, 6, 075517 CrossRef.
- Y. Ishibai, J. Sato, T. Nishikawa and S. Miyagishi, Appl. Catal., B, 2008, 79, 117 CrossRef CAS.
- X. Xin, T. Xu, J. Yin, L. Wang and C. Wang, Appl. Catal., B, 2015, 176–177, 354 CrossRef CAS.
- M. A. Al-Ghouti and D. A. Da'ana, J. Hazard. Mater., 2020, 393, 122383 CrossRef CAS PubMed.
- G. A. Thommes and E. Leininger, Anal. Chem., 1958, 30, 1361 CrossRef CAS.
- J. M. Burns, W. J. Cooper, J. L. Ferry, D. W. King, B. P. DiMento, K. McNeill, C. J. Miller, W. L. Miller, B. M. Peake, S. A. Rusak, A. L. Rose and T. D. Waite, Aquat. Sci., 2012, 74, 683 CrossRef CAS.
- P.-C. Maness, S. Smolinski, D. M. Blake, Z. Huang, E. J. Wolfrum and W. A. Jacoby, Appl. Environ. Microbiol., 1999, 65, 4094 CrossRef CAS PubMed.
- G. Zhu, T. Lin, X. Lü, W. Zhao, C. Yang, Z. Wang, H. Yin, Z. Liu, F. Huang and J. Lin, J. Mater. Chem. A, 2013, 1, 9650 RSC.
- T. Leshuk, R. Parviz, P. Everett, H. Krishnakumar, R. A. Varin and F. Gu, ACS Appl. Mater. Interfaces, 2013, 5, 1892 CrossRef CAS PubMed.
- S. Mondal, M. E. De Anda Reyes and U. Pal, RSC Adv., 2017, 7, 8633 RSC.
- H. H. Al Shamsi and H. K. Al Shdood, Int. J. Chem. Sci., 2016, 14, 1296 CAS.
- D. Iguchi, R. Erra-Balsells and S. M. Bonesi, Photochem. Photobiol. Sci., 2016, 15, 105 CrossRef CAS.
- W. Qin, J. Wang, S. Xu, Q. Xie and Z. Xu, Colloids Surf., A, 2016, 490, 318 CrossRef CAS.
- J. Ananpattarachai, Y. Boonto and P. Kajitvichyanukul, Environ. Sci. Pollut. Res., 2016, 23, 4111 CrossRef CAS.
- L. Chen, F. He, Y. Huang, Y. Meng and R. Guo, J. Alloys Compd., 2016, 678, 5 CrossRef CAS.
- H. Yin, G. Li, X. Chen, W. Wang, P. K. Wong, H. Zhao and T. An, Appl. Catal., B, 2020, 269, 118829 CrossRef CAS.
- H. Younas, I. A. Qazi, I. Hashmi, M. Ali Awan, A. Mahmood and H. A. Qayyum, Environ. Sci. Pollut. Res., 2014, 21, 740 CrossRef CAS.
- S. P. Tallósy, L. Janovák, J. Ménesi, E. Nagy, Á. Juhász, L. Balázs, I. Deme, N. Buzás and I. Dékány, Environ. Sci. Pollut. Res., 2014, 21, 11155 CrossRef.
- C. Karunakaran, A. Vijayabalan, G. Manikandan and P. Gomathisankar, Catal. Commun., 2011, 12, 826 CrossRef CAS.
| This journal is © The Royal Society of Chemistry 2023 |