 Open Access Article
Creative Commons Attribution 3.0 Unported Licence
Searching chemical action and network (SCAN): an interactive chemical reaction path network platform
Mikael
Kuwahara
 a,
Yu
Harabuchi
ab,
Satoshi
Maeda
 *ab,
Jun
Fujima
*a and
Keisuke
Takahashi
 *ac
*ac
aDepartment of Chemistry, Hokkaido University, North 10, West 8, Sapporo 060-0810, Japan. E-mail: j.fujima@sci.hokudai.ac.jp
bInstitute for Chemical Reaction Design and Discovery (WPI-ICReDD), Hokkaido University, Kita 21 Nishi 10, Kita-ku, Sapporo, Hokkaido 001-0021, Japan
cList Sustainable Digital Transformation Catalyst Collaboration Research Platform, Institute for Chemical Reaction Design and Discovery, Hokkaido University (ICReDD List-PF), Japan. E-mail: smaeda@eis.hokudai.ac.jp; keisuke.takahashi@sci.hokudai.ac.jp
First published on 5th July 2023
Abstract
The interactive chemical reaction platform, SCAN, is developed for analyzing the chemical reaction path network. SCAN offers the chemical reaction path network database, visualization, and network analysis tools. In particular, SCAN is a web-based platform that allows users to perform interactive chemical reaction path network visualization and data science techniques with simple operation. SCAN is designed to provide a user-friendly graphic user interface, making pre-existing knowledge of programming and skillsets optional. Thus, SCAN is proposed to be an alternative tool for analyzing and understanding chemical reaction path networks.
Introduction
Understanding a chemical reaction answers the fundamental mystery of how products are formed from reactants. First principles calculations reveal that a chemical reaction is a complex matter as it involves a tremendous number of intermediates.1–6 In other words, a chemical reaction can be treated as a form of a complex network consisting of numerous molecular interactions.7 While it is difficult to capture the details of molecular interactions in an experiment, first principles calculations play a major role in understanding such a complex reaction map.1,8,9 In particular, numerous automatic chemical reaction searching tools have been developed such as the freezing string method with the Berny algorithm, single/double-ended growing string methods, artificial force induced reaction (AFIR), reaction mechanism generator (RMG), and KinBot.10–15 Although such complex reaction path networks have become available, the question arises over how such complex networks can be understood and how knowledge can be extracted, rendering tools for extracting the knowledge from networks necessary.Extracting knowledge from the chemical reaction path network involves multiple steps and processes. In particular, organization of the chemical reaction database, statistical analysis, network visualization, and graph theory are involved. Several network visualization tools are available such as Cytoscape and Gephi which offer network visualization and graph theory analysis.16,17 Moreover, it has been demonstrated that graph theory such as centrality analysis is found to be effective when determining intermediates.5,14,18–20 However, these processes are strongly linked to each other, meaning that the individual development of each process could limit the ability to extract knowledge. In addition, network data visualization and analysis often require particular skillsets as well as advanced programming skills, which can act as barriers towards performing such analyses. Therefore, it is crucial to establish a centralized, interactive, and user-friendly platform which has the ability to utilize these processes simultaneously. Here, Searching Chemical Action and Network (SCAN) is introduced where a platform for an interactive chemical reaction path network is designed and proposed where the chemical reaction path network is produced by the AFIR method.9,12,21,22 The SCAN platform is available at https://scan.sci.hokudai.ac.jp/ where it allows the users to explore, visualize and analyze the chemical reaction path network data generated by first principles calculations. Thus, SCAN allows for searching and understanding the complex chemical reaction path network.
Concept and platform overview
SCAN architecture
The concept of SCAN is to store and share the chemical reaction path network generated by first principles calculations where interactive network visualization and network analysis are also provided. In order to achieve the flexible reuse of data, the layered architecture is implemented as shown in Fig. 1. Fig. 1 illustrates the SCAN architecture which consists of a data lake, data warehouse, and data mart. Here, the chemical reaction path network generated by AFIR methods is used as prototype chemical reaction path network data where data are previously published.23 The chemical reaction path network data generated by AFIR contain numerous log files which are classified as raw data. These raw data are stored in their original form with no modifications. This data storage unit is defined as a data lake. The raw data provided by the data lake are then preprocessed for network visualization and network analysis and stored in a data warehouse. Finally, the data warehouse is accessed by the data mart, which provides application services such as data visualization, data analysis, and an application programming interface for data sharing.The SCAN platform has the option of an application programming interface (API). Users can access and retrieve all registered data using the key of information from their own applications. The information of geometries, energy, gradients, and physical properties can then be used in other applications such as informatics and machine learning.
Web-based browsing interface
Web applications are constructed where the three-layered architecture illustrated in Fig. 1 is used as the foundation. The web application directly connects to the data mart, which allows the user to directly access the web graphic user interface to carry out network visualization, network analysis, and data downloading without previous experience with programming or data preprocessing. This is particularly attractive as it expands access to chemical reaction analysis to researchers that may not have the knowledge or skillsets required for such research. The browsing interface is published under https://scan.sci.hokudai.ac.jp.System architecture
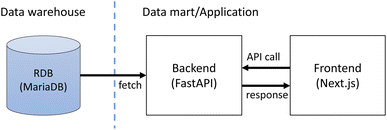
The application consists of the frontend and the backing API as shown in Fig. 2. The frontend is implemented as a JavaScript web application using Next.js† while the backend is implemented with the Python FastAPI framework.‡ The backend fetches stored data from the database in the data warehouse layer and returns the data as JSON in response to requests from the frontend application. The frontend application displays the fetched data as web pages. The application also provides access control of the stored data. This is implemented with Auth0,§ an external authentication service. Only registered users can access the data within the SCAN platform.Web interface
The top page of SCAN is shown in Fig. 3. At the top page, users can see the logo of the SCAN platform as well as the statistical counts of the stored data in the SCAN database which contains the number of the reaction maps as well as the number of nodes and edges. The top page also provides access to login which allows the user to create an account for the SCAN platform. In addition, the terms of use can be reached via the top page.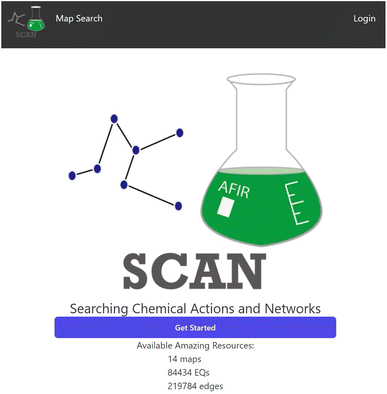 | ||
| Fig. 3 The top page of the SCAN platform. The amount of available data is indicated on the page. User registrations to the platform are provided. | ||
Data preprocessing tool
AFIR raw data stored in the data lake must be converted into a data format that can be used in network visualization and network analysis in SCAN. In particular, the data structure of the chemical reaction path network in SCAN is designed to consist of nodes (equilibrium state; EQ) and edges (reaction paths) as described in the previous work for the details of dataset23 using the AFIR method. However, AFIR produces a tremendous amount of raw data which contains such 3D molecular geometries and energetical information. In order to extract necessary information from the AFIR raw data, a parsing tool called grrmlog_parser is developed. The grrmlog_parser extracts all necessary information as a Python-object for network visualization and network analysis from the AFIR raw data and is available on GitHub.¶Map search engine
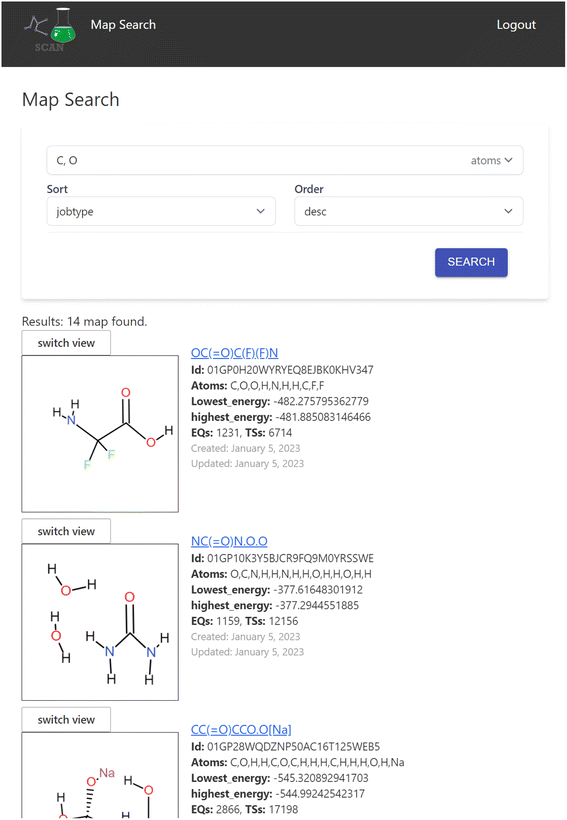
The search engine is implemented for searching the chemical reaction path network data. When a user logs into the application, the search interface appears as shown in Fig. 4.Here, the user can enter atom symbols as the search query in order to retrieve maps containing specified atoms. Search results from the keyword input are displayed as a list on the bottom of the page. Users may input multiple atoms with comma-separated atom symbols like “C,O”, which equates to searching for reaction maps that include all of the specified atoms. The result list includes a visual representation of the initial structure of the calculation of the reaction map and its overview information such as the lowest/highest energy in the map and the number of EQs and transition states (TSs) included.
Map detail view
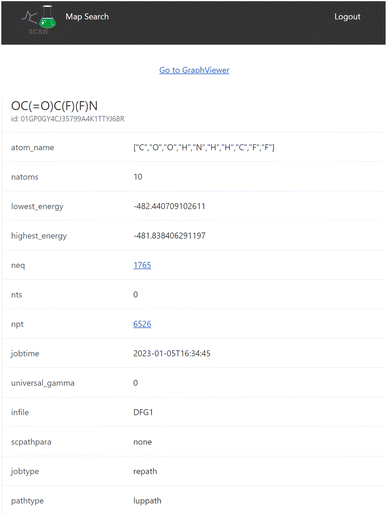
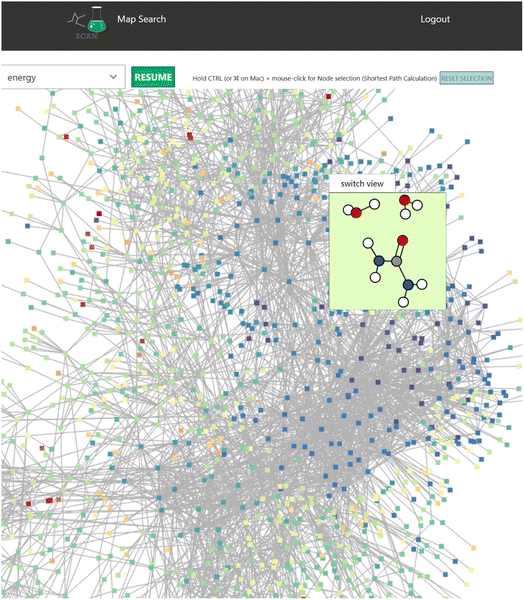
When the user clicks one of the candidates returned by the search result, a map detail view of the search result is displayed as seen in Fig. 5 which includes detailed information of the reaction map.This view also contains the interactive graph network viewer of the chemical reaction path network (Fig. 6). It displays the graph representation of the chemical reaction path network in a visual manner. The nodes represent EQs and the edges represent reaction paths in the map. The graph is automatically arranged with the force-directed graph layout technique. The nodes are colored according to the energy value.
This reaction map viewer is implemented with VivaGraphJS,|| which is a very performant network graph rendering library. This supports a dynamic layout of thousands of EQs and edges with the force directed algorithm.
In the graph representation, when the user scrolls the mouse over a node, a contained window pops up to display the 3D structure of the atom coordinates (Fig. 6). Here, selecting the “switch view” button switches the display mode of the atom structure between a 2D and interactive 3D model. In the 3D mode, users can rotate the atom structure via the mouse on the switch view to look at the model from different viewpoints. The atom coordinates are displayed with ChemDoodle Web Components.**
In addition, users can carry out simple graph analysis using this view. For example, betweenness centrality is calculated and the nodes that have higher betweenness values are highlighted. This may reveal important chemical reactions on the map. Users can also use other analysis methods such as frequency, closeness centrality, or PageRank.
In the map detail view, users can navigate to the list of EQs or edges in the map. Then, selecting one candidate, users open the detail view of selected EQ or edge.
Reaction path network data
Chemical reaction path networks generated using first principles calculations with the AFIR(QCaRA) method are chosen as the prototype data set where QCaRA is designed to search for reactants from initial structures.23–28 The data consist of nodes and edges which represent EQs and reaction paths (defined as peak top (PT) in AFIR), respectively. In addition, corresponding molecular structural information for EQs and reaction yields are contained. Please see the previous work for details regarding the dataset.23Reaction analysis in SCAN
SCAN unveils unique features of the chemical reaction path network data generated by AFIR. Initial set of molecules are presented as shown in Fig. 4. Here, AFIR data search the various atomic configurations while the number of atoms remains the same. Thus, the chemical reaction path network generated by AFIR can be defined as the change of atomic configuration in a specified set of molecules and atoms. The question arises how this network can be understood and identified. One could understand by using the provided reaction yield as AFIR data contain reaction yields at 200 K, 300 K, and 400 K. Fig. 7 demonstrates the reaction path network of NC(=O)N.O.O as an example. Here, the color red indicates high reaction yield, indicating that the red-colored nodes can be potential candidates for reactants of the input structure, NC(=O)N.O.O. According to AFIR(QCaRA) data,23 these high yield nodes have higher chances to form as a reactant from the initial set of molecules. Some high yield nodes have been previously experimentally validated.29 Therefore, users can interactively see the potential reactants via SCAN. However, it must be noted that there are a great number of high yields presented in the network. From this data, it is unknown how to narrow down which nodes tend to occur more than others. Thus, it demonstrates the potential reactant candidates to form the initial structures while remaining challenging to identify the exact set of molecules as reactants.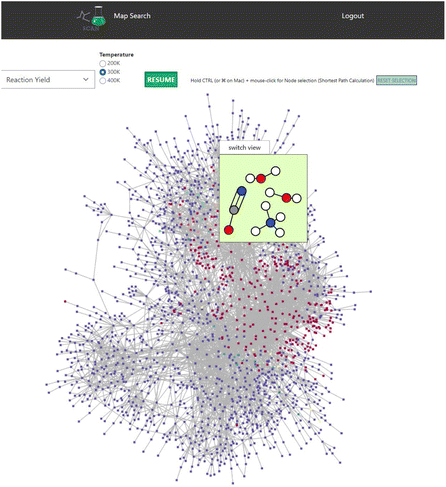 | ||
| Fig. 7 The reaction path network of NC(=O)N.O.O is used. Red and blue nodes indicate high and low reaction yields. Color code: white: H, gray: C, blue: N, red: O. | ||
SCAN also equips data science techniques which can help with analysis of the complex reaction path network. One technique is centrality analysis where SCAN offers betweenness centrality, closeness centrality, page rank, and frequency analysis. These methods enable the search for the key nodes based on how data are presented. Centrality analysis can be easily performed by choosing the tab placed during the visualization.
Finally, a shortest distance calculator is implemented in SCAN. Within SCAN, users can click start and end nodes while holding the CTRL button. SCAN would then automatically calculate the shortest path where the shortest path is highlighted in bright pink as shown in Fig. 8. Thus, SCAN offers data science tools for analyzing the chemical reaction path network with simple operation.
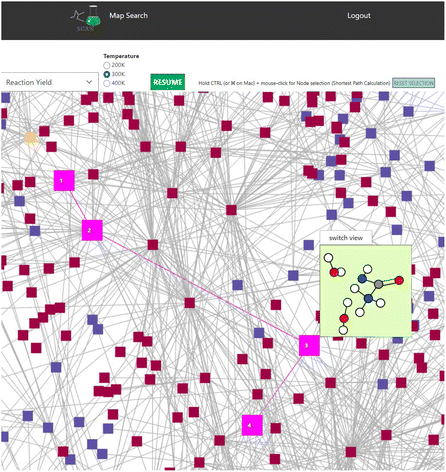 | ||
| Fig. 8 Shortest path calculation in the NC(=O)N.O.O network. Bright pink indicates the calculated shortest path. Color code: white: H, gray: C, blue: N, red: O. | ||
Conclusion
Searching Chemical Action and Network, SCAN, is designed and developed for interactive chemical reaction path network analysis. SCAN provides a user-friendly graphic user interface where users can access, visualize, and analyze the reaction path network. In particular, the users can search and explore the chemical reaction path network generated by first principles calculations where the users can also visualize and analyze the complex reaction path network via the data science technique with simple operation. SCAN source code is available at GitHub under the MIT license; thus, SCAN can be redistributed for any other chemical reaction path network data as long as network data consist of nodes and edges. Hence, SCAN is proposed as an alternative environment for understanding complex reaction path networks, providing the ability to unveil the details of chemical reactions.Data availability
Fourteen reaction maps are stored and published on the SCAN platform. All data available on the SCAN platform are licensed under the Creative Commons license “Attribution-NonCommercial-NoDerivatives 4.0 International” (CC BY 4.0). The source code of the SCAN platform is hosted at https://github.com/scan-team/scan-platform-test under GPL3.0 license.Author contribution
JF and KT designed the architecture, JF, MK, and KT developed the platform. KT provided the data analysis tools. YH developed the grrmlog_parser. YH and SM calculated and analyzed the reaction path network.Conflicts of interest
There are no conflicts to declare.Acknowledgements
This work is funded by Japan Science and Technology Agency (JST) ERATO Grant Number JPMJER1903, and JSPS-WPI. This work was partly achieved through the use of the computational resources of supercomputer Fugaku provided by the RIKEN Center for Computational Science, and the supercomputer system at the information initiative center in Hokkaido University.References
- Z. W. Ulissi, A. J. Medford, T. Bligaard and J. K. Nørskov, To address surface reaction network complexity using scaling relations machine learning and DFT calculations, Nat. Commun., 2017, 8, 1–7 CrossRef PubMed.
- K. N. Houk and P. H.-Y. Cheong, Computational prediction of small-molecule catalysts, Nature, 2008, 455, 309–313 CrossRef CAS PubMed.
- S. Maeda, Y. Harabuchi, Y. Ono, T. Taketsugu and K. Morokuma, Intrinsic reaction coordinate: calculation, bifurcation, and automated search, Int. J. Quantum Chem., 2015, 115, 258–269 CrossRef CAS.
- G. N. Simm, A. C. Vaucher and M. Reiher, Exploration of reaction pathways and chemical transformation networks, J. Phys. Chem. A, 2018, 123, 385–399 CrossRef PubMed.
- L. Takahashi, J. Ohyama, S. Nishimura and K. Takahashi, Representing the Methane Oxidation Reaction via Linking First-Principles Calculations and Experiment with Graph Theory, J. Phys. Chem. Lett., 2020, 12, 558–568 CrossRef PubMed.
- C. A. Grambow, L. Pattanaik and W. H. Green, Reactants, products, and transition states of elementary chemical reactions based on quantum chemistry, Sci. Data, 2020, 7, 1–8 CrossRef PubMed.
- C. A. Grambow, A. Jamal, Y.-P. Li, W. H. Green, J. Zador and Y. V. Suleimanov, Unimolecular reaction pathways of a γ-ketohydroperoxide from combined application of automated reaction discovery methods, J. Am. Chem. Soc., 2018, 140, 1035–1048 CrossRef CAS PubMed.
- A. L. Dewyer, A. J. Argüelles and P. M. Zimmerman, Methods for exploring reaction space in molecular systems, Wiley Interdiscip. Rev.: Comput. Mol. Sci., 2018, 8, e1354 Search PubMed.
- S. Maeda, K. Ohno and K. Morokuma, Systematic exploration of the mechanism of chemical reactions: the global reaction route mapping (GRRM) strategy using the ADDF and AFIR methods, Phys. Chem. Chem. Phys., 2013, 15, 3683–3701 RSC.
- Y. V. Suleimanov and W. H. Green, Automated discovery of elementary chemical reaction steps using freezing string and Berny optimization methods, J. Chem. Theor. Comput., 2015, 11, 4248–4259 CrossRef CAS PubMed.
- P. M. Zimmerman, Single-ended transition state finding with the growing string method, J. Comput. Chem., 2015, 36, 601–611 CrossRef CAS PubMed.
- S. Maeda, Y. Harabuchi, M. Takagi, T. Taketsugu and K. Morokuma, Artificial force induced reaction (AFIR) method for exploring quantum chemical potential energy surfaces, Chem. Rec., 2016, 16, 2232–2248 CrossRef CAS PubMed.
- C. W. Gao, J. W. Allen, W. H. Green and R. H. West, Reaction Mechanism Generator: automatic construction of chemical kinetic mechanisms, Comput. Phys. Commun., 2016, 203, 212–225 CrossRef CAS.
- R. Van de Vijver and J. K. B. Zádor, Automated stationary point search on potential energy surfaces, Comput. Phys. Commun., 2020, 248, 106947 CrossRef CAS.
- M. Liu, A. G. Dana, M. S. Johnson, M. J. Goldman, A. Jocher, A. M. Payne, C. A. Grambow, K. Han, N. W. Yee, E. J. Mazeau, K. Blondal, R. H. West, C. F. Goldsmith and W. H. Green, Reaction mechanism generator v3.0: advances in automatic mechanism generation, J. Chem. Inf. Model., 2021, 61, 2686–2696 CrossRef CAS PubMed.
- P. Shannon, A. Markiel, O. Ozier, N. S. Baliga, J. T. Wang, D. Ramage, N. Amin, B. Schwikowski and T. Ideker, Cytoscape: a software environment for integrated models of biomolecular interaction networks, Genome Res., 2003, 13, 2498–2504 CrossRef CAS PubMed.
- M. Bastian, S. Heymann and M. Jacomy, Gephi: an open source software for exploring and manipulating networks, Third international AAAI conference on weblogs and social media, 2009 Search PubMed.
- U. Brandes, A faster algorithm for betweenness centrality, J. Math. Sociol., 2001, 25, 163–177 CrossRef.
- G. N. Simm and M. Reiher, Context-driven exploration of complex chemical reaction networks, J. Chem. Theor. Comput., 2017, 13, 6108–6119 CrossRef CAS PubMed.
- K. Takahashi and M. Satoshi, Mining hydroformylation in complex reaction network via graph theory, RSC Adv., 2021, 11, 23235–23240 RSC.
- S. Maeda, Y. Harabuchi, M. Takagi, K. Saita, K. Suzuki, T. Ichino, Y. Sumiya, K. Sugiyama and Y. Ono, Implementation and performance of the artificial force induced reaction method in the GRRM17 program, J. Comput. Chem., 2018, 39, 233–251 CrossRef CAS PubMed.
- S. Maeda and Y. Harabuchi, Exploring paths of chemical transformations in molecular and periodic systems: an approach utilizing force, Wiley Interdiscip. Rev.: Comput. Mol. Sci., 2021, e1538 CAS.
- Y. Harabuchi and S. Maeda, Theoretical chemical reaction database construction based on quantum chemistry-aided retrosynthetic analysis, ChemRxiv, 2022, Cambridge Open Engage, Cambridge, DOI:10.26434/chemrxiv-2022-tl4vj.
- M. J. Frisch, et al., Gaussian 16 Search PubMed.
- Y. Sumiya, Y. Harabuchi, Y. Nagata and S. Maeda, Quantum Chemical Calculations to Trace Back Reaction Paths for the Prediction of Reactants, JACS Au, 2022, 2, 1181–1188 CrossRef CAS PubMed.
- T. Mita, H. Takano, H. Hayashi, W. Kanna, Y. Harabuchi, K. N. Houk and S. Maeda, Prediction of High-Yielding Single-Step or Cascade Pericyclic Reactions for the Synthesis of Complex Synthetic Targets, J. Am. Chem. Soc., 2022, 144, 22985–23000 CrossRef CAS PubMed.
- C. Choi and R. Elber, Reaction path study of helix formation in tetrapeptides: effect of side chains, J. Chem. Phys., 1991, 94, 751–760 CrossRef CAS.
- Y. Sumiya and S. Maeda, Rate Constant Matrix Contraction Method for Systematic Analysis of Reaction Path Networks, Chem. Lett., 2020, 49, 553–564 CrossRef CAS.
- T. Mita, Y. Harabuchi and S. Maeda, Discovery of a synthesis method for a difluoroglycine derivative based on a path generated by quantum chemical calculations, Chem. Sci., 2020, 11, 7569–7577 RSC.
Footnotes |
| † https://nextjs.org/ |
| ‡ https://fastapi.tiangolo.com |
| § https://auth0.com/ |
| ¶ https://github.com/scan-team/grrmlog_parser |
| || https://github.com/anvaka/vivagraphjs |
| ** https://web.chemdoodle.com/ |
| This journal is © The Royal Society of Chemistry 2023 |


