 Open Access Article
AR-XRF measurements and data treatment for the evaluation of gilding samples of cultural heritage
Jacopo
Orsilli
 *a,
Alessandro
Migliori
b,
Roman
Padilla-Alvarez
b,
Marco
Martini
a and
Anna
Galli
a
aUniversità degli Studi di Milano-Bicocca, Dipartimento di Scienza dei Materiali, via Cozzi 55, Milano 20125, Italy. E-mail: j.orsilli@campus.unimib.it
bNuclear Science and Instrumentation Laboratory, International Atomic Energy Agency (IAEA) Laboratories, A-2444 Seibersdorf, Austria
First published on 25th November 2022
Abstract
Angle resolved XRF (AR-XRF) is an analytical technique in which the sample is analyzed at different angles of detection or irradiation. The change in the geometry affects the intensity of the elemental characteristic emission from the sample, which depends on the in-depth distribution of analyte. In this paper, for the first time, we apply AR-XRF to gilding samples that mime real cultural heritage ones. The samples analysed, also investigated with scanning electron microscopy, present small lateral inhomogeneities and a rough surface. Moreover, we illustrate how to analyze AR-XRF data, from the collection of XRF spectra to the creation of AR-XRF profiles and the fitting of data using Sherman's equation. Using AR-XRF combined with the fundamental parameters method we calculate the massive thickness of laboratory made layered samples.
Introduction
X-ray fluorescence (XRF) is a well-established technique in many research fields, thanks to its capability of performing in situ non-invasive analyses and obtaining the elemental composition of the sample with fast measurements. Most of the XRF hand-held instruments can detect elements from aluminum to uranium, allowing the analysis of a great variety of samples, whereas in sophisticated installation and under special conditions it is also possible to detect elements down to sodium.1 If the sample is flat, optically smooth for the incoming radiation and homogeneous, it is also possible to perform quantitative analysis. However, samples related to the fields of materials science and cultural heritage do not always satisfy these requirements.The characterization of objects of cultural heritage (CH) includes many kinds of artifacts, which are usually valuable, rare, or unique due to their history and great cultural value. The analysis and the study of these artifacts are also quite difficult as they are seldom homogeneous samples; they can be made up of multiple layers (e.g., paintings, surface painted or decorated ceramics, gilded artefacts) or they may have undergone multiple processes producing alterations to their surfaces.2–12 The fragility and the value of these artefacts usually require the expert to exclude invasive and destructive techniques, favoring the use of portable and non-invasive ones.13–21 That is why nowadays, the scientific community is putting a lot of effort in developing new set-ups to exploit the capability of these techniques to obtain a more complete and reliable dataset.22,23
Many methods can be employed non-invasively for the analysis of layered samples; the best results can be achieved with IBA (Ion Beam Analysis) techniques, like Rutherford backscattering spectroscopy (RBS), usually coupled with particle induced X-ray emission (PIXE). RBS allows the characterization of the layered structure of a sample by evaluating the energy distribution of backscattered particles, which depends on the mass of the hit nucleus, on the scattering angle and on the thickness of each layer.24–28 Besides RBS, since the volume of interaction of incident particles is limited to the surface of the sample and is related to their energy, irradiation at different energies (the so-called “differential PIXE”29) can be applied to discriminate among the different contributions of layers in the sample. The drawback of these techniques is the need to access a particle accelerator, which is not straightforward for many laboratories.
That is why different methods have been proposed for the analysis of layered samples using X-ray fluorescence, the most common of which being the Kα/Kβ or Lα/Lβ ratio,30–33 often applied for the analysis of metal artifacts, the use of Monte-Carlo simulations34–37 or the use of confocal-XRF that can be employed also to perform 3D scanning.38–42 Thin layers are analyzed using either grazing emission-XRF (GE-XRF), grazing incident-XRF (GI-XRF) or X-ray reflectivity (XRR). These techniques exploit the external refraction of X-rays and the production of a standing-wave field to estimate the composition and thickness of surface layers.43–45
In 2001 Fiorini et al.46 proposed a different method to analyze layered samples. They evaluated the intensity of fluorescence radiation in dependence of the detection angle, so called angle resolved-XRF (AR-XRF).47,48 Different from the GE-XRF technique, the angle of detection was not limited to a small range around the critical angle, but to a broader range, from 0° to 90°. Focusing on laboratory and industrial samples, they showed that for simple bi-layer samples of known density it is possible to retrieve the thickness of the top layer, by measuring the intensity of an element present only in the underlying bulk layer.
In this work, we evaluate the use of AR-XRF for the analysis of laboratory-made gilded samples that better represent the issues often found in the CH field, such as small lateral inhomogeneity and roughness of the surface.
Additionally, we here propose an algorithm for AR-XRF data analysis that considers a data pre-treatment and exploits the fundamental parameter (FP) method to retrieve the fitting functions of the profiles. Finally, we compare the calculation of the thickness of the top-layer using its self-attenuation and the attenuation of the bulk signal.
Theory
Sherman's equation
Intensity, the sample structure and composition, and the experimental conditions can be summarized by Sherman's equation49,50 here expressed for a polychromatic source: | (1) |
 | (2) |
with ΔΩ being the solid angle of the detector, ϕ the angle of excitation and η the efficiency of the detector.  is the total attenuation of the sample at the source and fluorescence energy:
 | (3) |
This equation is valid if the sample is thick, homogeneous and with a flat surface, and if the source irradiates the sample with a parallel beam under angle ϕ.
On many occasions, especially in the cultural heritage field, we deal with samples with heterogeneous distribution of elements within the effectively probed volume; they can be layered or have a variable concentration of some elements. In that case, a more general equation describes the fluorescence intensity:
 | (4) |
in which x is the analyzed depth; ρ(x) and wq(x) are respectively the sample density and the element concentration at the depth x.
If the sample is made of N different homogeneous layers of thickness hi (i = 1,…, N), and if the element of interest is present only in the mth layer, from eqn (1) we have that:
 | (5) |
for simplicity, we have assumed here that no secondary enhancement occurs, as it highly increases the complexity of calculations.51
If the same element is present in k layers, we simply get:
 | (6) |
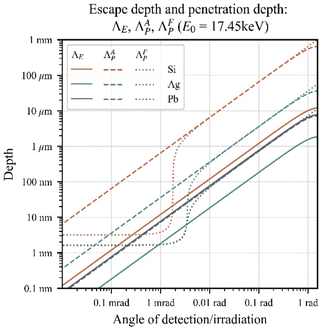
As we can see from eqn (5) and (6) the fluorescence intensity detected is highly influenced not only by the concentration of the element q, but also by its position in the sample. Therefore, the thickness effectively probed in the experiment depends on all the above cited parameters and on the energy of the measured fluorescent radiation. However, the investigated volume can be changed by tuning different angles for excitation and detection. The penetration depth ΛP of the source radiation and the ‘escape’ depth ΛE(Ei) of the fluorescence (i.e., the depth for which the radiation is attenuated by a factor 1/e) can both be calculated considering the attenuation by the matrix as follows:
 | (7a) |
 | (7b) |
in which E0 is the source energy and Ei is the fluorescence energy. This relationship is valid only for angles above the critical angle of external total reflection, αc, for which the reflectivity of the surface is negligible. For values near αc we must also consider the Fresnel laws52 and that the penetration depth ΛFP(E) is highly reduced by the reflectivity of the surface; in this case we can calculate it as:
 | (8) |
in which α is the irradiation/detection angle and iβ is the imaginary part of the refractive index: n = 1 − δ + iβ. The penetration and escape depths, calculated in these ways, are exemplified in Fig. 1.
AR-XRF profiles
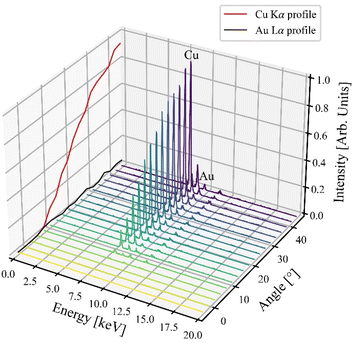
Angle-resolved XRF (AR-XRF) is based on the collection of XRF spectra at different irradiation and/or detection angles. The signal comes from different volumes inside the sample and is affected by the attenuation processes according to the variation of the path length of the source/fluorescence radiation. To perform AR-XRF we can choose to tilt the source, the detector, or the sample around the spectrometer focus: in the latter case both the angles of irradiation and detection change. The detector and/or the source must be well collimated to ensure a small divergence in the excitation and detection angles, thus ensuring that the signal collected comes only from a selected volume of the sample at a given angle.The intensity of each element plotted versus the angle of detection/irradiation can give a hint about its distribution; AR-XRF in this sense can help us get information about the depth distribution of the elements in the sample.
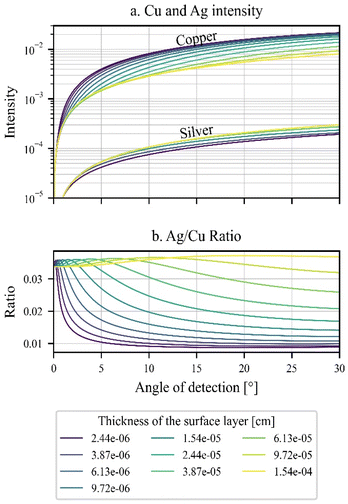
As an example, we can consider a coin with a composition of 60% silver and 40% copper, covered with a surface layer composed of 80% of silver and 20% of copper. By changing the thickness of the surface layer, we get different intensity profiles for the two elements (Fig. 2a), which can also be evaluated by plotting the Ag/Cu ratio (Fig. 2b).
If we want to use the self-attenuation, we must ensure that the element is only found in the layer, so that the variation of its fluorescence intensity is strictly related to the path length variation inside the layer. Besides, the fluorescence line must have an energy such that the layer is not considered of infinite thickness, otherwise no path length variation will occur during the analysis.
If we want to employ the attenuation phenomenon, the chosen element must be present only in a layer j > i. If the fluorescence line has an energy such that the emitting layer (j) is considered of infinite thickness, then the self-attenuation of j depends only on the effective attenuation coefficient of layer j and the path length and composition of the covering layers.
Among all the fluorescence lines that satisfy these requirements the ones suited to obtain the AR-XRF profiles are the more intense lines and those whose intensity has a greater variation when the thickness changes.53
Materials and methods
Samples
The samples analyzed in this study are a set of metal plates covered by golden foils (Table 1). The set is composed of a copper plate of 100 μm thickness covered with a layer composed of a stacking of lemon-gold foils (an alloy made of 75% Au and 25% Ag, from now referred to as ‘golden foils’, each one having a nominal thickness of 0.15 μm), with an increasing thickness (3, 5 and 7 foils). The top layers have been created by gluing the gold foils over the copper plate using an alcoholic gilding glue. As the gilding glue is made of light elements and is very thin, its attenuation of the copper and silver Kα, and gold Lα emission is negligible, and no further corrections will be considered.| Sample | Description |
|---|---|
| Au-3 | 100 μm of copper and 3 golden foils |
| Au-5 | 100 μm of copper and 5 golden foils |
| Au-7 | 100 μm of copper and 7 golden foils |
Instrumentation
The experiments have been carried out using a diffraction X-ray tube with a Mo anode (3 kW), set with a voltage of 45 kV and an intensity of 40 mA. The source is equipped with a monolithic glass polycapillary lens (X-ray Optical System, Inc.), mounted on a holder that allows the beam to be focused through translation and tilting. The size of the irradiated spot at the focus distance is approximately 25 μm for Mo Kα X-rays.
The SDD employed has an active area of 10 mm2, a crystal of 450 μm thickness and an 8 μm Be window; its energy resolution is 135 eV at 5.9 keV. The detector is positioned at 45° over the xz-plane (Fig. 3). For AR-XRF analysis this detector was collimated with a stainless-steel vertical slit (type 1.4310) the distance between the sample and the slit is 17 mm. The slit has an opening of 60 μm and is 5 mm in height, with a thickness of 600 μm. It is placed vertically in front of the detector; thus, the mean angular resolution is 5 mrad (a minimum of 4.5 mrad at the top and a maximum of 5.6 mrad at the bottom of the slit). The effective probed volume of the sample is 25 × 85 μm. Using such a slit instead of a cylindrical collimator enhances the fluorescence signal as the radiation spread along the axis of rotation is collected.
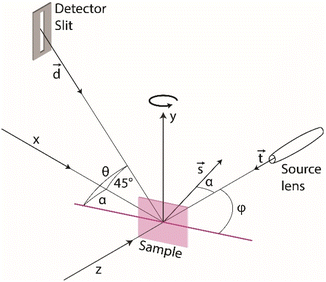 | ||
| Fig. 3 Geometry of the multipurpose XRF spectrometer, the sample can be moved along axes x, y and z and tilted around the y-axis; the slit is also shown in front of the detector. | ||
The samples are mounted on a stage that provides a 3D movement (x, y, z) and a rotation α around the vertical axis (y-axis). To ensure a better alignment of the sample in the AR-XRF analyses, we developed a sample holder that allows us to move manually the sample independently to the stage and to align its surface to the rotation axis.
To obtain the AR-XRF profiles, the spectra were collected for 2 s, performing a rotation of the sample holder of 50° (namely from −5° to 45°) with a rotation resolution of 0.4° (a total of 126 spectra). For each sample we performed 3 angular scans in different spots.
Data treatment
All the data treatment and analysis have been performed using several Python (version 3.7.11)55 homemade scripts appositely created. The data treatment and analysis can be divided into four steps:(1) Processing the XRF spectra and using the elemental intensities to create the AR-XRF profiles
(2) Creation of the fitting functions for the AR-XRF profiles
(3) Fitting of the profiles
(4) Calculation of the mass thickness of the chosen layer
Note that the scripts for the steps 3 and 4 use different equations for considering self-attenuation in the bulk layer and/or the attenuation in upper layers.
To retrieve the intensity from the spectra we can: (a) sum the intensity of the channels of selected ROIs (Regions of Interest) or (b) fit the peaks with appropriate peak shape models. Both these methods have advantages and disadvantages; fitting is the better choice when there is superimposition of fluorescence lines, as we cannot distinguish the intensity of the different elements. However, for low counting statistics, which is the case of the spectra collected at a short measurement time near grazing angles, the program may return inaccurate or non-physical valid values (like negative values) or may not be able to fit the spectrum at all (also depending on the accuracy of the selected model for the spectrum background, and its intensity). In this case, especially if the background is flat and has a low intensity, the selection of ROIs may be the better choice, and it is the one employed in this application.
Due to possible misalignments of the sample-holder system, a correction of the zero of the angular scanning may be needed. At detection angles below the critical angle θ = αc no signal of the top layer can be detected. As the signal coming from the surface of the sample starts rising at the critical angle, it can be used as the zero of the scanning. The AR-profile of an element present in the top-surface layer can then be used to correct the zero of each angular scanning.
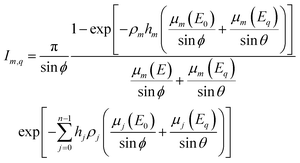 | (9) |
To relate the angle of rotation to the angles of detection and irradiation it's useful to rewrite the geometry in vectorial form. From Fig. 3 the vector of the source, ![[t with combining right harpoon above (vector)]](https://www.rsc.org/images/entities/i_char_0074_20d1.gif) , lays on the z-axis thus
, lays on the z-axis thus ![[t with combining right harpoon above (vector)]](https://www.rsc.org/images/entities/i_char_0074_20d1.gif) = (0,0,−1), the vector of the detector can be written as
= (0,0,−1), the vector of the detector can be written as ![[d with combining right harpoon above (vector)]](https://www.rsc.org/images/entities/i_char_0064_20d1.gif) = (1/2,−1/2,0), and the vector perpendicular to the sample surface, which represents its rotation, is
= (1/2,−1/2,0), and the vector perpendicular to the sample surface, which represents its rotation, is ![[s with combining right harpoon above (vector)]](https://www.rsc.org/images/entities/i_char_0073_20d1.gif) = (sin
= (sin![[thin space (1/6-em)]](https://www.rsc.org/images/entities/char_2009.gif) α,0,cos
α,0,cos![[thin space (1/6-em)]](https://www.rsc.org/images/entities/char_2009.gif) α). We can then calculate the angle of irradiation as the angle between the plane of the sample surface and the source vector; similarly, we can calculate the angle of detection.
α). We can then calculate the angle of irradiation as the angle between the plane of the sample surface and the source vector; similarly, we can calculate the angle of detection.
Remembering that, being ![[small pi, Greek, vector]](https://www.rsc.org/images/entities/char_e1c7.gif) the vector perpendicular at a plane π, and being
the vector perpendicular at a plane π, and being ![[l with combining right harpoon above (vector)]](https://www.rsc.org/images/entities/i_char_006c_20d1.gif) the vector defining the direction of a line l, the angle between the plane and the line can be calculated as:
the vector defining the direction of a line l, the angle between the plane and the line can be calculated as:
 | (10) |
In our case:
 | (11) |
 | (12) |
Thus, we can substitute these values in eqn (9) obtaining:
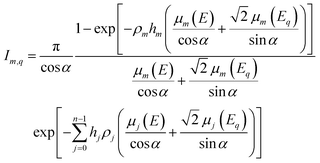 | (13) |
For a bilayer sample, we can rewrite this equation as:
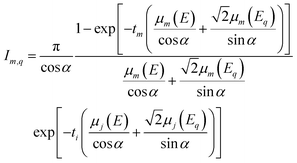 | (14) |
For the analysis of our samples, we can then distinguish two different cases: (I) the considered element is gold (or silver), present only in the golden top layer, whose intensity is affected only by self-attenuation, (II) the considered element is copper, contained only in the bulk of infinite thickness, affected by the attenuation of the golden top layer.
In the first case then we can rewrite eqn (14) as:
 | (15) |
In the second case we rewrite eqn (14) as:
 | (16) |
| Par. | Starting value | Val. min | Val. max |
|---|---|---|---|
| ΠCu | 106 | 100 | 107 |
| ΠTL | 105 | 100 | 3 × 10⁶ |
| t TL | 5 × 10⁻⁶ cm | 1 × 10⁻⁶ cm | 2 × 10⁻² cm |
| b | 0 | 0 | 100 + y0 |
| μB(E0) | 49.052 cm2 g−1 | Fixed value | |
| μ B(ECu) | 51.661 cm2 g−1 | Fixed value | |
| μ TL(E0) | 90.192 cm2 g−1 | Fixed value | |
| μ TL(ECu) | 206.172 cm2 g−1 | Fixed value | |
| μ TL(EAu) | 127.846 cm2 g−1 | Fixed value | |
In principle, in the case described in this paper, these three parameters can be obtained by measuring different samples of the pure elements involved: (I) a set of samples made of gold plates of different thicknesses, if we just want to exploit the self-attenuation of gold; (II) a set of samples made of a plate of copper covered with gold layers of different thicknesses, if we want to exploit both attenuation and self-attenuation. By measuring the intensity of the analytes of standard samples it is possible to create a calibration curve, with which we can then trace back the thickness of the unknown sample.56 This method is not time-consuming, as we just need to perform one measurement at a fixed geometry (or a few measurements to have a better statistic) for each calibration sample and for the unknown sample, without performing any scanning. The drawback of this approach is its applicability only if there is a set of certified samples, like in the case of metal bilayers where the composition of each layer is known. AR-XRF instead, allows the same information to be obtained in a wider range of samples, as for the thickness of the decoration in glazed ceramics. In fact, if the layer composition can be estimated, using the FP-algorithm makes it possible to find the best estimation and then the thickness of the top-layer.
The fitting of the profiles characterizing the golden top layer and the one characterizing the bulk is carried out differently due to their shapes.
For the bulk element, i.e., copper, we have divided the fitting process in two steps: (I) fitting of the background in a region with no copper signal, (II) fitting of the AR-profile as the sum of two functions:
| f(α) = p(α) + b(α) | (17) |
For the top-layer element, gold, we just fitted the profile with a unique function:
| f(α) = IAu,TL + b | (18) |
The choice to proceed with two slightly different methods is motivated by the fact that for the bulk signal (i.e., copper) we could evaluate the background of the profile with a higher precision choosing a region without the copper fluorescence signal.
To proceed with the fitting, we have weighted each intensity with its uncertainty. By applying the package lmfit we could also easily evaluate the uncertainty of the fit with different values of sigma. For all the processes we considered the uncertainty with a 3σ confidence interval.57,58
The source radiation I0(E) has been deconvoluted following the work of Padilla et al.59 After the normalization, to compensate for the geometric factor, measurement time and source intensity, the profiles obtained from the FP calculations have been compared with the fitted profiles through the reduced χ2 method.60 The massive thickness that minimized the reduced χ2 has been chosen as the top-layer thickness.
Results and discussion
Top-layer structure
Sections of the samples have been analyzed by means of SEM to observe the morphology of the golden layers. Even though the gilding glue employed to glue the golden foils and the copper bulk is thin and does not attenuate the fluorescence signal, it does contribute to the total volume of the top-layer.In this sense, concerning the whole top-layer, we can only retrieve its massive thickness, as we do not know the density nor the amount of gilding glue between the layers. We can, however, retrieve the total thickness of the golden foils inside the top-layer, using the density of the alloy, and then calculate the mean thickness of a single foil. This problem related to the thickness and the density of a gilding has already been discussed by Ager et al.26
In the SEM images in Fig. 5 it is possible to see the structure of the gold top-layer in the sample Au-5; the golden foils are clearly visible in the backscattered electron images; the glue layer is also visible between them. It can be noticed that the foils are not perfectly flat and in some points are folded or broken, increasing the variability of the structure.
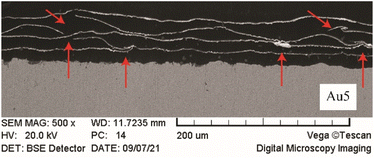 | ||
| Fig. 5 SEM images of polished sections of the sample Au5, folds and breakings are highlighted by the arrows. | ||
Fitting of the profiles
The intensity profiles of copper and gold have been obtained using only the ROI method, as there are no interferents between the two elements. The profiles collected for the different samples are depicted in Fig. 6, where the profiles of scans at three different spots from each of the samples Au-3, Au-5 and Au-7 are presented in different colors. It is evident from this figure that the copper profiles distinguish better the number of layers than the gold profiles (except for spots where one of the foils might be ruptured, see the comment in 4.1), while the copper profiles show a general higher variability in function of the number of layers. The gold profiles of the samples Au-5 and Au-7 are very similar. All the profiles of each element have been fitted with the same parameters, reported in Table 2; moreover, with the package lmfit, it is possible to select the maximum and minimum value of a parameter to avoid non-physical values. The boundaries of a parameter are also reported in Table 2. The starting value for the attenuation coefficients of the different layers has been calculated considering the fluorescence radiation and considering the source as monochromatic with the energy of the Mo Kα line (17.45 keV).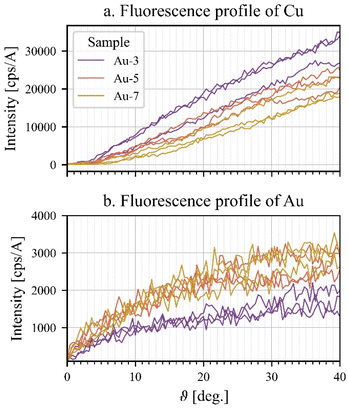 | ||
| Fig. 6 (a) Fluorescence profile of the copper Kα line versus the angle of rotation, (b) profile of the gold Lα line versus the angle of rotation. | ||
To find the best fit the profile intensities have been weighted for their uncertainty, and thus the residuals have been calculated as:
 | (19) |
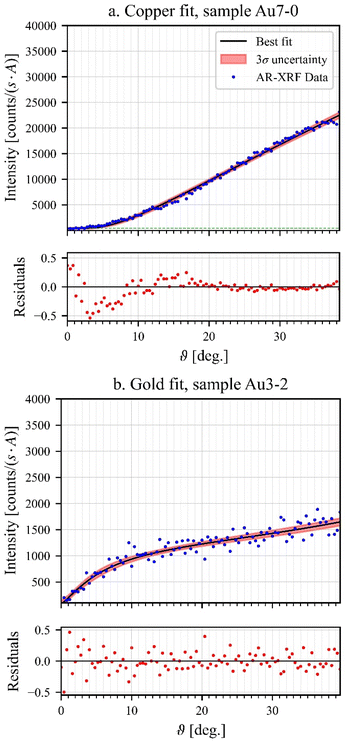
In Fig. 7a it is possible to see the fit of a copper profile, in blue the original data, in black the fit profile and in red the 3σ confidence interval of the fitted data. The fit function well represents the data, as the residuals are mostly limited in a range of ±0.5.
In Fig. 7b it is possible to see the fit of the gold Lα line profile of a spot of the sample Au-3. Note that the fit procedure has also produced good results here, as the residuals lie within a range of ±0.5, even though these data are noisier.
In principle, the value of tTL could be directly obtained from the fit. However, as this variable presents a high correlation with Π (e.g., 0.908 ± 0.038 for the top layer) we cannot rely on its value.
Comparing the fitted data with FP-calculated profiles
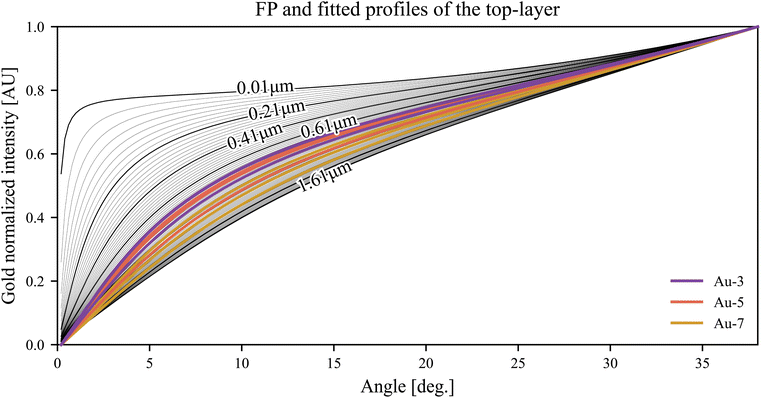
To perform the comparison the FP-calculated profiles have been directly calculated at the same angles of the fitted data; to avoid differences in the source intensity or in the geometrical factors (that do not influence the shapes of the profile), both the fitted profiles and the FP-calculated ones have been normalized. In Fig. 8 the calculated FP profiles and the fitted ones for the gold Lα fluorescence line are reported. The χ2-test has been applied on the fitted FP-profile and at the two profiles that represent the boundaries of the 3σ confidence interval. In this way we found the mean value and we propagated the same 3σ uncertainty on the calculated massive thickness.Calculation of the gold layer thickness
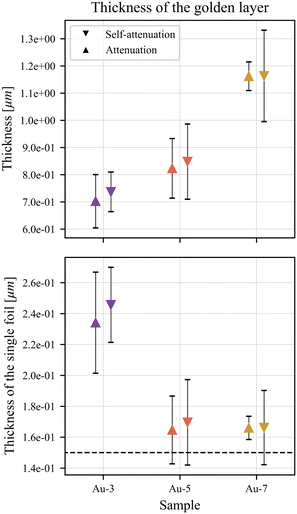
Considering the lateral inhomogeneities shown by the SEM images, intrinsic to the sample production technique, the thicknesses of the top layers measured in the three spots for each sample have been averaged out. The results are in this way representative of the thickness of the whole layer covering the sample. The data, retrieved using the AR-XRF profiles, are shown at the top of Fig. 9. The thicknesses calculated both using the attenuation of the top-layer (profile of copper) and the self-attenuation of the top-layer (profile of gold) are compatible, as they both fall inside the estimated errors. In this sense, the two methods, as expected, give the same results.Moreover, the relative standard deviation in the estimation of the thickness is always below 20%, proving this technique to be a useful tool to analyse non-invasively gilded samples in the field of CH. Nevertheless we can observe that is not really possible to distinguish the sample Au-3 from the sample Au-5 as the error ranges present a wide intersection. Indeed the thickness range of the sample Au-3 calculated with the self-attenuation mainly overlaps with the thickness range calculated with the same method for the sample Au-5. Differently the spread between samples Au-5 and Au-7 is greater than the 3σ standard deviations, and thus they can be well distinguished. The results of the samples Au-3 and Au-5 are not unexpected, indeed we can see also in Fig. 6a that the profiles of gold of the two samples overlap.
Finally, we can observe that the spread of the calculated thickness increases with the number of layers; indeed, as the thickness of the top-layer increases, the profiles become more and more similar (see also Fig. 8), consequently the error on the estimation increases.
If, then, we compare the calculated thickness of each sample with the nominal one (dividing each calculated thickness by the nominal number of layers) we can observe that the major discrepancies are observed in the sample Au-3 for which the thickness of each layer is calculated as 0.24 μm (Fig. 9 bottom). For the other samples instead, even if there is an over estimation of the mean value, the nominal thickness of the single foil is generally inside the standard deviation of the data.
This general overestimation can be explained by the presence of folding of the golden foil, and by the preparation of the samples. Besides that, the presence of folded foils will mainly affect the sample where fewer foils have been staked, as the addition of 1 foil on the sample Au-3 will increase the total thickness of 33%, while in the sample Au-7 the increase would be of 14%. The difference between the calculated and nominal values, thus, has to be attributed to the sample preparation and not to the analyses.
Conclusions
AR-XRF is an analytical technique that can be easily implemented in a laboratory: it only requires a system to tilt either the sample, the detector, or the source of the spectrometer to perform an angular scanning of the sample, collecting different XRF spectra. As the intensity of a certain element depends on its position inside the sample, on the sample structure, and on the geometry used during the analysis (path length crossed by the source/fluorescence radiation inside the sample), a change in the latter parameter can be used to retrieve information on the sample structure, to measure the massive thickness of bilayer samples.This method has been usually applied considering the fluorescence signal coming from the bulk and the attenuation of the top-layer; here we evaluated the possibility to also employ the top layer self-attenuation. Moreover, this method has been tested on samples that exhibit features commonly found in CH related samples, like lateral heterogeneities and a rough surface, here exemplified by three samples of copper covered with 3, 5, and 7 lemon-gold foils.
AR-XRF profiles can be easily modelled using Sherman's equation for a monochromatic source with only three parameters: one that considers the top-layer absorption, one for the instrumental probability of the line emission and one for the background. The limited number of parameters has thus allowed to perform a reliable and fast fitting of the spectra.
As spectroscopic methods that employ attenuation and self-attenuation phenomena return the massive thickness of the layers, the conversion in linear thickness can be performed only if the layer density is known. The technique has shown good results, both using self-attenuation and attenuation.
We know that samples related to the CH field present a greater complexity than the sample analyzed in this study; however, we believe that this method can be proficiently applied in the study of CH related layered samples, especially thanks to its quite easy implementation in a laboratory set-up.
Author contributions
Jacopo Orsilli: conceptualization, sample preparation, methodology, investigation, measurements and processing the experimental results, writing of the original draft; Alessandro Migliori: editing, methodology, supervision; Roman P. Alvarez: methodology, validation, editing; Marco Martini: project administration; Anna Galli: conceptualization, methodology, validation, editing, supervision.Conflicts of interest
There are no conflicts to declare.Acknowledgements
We thank prof. Maurizio Acciarri of the Department of Science Material, University of Milano Bicocca, for the acquisition of the SEM images.References
- K. Uhlir, M. Griesser, G. Buzanich, P. Wobrauschek, C. Streli and D. Wegrzynek, et al., Applications of a new portable (micro) XRF instrument having low-Z elements determination capability in the field of works of art, X-Ray Spectrom., 2008, 37(4), 450–457 CrossRef CAS.
- F. Alloteau, P. Lehuédé, O. Majérus, I. Biron, A. Dervanian and T. Charpentier, et al., New insight into atmospheric alteration of alkali-lime silicate glasses, Corros. Sci., 2017, 122, 12–25 CrossRef CAS.
- O. Majérus, P. Lehuédé, I. Biron, F. Alloteau, S. Narayanasamy and D. Caurant, Glass alteration in atmospheric conditions: crossing perspectives from cultural heritage, glass industry, and nuclear waste management, npj Mater. Degrad., 2020, 4(1), 1–16 CrossRef.
- A. Rodrigues, S. Fearn and M. Vilarigues, Historic K-rich silicate glass surface alteration: behaviour of high-silica content matrices, Corros. Sci., 2018, 145, 249–261 CrossRef CAS.
- E. Greiner-Wronowa, D. Zabiegaj and P. Piccardo, Glass–metal objects from archaeological excavation: corrosion study, Appl. Phys. A, 2013, 113(4), 999–1008 CrossRef CAS.
- M. Bouchar, P. Dillmann and D. Neff, New Insights in the Long-Term Atmospheric Corrosion Mechanisms of Low Alloy Steel Reinforcements of Cultural Heritage Buildings, Materials, 2017, 10(6), 670 CrossRef PubMed.
- A. Negi and I. P. Sarethy, Microbial Biodeterioration of Cultural Heritage: Events, Colonization, and Analyses, Microb. Ecol., 2019, 78(4), 1014–1029 CrossRef PubMed.
- M. Bethencourt, T. Fernández-Montblanc, A. Izquierdo, M. M. González-Duarte and C. Muñoz-Mas, Study of the influence of physical, chemical and biological conditions that influence the deterioration and protection of Underwater Cultural Heritage, Sci. Total Environ., 2018, 613–614, 98–114 CrossRef CAS PubMed.
- G. M. Ingo, A. D. Bustamante, W. Alva, E. Angelini, R. Cesareo and G. E. Gigante, et al., Gold coated copper artifacts from the Royal Tombs of Sipán (Huaca Rajada, Perù): manufacturing techniques and corrosion phenomena, Appl. Phys. A, 2013, 113(4), 877–887 CrossRef CAS.
- L. Bonizzoni, A. Galli, G. Poldi and M. Milazzo, In situ non-invasive EDXRF analysis to reconstruct stratigraphy and thickness of Renaissance pictorial multilayers, X-Ray Spectrom., 2007, 36(2), 55–61 CrossRef CAS.
- M. Bertucci, L. Bonizzoni, N. Ludwig and M. Milazzo, A new model for X-ray fluorescence autoabsorption analysis of pigment layers, X-Ray Spectrom., 2010, 39(2), 135–141 CrossRef CAS.
- L. Bonizzoni, C. Colombo, S. Ferrati, M. Gargano, M. Greco and N. Ludwig, et al., A critical analysis of the application of EDXRF spectrometry on complex stratigraphies, X-Ray Spectrom., 2011, 40(4), 247–253 CrossRef CAS.
- S. A. Barcellos Lins, S. Ridolfi, G. E. Gigante, R. Cesareo, M. Albini and C. Riccucci, et al., Differential X-Ray Attenuation in MA-XRF Analysis for a Non-invasive Determination of Gilding Thickness, Front. Chem., 2020, 8, 175 CrossRef PubMed.
- J. Bell, P. Nel and B. Stuart, Non-invasive identification of polymers in cultural heritage collections: evaluation, optimisation and application of portable FTIR (ATR and external reflectance) spectroscopy to three-dimensional polymer-based objects, Heritage Sci., 2019, 7(1), 95 CrossRef.
- G. Barone, M. D. Bella, M. A. Mastelloni, P. Mazzoleni, S. Quartieri and S. Raneri, et al., Pigments characterization of polychrome vases production at Lipára: new insights by noninvasive spectroscopic methods, X-Ray Spectrom., 2018, 47(1), 46–57 CrossRef CAS.
- M. Manfredi, E. Barberis, F. Gosetti, E. Conte, G. Gatti and C. Mattu, et al., Method for Noninvasive Analysis of Proteins and Small Molecules from Ancient Objects, Anal. Chem., 2017, 89(6), 3310–3317 CrossRef CAS PubMed.
- H. Paiva de Carvalho, S. O. Sequeira, D. Pinho, J. Trovão, R. M. F. da Costa and C. Egas, et al., Combining an innovative non-invasive sampling method and high-throughput sequencing to characterize fungal communities on a canvas painting, Int. Biodeterior. Biodegrad., 2019, 145, 104816 CrossRef CAS.
- A. Galli, M. Caccia, R. Alberti, L. Bonizzoni, N. Aresi and T. Frizzi, et al., Discovering the material palette of the artist: a p-XRF stratigraphic study of the Giotto panel ‘God the Father with Angels’: discovering the pigment palette using a p-XRF stratigraphic analysis, X-Ray Spectrom., 2017, 46(5), 435–441 CrossRef CAS.
- L. Bonizzoni, A. Galli, M. Gondola and M. Martini, Comparison between XRF, TXRF, and PXRF analyses for provenance classification of archaeological bricks, X-Ray Spectrom., 2013, 42(4), 262–267 CrossRef CAS.
- A. Galli, L. Bonizzoni, E. Sibilia and M. Martini, EDXRF analysis of metal artefacts from the grave goods of the Royal Tomb 14 of Sipán, Peru, X-Ray Spectrom., 2011, 40(2), 74–78 CrossRef CAS.
- L. Bonizzoni, C. Canevari, A. Galli, M. Gargano, N. Ludwig and M. Malagodi, et al., A multidisciplinary materials characterization of a Joannes Marcus viol (16th century), Heritage Sci., 2014, 2(1), 15 CrossRef.
- C. Vanhoof, J. R. Bacon, U. E. A. Fittschen and L. Vincze, 2020 atomic spectrometry update – a review of advances in X-ray fluorescence spectrometry and its special applications, J. Anal. At. Spectrom., 2020, 35(9), 1704–1719 RSC.
- C. Vanhoof, J. R. Bacon, U. E. A. Fittschen and L. Vincze, Atomic spectrometry update – a review of advances in X-ray fluorescence spectrometry and its special applications, J. Anal. At. Spectrom., 2021, 36(9), 1797–1812 RSC.
- M. Radepont, L. Robinet, C. Bonnot-Diconne, C. Pacheco, L. Pichon and Q. Lemasson, et al., Ion beam analysis of silver leaves in gilt leather wall coverings, Talanta, 2020, 206, 120191 CrossRef CAS PubMed.
- I. Ortega-Feliu, F. J. Ager, C. Roldán, M. Ferretti, D. Juanes and S. Scrivano, et al., Multi-technique characterization of gold electroplating on silver substrates for cultural heritage applications, Nucl. Instrum. Methods Phys. Res., Sect. B, 2017, 406, 318–323 CrossRef CAS.
- F. J. Ager, M. Ferretti, M. L. Grilli, D. Juanes, I. Ortega-Feliu and M. A. Respaldiza, et al., Reconsidering the accuracy of X-ray fluorescence and ion beam based methods when used to measure the thickness of ancient gildings, Spectrochim. Acta, Part B, 2017, 135, 42–47 CrossRef CAS.
- G. Padeletti, G. M. Ingo, A. Bouquillon, S. Pages, M. Aucouturier and S. Röhrs, et al., First-time observation of Mastro Giorgio masterpieces by means of non-destructive techniques, Appl. Phys. A, 2006, 83, 475–483 CrossRef CAS.
- T. Pradell, A. Climent-Font, J. Molera, A. Zucchiatti, M. D. Ynsa and P. Roura, et al., Metallic and nonmetallic shine in luster: an elastic ion backscattering study, J. Appl. Phys., 2007, 101(10), 103518 CrossRef.
- P. A. Mandò, M. E. Fedi, N. Grassi and A. Migliori, Differential PIXE for investigating the layer structure of paintings, Nucl. Instrum. Methods Phys. Res., Sect. B, 2005, 239(1), 71–76 CrossRef.
- J. L. Campbell, W. J. Teesdale and J. A. Maxwell, Foil thickness measurement via the Kb/Ka intensity ratio of proton-induced X-ray, Nucl. Instrum. Methods Phys. Res., Sect. B, 1989, 43(2), 197–202 CrossRef.
- R. Cesareo, J. T. de Assis, C. Roldán, A. D. Bustamante, A. Brunetti and N. Schiavon, Multilayered samples reconstructed by measuring Kα/Kβ or Lα/Lβ X-ray intensity ratios by EDXRF, Nucl. Instrum. Methods Phys. Res., Sect. B, 2013, 312, 15–22 CrossRef CAS.
- M. Karimi, N. Amiri and A. A. Tabbakh Shabani, Thickness measurement of coated Ni on brass plate using Kα/Kβ ratio by XRF spectrometry, X-Ray Spectrom., 2009, 38(3), 234–238 CrossRef CAS.
- J. Brocchieri, E. Scialla and C. Sabbarese, Estimation of Ag coating thickness by different methods using a handheld XRF instrument, Nucl. Instrum. Methods Phys. Res., Sect. B, 2021, 486, 73–84 CrossRef CAS.
- C. Bottaini, J. Mirão, M. Figuereido, A. Candeias, A. Brunetti and N. Schiavon, Energy dispersive X-ray fluorescence spectroscopy/Monte Carlo simulation approach for the non-destructive analysis of corrosion patina-bearing alloys in archaeological bronzes: the case of the bowl from the Fareleira 3 site (Vidigueira, South Portugal), Spectrochim. Acta, Part B, 2015, 103–104, 9–13 CrossRef CAS.
- C. Bottaini, J. Mirão, A. Candeias, H. Catarino, R. J. Silva and A. Brunetti, Elemental characterisation of a collection of metallic oil lamps from South-Western al-Andalus using EDXRF and Monte Carlo simulation, Eur. Phys. J. Plus, 2019, 134(7), 365 CrossRef.
- T. Trojek and D. Wegrzynek, X-ray fluorescence Kα/Kβ ratios for a layered specimen: comparison of measurements and Monte Carlo calculations with the MCNPX code, Nucl. Instrum. Methods Phys. Res., Sect. A, 2010, 619(1–3), 311–315 CrossRef CAS.
- T. Trojek, Iterative Monte Carlo procedure for quantitative X-ray fluorescence analysis of copper alloys with a covering layer, Radiat. Phys. Chem., 2020, 167, 108294 CrossRef CAS.
- K. Nakano and K. Tsuji, Nondestructive elemental depth profiling of Japanese lacquerware ‘Tamamushi-nuri’ by confocal 3D-XRF analysis in comparison with micro GE-XRF, X-Ray Spectrom., 2009, 38(5), 446–450 CrossRef CAS.
- Ž. Šmit, K. Janssens, K. Proost and I. Langus, Confocal μ-XRF depth analysis of paint layers, Nucl. Instrum. Methods Phys. Res., Sect. B, 2004, 219–220, 35–40 CrossRef.
- T. Trojek, R. Prokeš, R. Šefců, H. Bilavčíková and T. Čechák, Confocal X-ray fluorescence spectrometer for in situ analyses of paintings, Radiat. Phys. Chem., 2017, 137, 238–242 CrossRef CAS.
- K. Uhlir, R. Padilla-Alvarez, A. Migliori, A. G. Karydas, I. Božičević Mihalić and M. Jakšić, et al., The mystery of mercury-layers on ancient coins — a multianalytical study on the Sasanian coins under the Reign of Khusro II, Microchem. J., 2016, 125, 159–169 CrossRef CAS.
- B. Kanngießer, W. Malzer, I. Mantouvalou, D. Sokaras and A. G. Karydas, A deep view in cultural heritage—confocal micro X-ray spectroscopy for depth resolved elemental analysis, Appl. Phys. A, 2012, 106(2), 325–338 CrossRef.
- P. Hönicke, Y. Kayser, B. Beckhoff, M. Müller, J. C. l. Dousse and J. Hoszowska, et al., Characterization of ultra-shallow aluminum implants in silicon by grazing incidence and grazing emission X-ray fluorescence spectroscopy, J. Anal. At. Spectrom., 2012, 27(9), 1432 RSC.
- V. Szwedowski, J. Baumann, I. Mantouvalou, L. Bauer, W. Malzer and B. Kanngießer, Scan-Free Grazing Emission XRF Measurements in the Laboratory Using a CCD, Phys. Status Solidi C, 2017, 14(12), 1700158 CrossRef.
- J. Szlachetko, D. Banaś, A. Kubala-Kukuś, M. Pajek, W. Cao and J. C. l. Dousse, et al., Application of the high-resolution grazing-emission X-ray fluorescence method for impurities control in semiconductor nanotechnology, J. Appl. Phys., 2009, 105(8), 086101 CrossRef.
- C. Fiorini, A. Gianoncelli, A. Longoni and F. Zaraga, Determination of the thickness of coatings by means of a new XRF spectrometer, X-Ray Spectrom., 2002, 31(1), 92–99 CrossRef CAS.
- J. Baumann, Y. Kayser and B. Kanngießer, Grazing Emission X-Ray Fluorescence: Novel Concepts and Applications for Nano-Analytics, Phys. Status Solidi B, 2021, 258(3), 2000471 CrossRef CAS.
- J. Baumann, D. Grötzsch, O. Scharf, T. Kodalle, R. Bergmann and F. Bilchenko, et al., A compact and efficient angle-resolved X-ray fluorescence spectrometer for elemental depth profiling, Spectrochim. Acta, Part B, 2021 Luglio, 181, 106216 Search PubMed.
- J. Sherman, The theoretical derivation of fluorescent X-ray intensities from mixtures, Spectrochim. Acta, 1955, 7, 283–306 CrossRef CAS.
- R. Tertian and F. Claisse, Principles of Quantitative X-Ray Fluorescence Analysis, Heyden, 1982, p. 412 Search PubMed.
- D. K. G. De Boer, Calculation of X-ray fluorescence intensities from bulk and multilayer samples, X-Ray Spectrom., 1990, 19(3), 145–154 CrossRef CAS.
- J. Als-Nielsen and D. McMorrow, Elements of Modern X-Ray Physics: Als-Nielsen/Elements, John Wiley & Sons, Inc., Hoboken, NJ, USA, 2011, available from: DOI:10.1002/9781119998365.
- P. N. Brouwer, Quantitative analysis: thin and layered sample, in Handbook of practical X-ray fluorescence analysis, ed. B. Beckhoff, Springer, Berlin, New York, 2006, pp. 369–379 Search PubMed.
- D. Wegrzynek, A. Markowicz, S. Bamford, E. Chinea-Cano and M. Bogovac, Micro-beam X-ray fluorescence and absorption imaging techniques at the IAEA Laboratories, Nucl. Instrum. Methods Phys. Res., Sect. B, 2005, 231(1), 176–182 CrossRef CAS.
- Python Software Foundation, Python, 2022, available from: https://www.python.org/ Search PubMed.
- F. Lopes, F. L. Melquiades, C. R. Appoloni, R. Cesareo, M. Rizzutto and T. F. Silva, Thickness determination of gold layer on pre-Columbian objects and a gilding frame, combining pXRF and PLS regression, X-Ray Spectrom., 2016, 45(6), 344–351 CrossRef CAS.
- M. Newville, R. Otten, A. Nelson, A. Ingargiola, S. Till, D. Allan, et al., lmfit/lmfit-py 1.0.2, Zenodo, 2021, available from: https://zenodo.org/record/4516651#.YH_9QugzZ3g Search PubMed.
- J. R. Wolberg, Data Analysis Using the Method of Least Squares: Extracting the Most Information from Experiments, Springer, Berlin, New York, 2006, p. 250 Search PubMed.
- R. Padilla, P. Van Espen, A. Abrahantes and K. Janssens, Semiempirical approach for standardless calibration in μ-XRF spectrometry using capillary lenses: Standardless calibration in μ-XRF using capillary lenses, X-Ray Spectrom., 2005, 34(1), 19–27 CrossRef CAS.
- W. G. Cochran, The χ2 Test of Goodness of Fit, Ann. Math. Stat., 1952, 23(3), 315–345 CrossRef.
| This journal is © The Royal Society of Chemistry 2023 |

