 Open Access Article
Stabilities and performance of single cubic phase dysprosium and zirconium co-doped bismuth oxide electrolytes for low temperature solid oxide fuel cells
Yuan
Gao
a,
Mengxi
Zhong
a,
Jianpeng
Chen
b,
Shouqi
Wang
c,
Binyi
Zhang
a,
Qingzhuo
Li
a,
Wei
Liu
a,
Jiu-Tao
Gao
*a,
Cheng-Xin
Li
 *a and
Chang-Jiu
Li
a
aState Key Laboratory for Mechanical Behavior of Materials, School of Materials Science and Engineering, Xi’an Jiaotong University, Xi’an, Shaanxi, China
bSchool of Materials Science and Engineering, Lanzhou University of Technology, Lanzhou, Gansu, China
cSchool of Materials Science and Engineering, Chang’an University, Xi’an, Shaanxi, China
First published on 26th May 2023
Abstract
Low-temperature solid oxide fuel cells (LT-SOFCs), which can operate at 600 °C or lower, have recently emerged as a promising technology for widespread applications because of their low cost and high stabilities. Novel electrolyte materials with excellent ionic conductivities and stabilities are increasingly in demand for application in LT-SOFCs. Herein, a dysprosium and zirconium co-doped face-centered cubic phase-stabilized bismuth oxide (DZSB) electrolyte has been synthesized using the reverse co-precipitation method. Dysprosium and zirconium are selected to co-dope bismuth oxide because of their large radii and high polarizabilities, which can enhance conductivity stabilities. Dysprosium and zirconium can uniformly replace Bi sites and single-cubic phase DZSB powders of ∼150nm can be synthesized at 700 °C. High relative densities of sintered DZSB pellets (>95%) are obtained via calculations and scanning electron microscopy. D15Z5SB, which contains 15 mol% dysprosium and 5 mol% zirconium, presents the highest ionic conductivity of 0.037 S cm−1 at 500 °C. The activation energy of the ionic conductivity of D2Z5SB shows a single value of 1.23 eV at high- and low-temperature regions. D20Z5SB and D25Z5SB show excellent stabilities for 450 h at 500 °C, with conductivities of 0.007 and 0.0026 S cm−1, respectively.
1. Introduction
Solid oxide fuel cells (SOFCs) are a promising technology owing to their high system efficiencies and fuel flexibilities. Low-temperature SOFCs (LT-SOFCs), which can operate at 600 °C or lower, have high potential for widespread applications because of their low cost and high stabilities.1 Low-cost stainless-steel interconnecting and sealing materials are available.2–4 In addition, advantaged bio alcohols, including methanol and ethanol can be used in LT-SOFCs.5 LT-SOFCs also exhibit the advantages of reduced start-up time and thermal cycling, which can facilitate commercial applications.1,6LT-SOFC electrolytes must exhibit excellent ionic conductivities and stabilities under fuel-cell operating conditions.7 The electrolyte materials commonly used in LT-SOFCs are stabilized zirconium oxide (YSZ, ScSZ, etc.), doped cerium oxide (GDC, SDC, etc.) and stabilized bismuth oxide.8 Among these, δ-Bi2O3, which has a fluorite structure, has the highest oxygen-vacancy concentration of 25%, resulting in the highest ionic conductivity.9,10 Stabilized bismuth oxides can also improve the performance of other electrolytes11 and cathodes.12 However, cubic δ-Bi2O3 exists only stably between 730 and 825 °C,9 while the fluorite phase is transformed into a rhombohedral phase at approximately 650 °C. The δ-phase can be stabilized to exist at considerably lower temperatures via doping with either rare-earth elements or lanthanides. However, the conductivity still changes at ∼600 °C owing to reversible oxygen sub-lattice order–disorder transitions,13 resulting in a rapid decline in ionic conductivity and poor long-term stability.
To improve the δ-phase stability and reduce the oxygen sub-lattice order–disorder transition temperature of bismuth oxides, other metal oxides are commonly doped in the Bi2O3 electrolyte.
Investigations on the fluorite structures, cubic-to-rhombohedral phase transitions, ionic electrical conductivities and stabilities of doped bismuth oxide systems have been reviewed by Azad,13 Greenblatt14 and Sammes.9 To extend the stabilization temperature range of the δ-phase to room temperature, rare-earth oxides have been doped in Bi2O313 such as Y2O3,15–24 Er2O3,25–28 Dy2O3,23,29–31 Gd2O3,20,28,32 Nb2O5,15 Ta2O5,33 and Tm2O3.34 The effects of various rare earth dopants on the electrical conductivities of Bi2O3–Ln2O3 (Ln = Dy, Ho, Er, Tm and Yb) systems were systematically investigated. Ionic radius and doping concentration determine the rate of decrease in ionic conductivity.35
Meng et al.36 reported that a smaller amount of double-dope oxides can remain in the cubic phase at room temperature compared with that of a single dope oxide. Therefore, the effects of co-dopants such as Y–Ln (Ln = Ce,37 Er,38 Gd,39 Nb,39 Sc39 and Zr39), Dy–Ln (Ln = W,40–42 Gd,43 Ce,43 Ho44 and Ta45), Er–Ln (Ln = W,46 N547 and Co48), Eu2O3–Tb4O7,49 La2O3–MoO3,50 Gd2O3–Lu2O3,51 Tb4O7–Gd2O3,52 and Pr2O3–MoO353 have been extensively studied recently. The co-doping of two metal oxides increases the entropies of quaternary systems, facilitating stabilization of δ-Bi2O3 down to room temperature with lower dopant concentrations.36,39
In the 1990s, it was reported that the lattice disordering of oxygen ions is different from crystallographic phase transition, and that the structural stabilities of disordered lattices are related to the dopant type and concentration.54 Stability decay rates decrease with the increase in the dopant radius and concentration. Conductivity degradation below the order–disorder transition temperature is attributable to the long-range ordering of oxygen vacancies and almost all the oxygen ions along the 〈111〉 directions.55,56 The polarizability of dopant cations is related to the stability of the disordered structure and formation of long-range order. The stability of the disordered structure increases with the degree of dopant polarization, which prevents ordering of the anions and thus reduces the degradation of electrical conductivity.57
Dysprosium ions are characterized by their large radii and high polarizabilities. Dysprosium-doped bismuth-oxide systems generally do not show oxygen-ion or vacancy ordering even after 300 h of aging; thus their conductivity degradation remains low.57 Wachsman et al. developed bismuth-oxide electrolytes co-doped with Dy–W (DWSB)40–42 and Dy–Gd (DGSB)58 and investigated their conductivities and long-term stabilities. However, their co-doping effect remains unclear. Doping with a second dopant in smaller concentrations helps to stabilize the face-centred cubic (fcc) structure and increase the conductivities of bismuth oxide electrolytes, especially at lower temperatures.13 Wang et al. co-doped bismuth oxide with Y2O3 and other types of oxides. Y2O3–ZrO2 co-doped bismuth oxide demonstrated the optimal composition among all evaluated systems.39 Moreover, Fund et al. proved that the kinetics of the transformation of Bi2O3-based cubic solid solutions to a rhombohedral phase can be suppressed by the addition of ZrO2.59 The addition of ZrO2 dopants should significantly enhance the cation interdiffusion coefficient and suppress the kinetics of cubic-to-rhombohedral phase transformation without substantially affecting oxygen ion conductivity.
However, order–disorder transition still limits the performance of co-dopant bismuth-oxide systems.
In this study, Dy2O3 and ZrO2 were used as co-dopants to stabilize the cubic structure of fluorite bismuth oxide. The relationship between the doping concentration and conductivity stability related to the structure transformation in the Dy2O3–ZrO2–Bi2O3 system (abbreviated as “DZSB”) was systematically investigated. DZSB powders were prepared using the reverse chemical titration co-precipitation method. Using the co-precipitation method, the dopants were mixed uniformly with bismuth ions at the molecular scale, and nano-powders were obtained.22,23,60 The newly doped bismuth oxides without anionic ordered–disordered transitions exhibited excellent ionic conductivities and long-term stabilities, and may be used as a promising electrolyte in LT-SOFCs.
2. Experimental
2.1 Sample preparation
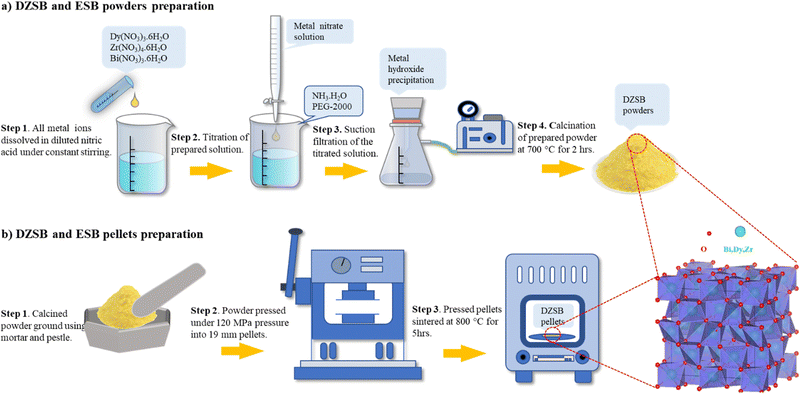
DyxZr0.05Bi0.95−xO1.5−δ powders were prepared using the reverse co-precipitation method, as shown in Fig. 1. In this study, the powders prepared with x = 0.07, 0.10, 0.15, 0.20 and 0.25, were denoted as D7Z5SB, D10Z5SB, D15Z5SB, D20Z5SB, and D25Z5SB, respectively. Erbium stabilized bismuth oxide (20 mol%, 20ESB) was also prepared as a reference sample. Bi(NO3)3·5H2O(≥99.0%, Aladdin), Dy(NO3)3·5H2O (99.99%, Aladdin), and Zr(NO3)4·5H2O (99.99%, Macklin) were used as precursors. The precursors were first dissolved in dilute nitric acid at a certain molar ratio to obtain a solution with a metal-ion concentration of 0.5 mol L−1. Subsequently, a certain amount of ammonia was dissolved in deionized water to obtain a concentration of 1.26 mol L−1. A certain amount of polyethylene glycol with a molecular weight of 2000 (PEG-2000) was added as a dispersant to the ammonia solution to prevent powder agglomeration. The nitrate solution was added dropwise to the ammonia solution with constant stirring, and precipitates were produced continuously. After the titration process, the solution pH value was adjusted to 7–8 to ensure complete precipitation. Subsequently, the precipitates were washed thrice with deionized water and alcohol and dried in an oven at 70 °C for 8 h. The as-prepared powder was calcined at 700 °C for 2 h. Subsequently, the calcined powder was sieved through a 200 mesh by adding 0.05 mL of polyvinyl alcohol (PVA) solution (5 wt%) per gram of the powder. Finally, the powders were uniaxially dry-pressed into 19 mm diameter pellets under 120 MPa pressure, and then sintered at 800 °C for 5 h.2.2 Characterization
The morphologies of the powder and sintered pellets were examined via a scanning electron microscope (TESCAN MIRA3 LMH). The thermal behaviour of the D20Z5SB samples was investigated via differential thermal analysis and thermogravimetric analysis (DTA/TG, METTLER TOLEDO TGA/DSC3+) in an alumina crucible using a PerkinElmer-Diamond analyser (heated to 800 °C with a heating and cooling rate of 10 °C min−1). The prepared DZSB powder was analysed in both the original and post-calcination states. The test was performed at temperatures ranging from 20 °C to 800 °C under a nitrogen atmosphere, at a heating rate of 10 °C min−1. The composition and valence states of the elements were analysed by X-ray photoelectron spectroscopy (Thermo Fisher ESCALAB Xi+) with double anode Al/Mg targets. The crystal structure was analysed using a laser Raman spectrometer (LabRam HR800) with a wavelength of 532 nm. The phases of all samples were analysed at room temperature using a D8-advance (Bruker-AXS) diffractometer, with Cu Kα radiation (λ = 1.5406 Å), a diffraction angle (2θ) ranging from 20° to 80°, and a scanning speed of 0.1 second per step. The lattice parameters of the sintered samples with cubic structures were calculated using Rietveld analysis. The microstructure and elemental composition of the DZSB powder was examined via high-resolution transmission electron microscopy (HR-TEM, JEOL, JEM-2010) at 200 kV using energy-dispersive X-ray analysis equipment (Hitachi). The HR-TEM powder samples were prepared by ultrasonically dispersing a small amount of DZSB powder in ethyl alcohol. A drop of the dispersion was placed on a 300-mesh Cu grid with a carbon-film, and then fully dried in an oven.Electrochemical impedance spectroscopy (EIS) was performed on the samples via the four-point probe method in the frequency range of 0.1 Hz to 10 MHz using Solartron 1260. The electrolyte conductivity was calculated using the sample dimensions and bulk resistances obtained from the high-frequency intercept in the Nyquist plots. Both sides of the pellets were coated with a silver paste with a particle diameter of 6 mm to collect the current. The measurements were performed in air every 50 °C while cooling the samples down from 700 to 300 °C.
3. Results
3.1 Morphologies and sizes of the DyxZr0.05Bi0.95−xO1.5−δ powders
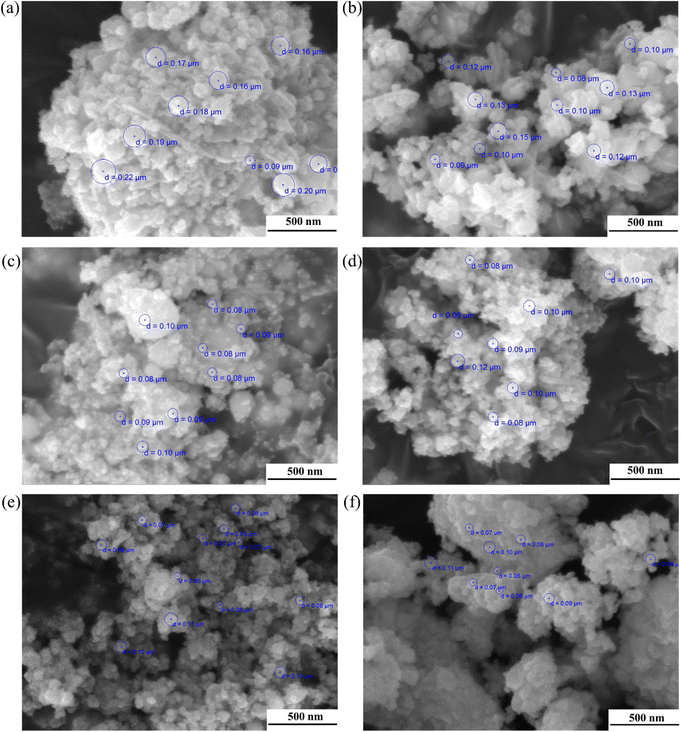
By adding a certain amount of PEG-2000 to the ammonia solution as a dispersant before the reverse co-precipitation process, the average particle size and powder agglomeration could be significantly controlled, as shown in Fig. 2. Fig. 2(a) shows that the particle size of the D7Z5SB powder without PEG after calcination at 500 °C for 2 h was approximately 200 nm. In contrast, with the addition of PEG-2000, the particle size can be reduced to 100 nm. As expected, the degree of powder agglomeration was also significantly lower, as shown in Fig. 2(b)–(f). Therefore, PEG was added to the ammonia solution as a dispersant to prepare nano-scale powders and reduce the agglomeration of all dysprosium and zirconium co-doped bismuth oxides.The particle sizes of all co-doped bismuth-oxide powers were within the range of 80–150 nm, and they exhibited a spherical shape. The powders were slightly agglomerated in some areas, which is quite common for nanoparticles. Because the particle size was at the nanometre level, a large amount of positive and negative charges accumulated on the particle surfaces. Nanoparticles are unstable owing to their large specific surface area and high surface energies. The distances between the nanoparticles were very short, and the van der Waals forces between individual particles were considerably stronger than the effect of gravity on them, which caused them to attract each other. All co-doped bismuth oxide particles were prone to aggregation for the reasons mentioned above. However, powder agglomeration was reduced to some extent by the addition of PEG-2000 as the dispersant.
3.2 Effect of calcination on the structure of the D20Z5SB powder
Fig. 3 shows the thermal behaviour of the D20Z5SB sample. The TG results (solid line in Fig. 3(a)) showed that the loss in the weight of the original D20Z5SB powder gradually increased with the measurement time during the thermal treatment. The endothermic peaks at 252.7 °C and 313.4 °C indicated the volatilization and decomposition of PEG. The endothermic peak at 393.3 °C, 445.2 °C and 490.1 °C indicated the decomposition of dysprosium, bismuth and zirconium hydroxide, respectively. The exothermic peak at 669.7 °C indicated the solution of dysprosium and zirconium in bismuth oxide lattice and the formation of single phase co-doped bismuth oxides. The TG curves of the post-calcined D20Z5SB powder (solid line in Fig. 3(b)) show that the sample did not lose significant weight during the heating process, indicating its stability. No obvious endothermic or exothermic reaction peaks appeared in the DTA results (dotted line in Fig. 3(b)) for the post-calcined D20Z5SB powder, indicating the stability of the phases. Thus, a stable single-cubic phase fluorite structure was formed and maintained after calcination at 700 °C.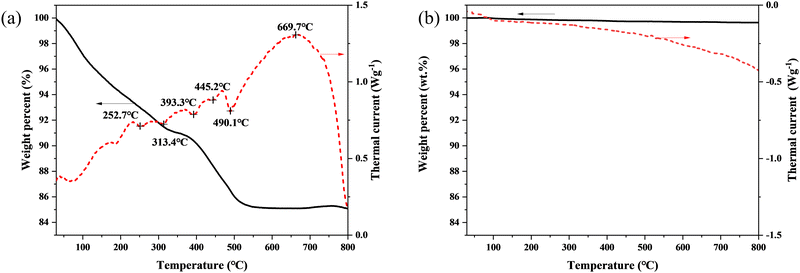 | ||
| Fig. 3 DSC-TG curves of the D20Z5SB powers, (a) before calcination and (b) after calcination at 700 °C for 2 h. | ||
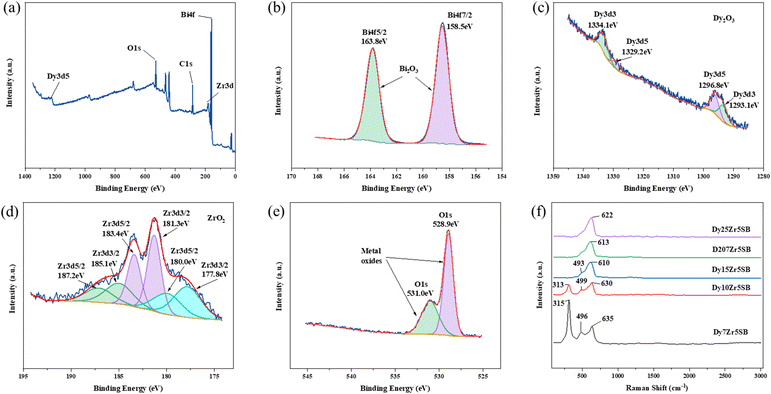
3.3 Effect of dopant Dy3+ concentrations on the phase structure
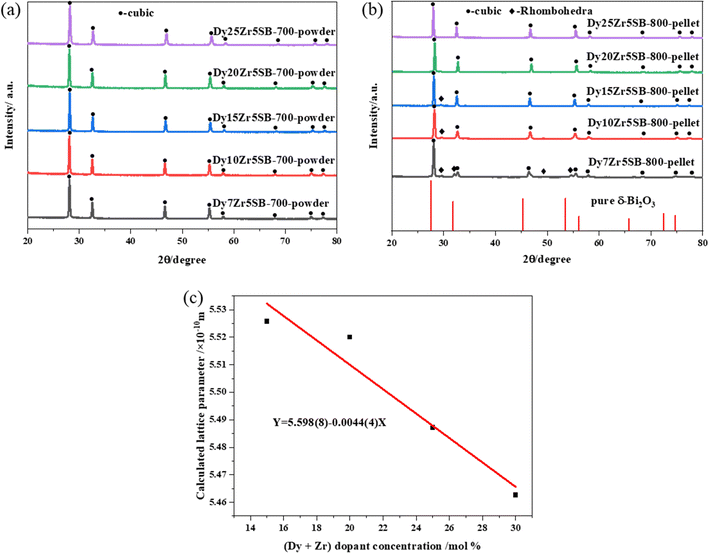
The XPS and Raman spectra of the DZSB pellets sintered at 800 °C are shown in Fig. 4. The Raman spectra in Fig. 4 display the structure change of the DZSB samples with the doping content of the dysprosium elements. When the dysprosium doping content was less than 15 percent, two peaks with a Raman shift of ∼313 and ∼630 cm−1 could be observed in the spectra of D7Z5SB and D10Z5SB samples. However, the peak at ∼313 cm−1 disappeared and the peak at ∼610 cm−1 remained and strengthened in the spectra of D15Z5SB, D20Z5SB and D25Z5SB samples. In order to accurately characterize the photoelectron bands of elements contained in DZSB samples, the effect of dysprosium and zirconium doping on the crystal structure of the D20Z5SB sample were further studied by XPS. As shown in Fig. 4(a), the full spectrum of XPS of the D20Z5SB sample was clearly marked with the positions of the relative orbits of the elements bismuth, dysprosium, and zirconium in the high-resolution spectrum. The narrow spectrum of bismuth element is shown in Fig. 4(b). The peaks at 158.5eV and 163.8 eV in the narrow spectrum are related to Bi 4f 7/2 and Bi 4f 5/2 track, respectively. The narrow XPS spectra of Bi elements indicated the presence of Bi3+. The narrow spectrum of the Dy element is shown in Fig. 4(c). The peaks at 1334.1eV and 1293.1eV in the narrow spectrum are related to Dy 3d3. The peaks at 1329.2eV and 1296.8eV were generated by the Dy3d5 track. The XPS narrow spectrum of the dysprosium element indicates the presence of Dy3+. The narrow spectrum of zirconium is shown in Fig. 4(d). The peaks at 187.2 eV, 183.4 eV and 18.0 eV in the narrow spectrum are correlated with Zr 3d5/2. The peaks at 185.1 eV, 181.3 eV and 177.8 eV were generated by the Zr 3d3/2 track. The narrow XPS spectra of Zr indicate the presence of Zr4+.The XRD spectra of the DZSB powders after calcination at 700 °C are shown in Fig. 5(a). Compared with the standard diffraction peak of δ-Bi2O3, all DZSB samples exhibited a single cubic phase after calcination at 700 °C for 2 h, and the absence of heterogeneous peaks indicates the absence of a second phase. The average particle size of DZSB powders calculated by Debye–Scherrer equation (eqn (1)) was within the range of 30–38 nm, which is a little lower than the measured size by SEM and TEM. In general, the premise is to assume that the grain is “spherical” when XRD is used for accurate grain size calculation. Therefore, it is normal that the calculated particle size is usually smaller than that measured from SEM and TEM.
 | (1) |
The XRD spectra of the DZSB pellets sintered at 800 °C for 5 h are shown in Fig. 5(b). The patterns, when compared with the standard diffraction peak of bismuth dysprosium oxide (PDF card no. 41-1028), showed that D20Z5SB and D25Z5SB compositions behaved as a single-cubic phase. However, a small amount of the rhombohedra phase (diamond dots) co-existed with the main cubic phases (circular dots) in D10Z5SB and D15Z5SB. Moreover, a larger proportion of rhombohedra phases were present in the D7Z5SB sample. The minor peaks at diffraction angles of ∼29.5, 32.1, 49.3, and 54.6° respond to rhombohedral phases according to the literature.59 The rhombohedral shape reported in the literature, which was transformed from the cubic delta face, was a more conducting phase and underwent decomposition with a concurrent decrease in the ionic conductivity at temperatures below 700 °C.13,41 Thus, Fig. 5(b) showed that the cubic phase purity of the sintered DZSB compositions was affected by the total dopant concentration. A single cubic phase was formed while the total dopant concentration of dysprosium and zirconium was more than 20%.
The lattice parameters of the DZSB samples with cubic phase structures are shown in Table 1. The lattice parameters of the doped bismuth oxides were lower than those of pure bismuth oxide (5.6595 Å14). As the ionic radii of Dy3+(1.03 Å) and Zr4+(0.84 Å) are smaller than that of Bi3+(1.17 Å),61 doping Dy3+ and Zr4+ into the lattice of bismuth oxide causes lattice shrinkage. A comparison of the unit-cell parameters of the samples shown in Fig. 5(c) and Table 1 shows that the lattice parameters decreased with increasing dopant concentration, indicating the formation of a solid solution. Doping with smaller cations causes lattice shrinkage, which reduces the atomic motion to a certain extent, thereby preventing the transformation of the cubic phase and facilitating its stability at room temperature.
| Composition | a (Å) [±10−4–10−3] | Theoretical densities (g cm−3) | Practical densities (g cm−3) | Relative densities (%) |
|---|---|---|---|---|
| D10Z5SB | 5.5257 | 8.773 | 8.487 | 96.741 |
| D15Z5SB | 5.5200 | 8.708 | 8.344 | 95.817 |
| D20Z5SB | 5.4872 | 8.772 | 8.637 | 98.458 |
| D25Z5SB | 5.4627 | 8.796 | 8.387 | 95.354 |
The doped cations (Dy3+, and Zr4+) may replace the normal sites of bismuth ions in the fluorite structure of bismuth oxide, which can be described via the following theoretical model:38
 | (2) |
Based on the lattice constants estimated using the Rietveld analysis, eqn (2) was used to estimate the cell mass and volume, and calculate the theoretical density of the DZSB solid solution sample. Based on the practical densities obtained using the Archimedes drainage method, the relative densities were calculated by dividing the practical densities by the theoretical densities. Table 1 shows that the relative densities of all the dysprosium and zirconium co-doped samples were higher than 95%, which was dense enough for their application in SOFCs as electrolytes.
3.4 Microstructure
The microstructures of the samples were further investigated using room-temperature HR-TEM. Fig. 6(a) shows the bright-field image of the D20Z5SB nanoparticles with sizes of 100–200 nm and a spheroid shape, which was consistent with the SEM morphology of the powders shown in Fig. 2. These results showed that the reverse co-precipitation method can be used to prepare nano-sized spherical DZSB powders.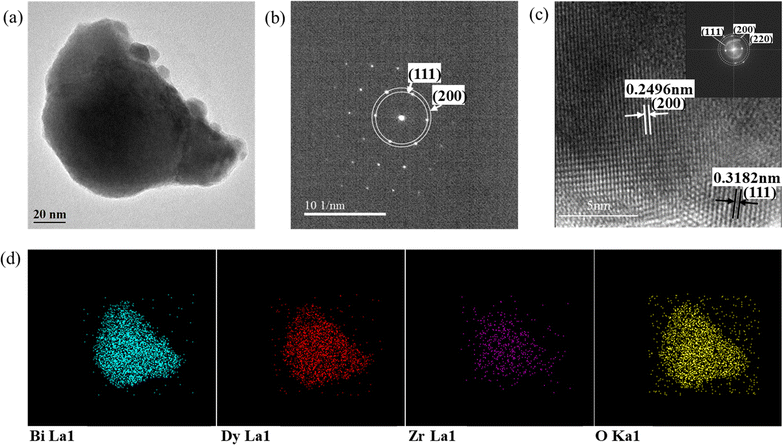 | ||
| Fig. 6 HR-TEM images of Bi0.75Dy0.20Zr0.05O1.5−δ. (a) Bright-field image. (b) SAED pattern obtained from area displayed in Fig. 6(a). (c) Nanocrystalline fringe pattern and inserted Fast Fourier Transform (FFT) of a selected zone of the fringe pattern. (d) EDS mapping. | ||
Fig. 6(b) shows the selected-area electron diffraction (SAED) patterns for the DZSB powders. The bright and intense dots of D20Z5SB can be attributed to the (111) and (220) lattice planes. The lattice fringe pattern as shown in Fig. 6(c) confirmed the existence of different contributing lattice planes, one of which was the (111) plane with a spacing of 0.3182 nm and the other was the (200) plane with a spacing of 0.2496 nm. The results of crystal-plane spacing (dTEM) were consistent with the XRD results for the D20ZSB powder in Fig. 6(a). According to the diffraction angles of the (111) and (200) planes and Bragg's law, the calculated crystal-plane spacings (dXRD) were 0.3152 and 0.2731 nm, respectively.
To confirm the lattice planes, a Fast Fourier Transform (FFT) of the high-resolution image was inserted in Fig. 6(c). The lattice planes could be confirmed as (111), (200) and (220) from the distinct circular rings in the FFT image.
As shown in the EDS elemental map of the nano-sized D20Z5SB particles (Fig. 6(d)), the doped dysprosium and zirconium elements were uniformly distributed in the nano-sized D20Z5SB particles, with no segregation of elements, indicating the presence of dysprosium and zirconium in the bismuth oxide.
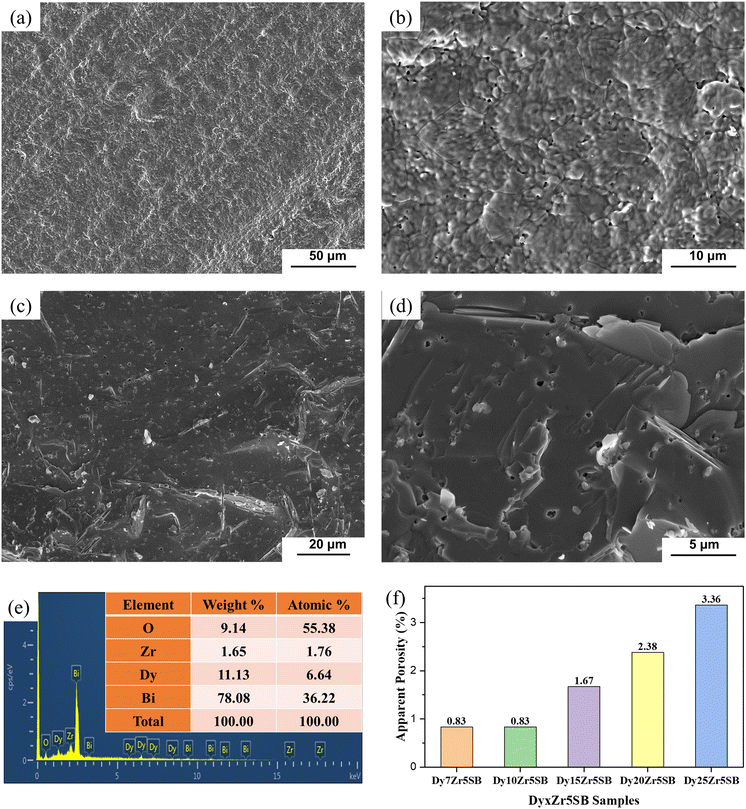
Fig. 7 shows the secondary electron SEM morphology of the surfaces and fractures of the D15Z5SB pellets. Even at higher magnification (Fig. 7(b)), no significant pore formation can be observed, indicating the formation of dense D15Z5SB pellets after sintering at 800 °C for 5 h, which was important for SOFC applications. The EDS results of the D15Z5SB samples shown in Fig. 7(e) and the atomic and weight percentages of each element for the D15Z5SB samples in the inset table clearly confirmed nearly equal stoichiometric ratios of the elements in the prepared sample and designed composition.
Fig. 7(f) shows the apparent porosities of DZSB pellets, as measured using the Archimedes drainage method. The maximum apparent porosity is less than 2.5%. The apparent porosity increased with the dysprosium concentration owing to a higher melting point of Dy2O3 (2330–2350 °C) than that of Bi2O3 (825 °C). These results, combined with the SEM morphology shown Fig. 7(a)–(d), indicate that the sintered DZSB pellets were dense enough to meet the standard requirements for SOFC electrolytes. Moreover, these results were consistent with the relative densities shown in Table 1.
3.5 Effect of the Dy3+ dopant concentration on ionic transport properties
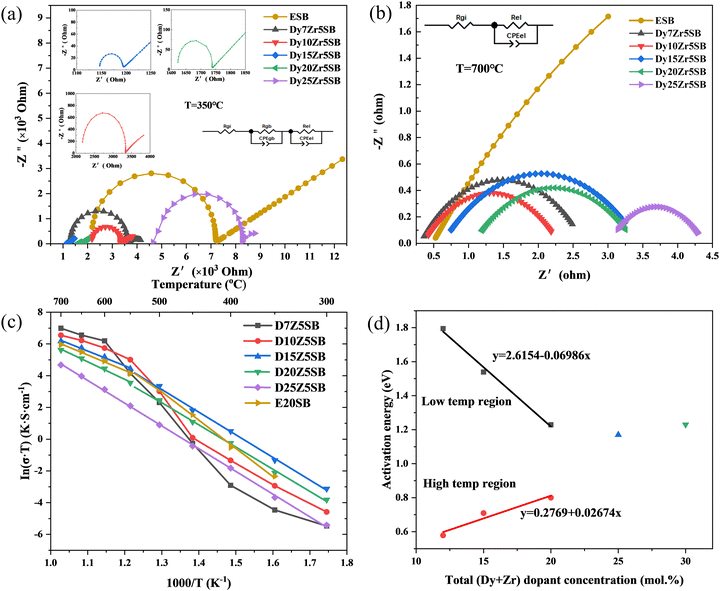
Fig. 8 shows the impedance spectra of all DZSB electrolytes measured at 350 °C (Fig. 8(a)) and 700 °C (Fig. 8(b)). The bulk resistance consisted of the inner-grain and grain-boundary resistances. Typical bulk impedances, which consisted of a single semicircle at higher frequency and the grain-boundary impedance at a lower frequency, are shown in Fig. 8(a). The high-frequency semicircle related to the bulk resistance was not visible with an increase in temperature, as shown in Fig. 8(b).In contrast to the large grain-boundary resistance of 10GDC, a typical cerium-based electrolyte, the grain boundary resistances of the DZSB electrolytes were negligible.42
Bismuth oxide electrolytes have negligible grain-boundary resistance compared with zirconium- and cerium-based electrolytes.62 The larger solid solubilities of the grain boundaries in bismuth-oxide ceramics relative to common impurity components such as silica and alumina can be considered a significant advantage of bismuth-oxide-based electrolytes.62
The bulk conductivities of the DZSB samples and 20ESB are plotted in Fig. 8(c) as ln![[thin space (1/6-em)]](https://www.rsc.org/images/entities/char_2009.gif) σT vs. 1000/T. 20ESB was prepared using a similar reverse co-precipitation synthesis route, as previously described. The measured conductivities of 20ESB measured (∼0.02 S cm−1 at 500 °C) were close to the values reported by Jung et al.26,40 (∼0.0026 S cm−1 at 500 °C) and Shitara et al.63 (∼0.003 S cm−1 at 500 °C), validating our experimental results for DZSB.
σT vs. 1000/T. 20ESB was prepared using a similar reverse co-precipitation synthesis route, as previously described. The measured conductivities of 20ESB measured (∼0.02 S cm−1 at 500 °C) were close to the values reported by Jung et al.26,40 (∼0.0026 S cm−1 at 500 °C) and Shitara et al.63 (∼0.003 S cm−1 at 500 °C), validating our experimental results for DZSB.
D15Z5SB showed the highest conductivity among all DZSB compositions. The conductivities of D15Z5SB were 0.493 and 0.037 S cm−1 at 700 and 500 °C, respectively. Specifically, D15Z5SB exhibited a more beneficial conductivity than the others at 500 °C, which was 8, 10, and 100 times those of 20ESB, 10GDC, and 10YSZ. Therefore, DZSB may be an attractive electrolyte for low-temperature applications, as the samples have demonstrated advantageous performance for low-temperature solid oxide fuel cells.
4. Discussion
4.1 Ionic conductivities and activation energies of DZSB samples
The following empirical equation expresses the relationship between temperature and ionic conductivity: | (3) |
Table 2 shows the conductivity activation energies of the DZSB samples and 20ESB measured below and above 600 °C. The conductivity activation energy of stable cubic bismuth oxide changes at ∼ 600 °C, possibly owing to the order–disorder transformations in the oxygen lattice. The oxygen sublattice remains disordered above the order–disorder transition temperature and becomes ordered below it.
| Sample | E a (eV) low-temperature | E a (eV) high-temperature | ΔEa (eV) | Transition temperature |
|---|---|---|---|---|
| D7Z5SB | 1.79 | 0.58 | 1.22 | 600 °C |
| D10Z5SB | 1.54 | 0.71 | 0.83 | 550 °C |
| D15Z5SB | 1.23 | 0.80 | 0.32 | 500 °C |
| D20Z5SB | 1.17 | 1.23 | 0.06 | 500 °C |
| D25Z5SB | 1.23 | 1.23 | 0.00 | — |
| E20SB | 1.53 | 0.84 | 0.69 | 500 °C |
Table 2 lists the conductivity activation energies of the DZSB samples and 20ESB. The sub-lattice of the oxygen ions in stable cubic bismuth oxide undergoes an order–disorder transition at ∼600 °C, which is reflected in the change in the activation energy of electrical conductivity below and above this temperature.13
Fig. 8(c) and Table 2 show that the electrical conductivities and activation energies of D7Z5SB undergo an abrupt change below 600 °C, which can be attributed to the phase transformation from cubic to rhombohedral. Above 600 °C, the conductivity of D7Z5SB was the highest among all DZSB compositions. However, the conductivity degradation of D7Z5SB with a small total dopant concentration was notable, indicating that the electrolyte was unstable in the low temperature range. D10Z5SB showed a similar change in conductivity and activation energy as D7Z5SB. Together, the XRD patterns and conductivity results indicate that more than 15 mol% of total dopant concentration was necessary to obtain a stable fcc structure for DZSB.
As shown in Fig. 8(d), at a total dopant concentration less than 20 mol%, the conductivity activation energy in the temperature region above 550 °C increased with the total dopant concentration, while the conductivity activation energy in the low-temperature region exhibited the opposite trend. Thus, the difference between the two activation energies decreased, and hence the low-temperature activation energy may be the same as the high-temperature activation energy at higher dopant concentrations. Fig. 7(d) and Table 2 show that D25Z5SB had a single activation energy of 1.23 eV, which indicated that when the total dysprosium and zirconium dopant concentrations were above 25 mol%, the anion disorder to order transition was effectively suppressed. The conductivity activation energy of pure δ-Bi2O3 can be calculated as 0.28 eV by extrapolating the doping concentration from 12–25 mol% to 0 mol%. The calculated value was close to 0.29 eV reported by Jung.41
Table 3 lists various reported co-doped bismuth oxide ionic conductivities and activation energies. Wachsman et al.41,42 reported that 15D5WSB has an ionic conductivity of 0.016 S cm−1 at 500 °C (compared to 0.037 S cm−1 of D15Z5SB, as reported in this study). Wachsman et al.45 also reported that the (Dy2O3)0.13(Ta2O5)0.02(Bi2O3)0.85 system has an ionic conductivity of 0.08 S cm−1 at 500 °C; however, they did not report its stability. Wei47 reported that (Bi2O3)0.9(Er2O3)0.067(Nb2O5)0.033 exhibited the highest electric conductivity of 1.26 × 10⁻² S cm−1 at 500 °C, which significantly decreases after annealing at 650 °C for 300 h. Shitara et al.63 proposed that (Bi2O3)0.80(Er2O3)0.15(Nb2O5)0.025(WO3)0.025 has an ionic conductivity of 0.035 S cm−1 at 500 °C. In comparison, (BiO1.5)0.75(DyO1.5)0.15(ZrO2)0.05 prepared in this study exhibits a conductivity of 0.037 S cm−1 at 500 °C.
| No. | Composition | Conductivity (S cm−1) | Temperature/°C | Low temperature activation energy (eV) | High temperature activation energy (eV) | Ref. |
|---|---|---|---|---|---|---|
| 1 | (Bi2O3)0.735(Er2O3)0.21(WO3)0.055 | 0.05 | 550 | 0.9 (550 °C) | 0.67 (650 °C) | 46 |
| 2 | (BiO1.5)0.80(DyO1.5)0.15(WO3)0.05 | 0.016 | 500 | — | — | 42 |
| (BiO1.5)0.88(DyO1.5)0.08(WO3)0.04 | 0.087 | 500 | 0.29 (T ≤ 550 °C) | 0.47 (T ≥ 550 °C) | 41 | |
| 3 | (Bi2O3)0.88(Dy2O3)0.06(Ho2O3)0.06 | 3.94 × 10⁻³ | 300 | 0.8 | — | 44 |
| 4 | (Bi2O3)0.9(Er2O3)0.067(Nb2O5)0.033 | 1.26 × 10⁻² | 500 | 1.17 (T ≤ 600 °C) | 0.89 (T ≥ 600 °C) | 47 |
| 5 | (Bi2O3)0.9(Tb4O7)0.05(Gd2O3)0.05 | 3.88 × 10⁻¹ | 850 | 0.64 | 52 | |
| 6 | (Bi2O3)0.80(Gd2O3)0.1(Lu2O3)0.10 | 0.092 | 650 | 0.5104 | 51 | |
| 7 | (Bi0.75Y0.25)1.86Ce0.14O3 ± δ | 0.011 | 500 | 1.06 | 64 | |
| 8 | (Bi2O3)0.76(Y2O3)0.14(Sc2O3)0.10 | 0.2 | 600 | — | — | 39 |
| 9 | (BiO1.5)0.76(YO1.5)0.2(ZrO2)0.04 | 0.27 | 600 | — | — | 39 |
| 10 | (Bi2O3)0.88(Dy2O3)0.08(Gd2O3)0.04 | 0.18 | 600 | — | — | 58 |
| 11 | (Bi2O3)0.90(Tb4O7)0.05 (Eu2O3)0.05 | 0.728 | 850 | 0.64 | 49 | |
| 12 | (Bi2O3)0.8(La2O3)0.1(MoO3)0.1 | 0.6 | 800 | 0.7–0.8 | 50 | |
| 13 | (Bi2O3)0.8(Pr2O3)0.1(MoO3)0.1 | 0.4 | 800 | 0.92 (T < 520 °C) | 0.57 (T >520 °C) | 53 |
| 14 | (Bi2O3)0.85(Dy2O3)0.13(Ta2O5)0.02 | 0.08 | 500 | 0.20 (T < 550 °C) | 45 | |
| 15 | (Bi2O3)0.80(Er2O3)0.15(Nb2O5)0.025(WO3)0.025 | 0.035 | 500 | — | — | 63 |
| 16 | (BiO1.5)0.75(DyO1.5)0.15(ZrO2)0.05 | 0.037 | 500 | 1.23(T < 500 °C) | 0.91 (T > 500 °C) | (This work) |
4.2 Time dependence of the conductivity decay
Based on the excellent conductivities of D15Z5SB, D20Z5SB and D25Z5SB, long-term stability tests were also carried out for the samples at 600 °C for 150 h and at 500 °C for 450 h with 20ESB as a reference sample.Fig. 9(a) shows the conductivity curves of the samples maintained at 600 °C for 150 h. During annealing for 150 h, the conductivities of D15Z5SB and D20Z5SB showed a negligible decrease. When the concentration of the dysprosium dopant increases to 25 mol%, the conductivity of D25Z5SB remained stable at ∼0.016 S cm−1, without any degradation. The conductivity of the reference sample 20ESB experienced rapid degradation in the first 50 h, and then slowly attenuated at a low level, which may be attributed to its structural instability.
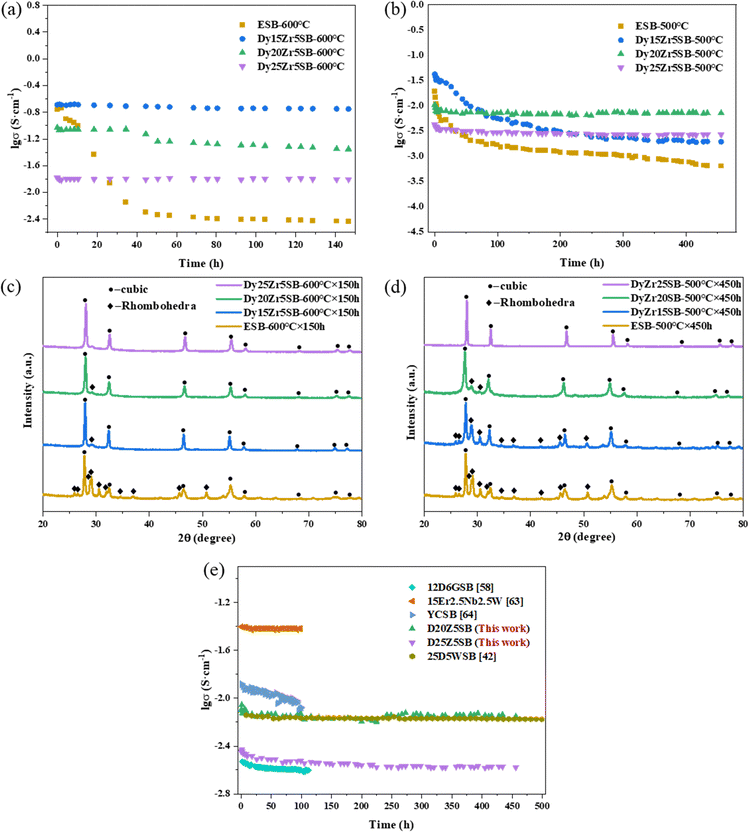 | ||
| Fig. 9 Long-term stabilities of D15Z5SB, D20Z5SB, D25Z5SB and ESB. (a) Conductivities after annealing at 600 °C for 150 h. (b) Conductivity after annealing at 500 °C for 450 h. (c) XRD patterns after annealing at 600 °C for 150 h, (d) XRD patterns after annealing at 500 °C for 450 h, and (e) comparison of the long term conductivities of 10D5GSB,58 15Er2.5Nb2.5W,63 YCSB,64 25D5WSB,42 D20Z5SB and D25Z5SB after annealing at various periods. | ||
Fig. 9(b) shows the conductivity of the samples as a function of time at 500 °C. The conductivity of the D15Z5SB sample initially rapidly decreased, followed by a gradual decrease. The conductivities of D20Zr5SB and D25Z5SB slightly decreased during the first 30 h and then remained constant. With an increase in the dopant concentration, the degree of degradation in the initial stage decreased. Thus, the conductivity of the DZSB samples is relatively stable at 500 °C with an increase in the concentration of the dysprosium dopant to 20 and 25 mol% at a constant concentration of 5 mol% zirconium. At 500 °C, reference sample E20SB exhibited a degradation behaviour similar to that at 600 °C: the conductivity rapidly decreased in the initial stage and then slowly decreased. Thus, a better conductivity stability can be obtained with a higher dopant concentration at this temperature, which may be attributed to a higher structural stability.
Table 4 lists the conductivities of the DZSB samples and E20SB before and after being annealed at 500 °C for 50, 150, 250, 350 and 450 h. For D20ZSB and D25Z5SB, negligible degradation was observed for 450 h, and the conductivities were 3.6 and 1.4 times that of E20SB after 450 and 50 h of annealing, respectively.
| Composition | Conductivity (S cm−1) | |||||
|---|---|---|---|---|---|---|
| σ (t = 0 h) | σ (t = 50 h) | σ (t = 150 h) | σ (t = 250 h) | σ (t = 350 h) | σ (t = 450 h) | |
| D15Z5SB | 0.042 | 0.0084 | 0.0035 | 0.0024 | 0.0021 | 0.0019 |
| D20Z5SB | 0.010 | 0.0073 | 0.0068 | 0.0072 | 0.0072 | 0.0071 |
| D25Z5SB | 0.0043 | 0.0031 | 0.0028 | 0.0027 | 0.0027 | 0.0026 |
| E20SB | 0.019 | 0.0060 | 0.0013 | 0.0011 | 0.00093 | 0.00073 |
To analyse the phase transformation in the DZSB samples after annealing at 600 °C for 150 h and 500 °C for 450 h, XRD patterns are shown in Fig. 9(c) and (d). As reported by Fung,59 Bi2O3 based cubic solid solutions undergo transformation to a rhombohedral phase when annealed at temperatures ⩽635 °C. However, the XRD patterns showed that there was negligible cubic-to-rhombohedral phase transition in D15Z5SB, D20ZrSB, and Z25Z5SB while it was quite obvious in ESB after annealing at 600 °C for 150 h. The XRD patterns of the DZSB samples after long-term operation at 600 °C were almost the same as the original patterns shown in Fig. 5. After annealing at 500 °C for 450 h, D15Z5SB underwent significant phase transformation from cubic to rhombohedral. The crystallinity of D20Z5SB decreased as the XRD peaks widened, and the fcc structure was maintained. Moreover, the rhombohedral phase was significantly less abundant than that in D15Z5SB, while D25Z5SB maintained the cubic fluorite structure for 450 h. The phase changes in the DZSB samples were consistent with the changes of their conductivities, as shown in Fig. 9(b). After annealing for a particular period, the anions began to form an ordered structure and the secondary phase gradually transformed, resulting in different degrees of degradation in the conductivities of D15Z5SB and D20Z5SB. However, D25Z5SB remained stable even after 450 h, and no phase instability was observed in the sample.
The change in conductivity degradation over time can be expressed by the following empirical eqn (4):65
 | (4) |
The time constants calculated using eqn (3) are shown in Table 5. The time constant at 500 °C is determined by the dopant type and concentration. With an increasing concentration of the dysprosium, the DZSB composition exhibited a larger time constant, indicating a more stable fcc structure.
| Composition | ESB-500 °C | Dy15Zr5SB-500 °C | Dy20Zr5SB-500 °C | Dy25Zr5SB-500 °C |
|---|---|---|---|---|
| Time constant/h | 10.39 | 39.65 | 8118.56 | 19743.98 |
The long-term conductivity stabilities of various co-doped bismuth oxides had been previously reported, as shown in Fig. 9(d). Wachsman et al. observed that the conductivity of (DyO1.5)0.25(WO3)0.05(BiO1.5)0.70 (25D5WSB) remained constant at 0.0068 S cm−1 without significant degradation after 500 h of annealing at 500 °C and that the cubic phase was stable.42 They reported that 12D6GSB retained its initial conductivity of ∼0.074 S cm−1 for 100 h and the transition from the cubic to rhombohedral phase was almost complete during the initial measurement of conductivities.58 The stability of yttrium–cerium co-doped bismuth oxide (Bi0.75Y0.25)1.86Ce0.14O3±δ, (YCSB) has also been investigated, and a minor degradation of conductivity has been reported.64 The conductivity of (Bi2O3)0.80(Er2O3)0.15(Nb2O5)0.025(WO3)0.025 after annealing for 100 h is the same as the initial value of 0.035 S cm−1 owing to the absence of an aging effect.63 The suitability of a material as an SOFC electrolyte can be assessed based on its conductivity stability. The conductivity of D20Z5SB was 0.007 S cm−1 after annealing for 450 h, which is comparable with those of reported co-doped bismuth oxides, and slightly higher than that of 25D5WSB, owing to a larger ionic radius of Zr4+ than W6+.42,61
5. Conclusions
A dysprosium–zirconium co-doped face-centered cubic (fcc) phase stabilized bismuth oxide (DZSB) solid electrolyte was synthesized using the reverse co-precipitation method. Dysprosium and zirconium were selected to co-dope bismuth oxide to enhance conductivity stability. All co-doped systems exhibited complete phase stabilization. The relative densities of the sintered DZSB pellets exceeded 95%. D15Z5SB showed the highest conductivity of 0.037S cm−1 at 500 °C, which was comparable with those of reported doped bismuth oxide systems. D20Z5SB and D25Z5SB exhibited superior conductivity stabilities at 500 °C for 450 h, which were comparable with those of most reported co-doped bismuth oxides, and slightly higher than that of 25D5WSB. This study enables a better understanding of the correlation interactions between dopant systems and their concentrations and the structure transformation, and provides a strategy for stabilizing bismuth oxides with excellent conductivities and stabilities, which may be extensively applied in low temperature SOFCs.Author contributions
Yuan Gao: conceptualization, methodology, investigation, validation, visualization, and writing – original draft. Zhong Mengxi: methodology, investigation, and writing – editing. Chen Jianpeng: methodology and visualization. Wang Shouqi: methodology and visualization. Zhang binyi: methodology and visualization. Li Qingzhuo: methodology and visualization. Liu Wei: methodology and visualization. Jiu-Tao Gao: conceptualization, investigation, validation, visualization, and review and editing. Chengxin-Li: conceptualization, investigation, validation, discussion, funding acquisition, and review and editing. Chang-Jiu Li: validation, discussion, and review and editing.Conflicts of interest
There are no conflicts to declare.Acknowledgements
This research was financially supported by the national key research and development program of China (no. 2021YFB4001400). This work was supported by Xi'an Advanced Functional Coating Technology International Science and Technology Cooperation Base. This work was also supported by an enterprise cooperation program (no. 20200871) funded by Shandong Energy Group. The author would like to thank Dr Senhui Liu and Zaheer Ud Din Babar for their help polishing the article's language.Notes and references
- R. Raza, B. Zhu, A. Rafique, M. R. Naqvi and P. Lund, Mater. Today Energy, 2020, 15, 1–16 Search PubMed.
- I. Antepara, I. Villarreal, L. M. Rodriguez-Martinez, N. Lecanda, U. Castro and A. Laresgoiti, J. Power Sources, 2005, 151, 103–107 CrossRef CAS.
- S. Fontana, R. Amendola, S. Chevalier, P. Piccardo, G. Caboche, M. Viviani, R. Molins and M. Sennour, J. Power Sources, 2007, 171, 652–662 CrossRef CAS.
- V. V. Krishnan, Wiley Interdiscip. Rev.: Energy Environ., 2017, 6, 1–35 Search PubMed.
- H. Su and Y. H. Hu, Chem. Eng. J., 2020, 402, 1–20 Search PubMed.
- E. D. Wachsman and K. T. Lee, Science, 2011, 334, 935–939 CrossRef CAS PubMed.
- H. Shi, C. Su, R. Ran, J. Cao and Z. Shao, Prog. Nat. Sci.: Mater. Int., 2020, 30, 764–774 CrossRef CAS.
- B. Singh, S. Ghosh, S. Aich and B. Roy, J. Power Sources, 2017, 339, 103–135 CrossRef CAS.
- N. M. Sammes, G. A. Tompsett, H. Nafe and F. Aldinger, J. Eur. Ceram. Soc., 1999, 19, 1801–1826 CrossRef CAS.
- H. I. Takehiko Takahashi, Mat. Res. Bull., 1978, 13, 1447–1453 CrossRef.
- D. W. Joh, J. H. Park, D. Y. Kim, B.-H. Yun and K. T. Lee, J. Power Sources, 2016, 320, 267–273 CrossRef CAS.
- S. J. Kim, A. M. Dayaghi, K. J. Kim and G. M. Choi, J. Power Sources, 2017, 344, 218–222 CrossRef CAS.
- A. M. Azad, S. Larose and S. A. Akbar, J. Mater. Sci., 1994, 29, 4135–4151 CrossRef CAS.
- P. Shuk, H. D. Wiemhofer, U. Guth, W. Gopel and M. Greenblatt, Solid State Ionics, 1996, 89, 179–196 CrossRef CAS.
- S. K. Ashok, V. Joshi, J. Nachlas, J. Diamond and N. Weber, J. Mater. Sci., 1990, 25, 1237–1245 CrossRef.
- H. Kruidhof, K. J. Devries and A. J. Burggraaf, Solid State Ionics, 1990, 37, 213–215 CrossRef CAS.
- Y. S. Ayhan and A. Buyukaksoy, Solid State Ionics, 2019, 338, 66–73 CrossRef CAS.
- A. Watanabe, Solid State Ionics, 1996, 86–88, 1427–1430 CrossRef CAS.
- Y. Zeng and Y. S. Lin, J. Catal., 1999, 182, 30–36 CrossRef CAS.
- S. Ekhelikar and G. K. Bichile, Biomater. Sci., 2004, 27, 19–22 CAS.
- Q. Zhen, G. Kale, G. Shi, R. Li, W. He and J. Liu, Solid State Ionics, 2005, 176, 2727–2733 CrossRef CAS.
- J. G. Lee, S. H. Kim and H. H. Yoon, J. Nanosci. Nanotechnol., 2011, 11, 820–823 CrossRef CAS PubMed.
- R. Li, Q. Zhen, M. Drache, A. Rubbens, C. Estournes and R.-N. Vannier, Solid State Ionics, 2011, 198, 6–15 CrossRef CAS.
- M. Y. Tan, K. B. Tan, Z. Zainal, C. C. Khaw and S. K. Chen, Ceram. Int., 2012, 38, 3403–3409 CrossRef CAS.
- H. Kruidhof, H. J. M. Bouwmeester, K. J. Devries, P. J. Gellings and A. J. Burggraaf, Solid State Ionics, 1992, 50, 181–186 CrossRef CAS.
- K. K. M. J. Verkerk and A. J. Burggraaf, J. Appl. Electrochem., 1980, 10, 81–90 CrossRef.
- S. Sanna, V. Esposito, C. Graves, J. Hjelm, J. W. Andreasen and N. Pryds, Solid State Ionics, 2014, 266, 13–18 CrossRef CAS.
- S. Sanna, V. Esposito, J. W. Andreasen, J. Hjelm, W. Zhang, T. Kasama, S. B. Simonsen, M. Christensen, S. Linderoth and N. Pryds, Nat. Mater., 2015, 14, 500–504 CrossRef CAS PubMed.
- S. Bandyopadhyay and A. Dutta, RSC Adv., 2015, 5, 65123–65132 RSC.
- S. Bandyopadhyay and A. Dutta, J. Alloys Compd., 2016, 682, 80–88 CrossRef CAS.
- S. Bandyopadhyay and A. Dutta, J. Phys. Chem. Solids, 2017, 102, 12–20 CrossRef CAS.
- M. Ari, I. Tascioglu, S. Altindal, I. Uslu, A. Aytimur, T. Karaaslan and S. Kocyigit, Mater. Chem. Phys., 2012, 136, 942–946 CrossRef CAS.
- S. E. Lin and W. C. J. Wei, J. Eur. Ceram. Soc., 2011, 31, 3081–3086 CrossRef CAS.
- A. Dapčević, D. Poleti, J. Rogan, A. Radojković, M. Radović and G. Branković, Solid State Ionics, 2015, 280, 18–23 CrossRef.
- S. Bandyopadhyay, S. Anirban, A. Sinha and A. Dutta, 61st Dae-Solid State Physics Symposium, 2017, 1832.
- G. Meng, C. Chen, X. Han, P. Yang and D. Peng, Solid State Ionics, 1988, 28–30, 533–538 CrossRef.
- M. F. Keqin Huang and J. B. Goodenough, Solid State lonics, 1996, 89, 17–24 CrossRef.
- S. Arasteh, A. Maghsoudipour, M. Alizadeh and A. Nemati, Ceram. Int., 2011, 37, 3451–3455 CrossRef CAS.
- S.-F. Wang, Y.-F. Hsu, W.-C. Tsai and H.-C. Lu, J. Power Sources, 2012, 218, 106–112 CrossRef CAS.
- D. W. Jung, K. L. Duncan, M. A. Camaratta, K. T. Lee, J. C. Nino and E. D. Wachsman, J. Am. Ceram. Soc., 2010, 93, 1384–1391 CAS.
- D. W. Jung, K. L. Duncan and E. D. Wachsman, Acta Mater., 2010, 58, 355–363 CrossRef CAS.
- D. W. Jung, J. C. Nino, K. L. Duncan, S. R. Bishop and E. D. Wachsman, Ionics, 2010, 16, 97–103 CrossRef CAS.
- A. L. Ruth, K. T. Lee, M. C. Clites and E. D. Wachsman, Solid State Ionics, 2014, 64, 135–141 CAS.
- S. Bandyopadhyay and A. Dutta, J. Electroanal. Chem., 2018, 817, 55–64 CrossRef CAS.
- P. S. Cardenas-Terrazas, M. T. Ayala-Ayala, J. Muñoz-Saldaña, A. F. Fuentes, D. A. Leal-Chavez, J. E. Ledezma-Sillas, C. Carreño-Gallardo and J. M. Herrera-Ramirez, Ionics, 2020, 26, 4579–4586 CrossRef CAS.
- A. Watanabe and M. Sekita, Solid State Ionics, 2005, 176, 2429–2433 CrossRef CAS.
- T. Chou, L.-D. Liu and W.-C. J. Wei, J. Eur. Ceram. Soc., 2011, 31, 3087–3094 CrossRef CAS.
- N. I. Matskevich, T. Wolf, P. Adelmann, D. Fuchs, A. Semerikova and M. Y. Matskevich, J. Chem. Thermodyn., 2018, 116, 147–151 CrossRef CAS.
- İ. Ermiş, M. Arı, S. D. Acer and Y. Dağdemir, Int. J. Hydrogen Energy, 2015, 40, 9485–9490 CrossRef.
- E. I. Orlova, E. P. Kharitonova, N. V. Gorshkov, V. G. Goffman and V. I. Voronkova, Solid State Ionics, 2017, 302, 158–164 CrossRef CAS.
- Y. Polat, H. Akalan and M. Arı, Int. J. Hydrogen Energy, 2017, 42, 614–622 CrossRef CAS.
- İ. Ermiş and S. P. S. Shaikh, Ceram. Int., 2018, 44, 18776–18782 CrossRef.
- E. P. Kharitonova, E. I. Orlova, N. V. Gorshkov, V. G. Goffman and V. I. Voronkova, Ceram. Int., 2018, 44, 12886–12895 CrossRef CAS.
- N. X. Jiang and E. D. Wachsman, J. Am. Ceram. Soc., 1999, 82, 3057–3064 CrossRef CAS.
- S. Boyapati, E. D. Wachsman and B. C. Chakoumakos, Solid State Ionics, 2001, 138, 293–304 CrossRef CAS.
- S. Boyapati, E. D. Wachsman and N. X. Jiang, Solid State Ionics, 2001, 140, 149–160 CrossRef CAS.
- E. D. Wachsman, S. Boyapati and N. Jiang, Ionics, 2001, 7, 1–6 CrossRef CAS.
- D. W. Jung, K. T. Lee and E. D. Wachsman, J. Electrochem. Soc., 2016, 163, F411–F415 CrossRef CAS.
- J. C. Kuan Zong Fung and Anil V. Virkar, J. Am. Ceram. Soc., 1993, 76, 2403–2418 CrossRef.
- R. Li, Q. Zhen, M. Drache, A. Rubbens and R.-N. Vannier, J. Alloys Compd., 2010, 494, 446–450 CrossRef CAS.
- J. Nicholas and L. Dejonghe, Solid State Ionics, 2007, 178, 1187–1194 CrossRef CAS.
- H. J. Jung and S.-Y. Chung, J. Korean Ceram. Soc., 2017, 54, 413–421 CrossRef CAS.
- K. Shitara, T. Moriasa, A. Sumitani, A. Seko, H. Hayashi, Y. Koyama, R. Huang, D. Han, H. Moriwake and I. Tanaka, Chem. Mater., 2017, 29, 3763–3768 CrossRef CAS.
- A. Pesaran, A. Jaiswal, Y. Ren and E. D. Wachsman, Ionics, 2019, 25, 3153–3164 CrossRef CAS.
- E. D. Wachsman, J. Eur. Ceram. Soc., 2004, 24, 1281–1285 CrossRef CAS.
| This journal is © The Royal Society of Chemistry 2023 |

