DOI:
10.1039/D3MA00153A
(Paper)
Mater. Adv., 2023,
4, 2821-2830
Improved thermoelectric performance of Co-doped β-FeSi2 by Ni substitution†
Received
1st April 2023
, Accepted 29th May 2023
First published on 30th May 2023
Abstract
Employing thermoelectric (TE) materials, which can directly convert heat into electricity, are a promising strategy for recovering industrial waste heat. Currently, TE materials with an acceptable conversion performance are expensive and toxic. Therefore, this work aims to enhance the TE performance of inexpensive and eco-friendly Co-doped iron silicide compounds by Ni addition. The investigation of the structural, electrical, and TE characteristics of Ni-alloyed β-Fe0.97−xNixCo0.03Si2 (x = 0, 0.005, 0.01, 0.02, and 0.03) fabricated by the arc-melting process is reported in this study. The results show that the metallic ε-phase increased with x, resulting in a decrease in the solubility of the Ni and Co alloy material. However, the mobility (μH) significantly improved from 3.5(6) up to 25(5) cm2 V−1 s−1 with Ni substitution, which is 7 times higher than the x = 0 sample. At high temperatures, the electrical resistivity of the Ni-substituted samples was remarkably lower than that of the x = 0 sample owing to the enhancement of μH. The presence of the ε-phase induced a negative impact on the Seebeck coefficient, and the thermal conductivity slightly decreased with x because of the increase in porosity. As a result, the optimum condition to improve the power factor and dimensionless figure of merit was achieved in the x = 0.01 sample with the maximum PFmax of 2400 μW m−1 K−2 and ZTmax of 0.31, indicating a three-fold enhancement compared with the x = 0 sample.
1. Introduction
Thermoelectric (TE) generator, a solid-state device, is one of the promising solutions for harvesting the excess heat dissipated by the exhaust systems of various industrial plants1,2 and automobiles3–5 and directly converting it to electricity without employing any moving parts and causing gas pollution. The efficiency of the TE device is mainly proportional to the performance of the assembled TE materials, which is evaluated by the dimensionless figure of merit (ZT) according to eqn (1):where S, ρ, κ, and T represent the Seebeck coefficient, electrical resistivity, total thermal conductivity, and temperature, respectively.6 The term S2ρ−1 is usually assigned as the power factor (PF = S2ρ−1), and the total thermal conductivity is the sum of the lattice and carrier thermal conductivity components (κ = κl+ κe). Bi2Te3 and PbTe are traditional TE materials that are known for toxicity and high price. To solve this issue, researchers have been striving to improve the performance of low-cost, less-toxic, and eco-friendly compounds, such as oxides,7–10 sulfides,11,12 Heusler intermetallic alloys,13,14 and iron silicide.15–18 Among these materials, iron silicide is an attractive material to use at high temperatures because of its stable thermal properties and ability to withstand oxidation.19 Notably, iron silicide has three different phases, namely α-phase (α-Fe2Si5 crystallizes with a tetragonal structure and the space group of P4/mmm),15 ε-phase (ε-FeSi crystallizes with a cubic structure and the space group of P213),16 and β-phase (β-FeSi2 crystallizes with an orthorhombic structure and the space group of Cmce).17 The phase transition of this material is dependent on the condition of heat treatment and the amount and kind of external impurity added, while pure β-FeSi2 can be grown at temperatures below 1259 K, and α and ε-phases are formed above 1259 K.20 The ε and α-phases are metallic phases21 and are not suitable as TE materials because of the low Seebeck coefficient (S). Therefore, only the semiconducting β-phase with a narrow energy gap (Eg = 0.7 eV) is favorable for TE research.22 It has been noted that the TE performance of pure β-FeSi2 is still low owing to its high κ and low PF. Therefore, previous studies attempted to minimize the κ of β-FeSi2 by introducing stacking fault,23 doping with heavy elements,24,25 rapid solidification and hot pressing to reduce grain size,26 and other nano-structuring techniques.27 On the other hand, the PF value of β-FeSi2 is low due to the high ρ and low |S| in the high-temperature regions, where the bipolar effect occurs because of a low carrier density (nH) of about 106 cm−3 and a small band gap of about 0.7 eV. This bipolar effect can be reduced by increasing nH with the addition of appropriate external impurities and consequently, the |S| can be enhanced.28–30 Based on Drude's theory of semiconductors, the increase in nH can simultaneously reduce ρ. In other words, by alloying β-FeSi2 with appropriate impurities that have different valence electrons to occupy the Fe or Si site, an improvement in the PF and ZT value of β-FeSi2 can be effectively obtained. Hence, researchers have been trying to improve the TE properties of binary β-FeSi2 by alloying it with various elements.
Zhao et al. reported that Mn-doped β-Fe1−xMnxSi2 prepared by the hot-pressing method exhibited a maximum ZT of 0.17 at 837 K. This maximum ZT value was mainly caused by the improvement in PF.31 In addition, the maximum ZT of 0.6 at 1173 K was obtained by doping 16% Ir in β-FeSi2. The improved ZT of Ir-doped β-FeSi2 is influenced by the significant reduction in electrical resistivity due to the high carrier density of 1.1 × 1022 cm−3 and reduction in thermal conductivity.32 More importantly, the electrical conductivity of β-FeSi2 was effectively improved by alloying it with Co or Ni, which caused an increase in nH, as reported by Tani et al.33 Since the nH could be significantly increased by Co substitution, they further attempted to investigate the thermoelectric properties of β-Fe1−xCoxSi2 fabricated by the spark plasma sintering (SPS) method. The maximum PF of around 1.1 × 10⁻⁵ W cm−1 K−2 was obtained in the x = 0.05 sample, and the maximum ZT was 0.25 at 940 K. Notably, κ was also slightly reduced probably due to electron–phonon interactions.34 In addition, they further aimed to enhance the TE properties by substituting Pt in the Fe site of β-Fe1−xPtxSi2. The solubility limit of Pt in the base material was about 2%, and the highest ZT of 0.14 at 847 K was obtained in the x = 0.03 sample mainly contributed by the enhancement in PF due to the reduction in ρ.35 The investigation of P addition in β-FeSi2 was reported by Ito et al. The ball milling and hot-pressed techniques were used to fabricate the samples. All P-doped samples showed n-type semiconductor characteristics, and the maximum ZT of around 0.033 was achieved in the 2% P-doped sample due to the improved PF.36 Redzuan et al. reported that the Fe28.49Co0.59Si70.5 sample prepared by the pressure-sintering method had the highest ZT of 0.085 at 1073 K.37 In addition, the influence of various impurities, such as Mn, Al, P, and Co, on β-FeSi2 prepared by mechanical milling followed by the pulse plasma sintering (PPS) technique was investigated by Dabrowski et al. It presented the highest ZT of around 0.15 with 3% Co addition probably because of the increase in carrier density, leading to a significant decrease in ρ and an increase in PF.38
In line with the previous studies, Co can be considered an appropriate impurity for the enhancement of TE properties of β-FeSi2 as it results in enhanced PF. In addition, we recently investigated the optimum Co doping amount for improving the TE properties of β-Fe1−xCoxSi2 fabricated by the arc-melting method. The maximum PF of 900 μW m−1 K−1 and ZT of 0.099 were obtained for β-Fe0.97Co0.03Si2. However, the tendency of ρ of this Co-doped sample was uniform over the temperature range of 300–800 K. This is probably due to the low mobility (μH) of around 3.5 cm2 V−1 s−1.39 Interestingly, it has been reported that the tendency of ρ of Ni-doped β-Fe1−xNixSi2 decreases with increasing temperature probably due to the higher μH in the range of 10–35 cm2 V−1 s−1.40 Since we have previously found that the maximum ZT was obtained in the β-Fe0.97Co0.03Si2 matrix prepared by arc-melting followed by a heat treatment process,39 we attempt to improve the performance of β-Fe0.97Co0.03Si2 prepared by the same fabrication process by alloying it with Ni in this work. When an appropriate amount of Ni is added to β-Fe0.97Co0.03Si2, the μH is expected to increase. As a result, the ρ can be further decreased and additional enhancement of the PF and ZT values can be obtained.
This work aims to improve the carrier mobility of the iron silicide-based material by co-doping of Co and Ni, which can enhance its thermoelectric performance. We also present the effects of Ni addition on the structural, electrical, and TE characteristics (electrical resistivity, Seebeck coefficient, power factor, thermal conductivity, and ZT values) of non-doped β-FeSi2 and β-Fe0.97−xNixCo0.03Si2 (x = 0, 0.005, 0.01, 0.02, and 0.03) fabricated by the arc-melting process. From 80–800 K, the TE properties of the fabricated materials are reported in detail. The Ni concentration has been optimized for improving the TE properties.
2. Experimental methods
2.1 Fabrication method
The compounds non-doped FeSi2 and Fe0.97−xNixCo0.03Si2 (x = 0.005, 0.01, 0.02, and 0.03) were prepared using raw elements, including iron (Fe, 99.9% up, grain), silicon (Si, 99.999%, grain), nickel (Ni, 99.9%, grain), and cobalt (Co, 99% up, powder), purchased from High Purity Chemicals in Japan. After weighing each of them according to the composition ratio, the arc-melting process was used to melt the raw materials in an Ar atmosphere under a pressure of 10−3 Pa. Before melting the key materials, 10 g of titanium was melted to react with the residual O2 in the melting chamber. To ensure homogeneous material distribution, the ingots were flipped, and the melting process was repeated three times. The ingots obtained from the arc-melting process were in the metallic phase (ε-FeSi + α-Fe2Si5). To transform these metallic phases into β-phase, heat treatment was necessarily applied. The numerical control wire-cutting machine (EC-3025, Makino) was used to slice the ingots into samples of appropriate size (7 mm × 7 mm × 1.5 mm) to characterize the thermoelectric properties. All surfaces of the sliced samples were then polished to remove contamination during the early cutting process. After that, each sample was vacuum-sealed inside a quartz ampule, and the carbon sheet was also set together with it to react with the residual oxygen. After vacuum-sealing, it was heat-treated in an electrical furnace at 1423 K for 3 hours to further homogenize the distribution of materials, followed by treatment at 1113 K for 20 hours to transform the metallic ε + α phases into the semiconducting β-phase. This heat treatment condition was optimized according to a previous report.41
2.2 Characterization method
The X-ray diffraction (XRD) measurements were performed using a high-resolution X-ray diffractometer with Cu Kα radiation (High-resolution SmartLab, Rigaku). The crystal parameters were computed by utilizing the Rietveld refinement method in the RIETAN-FP program. In the computation process, the occupation rate of Fe and Ni were set to 0.97 − x and x, respectively. The surface microstructure was visualized by using a 3D Real Surface View Microscope (VE-8800, KEYENCE). The elemental analysis was carried out by using a scanning electron microscope (SEM, SU8010, Hitachi High-Technologies) equipped with an energy-dispersive X-ray spectroscopy (EDS XFlash5060FQ, Bruker) detector. The gravity measurement tool (SMK-401, SHIMADZU) was used to measure relative density based on the Archimedes method. The mobility (μH) and carrier density (nH) at 300 K were measured by using the ResiTest8300 apparatus (TOYO Co.). Then, ResiTest8300 and a homebuilt apparatus were used to measure the electrical resistivity (ρ) and Seebeck coefficient (S) from 80–800 K. The power efficiency measurement apparatus (PEM-2, ULVAC) was used to characterize the thermal conductivity (κ).
3. Results and discussion
3.1 Crystal structure
The X-ray diffraction (XRD) patterns of non-doped FeSi2 measured at diffraction angles between 20° ≤ 2θ ≤ 90° are shown in Fig. 1. Before the heat treatment (after the arc-melting process), non-doped FeSi2 crystallized in the metallic α and ε phases (α-Fe2Si5 + ε-FeSi) due to the high melting temperature produced by the arc power. Fig. 2 shows the Rietveld analysis of all samples after heat treatment. The calculated, experimental, and differential data are denoted by the green, red, and blue lines, respectively. All samples crystallized in the semiconducting β-phase (β-FeSi2 and β-Fe0.97−xNixCo0.03Si2) with a trace of the ε-phase at the diffraction angle of 2θ ≈ 45.2°. This result suggests that the heat treatment process is necessary for phase transformation in the Fe–Si system. In addition, the ε-phase peak intensity of the x = 0.01, 0.02, 0.03 samples were higher than those of the x = 0 and 0.005 and pure β-FeSi2 samples, indicating that Ni substitution increases the formation of the ε-phase.
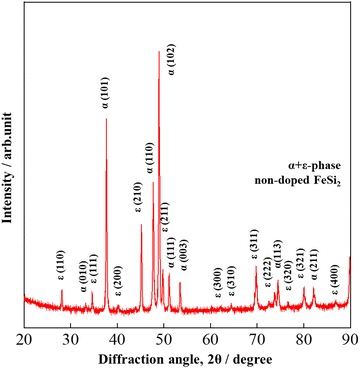 |
| | Fig. 1 The XRD patterns of non-doped FeSi2 before heat treatment at room temperature. The indexed peaks are those of ε + α-phases, indicating that metallic phases are formed after the arc-melting process. | |
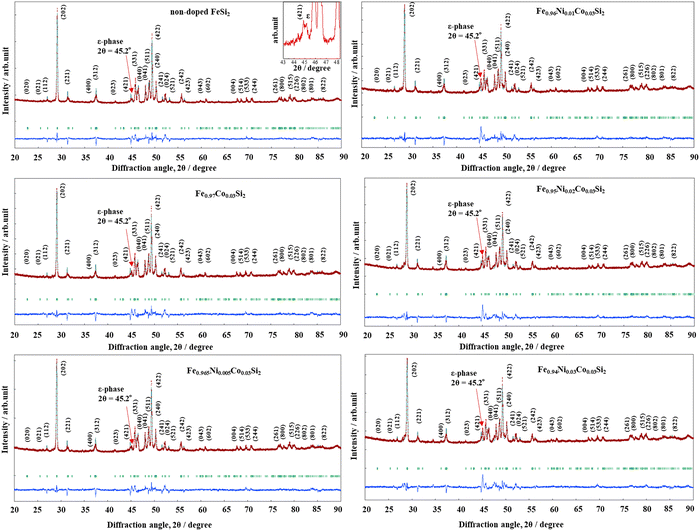 |
| | Fig. 2 Rietveld analysis of non-doped β-FeSi2 and β-Fe0.97−xNixCo0.03Si2 (0 ≤ x ≤ 0.03) after heat treatment; the indexed peaks are those of the β-phase, and the peak of ε-phase is magnified in the inset. The red lines represent experimental data, the green lines indicate calculated data, and the blue lines denote the difference between the datasets. The arrows indicate that the peak of ε-phase at 2θ = 45.2° increases with increasing x. | |
The three-dimensional crystal structure of the x = 0.01 sample is shown in Fig. 3. Geometrically, the bounds of the four Si1 and four Si2 atoms were attached in eight coordinates to every site of Fe1 and Fe2, and the Si–Fe distances ranged between 2.303(7)–2.419(6) Å and 2.333(3)–2.398(6) Å, respectively. In addition, the crystal structure parameters of all samples, as calculated by Rietveld analysis, are summarized in Table S1 (ESI†). The reliability factor Rwp (weighted diffraction patterns) ranged from 2.907 to 3.474, suggesting a good fit between the calculated and observed intensities. In addition, the variation in the interacting atomic Si–Fe distance and Fe–Si–Fe angles can be found in Fig. S1 (ESI†). In Fig. S1a (ESI†), with increasing x, the Si2–Fe1 and Si2–Fe2 distances are uniform, but the Si1–Fe1 distance slightly declines, and the Si1–Fe2 distance moderately rises. As shown in Fig. S1b (ESI†), with increasing x, the interaction atomic angle of Fe1–Si2–Fe1 and Fe2–Si2–Fe2 were uniform, but the Fe1–Si1–Fe1 slightly rose, and the Fe2–Si1–Fe2 moderately declined. This indicates that Fe1 and Fe2 are equally substituted by Ni.
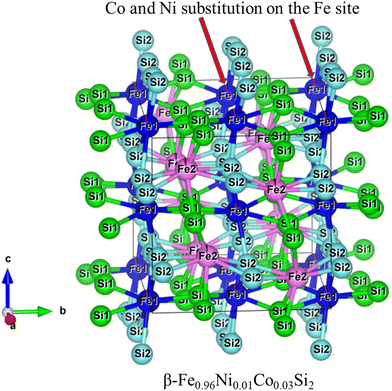 |
| | Fig. 3 The three-dimensional crystal structure of β-Fe0.97−xNixCo0.03Si2 (x = 0.01). | |
3.2 Microstructures analysis
Fig. 4 shows the surface morphology of all samples, demonstrating the variation in microstructures. As shown in Fig. 4(a), the ε-phase (bright grain) and α-phase (dark grain) were formed before the heat treatment, confirming the XRD patterns in Fig. 1. The residual dust produced by the polishing process appeared as white dots. Fig. 4(b) and (c) show that after the heat treatment, the bright grains disappeared, indicating that the non-doped FeSi2 and x = 0 samples grew homogeneously in the β-phase. However, Fig. 4(d)–(g) show that the addition of Ni caused the appearance of the ε-phase. In addition, the ε-phase grain tended to enlarge when x was increased from 0.005 to 0.03. These SEM images are consistent with that of Rietveld refinement results presented in Fig. 2, in which the peak intensity of the ε-phase increases with x. This tendency is similar to that observed in a previous report when Ni alone is added to the β-FeSi2 system.40 Moreover, the pore size became larger after the heat treatment process. An increase in pore size is usually observed when phase changes occur during the heat treatment process because the volume of β-FeSi2 differs from those of α-Fe2Si5 and ε-FeSi (3β-FeSi2 ← α-Fe2Si5 + ε-FeSi). In addition, as shown in Fig. 4(g), the pores in the x = 0.03 sample were more than those in the other samples, indicating that the number of pores increases with Ni content. However, the relative density of all samples was in the range of 97.2(1)–98.0(1)%, as shown in Table 1. These values of relative density are almost the same as those of the materials fabricated by the hot-pressing technique.42 However, the densities of materials fabricated by the spark plasma43,44 and pulse plasma sintering techniques38,45 are relatively lower than those of our materials. Therefore, it can be considered that samples with high density can be fabricated by the direct arc-melting method with a heat treatment process, which contributes positively to the enhancement of electrical conductivity and consequently improves the TE performance.
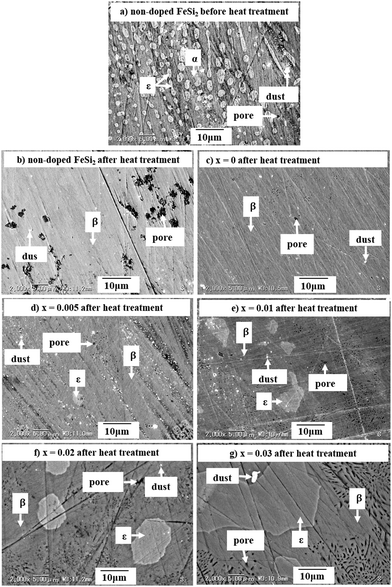 |
| | Fig. 4 The SEM micrographs of (a) non-doped β-FeSi2 before heat treatment, (b) non-doped β-FeSi2 after heat treatment, and (c)–(g) β-Fe0.97−xNixCo0.03Si2 after heat treatment. | |
Table 1 Lorenz number (L0), carrier density (nH), mobility (μH), relative density, electrical resistivity (ρ), Seebeck coefficient (S), and thermal conductivity (κ) of non-doped β-FeSi2 and β-Fe0.97−xNixCo0.03Si2 at room temperature
| Sample name |
x
|
L
0 [V2 K−2] |
n
H [cm−3] |
μ
H [cm2 V−1 s−1] |
ρ [Ω cm] |
S [μ V K−1] |
κ [W m−1 K−1] |
Relative density [%] |
| Non-doped FeSi2 |
|
1.792 × 10⁻⁸ |
2.3(5) × 1016 |
37(4) |
7.10 |
−127 |
7.16 |
98.0(1) |
| Fe0.97−xNixCo0.03Si2 |
0 |
1.644 × 10⁻⁸ |
1.2(4) × 1020 |
3.5(6) |
0.015 |
−213 |
6.33 |
97.9(1) |
| 0.005 |
1.651 × 10⁻⁸ |
1.3(3) × 1019 |
25(5) |
0.021 |
−200 |
5.67 |
97.8(1) |
| 0.01 |
1.753 × 10⁻⁸ |
1.4(3) × 1019 |
25(5) |
0.019 |
−139 |
5.11 |
97.6(1) |
| 0.02 |
1.837 × 10⁻⁸ |
2.0(3) × 1019 |
25(5) |
0.013 |
−116 |
4.75 |
97.4 (1) |
| 0.03 |
1.862 × 10⁻⁸ |
2.2(3) × 1019 |
24(3) |
0.012 |
−111 |
5.09 |
97.2(1) |
3.3 Elemental analysis
The elemental compositions of β-Fe0.97−xNixCo0.03Si2 (x = 0.005, 0.01, 0.02, and 0.03) analyzed by SEM-EDS measurements are summarized in Table 2. The result shows that the Fe![[thin space (1/6-em)]](https://www.rsc.org/images/entities/char_2009.gif) :
:![[thin space (1/6-em)]](https://www.rsc.org/images/entities/char_2009.gif) Si ratio in the ε area was around 1
Si ratio in the ε area was around 1![[thin space (1/6-em)]](https://www.rsc.org/images/entities/char_2009.gif) :
:![[thin space (1/6-em)]](https://www.rsc.org/images/entities/char_2009.gif) 1, representing ε-FeSi, and that in the β area was around 1
1, representing ε-FeSi, and that in the β area was around 1![[thin space (1/6-em)]](https://www.rsc.org/images/entities/char_2009.gif) :
:![[thin space (1/6-em)]](https://www.rsc.org/images/entities/char_2009.gif) 2, representing the β-FeSi2. In addition, the accumulation of Ni in the ε area significantly increased with x, indicating that Ni is preferentially distributed in the ε-phase. The EDS mapping image in Fig. 5 also shows that Ni accumulated more in the ε-phase than in the β-phase, as indicated by the green color. As a result, even at the nominal composition of x = 0.03, the actual x in the β grain is only 0.01(1). This tendency suggests that 1% could be the maximum solubility of Ni in the β-phase. In addition, Fig. S2 (ESI†) shows that not only Ni but Co also accumulated in the ε-phase, as evidenced by the cyan color. Based on this color mapping, the Co richness in the ε-phase of x = 0.005 (Fig. S2a, ESI†) seemed to be less than that of x = 0.03 (Fig. S2b, ESI†), meaning that the distribution of Co in the host β-FeSi2 becomes less homogenous when more Ni is added or more ε-phases are formed. In other words, when more ε-phases are formed, more Co accumulates in them. Therefore, the amount of Co distributed in β-FeSi2 decreases with increasing Ni.
2, representing the β-FeSi2. In addition, the accumulation of Ni in the ε area significantly increased with x, indicating that Ni is preferentially distributed in the ε-phase. The EDS mapping image in Fig. 5 also shows that Ni accumulated more in the ε-phase than in the β-phase, as indicated by the green color. As a result, even at the nominal composition of x = 0.03, the actual x in the β grain is only 0.01(1). This tendency suggests that 1% could be the maximum solubility of Ni in the β-phase. In addition, Fig. S2 (ESI†) shows that not only Ni but Co also accumulated in the ε-phase, as evidenced by the cyan color. Based on this color mapping, the Co richness in the ε-phase of x = 0.005 (Fig. S2a, ESI†) seemed to be less than that of x = 0.03 (Fig. S2b, ESI†), meaning that the distribution of Co in the host β-FeSi2 becomes less homogenous when more Ni is added or more ε-phases are formed. In other words, when more ε-phases are formed, more Co accumulates in them. Therefore, the amount of Co distributed in β-FeSi2 decreases with increasing Ni.
Table 2 The elemental composition of β-Fe0.97−xNixCo0.03Si2 (0.005 ≤ x ≤ 0.03)
|
x
|
Area |
Element |
Atomic% |
Composition ratio |
Chemical formula |
| 0.005 |
β
|
Fe |
37.0(3) |
1.11(1) |
β-Fe1.11(1)Ni0.001(1)Co0.037(1)Si1.85(1) |
| Ni |
0.04(4) |
0.001(1) |
| Co |
1.24(4) |
0.037(1) |
| Si |
61.7(2) |
1.85(1) |
|
ε
|
Fe |
55.7(5) |
1.11(1) |
ε-Fe1.11(1)Ni0.016(1)Co0.049(3)Si0.82(1) |
| Ni |
0.8(3) |
0.016(6) |
| Co |
2.4(1) |
0.049(3) |
| Si |
41.1(6) |
0.82(1) |
|
|
| 0.01 |
β
|
Fe |
39.5(3) |
1.18(1) |
β-Fe1.18(1)Ni0.005(1)Co0.037(2)Si1.77(1) |
| Ni |
0.18(4) |
0.005(1) |
| Co |
1.23(7) |
0.037(2) |
| Si |
59.1(2) |
1.77(1) |
|
ε
|
Fe |
54.5(7) |
1.09(1) |
ε-Fe1.09(1)Ni0.015(1)Co0.038(1)Si0.86(1) |
| Ni |
0.76(5) |
0.015(1) |
| Co |
1.92(5) |
0.038(1) |
| Si |
42.8(6) |
0.86(1) |
|
|
| 0.02 |
β
|
Fe |
39.0(3) |
1.17(1) |
β-Fe1.17(1)Ni0.006(4)Co0.034(3)Si1.79(1) |
| Ni |
0.2(1) |
0.006(4) |
| Co |
1.12(9) |
0.034(3) |
| Si |
59.7(3) |
1.79(1) |
|
ε
|
Fe |
53.4(7) |
1.07(1) |
ε-Fe1.07(1)Ni0.024(3)Co0.034(3)Si0.87(2) |
| Ni |
1.2(2) |
0.024(3) |
| Co |
1.7(1) |
0.034(3) |
| Si |
43.6(9) |
0.87(2) |
|
|
| 0.03 |
β
|
Fe |
39.4(9) |
1.18(3) |
β-Fe1.18(3)Ni0.01(1)Co0.038(2)Si1.77(2) |
| Ni |
0.4(4) |
0.01(1) |
| Co |
1.27(7) |
0.38(2) |
| Si |
59.1(8) |
1.77(2) |
|
ε
|
Fe |
50.6(8) |
1.01(2) |
ε-Fe1.01(2)Ni0.078(8)Co0.043(1)Si0.87(1) |
| Ni |
3.9(4) |
0.078(8) |
| Co |
2.1(1) |
0.043(1) |
| Si |
43.4(3) |
0.87(1) |
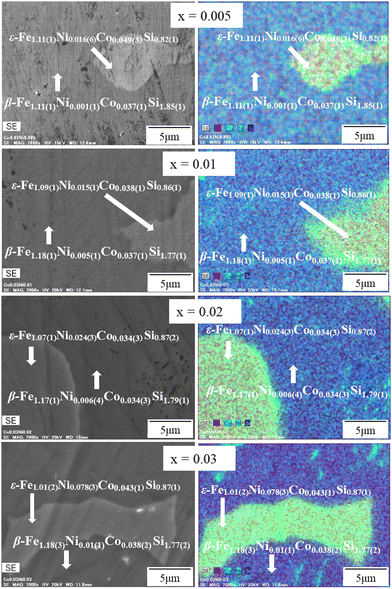 |
| | Fig. 5 The SEM-EDS color mapping of β-Fe0.97−xNixCo0.03Si2. Fe is mapped in red, Ni in green, Co in cyan, and Si in blue. | |
3.4 Electrical properties
Fig. 6 shows the tendency of carrier density (nH) and mobility (μH) of non-doped β-FeSi2 and β-Fe0.97−xNixCo0.03Si2. As shown in Fig. 6(a), the nH of the x = 0 sample was about 1020 cm−3, which is higher than that of non-doped β-FeSi2, indicating that Co acts as a donor. Importantly, the nH of the 0.005 ≤ x ≤ 0.03 samples were about one order smaller in magnitude than that of the x = 0 sample. It can be considered that Ni triggers the formation of small ε-phases and simultaneously decreases the solubility of Co in the base material, as confirmed by the area of Co richness observed in the EDS mapping analysis. In other words, the improvement in the nH of the iron silicide compounds is mainly dependent on the solid solution limits of the dopants. However, Fig. 6(b) shows that the μH of the 0.005 ≤ x ≤ 0.03 samples were 7 times higher than that of the x = 0 sample. This increase in μH is probably because of the lighter effective mass (m*) of Ni than that of Co.39,40 As seen in Table 1, from x = 0.005 to x = 0.03, the μH ranged from 25(5) to 24(3) cm2 V−1 s−1, respectively. These μH values are about 80 times higher than that of ruthenium (Ru)-alloyed Co-doped β-FeSi2 prepared by spark plasma sintering,25 50 times higher than that of Co- or Ni-doped β-FeSi2 prepared by pressure sintering,33 and 4 times higher than that of the Co-doped β-FeSi2 single crystal fabricated by the chemical vapor transport method.46 Therefore, when Ni is introduced to the Co-doped sample, the carrier mobility increases because of its lighter effective mass. The enhanced μH values obtained by co-doping of Co and Ni in β-FeSi2 in this work have a positive impact on the reduction in electrical resistivity and improvement of TE properties, as discussed in the next section.
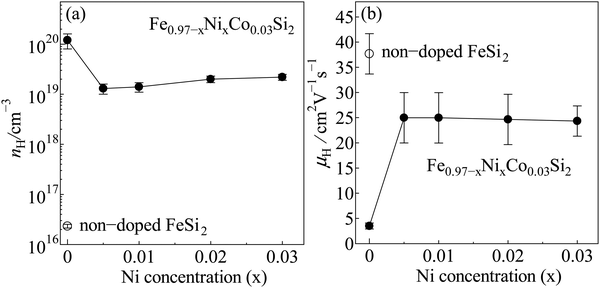 |
| | Fig. 6 (a) Carrier density (nH) and (b) mobility (μH) of non-doped β-FeSi2 and β-Fe0.97−xNixCo0.03Si2 at room temperature. | |
3.5 Thermoelectric properties
Fig. 7 shows the electrical resistivity (ρ) measured over temperatures in the 80–800 K range. Below 300 K, the ρ of the β-Fe0.97−xNixCo0.03Si2 samples were 3 orders smaller in magnitude than that of pristine β-FeSi2 due to the increase in nH, as shown in Table 1. Drude's formula explains the correlation between ρ and nH, as shown in eqn (2).| |  | (2) |
where e is the elementary charge, μH is the mobility, and nH is the carrier density.47 An inverse proportionality between ρ and nH is implied in eqn (2). Hence, the electrical resistivity of pristine β-FeSi2 is much higher than that of other samples. In addition, at high temperatures between 700–800 K, the ρ of the 0.005 ≤ x ≤ 0.03 samples were about one order smaller in magnitude than that of the x = 0 sample. The remarkable reduction in the ρ of the Ni-substituted samples at high temperatures is probably due to the increase in μH, as shown in Fig. 6(b). In addition, Fig. 7 shows that with x increasing from 0.005 to 0.03, the ρ moderately decreases because the nH slightly increases from 1.3(3) × 1019 cm−3 to 2.2(3) × 1019 cm−3, as seen in Table 1.
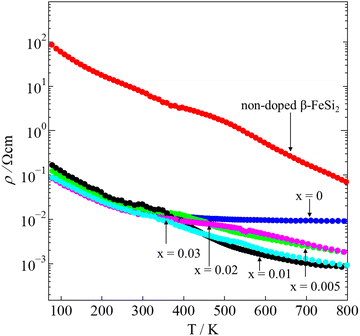 |
| | Fig. 7 The temperature dependence of the electrical resistivity (ρ) of non-doped β-FeSi2 and β-Fe0.97−xNixCo0.03Si2. | |
The Seebeck coefficients (S) measured over temperatures in the 80–800K ranges are shown in Fig. 8. For pristine β-FeSi2, the sign of S was positive at 80–195 K, indicating p-type semiconductor characteristic, and it turned negative in the 200–800 K window, indicating n-type semiconductor behavior. This variation is similar to that observed by Tani and Kido. They found that the Hall coefficient (RH) was positive at temperatures lower than 160 K but turned negative at temperatures higher than 160 K.33 This trend suggests that the conduction of non-doped β-FeSi2 is affected by both electrons and holes, while their ratio is dependent on the temperature. In addition, due to the intrinsic properties of low nH (∼1016 cm−3) and small bad gap (∼0.7 eV), the absolute |S| of pristine β-FeSi2 remarkably decreased to 0 μV K−1 at high temperatures due to the bipolar effect. On the other hand, the S of all samples in the β-Fe0.97−xNixCo0.03Si2 system had a negative sign over the measured temperature of 80–800 K, indicating that they behaved as n-type materials, in which the majority of charge carriers are electrons provided by the donors Co and Ni. In addition, at high temperatures, the absolute |S| of β-Fe0.97−xNixCo0.03Si2 was significantly higher and more uniform compared with that of pure β-FeSi2 because of the receded bipolar effect, due to which the nH remarkably increased from 1016 to 1019–1020 cm−3. On the other hand, the |S| decreased with x because of the increased ε-phase, as confirmed by the SEM micrographs and Rietveld analysis in the above sections. Furthermore, Fig. S3 (ESI†) shows the tendency of |S| versus nH of the 0.005 ≤ x ≤ 0.03 samples at 300 K. The solid lines represent the values of |S| by calculated using Mott's theory with several effective masses (m*). The relationship of m* and |S| is defined by:
| |  | (3) |
where |
S| is the absolute Seebeck coefficient,
kB is the Boltzmann constant,
T is the temperature,
m* is the effective mass,
ℏ is the Planck constant,
e is the elementary charge, and
nH is the carrier concentration.
48 An inverse proportionality between |
S| and
nH is implied in
eqn (3), and Fig. S3 (ESI
†) shows that a good fitting was obtained for
m* = 0.9
me. Therefore, for the 0.005 ≤
x ≤ 0.03 samples, the decline in |
S| is caused by not only the increase in ε-phase but also the slight increase in
nH from 1.3(3) × 10
19–2.2(3) × 10
19cm
−3.
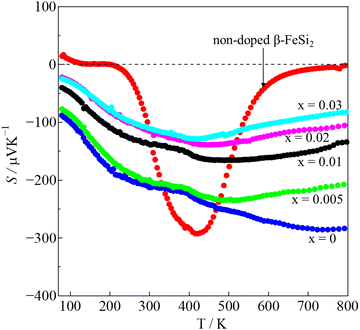 |
| | Fig. 8 The variation of the Seebeck coefficient (S) of non-doped β-FeSi2 and β-Fe0.97−xNixCo0.03Si2. | |
The temperature dependence of the power factor (PF = S2/ρ) is shown in Fig. S4 (ESI†). The maximum PF of pure β-FeSi2 was only around 3.4 μW m−1 K−2 at 450 K, and then it significantly improved up to 900 μW m−1 K−2 at 800 K in the x = 0 sample (3% Co doping). More importantly, with Ni addition x = 0.01, the PF was further enhanced up to 2400 μW m−1 K−2 at 720 K. This improved PF is mainly influenced by the decrease in ρ. However, when we increased x up to 0.02 and 0.03, the PF decreased due to the reduction in |S|, as shown in Fig. 8. Hence, x = 0.01 is the optimum Ni substitution amount for enhancing the PF value.
The total thermal conductivity (κ) values of the samples at room temperature are summarized in Table 1, and the values moderately decrease with x. The temperature dependence of the κ of all samples is plotted in Fig. 9, which shows that the minimum values of κ were obtained for the 0.01 ≤ x ≤ 0.03 samples. In addition, the Wiedemann–Franz law was used to calculate the electronic thermal conductivity (κe = L0ρ−1T, where κe is the electronic thermal conductivity, L0 is the Lorenz number, ρ is the electrical resistivity, and T is the temperature). The scattering factor r of −1/2 (acoustic phonon scattering) and the experimental values of the Seebeck coefficients were used for calculating the L0. The correlation between r and L0 was defined as:
| |  | (4) |
where the function is given by:

,

,

.
EF represents the Fermi energy.
49 Then,
L0 was calculated by using
eqn (4). As seen in
Table 1, with
x increasing from 0.005 to 0.03, the
L0 slightly increased. This trend indicates that the phase transition from semiconductor (β-FeSi
2) to metal (ε-FeSi) occurs because of Ni substitution. Consequently, the inset of
Fig. 9 shows that the
κe also increases with
x. The increased
κe should cause a negative impact on the total thermal conductivity (
κ =
κe+ κl). It can be considered that the slight reduction in total thermal conductivity with Ni substitution, as shown in
Fig. 9, is mainly caused by the reduction in lattice thermal conductivity (
κl). This is possibly because of the electron–phonon interaction when dopants are introduced to the host material. A previous study shows a similar tendency of reduced
κ when Co is introduced to β-FeSi
2.
34 In addition, the increasing number of pores or enlargement of pore size, as shown by the SEM images, can also be the reason behind the reduction in
κ. The slight reduction in thermal conductivity observed in this study is mainly influenced by pore defects.
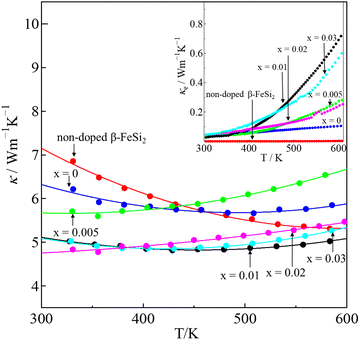 |
| | Fig. 9 The temperature dependence of the total thermal conductivity (κ) of non-doped β-FeSi2 and β-Fe0.97−xNixCo0.03Si2; the electronic thermal conductivity (κe) is plotted in the inset. | |
Fig. 10 shows the dimensionless figures of merit (ZT) calculated by using eqn (1). The ZT value is used to define the performance of any TE materials. As shown in the inset of Fig. 10, the maximum ZT of binary β-FeSi2 was only 2.6 × 10⁻⁴ at 450 K. On the other hand, the ZT values of all β-Fe0.97−xNixCo0.03Si2 samples were much higher than that of non-doped β-FeSi2. For the x = 0 sample, the highest ZT value was around 0.099 at 800 K. However, upon increasing to x = 0.01, the highest ZT enhanced up to 0.31 at 720 K due to the decrease in electrical resistivity and thermal conductivity. Then, the ZT decreased when x = 0.02 and 0.03 due to the reduction in the Seebeck coefficients; therefore, x = 0.01 is the optimum Ni content in β-Fe0.97−xNixCo0.03Si2. The maximum ZT obtained in this work is lower than that of β-FeSi2 with 16% Ir doping (ZT = 0.6) because Ir-doped β-FeSi2 had lower electrical resistivity owing to the high carrier density.32 However, the highest ZT value observed in this study (ZTmax = 0.31) is remarkably higher than those of the previously reported β-Fe0.93Co0.07Si2 sample (ZTmax = 0.18) fabricated by the magnesiothermic process,23 β-Fe0.97Co0.03Si2 sample (ZTmax = 0.15) prepared by the pulse plasma sintering (PPS) method,38 β-Fe0.98Co0.02Si2 (ZTmax = 0.15) prepared by spark plasma sintering (SPS),42 β-Fe0.95Co0.05Si2 sample (ZTmax = 0.14) prepared by the SPS method,44 β-Fe0.95Co0.05Si1.958 Ge0.042 (ZTmax = 0.11) prepared by the pressure sintering method,50 and β-FeSi2 with some dopants (Zr, Nb, and Ti).51
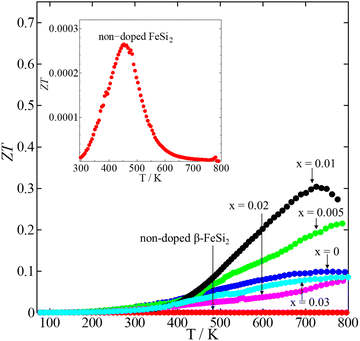 |
| | Fig. 10 The temperature dependence of the dimensionless figure of merit (ZT) of non-doped β-FeSi2 and β-Fe0.97−xNixCo0.03Si2. The curve of non-doped β-FeSi2 is magnified in the inset. | |
4. Conclusions
In summary, non-doped β-FeSi2 and β-Fe0.97−xNixCo0.03Si2 (x = 0.005, 0.01, 0.02, and 0.03) were fabricated by the arc-melting method. It was observed that heat treatment is necessary to transform the metallic phase into the semiconducting phase. With increasing x, the results show that more metallic ε-phases were formed, and the distribution of Co in the materials became less homogeneous, resulting in a decrease in carrier density. However, the mobility significantly improved from 3.5(6) to 25(5) cm2 V−1 s−1 with Ni substitution; therefore, the electrical resistivity effectively decreased by one order of magnitude at high temperatures. The Seebeck coefficient decreased with x due to the formation of the ε-phase. The slight reduction in thermal conductivity observed after Ni addition is probably owing to the enlargement of the pores. As a result, the highest ZT of 0.31 was achieved in the x = 0.01 sample at 720 K because of the reduced electrical resistivity and a slight reduction in thermal conductivity. The maximum ZT obtained in this study is remarkably higher than those reported previously for Co-doped β-FeSi2,23,34,38,42,44 β-FeSi2 co-doped with Co and Ge,50 and β-FeSi2 doped with other elements (Zr, Nb, and Ti).51 Therefore, the abundant and eco-friendly β-Fe0.97−xNixCo0.03Si2 compound can be a promising thermoelectric material for harvesting industrial waste heat.
Author contributions
The concept of the study is proposed by H. Nakatsugawa, S. Sam, and Y. Okamoto. The investigation was done by S. Sam and H. Nakatsugawa. The data interpretation and analysis are conducted by S. Sam, H. Nakatsugawa, and Y. Okamoto. The original draft was prepared and written by S. Sam and H. Nakatsugawa. All authors have reviewed and approved the submission of the manuscript.
Conflicts of interest
The authors declare that there is no competing financial interest.
Acknowledgements
The XRD and SEM-EDS measurements were performed at Yokohama National University Instrumental Analysis and Evaluation Center. The PEM-2 measurement was performed at National Defense Academy. We acknowledge Mr Umar Farooq and Mr Soma Odagawa for their cooperation to prepare samples for this work.
References
- R. Fitriani, B. D. Ovik, M. C. Long, M. Barma, M. F. M. Riaz, S. M. Sabri and R. Said, Renewable Sustainable Energy Rev., 2016, 64, 635–659 CrossRef CAS.
- M. Hamid Elsheikh, D. A. Shnawah, M. F. M. Sabri, S. B. M. Said, M. Haji Hassan, M. B. Ali Bashir and M. Mohamad, Renewable Sustainable Energy Rev., 2014, 30, 337–355 CrossRef.
- R. Sok and J. Kusaka, Appl. Therm. Eng., 2023, 219, 119530 CrossRef.
- R. Sok and J. Kusaka, Int. J. Heat Mass Transfer, 2023, 202, 123718 CrossRef.
- J. Yang and F. R. Stabler, J. Electron. Mater., 2009, 38, 1245–1251 CrossRef CAS.
-
H. J. Goldsmid, in Introduction to Thermoelectricity, ed. H. Robert, J. Chennupati, K. Yoshiyuki, M. O. Richard, P. Jürgen, S. Tae-Yeon, U. Shin-ichi and M. W. Zhiming, Springer Berlin Heidelberg, Berlin, Heidelberg, 2nd edn, 2016, pp. 9–24 Search PubMed.
- H. Fukutomi, Y. Konno, K. Okayasu, M. Hasegawa and H. Nakatsugawa, Mater. Sci. Eng., A, 2009, 527, 61–64 CrossRef.
- H. Nakatsugawa, M. Kubota and M. Saito, J. Jpn. Inst. Met., 2015, 79, 597–606 CrossRef CAS.
- H. Nakatsugawa, M. Saito and Y. Okamoto, J. Electron. Mater., 2017, 46, 3262–3272 CrossRef CAS.
- H. Nakatsugawa, M. Saito and Y. Okamoto, Mater. Trans., 2019, 60, 1051–1060 CrossRef CAS.
- X. Chen, H. Zhang, Y. Zhao, W.-D. Liu, W. Dai, T. Wu, X. Lu, C. Wu, W. Luo, Y. Fan, L. Wang, W. Jiang, Z.-G. Chen and J. Yang, ACS Appl. Mater. Interfaces, 2019, 11, 22457–22463 CrossRef CAS PubMed.
- X.-Q. Chen, S.-J. Fan, C. Han, T. Wu, L.-J. Wang, W. Jiang, W. Dai and J.-P. Yang, Rare Met., 2021, 40, 2017–2025 CrossRef CAS PubMed.
- S. Katsuyama, H. Matsushima and M. Ito, J. Alloys Compd., 2004, 385, 232–237 CrossRef CAS.
- H. Nakatsugawa, T. Ozaki, H. Kishimura and Y. Okamoto, J. Electron. Mater., 2020, 49, 2802–2812 CrossRef CAS.
- T. Sakata, Y. Sakai, H. Yoshino, H. Fujii and I. Nishida, J. Less-Common Met., 1978, 61, 301–308 CrossRef CAS.
- L. Pauling and A. M. Soldate, Acta Crystallogr., 1948, 1, 212–216 CrossRef CAS.
- Y. Dusausoy, J. Protas, R. Wandji and B. Roques, Acta Crystallogr., Sect. B: Struct. Crystallogr. Cryst. Chem., 1971, 27, 1209–1218 CrossRef CAS.
- O. Caballero-Calero, J. R. Ares and M. Martín-González, Adv. Sustainable Syst., 2021, 5, 2100095 CrossRef CAS.
- U. Stöhrer, R. Voggesberger, G. Wagner and U. Birkholz, Energy Convers. Manage., 1990, 30, 143–147 CrossRef.
-
Y. Isoda and H. Udono, in Thermoelectrics and its Energy Harvesting, ed. D. M. Rowe, CRC Press, 1st edn, 2012, pp. 18-1–18-25 Search PubMed.
- R. Girlanda, E. Piparo and A. Balzarotti, J. Appl. Phys., 1994, 76, 2837–2840 CrossRef CAS.
- S. J. Clark, H. M. Al-Allak, S. Brand and R. A. Abram, Phys. Rev.
B: Condens. Matter Mater. Phys., 1998, 58, 10389–10393 CrossRef CAS.
- S. Le Tonquesse, Z. Verastegui, H. Huynh, V. Dorcet, Q. Guo, V. Demange, C. Prestipino, D. Berthebaud, T. Mori and M. Pasturel, ACS Appl. Energy Mater., 2019, 2, 8525–8534 CrossRef CAS.
- N. Liu, S. E. Rezaei, W. A. Jensen, S. Song, Z. Ren, K. Esfarjani, M. Zebarjadi and J. A. Floro, Adv. Funct. Mater., 2019, 29, 1903157 CrossRef.
- X. Du, P. Hu, T. Mao, Q. Song, P. Qiu, X. Shi and L. Chen, ACS Appl. Mater. Interfaces, 2019, 11, 32151–32158 CrossRef CAS PubMed.
- H. Y. Chen, X. B. Zhao, C. Stiewe, D. Platzek and E. Mueller, J. Alloys Compd., 2007, 433, 338–344 CrossRef CAS.
- A. Binti Abdullah Zaik, F. Liana Binti Mohd. Redzuan, S. Ahmad Zaki Bin Shaikh Salim, A. Faiz Bin Mohammad, M. Fitri Bin Mohd. Yakub and M. Takeda, Mater. Today: Proc., 2022, 65, 2979–2985 CAS.
- W. Liu, X. Yan, G. Chen and Z. Ren, Nano Energy, 2012, 1, 42–56 CrossRef CAS.
- J. J. Gong, A. J. Hong, J. Shuai, L. Li, Z. B. Yan, Z. F. Ren and J.-M. Liu, Phys. Chem. Chem. Phys., 2016, 18, 16566–16574 RSC.
- Z. Chen, X. Zhang, J. Ren, Z. Zeng, Y. Chen, J. He, L. Chen and Y. Pei, Nat. Commun., 2021, 12, 3837 CrossRef CAS PubMed.
- X. B. Zhao, H. Y. Chen, E. Müller and C. Drasar, Appl. Phys. A: Mater. Sci. Process., 2005, 80, 1123–1127 CrossRef CAS.
- P. Qiu, J. Cheng, J. Chai, X. Du, X. Xia, C. Ming, C. Zhu, J. Yang, Y. Sun, F. Xu, X. Shi and L. Chen, Adv. Energy Mater., 2022, 12, 2200247 CrossRef CAS.
- J. Tani and H. Kido, J. Appl. Phys., 1998, 84, 1408–1411 CrossRef CAS.
- J. Tani and H. Kido, Jpn. J. Appl. Phys., 2001, 40, 3236 CrossRef CAS.
- J. Tani and H. Kido, J. Appl. Phys., 2000, 88, 5810–5813 CrossRef CAS.
- M. Ito, H. Nagai, E. Oda, S. Katsuyama and K. Majima, J. Appl. Phys., 2002, 91, 2138–2142 CrossRef CAS.
- F. L. B. M. Redzuan, I. Mikio and T. Masatoshi, J. Mater. Sci., 2018, 53, 7683–7690 CrossRef.
- F. Dąbrowski, Ł. Ciupiński, J. Zdunek, J. Kruszewski, R. Zybała, A. Michalski and K. Jan Kurzydłowski, Mater. Today: Proc., 2019, 8, 531–539 Search PubMed.
- S. Sam, H. Nakatsugawa and Y. Okamoto, Jpn. J. Appl. Phys., 2022, 61, 111002 CrossRef.
- S. Sam, S. Odagawa, H. Nakatsugawa and Y. Okamoto, Materials, 2023, 16, 927 CrossRef CAS PubMed.
- M. Ohtaki, D. Ogura, K. Eguchi and H. Arai, Chem. Lett., 1993, 1067–1070 CrossRef CAS.
- X. Qu, S. Lü, J. Hu and Q. Meng, J. Alloys Compd., 2011, 509, 10217–10221 CrossRef CAS.
- K. Nogi and T. Kita, J. Mater. Sci., 2000, 35, 5845–5849 CrossRef CAS.
- L. Abbassi, D. Mesguich, D. Berthebaud, S. Le Tonquesse, B. Srinivasan, T. Mori, L. Coulomb, G. Chevallier, C. Estournès, E. Flahaut, R. Viennois and M. Beaudhuin, Nanomaterials, 2021, 11, 2852 CrossRef CAS PubMed.
- F. Dąbrowski, Ł. Ciupiński, J. Zdunek, W. Chromiński, M. Kruszewski, R. Zybała, A. Michalski and K. J. Kurzydłowski, Arch. Metall. Mater., 2021, 66, 1157–1162 Search PubMed.
- S. Brehme, G. Behr and A. Heinrich, J. Appl. Phys., 2001, 89, 3798–3803 CrossRef CAS.
-
T. Takeuchi, in Thermoelectrics and its Energy Harvesting, ed. D. M. Rowe, Taylor & Francis Group, Abingdon, UK, 1st edn, 2017, pp. 7-1–7-27 Search PubMed.
- N. F. Mott, J. Non-Cryst. Solids, 1968, 1, 1–17 CrossRef CAS.
- L.-D. Zhao, S.-H. Lo, J. He, H. Li, K. Biswas, J. Androulakis, C.-I. Wu, T. P. Hogan, D.-Y. Chung, V. P. Dravid and M. G. Kanatzidis, J. Am. Chem. Soc., 2011, 133, 20476–20487 CrossRef CAS PubMed.
- S. W. Kim, M. K. Cho, Y. Mishima and D. C. Choi, Intermetallics, 2003, 11, 399–405 CrossRef CAS.
- M. Ito, H. Nagai, S. Katsuyama and K. Majima, J. Alloys Compd., 2001, 315, 251–258 CrossRef CAS.
|
| This journal is © The Royal Society of Chemistry 2023 |
Click here to see how this site uses Cookies. View our privacy policy here.  Open Access Article
 a,
Hiroshi
Nakatsugawa
 *a and
Yoichi
Okamoto
b

![[thin space (1/6-em)]](https://www.rsc.org/images/entities/char_2009.gif) :
:![[thin space (1/6-em)]](https://www.rsc.org/images/entities/char_2009.gif) Si ratio in the ε area was around 1
Si ratio in the ε area was around 1![[thin space (1/6-em)]](https://www.rsc.org/images/entities/char_2009.gif) :
:![[thin space (1/6-em)]](https://www.rsc.org/images/entities/char_2009.gif) 1, representing ε-FeSi, and that in the β area was around 1
1, representing ε-FeSi, and that in the β area was around 1![[thin space (1/6-em)]](https://www.rsc.org/images/entities/char_2009.gif) :
:![[thin space (1/6-em)]](https://www.rsc.org/images/entities/char_2009.gif) 2, representing the β-FeSi2. In addition, the accumulation of Ni in the ε area significantly increased with x, indicating that Ni is preferentially distributed in the ε-phase. The EDS mapping image in Fig. 5 also shows that Ni accumulated more in the ε-phase than in the β-phase, as indicated by the green color. As a result, even at the nominal composition of x = 0.03, the actual x in the β grain is only 0.01(1). This tendency suggests that 1% could be the maximum solubility of Ni in the β-phase. In addition, Fig. S2 (ESI†) shows that not only Ni but Co also accumulated in the ε-phase, as evidenced by the cyan color. Based on this color mapping, the Co richness in the ε-phase of x = 0.005 (Fig. S2a, ESI†) seemed to be less than that of x = 0.03 (Fig. S2b, ESI†), meaning that the distribution of Co in the host β-FeSi2 becomes less homogenous when more Ni is added or more ε-phases are formed. In other words, when more ε-phases are formed, more Co accumulates in them. Therefore, the amount of Co distributed in β-FeSi2 decreases with increasing Ni.
2, representing the β-FeSi2. In addition, the accumulation of Ni in the ε area significantly increased with x, indicating that Ni is preferentially distributed in the ε-phase. The EDS mapping image in Fig. 5 also shows that Ni accumulated more in the ε-phase than in the β-phase, as indicated by the green color. As a result, even at the nominal composition of x = 0.03, the actual x in the β grain is only 0.01(1). This tendency suggests that 1% could be the maximum solubility of Ni in the β-phase. In addition, Fig. S2 (ESI†) shows that not only Ni but Co also accumulated in the ε-phase, as evidenced by the cyan color. Based on this color mapping, the Co richness in the ε-phase of x = 0.005 (Fig. S2a, ESI†) seemed to be less than that of x = 0.03 (Fig. S2b, ESI†), meaning that the distribution of Co in the host β-FeSi2 becomes less homogenous when more Ni is added or more ε-phases are formed. In other words, when more ε-phases are formed, more Co accumulates in them. Therefore, the amount of Co distributed in β-FeSi2 decreases with increasing Ni.


 ,
,  ,
,  . EF represents the Fermi energy.49 Then, L0 was calculated by using eqn (4). As seen in Table 1, with x increasing from 0.005 to 0.03, the L0 slightly increased. This trend indicates that the phase transition from semiconductor (β-FeSi2) to metal (ε-FeSi) occurs because of Ni substitution. Consequently, the inset of Fig. 9 shows that the κe also increases with x. The increased κe should cause a negative impact on the total thermal conductivity (κ = κe+ κl). It can be considered that the slight reduction in total thermal conductivity with Ni substitution, as shown in Fig. 9, is mainly caused by the reduction in lattice thermal conductivity (κl). This is possibly because of the electron–phonon interaction when dopants are introduced to the host material. A previous study shows a similar tendency of reduced κ when Co is introduced to β-FeSi2.34 In addition, the increasing number of pores or enlargement of pore size, as shown by the SEM images, can also be the reason behind the reduction in κ. The slight reduction in thermal conductivity observed in this study is mainly influenced by pore defects.


