 Open Access Article
A tumor microenvironment-responsive microneedle patch for chemodynamic therapy of oral squamous cell carcinoma†
Siyu
Zhao‡
,
Yue
Li‡
and
Bo
Cheng
 *
*
Department of Stomatology, Zhongnan Hospital of Wuhan University, No. 169, Donghu Road, Wuchang District, Wuhan, 430071, China. E-mail: chengbo@znhospital.cn
First published on 20th September 2023
Abstract
Oral squamous cell carcinoma (OSCC) is one of the most common malignant tumors of the head and neck, and this disease has become a threat to public health due to its poor prognosis and high fatality rate. Chemodynamic therapy (CDT) is an emerging oncology treatment based on the Fenton reaction. However, the lack of endogenous hydrogen peroxide (H2O2) in tumor cells and the high concentration of glutathione (GSH) that depletes toxic hydroxyl radicals (·OH) significantly impair the efficacy of CDT. Here, we developed a polyvinyl alcohol (PVA)-based soluble microneedle patch (denoted as Fe3O4 + VC-MN) loaded with Fe3O4 nanoparticles (NPs) and vitamin C (VC) for the effective treatment of OSCC. When Fe3O4 + VC-MNs are inserted into the OSCC tissue, the Fe3O4 NPs and VC loaded in the tip of the needle are released in a targeted manner. After VC is converted into oxidized vitamin C (DHA), it can consume GSH in tumor cells and generate sufficient intracellular H2O2in situ. Moreover, by virtue of their peroxidase-like activity, Fe3O4 NPs can induce the generation of lethal ·OH through the Fenton reaction with the aforementioned H2O2, leading to tumor cell ferroptosis and apoptosis, thus achieving CDT. Collectively, this functional microneedle patch provides a more efficient and minimally invasive targeted drug delivery solution for the treatment of OSCC.
1 Introduction
Oral cancer is one of the most common malignant tumors occurring in head and neck, among which more than 90% these cases is oral squamous cell carcinoma (OSCC).1 Statistically, there are over 350![[thin space (1/6-em)]](https://www.rsc.org/images/entities/char_2009.gif) 000 new cases of OSCC each year and over 150
000 new cases of OSCC each year and over 150![[thin space (1/6-em)]](https://www.rsc.org/images/entities/char_2009.gif) 000 deaths;2 thus, this disease poses a serious threat to human health. At present, the main non-surgical therapeutic modalities of OSCC primarily focus on radiotherapy and systemic chemotherapy, and the enrichment of drugs is difficult to achieve in local tumor lesions.
000 deaths;2 thus, this disease poses a serious threat to human health. At present, the main non-surgical therapeutic modalities of OSCC primarily focus on radiotherapy and systemic chemotherapy, and the enrichment of drugs is difficult to achieve in local tumor lesions.
Microneedle-based drug delivery systems have been proven to possess excellent drug loading and release capabilities to overcome the skin/mucosal barrier for transdermal therapy.3–5 With its advantages of a minimally invasive procedure and painlessness, it has been used to treat a variety of diseases, including melanoma6 and breast cancer,7 and in the therapy for other tumors.8–10 Unlike other deep tumors, OSCC often occurs in superficial sites such as the tongue and buccal mucosa, which are within the penetration capability of microneedles.11,12
Chemodynamic therapy (CDT) is a new developing treatment that uses the endogenously overexpressed hydrogen peroxide (H2O2) in tumors to kill cancer cells by producing toxic hydroxyl radicals (˙OH) through a metal-catalysed Fenton reaction.13,14 Nanozymes, such as Fe3O4 nanoparticles (NPs), possess peroxidase-like activity and can catalyse the production of ˙OH from H2O2, a mechanism that has been applied for tumor therapy.15–17 However, insufficient H2O2 in the local tumor microenvironment (TME) and the depletion of ·OH by the glutathione (GSH) that is present in high concentrations severely limit the efficacy of CDT.
Currently, the direct delivery of H2O2 or peroxide materials is a common strategy to compensate for H2O2 deficiency in the tumors. For example, Park W. H. et al. used exogenous H2O2 to inhibit the growth of lung cancer cells through blocking the G1 phase.18 Lin L. S. et al. proposed using copper peroxide nanodots as stimulative agents for enhanced CDT by sustaining the H2O2 supply.19 Although these methods have increased the concentration of H2O2 in tumors to some extent, they do not continuously supply H2O2. Recent studies have shown that vitamin C (VC), also known as ascorbic acid, is oxidized vitamin C (DHA) in the intercellular matrix. Afterwards, these compounds can selectively enter tumor cells through glucose transporters (GLUTs) on the cell membrane, consuming high concentration of intracellular GSH and producing large amounts of H2O2.20,21 Based on these properties, integrating VC-mediated GSH depletion and H2O2 production and the Fe3O4-catalyzed Fenton reaction can significantly improve the effectiveness of CDT.
Therefore, in this study, we constructed a PVA-based microneedle patch loaded with VC and Fe3O4 NPs (Fe3O4 + VC-MNs) for OSCC treatment. Puncture of the OSCC tissue with Fe3O4 + VC-MNs allowed for targeted release of the drugs loaded in the tip of the needle, after which VC was converted to DHA to react with reduced GSH and produce large amounts of H2O2 in tumor cells. Then, the Fe3O4 NP-induced Fenton reaction generated lethal ˙OH, leading to tumor cell ferroptosis and apoptosis, thus providing a more efficient and minimally invasive targeted drug delivery solution for the treatment of OSCC (Fig. 1).
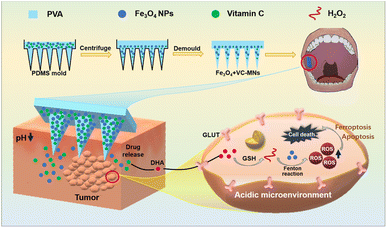 | ||
| Fig. 1 Schematic illustration of the synthesis of Fe3O4 + VC-MNs and its transmucosal drug delivery in OSCC. | ||
2 Materials and methods
2.1 Materials
Polyvinyl alcohol (PVA) and Fe3O4 nanoparticles were purchased from Shanghai Aladdin Bio-Chem Technology Co., Ltd (Shanghai, China). Ascorbic acid (VC) and fluorescein isothiocyanate (FITC) were purchased from Sigma (USA). Agar was purchased from Biosharp (Anhui, China). The cell counting kit-8 (CCK-8) and cell death assay kit were purchased from Beyotime (Shanghai, China). DMEM and fetal bovine serum (FBS) were purchased from Gibco (USA). An apoptosis assay kit was purchased from Bestbio (Shanghai, China). MDA assay kits and GSH assay kits were purchased from Elabscience Biotechnology Co., Ltd (Wuhan, China).2.2 Preparation of microneedle patches
7.5 g of PVA powder was added to 60 mL of pure water, and stirred at 95 °C until the powder was completely dissolved. Then, the mixture was centrifuged at 3000 rpm to remove the bubbles (PVA solution). 10 mg Fe3O4 and 10 mg VC were added to 100 mL PVA solution. 10% (w/v) Fe3O4 and 10% (w/v) VC were collected to PVA solution. After this, the three above-mentioned solutions were added dropwise to the polydimethylsiloxane (PDMS) microneedle mold, respectively, followed by centrifugation (3500 rpm) and drying at 37 °C overnight to obtained PVA-MN, Fe3O4-MN and Fe3O4 + VC-MN.2.3 Characterization
The surface morphology was characterized by scanning electron microscopy (SEM) (SIGMA HD). The optical images were captured using a portable electron microscope. To verify the successful loading of Fe3O4 and VC, Fe3O4 + VC-MN was analyzed using energy dispersive spectroscopy (EDS) (OXFORD X-MAS) and Fourier transform infrared (FTIR) (Nicolet5700, USA) spectroscopy. Additionally, the mechanical properties of microneedles were evaluated using a microcomputer-controlled electronic universal testing machine (CMT4503, China).2.4 Solubility of the microneedle patches
3.7 g of agar powder was placed in 150 mL of pure water, and the mixture was heated to 90–100 °C with stirring to dissolve the powder. After the solution is solidified, it was cut into cubes with a thickness of 2 cm to simulate skin tissue. The dissolution of Fe3O4 + VC-MNs at different time points was analyzed after being inserted into agar blocks and nude mouse skin tissue. In order to detect the drug release capacity of Fe3O4 + VC-MNs after dissolution, FITC-containing microneedles were placed in PBS solution and artificial saliva (SBF). The variation in fluorescence intensity of the immersion solution was assessed by using a microplate reader (VICTOR Nivo, Finland).2.5 Cytocompatibility of the microneedle patches
L929 cells, HUVECs and HN30 cells were cultured in DMEM with 10% FBS at 37 °C under 5% CO2 in a saturated humidity atmosphere. All the cells were inoculated in 96-well plates (2000 cells per well) and divided into the PVA-MN group, Fe3O4-MN group, and Fe3O4 + VC-MN group after 24 hours of cultivation with different impregnating solutions. Then, the original medium was replaced by 100 μL of CCK-8 working solution (10% by volume), and the samples were incubated for two hours before measuring the optical density (OD) values of each well at 450 nm. Cell viability was calculated using the following equation:| Cell viability = (ODcontrol group − ODexperimental group)/ODcontrol group × 100% |
Next, we conducted live/dead cell staining assays. Specifically, L929 cells, HUVECs, and HN30 cells were inoculated into 24-well plates at a density of 2 × 10⁴ cells per well and cultured for 24 hours. Each well was stained with Calcein-AM and propidium iodide (PI) and observed by using a fluorescence microscope (Sunny ICX41 inverted biological microscope, HK).
2.6 Cell migration assay
L929 cells, HUVECs and HN30 cells were inoculated in 6-well plates at a density of 5 × 10⁵ cells per well for 24 hours. After scratching, the culture medium of each well was replaced by different impregnating solutions. Cell migration was observed by using an inverted fluorescence microscope.2.7 Hemolysis experiment
Fresh blood from nude mice was washed and centrifuged to obtain red blood cells (RBCs). The RBCs were diluted to 10% solution by using PBS and incubated with pure water (positive control), PBS (negative control), and extracts of three kinds of microneedle patches at 37° for 1.5 h. After that, 100 μL supernatant in each group was taken into a 96-well plate, and the OD value was measured at 540 nm. Hemolysis (%) was calculated using the following equation:| Hemolysis (%) = (A − A0)/(A1 − A0) × 100% |
2.8 Cell invasion assay
A 200 μL serum free HN30 cell suspension with a concentration of 5 × 10⁵ cells was seeded in the upper chamber. 750 μL of FBS-containing impregnation solution was added to the lower chamber. After 24 hours, the cells were stained with 0.1% crystal violet in a dark environment for 15 minutes, and the cell invasion was detected under an inverted fluorescence microscope.2.9 Cell cloning experiment
HN30 cells were placed in a 6-well plate at a density of approximately 100 cells per well and cultivated with different impregnation solutions for seven days. After that, 0.1% crystal violet dye solution was added to each well in the dark for 15 minutes. Finally, the cells was observed and photographed under an inverted fluorescence microscope.2.10 Apoptosis experiment
HN30 cells were plated in a 6-well plate at a density of approximately 5 × 10⁵ cells per well. After 48 hours of cultivation with different impregnation solutions, the cells were collected and resuspended with Annexin V binding solution. Then, Annexin V-FITC and PI staining solutions were sequentially added to the cell suspension. After incubation under dark conditions, the apoptosis of tumor cells was investigated using flow cytometry (CytoFLEXS, USA).2.11 Cellular reactive oxygen species (ROS) experiment
HN30 cells were seeded in a 6-well plate (5 × 10⁵ cells per well) in advance and co-cultured with different impregnation solutions. DCFH-DA working solution was obtained after being diluted by using serum-free DMEM at a ratio of 1![[thin space (1/6-em)]](https://www.rsc.org/images/entities/char_2009.gif) :
:![[thin space (1/6-em)]](https://www.rsc.org/images/entities/char_2009.gif) 1000 (10 μmol L−1). After 24 hours, the cell culture was replaced with 1 μL DCFH-DA working solution (Rosup as the positive control group). The cells were then incubated at 37 °C for 20 minutes and observed by using an inverted fluorescence microscope to determine the level of ROS in tumor cells. Besides, the cells were resuspended in PBS, and the fluorescence intensity of DCFH-DA in different groups was detected by flow cytometry to indirectly reflect the content of ROS.
1000 (10 μmol L−1). After 24 hours, the cell culture was replaced with 1 μL DCFH-DA working solution (Rosup as the positive control group). The cells were then incubated at 37 °C for 20 minutes and observed by using an inverted fluorescence microscope to determine the level of ROS in tumor cells. Besides, the cells were resuspended in PBS, and the fluorescence intensity of DCFH-DA in different groups was detected by flow cytometry to indirectly reflect the content of ROS.
2.12 Cellular lipid oxidative damage (MDA) assay
HN30 cells were collected in three centrifuge tubes with no less than 3 × 10⁶ cells in each group. 0.5 mL of extraction solution was added to each tube and sonicated (90 W, 4 s per time, 2 s interval, and a total time of 10 minutes) to obtain the suspension. Then 0.1 mL of anhydrous ethanol, the standard sample, and the three samples to be tested, were mixed with 1 mL of working solution in a water bath at 100 °C for 40 minutes. After cooling to room temperature and centrifuging for 10 minutes, the OD value at 532 nm was measured on an enzyme-linked immunosorbent assay. The MDA value of each group was calculated according to the following formula, which corresponds to the oxidative damage in tumor cells.| MDA (nmol mg−1 prot) = ΔA1/ΔA2 × C × f ÷ Cpr |
2.13 Cellular glutathione (GSH) detection experiment
HN30 cells were inoculated in 6-well plates, with a cell count of 1 × 10⁶. 500 μL of PBS (0.01 M, pH 7.4) added to each well for homogenization, and the supernatant was collected after being centrifuged (10![[thin space (1/6-em)]](https://www.rsc.org/images/entities/char_2009.gif) 000×g, 10 minutes) at 4 °C. The OD value was measured at 405 nm using an enzyme-linked immunosorbent assay.
000×g, 10 minutes) at 4 °C. The OD value was measured at 405 nm using an enzyme-linked immunosorbent assay.
The formula for calculating the GSH content in cells was
| GSH content (μmol L−1) = (ΔA405 − b) ÷ a × 2 × f ÷ Cpr |
2.14 In vivo application of the microneedle patch
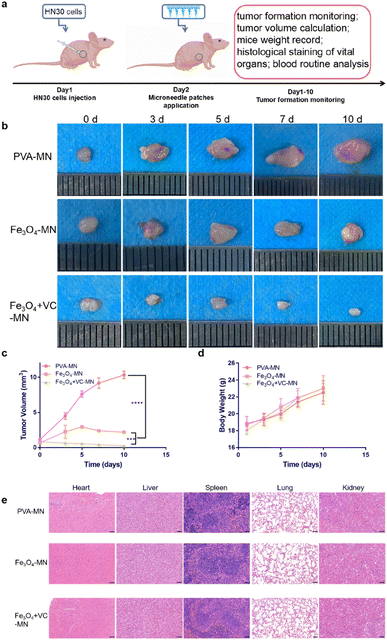
4 week-old BALB/c-nu nude mice were purchased from Hubei Beente Biological Co., Ltd. After one week of adaptive feeding, a 150 μL HN30 cell suspension (5 × 10⁶ cells per mL) was injected into the right armpit of the mice. After tumorigenesis, all the mice were randomly divided into three groups (PVA-MN group, Fe3O4-MN group, and Fe3O4 + VC-MN group) according to different treatments. The body weight, tumor size, and tumor volume of nude mice were regularly observed at pre-set timepoints. The whole blood from all animals was collected for routine blood analysis, and the heart, liver, spleen, lungs, and kidneys were separated for haematoxylin and eosin (H&E) staining. All experiments were conducted in accordance with the guidelines and approved by the ethics committee of Wuhan University.2.15 Statistical analysis
The data are presented as the mean ± standard deviation (SD) and were analysed using GraphPad (version 7.0) with student's t-tests and one-way analysis of variance (ANOVA). The threshold of statistical significance was p < 0.05.3 Results and discussion
3.1 Synthesis and characterization of Fe3O4 + VC-MNs
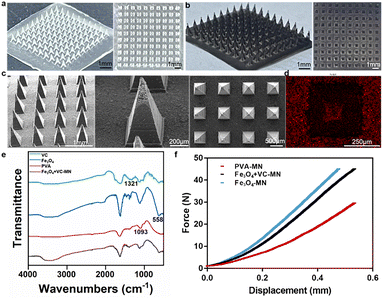
The geometries of the individual microneedle and the entire patch affect the performance of the microneedle patches, which are typically 10–1000 μm long.22 When applied quasistatically (manually) to the skin/mucosa, longer microneedles increase the reliability of insertion to overcome the deformation caused by shorter microneedles simply bending the surface without penetration.23,24 The optical pictures of PVA-MN showed that the patch is a square with a 1 cm side length, and the microneedle bodies are neatly arranged into a 10 × 10 array, with a transparent appearance (Fig. 2a).Biosafety is a prerequisite for in vivo applications of the materials. To guarantee that the effective concentration of the drug loaded against the tumor was harmless to normal cells, L929 cells, HUVEC cells and HN30 cells were treated with different concentrations of the Fe3O4 and VC mixture. Based on the data in Fig. S3,† a drug concentration of 500 μg mL−1 was selected for microneedle synthesis. As displayed in Fig. 2b, the morphology of Fe3O4 + VC-MN was consistent with that of PVA-MN, while it possessed a black appearance due to the Fe3O4 present. SEM images of Fe3O4 + VC-MN (Fig. 2c) demonstrated that the microneedle body presented a pyramid shape, with a height of about 900 μm, which was sufficient to ensure penetration of the skin or mucosal tissue.25–27
Furthermore, the EDS pattern shown in Fig. 2d demonstrates that the Fe element is densely distributed at the microneedle and bottom of the patch, verifying the successful loading of Fe3O4. In addition, FTIR spectra were acquired to elucidate the chemical composition of Fe3O4 + VC-MN. As presented in Fig. 2e, the characteristic absorption peaks of Fe–O (558 cm−1), C![[double bond, length as m-dash]](https://www.rsc.org/images/entities/char_e001.gif) O (1321 cm−1) and C–OH (1093 cm−1) appeared, indicating the successful loading of Fe3O4 and VC.28–31 Furthermore, in order to verify the penetration ability of microtargeted tissues, the mechanical properties of microneedles were evaluated. It can be observed from Fig. 2f that at a displacement of 400 μm, the mean compression force of PVA-MN, Fe3O4-MN, and Fe3O4 + VC-MN was 0.189 N, 0.372 N, and 0.315 N per needle, respectively, without buckling, which could meet the minimum force value (0.058 N) required for skin penetration according to previous studies.32,33
O (1321 cm−1) and C–OH (1093 cm−1) appeared, indicating the successful loading of Fe3O4 and VC.28–31 Furthermore, in order to verify the penetration ability of microtargeted tissues, the mechanical properties of microneedles were evaluated. It can be observed from Fig. 2f that at a displacement of 400 μm, the mean compression force of PVA-MN, Fe3O4-MN, and Fe3O4 + VC-MN was 0.189 N, 0.372 N, and 0.315 N per needle, respectively, without buckling, which could meet the minimum force value (0.058 N) required for skin penetration according to previous studies.32,33
3.2 Solubility and drug release of Fe3O4 + VC-MNs
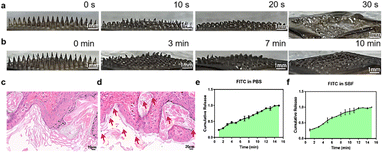
To test the in vitro solubility and puncture ability of Fe3O4 + VC-MN, we first utilized agar blocks to simulate human tissue and recorded the morphological changes in the microneedles after insertion. It can be observed that the tip of the Fe3O4 + VC-MN dissolved rapidly with a significant decrease in height as time progressed (Fig. 3a and S1†), and all the microneedles were mostly dissolved within 30 s, including the bottom surface. Simultaneously, to ensure the penetrating force of Fe3O4 + VC-MN, it was punctured on the mouse skin surface (Fig. S1†). As shown in Fig. 3b, with the extension of time, the tip of the microneedle dissolved significantly at 3 min and basically dissolved at 10 min. However, the dissolution rate of the microneedles inserted into the skin tissue was significantly slower than that after insertion into the agar block, possibly ascribed to the higher water content and softer texture of agar. Fig. 3c displays the H&E staining image of skin tissue after being punctured with PVA-MN. The formation of pinholes on the skin surface corresponding to the microneedle array can be observed. Furthermore, the H&E staining image of skin tissue after being punctured by Fe3O4 + VC-MN at the puncture site shows the conical channel formed, as well as the retention of black Fe3O4 particles, which proved the excellent puncture strength and in situ drug release properties of Fe3O4 + VC-MN (Fig. 3d).Next, FITC was used as a simulation drug loaded on microneedles (FITC-MN) to test the drug release capacity.34 After being placed in PBS and SBF solution, FITC-MN was completely dissolved in roughly 10 minutes (Fig. 3e and f). For visually presenting drug release after dissolution, FITC-MN was punctured into an agar block. According to the area of yellow-green color at different time points, the solubility of the microneedle and FITC release were indirectly reflected (Fig. S2†). All these results indicated that Fe3O4 + VC-MN possessed admirable solubilization, drug loading and release capacities, which assured the reliability of its in vivo application.
3.3 Anti-tumor effects of Fe3O4 + VC-MNs in vitro
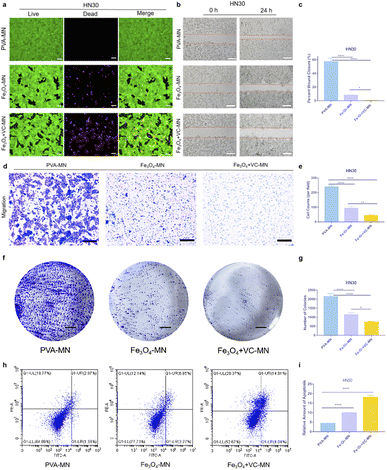
The prognosis of tumors is closely related to the ability of tumors to proliferate, invade, migrate, and undergo apoptosis.35,36 For assessing the antitumor effect of microneedles, PVA-MNs (control group), Fe3O4-MNs and Fe3O4 + VC-MNs (experimental groups) were prepared for the following cellular experiments. Preliminarily, we conducted live and dead cell staining to evaluate cell survival after microneedle treatment. As shown in Fig. 4a, a large number of HN30 cells died after 24 hour coculture with Fe3O4-MNs and Fe3O4 + VC-MNs, compared with that of PVA-MNs, while the L929 cells and HUVECs showed no obvious cell death (Fig. S4†). Then, the migration of HN30 cells under the actions of the three types of microneedles was assayed. As can be seen from Fig. 4b and c, after scratching, the migration of HN30 cells was significantly inhibited in Fe3O4-MN and Fe3O4 + VC-MN groups, where in the degree of inhibition was more remarkable in the Fe3O4 + VC-MNs group, while there was no such inhibitory effect in L929 cells and HUVECs (Fig. S5†), which further confirmed the selective killing effect of Fe3O4 + VC-MNs on tumor cells. Besides, we assayed the hemolysis of different microneedle patches. As shown in Fig. S6,† the hemolysis rates in experimental groups are all lower than 5%, demonstrating the admirable compatibility of Fe3O4 + VC-MN.Afterwards, the influence of microneedles on cell invasion ability was evaluated. Fig. 4d clearly shows that the invasion of HN30 cells is restrained in the Fe3O4-MN and Fe3O4 + VC-MN groups compared with in the PVA-MN group. According to the quantitative statistical data in Fig. 4e, the amount of cells invaded in the Fe3O4 + VC-MN group was significantly lower than that in the Fe3O4-MN group. The results of further cell cloning experiments showed the same trend, and the number of cloning clusters in the Fe3O4 + VC-MN group was less than that in the other two groups (Fig. 4f and g). Subsequently, flow cytometry was used to detect apoptosis after the application of different microneedles, and the results show that the number of apoptotic cells in the Fe3O4 + VC-MN group was the highest among the three groups (Fig. 4h and i).
3.4 Cellular mechanisms of Fe3O4 + VC-MNs
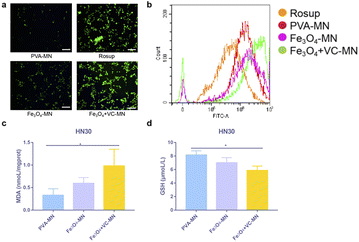
Reactive oxygen species (ROS), hydroxyl radical, play a mediating role in the process of cell life activity, stress and death. Once the levels of ROS (in excess) and antioxidant components (present at low levels) cannot be maintained in balance, intracellular oxidative stress can result, thereby affecting the cell state.37 To verify the effects of Fe3O4 and VC on cellular oxidative stress in the tumor microenvironment, we first examined the performance of intracellular ROS in HN30 cells under the action of three microneedles. Fig. 5a shows the levels of intracellular ROS of HN30 cells (green fluorescence) after Fe3O4 + VC-MN treatment was highest, which was close to that in the positive control group (Rosup). In addition, Fig. 5b shows the results of ROS detection by flow cytometry. After stimulation with different microneedle extracts, the cells in the Fe3O4 + VC-MN group produced more ROS than that in PVA-MN and Fe3O4-MN groups, indicating that the co-existence of Fe3O4 and VC promoted the production of more ROS. Furthermore, the result in Fig. 5c showed that the MDA content of HN30 cells was the highest after Fe3O4 + VC-MN treatment, meaning the most severe intracellular oxidative damage.GSH, as an important antioxidant, is capable of effectively trapping and eliminating free radicals, and protects the sulfhydryl groups of basic enzymes and proteins from oxidation or inactivation.38 Stable GSH levels are key for maintaining normal cellular biological functions, while the excessive reduced GSH will weaken the CDT efficacy of ROS against tumor cells.39Fig. 5d shows the intracellular GSH contents in HN30 cells. The results indicated that the concentration of GSH in the tumor cells in the Fe3O4 + VC-MN group was significantly less than that in the PVA-MN group, demonstrating that the presence of Fe3O4 and VC inhibited the production of GSH. All these experimental results confirmed that the targeted release of Fe3O4 and VC at the tumor site could induce in situ production of sufficient H2O2 by consumption intracellular reduced GSH, thereby promoting the Fenton reaction to inhibit tumors.
3.5 In vivo application of Fe3O4 + VC-MNs
Studies have shown that microneedles can induce more apoptosis and inhibit cancer cell proliferation in vivo and enhance anti-tumor effects by delivering drugs.40 To verify the efficacy and biosafety of Fe3O4 + VC-MNs, we constructed subcutaneous tumor models in nude mice and applied the three kinds of microneedles to a local site (Fig. 6a). At the present time point, we regularly photographed and observed the gross and local tumors of mice, meanwhile comparing the volume variations of tumors in different groups. From the optical images in Fig. 6b and S7,† we found that compared with the PVA-MNs, the application of Fe3O4-MN and Fe3O4 + VC-MN groups resulted in smaller tumors. According to quantitative analysis of tumor volume (Fig. 6c), it could be determined that the tumor volume in the Fe3O4 + VC-MN group was the smallest. Ultimately, we evaluated the in vivo biocompatibility of microneedles. Based on the monitoring the results of the weight of nude mice, it was found that the weight of all the mice steadily increased over time, with no significant difference among the three groups (Fig. 6d). Meanwhile, Fig. 6e presents H&E staining images of the heart, liver, spleen, lungs, and kidneys of mice after sacrifice. Moreover, Table. S1† shows the results of routine blood tests after death on the tenth day after microneedle treatment in different groups. The results showed that after microneedle treatments, there was no significant damage to the visceral organs. All the above results demonstrated the effectiveness and biosafety of Fe3O4 + VC-MNs when applied to OSCC treatment.4 Conclusion
The treatment of OSCC still suffers from limited efficacy, severe toxic side effects and difficulty in eradication. In this study, a local TME-responsive functional microneedle patch was successfully constructed using the solubility and drug delivery capability of a PVA base, achieving targeted drug delivery at the tumor site for the synergistic treatment of OSCC. This microneedle patch provides a new therapeutic idea of TME responsiveness, which is expected to be further applied in the clinic and provides a new idea for other tumor-related treatment.Author contributions
S. Z. and Y. L. contributed equally to this work. S. Z.: conceptualization, methodology, data curation, software, schematic drawing, writing – original draft, writing—review and editing, supervision, and project administration. Y. L.: conceptualization, methodology, data curation, software, schematic drawing, writing – original draft, writing—review and editing, supervision, and project administration. B. C.: conceptualization and methodology.Conflicts of interest
There are no conflicts to declare.Acknowledgements
The authors sincerely acknowledge the funding support from the Hubei Province Unveiled the List System of Science and Technology Projects (Grant no. 2021BEC027), Hubei Provincial Natural Science Foundation Project (Grant no. 2022CFB761), Youth Science Fund Cultivation Project (Grant no. CXPY2022018), Fundamental Research Funds for the Central Universities (Grant no. 2042022kf115), and Translational Medicine and Interdisciplinary Research Joint Fund of Wuhan University (Grant no. ZNJC202242). The authors also sincerely appreciate the assistance from the School of Basic Medicine, Wuhan University.References
- A. Chamoli, A. S. Gosavi, U. P. Shirwadkar, K. V. Wangdale, S. K. Behera, N. K. Kurrey, K. Kalia and A. Mandoli, Oral Oncol., 2021, 121, 105451 CrossRef PubMed.
- H. Sung, J. Ferlay, R. L. Siegel, M. Laversanne, I. Soerjomataram, A. Jemal and F. Bray, CA Cancer J. Clin., 2021, 71, 209–249 CrossRef PubMed.
- M. Chen, J. Yang, L. Zhou, X. Hu, C. Wang, K. Chai, R. Li, L. Feng, Y. Sun, C. Dong and S. Shi, ACS Appl. Mater. Interfaces, 2022, 14, 57–68 CrossRef CAS PubMed.
- M. Ji, H. Liu, J. Gou, T. Yin, H. He, Y. Zhang and X. Tang, Nanoscale, 2023, 15, 8948–8971 RSC.
- X. Meng, D. Li, L. Chen, H. He, Q. Wang, C. Hong, J. He, X. Gao, Y. Yang, B. Jiang, G. Nie, X. Yan, L. Gao and K. Fan, ACS Nano, 2021, 15, 5735–5751 CrossRef CAS PubMed.
- L. Gao, Y. Liu, D. Kim, Y. Li, G. Hwang, P. C. Naha, D. P. Cormode and H. Koo, Biomaterials, 2016, 101, 272–284 CrossRef CAS PubMed.
- B. Cai, M. Hou, S. Zhang, Z. Xin, J. Huang, J. Yang, Y. Wang, X. Cai, S. Xie, C. Zhang and Y. Huang, Int. J. Nanomed., 2021, 16, 5193–5209 CrossRef PubMed.
- W. H. Park, Oncol. Rep., 2018, 40, 1787–1794 CAS.
- L. Zhang, C.-X. Li, S.-S. Wan and X.-Z. Zhang, Adv. Healthcare Mater., 2022, 11, 2101971 CrossRef CAS PubMed.
- J. Yun, E. Mullarky, C. Lu, K. N. Bosch, A. Kavalier, K. Rivera, J. Roper, I. I. C. Chio, E. G. Giannopoulou, C. Rago, A. Muley, J. M. Asara, J. Paik, O. Elemento, Z. Chen, D. J. Pappin, L. E. Dow, N. Papadopoulos, S. S. Gross and L. C. Cantley, Science, 2015, 350, 1391–1396 CrossRef CAS PubMed.
- X. Ren, S. M. Santhosh, L. Coppo, F. T. Ogata, J. Lu and A. Holmgren, Free Radical Biol. Med., 2019, 134, 350–358 CrossRef CAS PubMed.
- T. Sheng, B. Luo, W. Zhang, X. Ge, J. Yu, Y. Zhang and Z. Gu, Adv. Drug Delivery Rev., 2021, 179, 113919 CrossRef CAS PubMed.
- B. Z. Chen, Z. Q. Zhao, M. A. Shahbazi and X. D. Guo, Nanoscale Horiz., 2022, 7, 715–728 RSC.
- R. L. Creighton and K. A. Woodrow, Adv. Healthcare Mater., 2019, 8, 1801180 CrossRef PubMed.
- Z. Chen, H. Li, Y. Bian, Z. Wang, G. Chen, X. Zhang, Y. Miao, D. Wen, J. Wang, G. Wan, Y. Zeng, P. Abdou, J. Fang, S. Li, C.-J. Sun and Z. Gu, Nat. Nanotechnol., 2021, 16, 933–941 CrossRef CAS PubMed.
- S. Khan, A. Hasan, F. Attar, M. M. N. Babadaei, H. A. Zeinabad, M. Salehi, M. Alizadeh, M. Hassan, H. Derakhshankhah, M. R. Hamblin, Q. Bai, M. Sharifi, M. Falahati and T. L. M. Ten Hagen, J. Controlled Release, 2021, 338, 341–357 CrossRef CAS PubMed.
- P. Liu, Y. Fu, F. Wei, T. Ma, J. Ren, Z. Xie, S. Wang, J. Zhu, L. Zhang, J. Tao and J. Zhu, Adv. Sci., 2022, 9, e2202591 CrossRef PubMed.
- Y. Hao, Y. Chen, X. He, F. Yang, R. Han, C. Yang, W. Li and Z. Qian, Bioact. Mater., 2020, 5, 542–552 CrossRef PubMed.
- L. S. Lin, T. Huang, J. Song, X. Y. Ou, Z. Wang, H. Deng, R. Tian, Y. Liu, J. F. Wang, Y. Liu, G. Yu, Z. Zhou, S. Wang, G. Niu, H. H. Yang and X. Chen, J. Am. Chem. Soc., 2019, 141(25), 9937–9945 CrossRef CAS PubMed.
- E. Caffarel-Salvador, S. Kim, V. Soares, R. Y. Tian, S. R. Stern, D. Minahan, R. Yona, X. Lu, F. R. Zakaria, J. Collins, J. Wainer, J. Wong, R. McManus, S. Tamang, S. McDonnell, K. Ishida, A. Hayward, X. Liu, F. Hubálek, J. Fels, A. Vegge, M. R. Frederiksen, U. Rahbek, T. Yoshitake, J. Fujimoto, N. Roxhed, R. Langer and G. Traverso, Sci. Adv., 2021, 7, 2620 CrossRef PubMed.
- M. Guo, Y. Wang, B. Gao and B. He, ACS Nano, 2021, 15, 15316–15327 CrossRef CAS PubMed.
- M. R. Prausnitz, Annu. Rev. Chem. Biomol. Eng., 2017, 8, 177–200 CrossRef CAS PubMed.
- T. R. R. Singh, N. J. Dunne, E. Cunningham and R. F. Donnelly, Recent Pat. Drug Delivery Formulation, 2011, 5, 11–23 CrossRef CAS PubMed.
- K. Ita, Curr. Drug Delivery, 2017, 14, 357–363 CrossRef CAS PubMed.
- M. Yin, J. Wu, M. Deng, P. Wang, G. Ji, M. Wang, C. Zhou, N. T. Blum, W. Zhang, H. Shi, N. Jia, X. Wang and P. Huang, ACS Nano, 2021, 15, 17842–17853 CrossRef CAS PubMed.
- Q. Zhang, L. Shi, H. He, X. Liu, Y. Huang, D. Xu, M. Yao, N. Zhang, Y. Guo, Y. Lu, H. Li, J. Zhou, J. Tan, M. Xing and G. Luo, ACS Nano, 2022, 16, 10163–10178 CrossRef CAS PubMed.
- H. Du, P. Liu, J. Zhu, J. Lan, Y. Li, L. Zhang, J. Zhu and J. Tao, ACS Appl. Mater. Interfaces, 2019, 11, 43588–43598 CrossRef CAS PubMed.
- T. Jamnongkan, K. Kantarot, K. Niemtang, P. P. Pansila and A. Wattanakornsiri, Trans. Nonferrous Met. Soc. China, 2014, 24, 3386–3393 CrossRef CAS.
- A. S. El-Shafie, F. G. Barah, M. Abouseada and M. El-Azazy, Nanomaterials, 2023, 13, 1444 CrossRef CAS PubMed.
- R. Rahmani, M. Gharanfoli, M. Gholamin, M. Darroudi, J. Chamani and K. Sadri, J. Mol. Struct., 2019, 1196, 394–402 CrossRef CAS.
- M. Yasaei, M. Khakbiz, A. Zamanian and E. Ghasemi, Mater. Sci. Eng., C, 2019, 103, 109816 CrossRef CAS PubMed.
- . W. Yu, F. Jia, J. Fu, Y. Chen, Y. Huang, Q. Jin, Y. Wang and J. Ji, ACS Nano, 2023, 17(16), 15713–15723 CrossRef PubMed.
- H. Wang, Y. Fu, J. Mao, H. Jiang, S. Du, P. Liu, J. Tao, L. Zhang and J. Zhu, Adv. Mater., 2022, 34(51), e2207832 CrossRef PubMed.
- N. Zhang, X. Zhou, L. Liu, L. Zhao, H. Xie and Z. Yang, Front. Pharmacol, 2021, 12, 719905 CrossRef CAS PubMed.
- A. Duarte, G. André-Grégoire, K. Trillet, A. Thys, N. Bidère, A. Ribeiro-Silva and J. Gavard, Mol. Carcinog., 2019, 58, 161–168 CrossRef CAS PubMed.
- L. Cassetta and J. W. Pollard, Nat. Rev. Drug Discovery, 2018, 17, 887–904 CrossRef CAS PubMed.
- J. Lin, D. Li, C. Li, Z. Zhuang, C. Chu, K. Ostrikov, E. W. Thompson, G. Liu and P. Wang, Nanoscale, 2023, 7 Search PubMed.
- Z. Xu, S. Han, Z. Gu and J. Wu, Adv. Healthcare Mater., 2020, 9, e1901502 CrossRef PubMed.
- J. Xu, A. Gulzar, D. Yang, S. Gai, F. He and P. Yang, Nanoscale, 2019, 11, 17535–17556 RSC.
- X. Lan, J. She, D.-A. Lin, Y. Xu, X. Li, W.-F. Yang, V. W. Y. Lui, L. Jin, X. Xie and Y.-X. Su, ACS Appl. Mater. Interfaces, 2018, 10, 33060–33069 CrossRef CAS PubMed.
Footnotes |
| † Electronic supplementary information (ESI) available. See DOI: https://doi.org/10.1039/d3na00527e |
| ‡ These authors contributed equally to this work. |
| This journal is © The Royal Society of Chemistry 2023 |

