 Open Access Article
Formation of intermetallic PdIn nanoparticles: influence of surfactants on nanoparticle atomic structure†
Baiyu
Wang
 a,
Jette K.
Mathiesen
b,
Andrea
Kirsch
 a,
Nicolas
Schlegel
c,
Andy S.
Anker
 a,
Frederik L.
Johansen
 a,
Emil T. S.
Kjær
 a,
Olivia
Aalling-Frederiksen
a,
Tobias M.
Nielsen
a,
Maria S.
Thomsen
a,
Olivia
Aalling-Frederiksen
a,
Tobias M.
Nielsen
a,
Maria S.
Thomsen
 a,
Rasmus K.
Jakobsen
 a,
Matthias
Arenz
c and
Kirsten M. Ø.
Jensen
 *a
*a
aDepartment of Chemistry, University of Copenhagen, Universitetsparken 5, 2100 Copenhagen Ø, Denmark. E-mail: kirsten@chem.ku.dk
bDepartment of Physics, Technical University of Denmark, Fysikvej, 2800 Kongens Lyngby, Denmark
cDepartment of Chemistry, Biochemistry and Pharmaceutical Sciences, University of Bern, Freiestrasse 3, 3012 Bern, Switzerland
First published on 2nd November 2023
Abstract
Bimetallic nanoparticles have been extensively studied as electrocatalysts due to their superior catalytic activity and selectivity compared to their monometallic counterparts. The properties of bimetallic materials depend on the ordering of the metals in the structure, and to tailor-make materials for specific applications, it is important to be able to control the atomic structure of the materials during synthesis. Here, we study the formation of bimetallic palladium indium nanoparticles to understand how the synthesis parameters and additives used influence the atomic structure of the obtained product. Specifically, we investigate a colloidal synthesis, where oleylamine was used as the main solvent while the effect of two surfactants, oleic acid (OA) and trioctylphosphine (TOP) was studied. We found that without TOP included in the synthesis, a Pd-rich intermetallic phase with the Pd3In structure initially formed, which transformed into large NPs of the CsCl-structured PdIn phase. When TOP was included, the syntheses yielded both In2O3 and Pd3In. In situ X-ray total scattering with Pair Distribution Function analysis was used to study the formation process of PdIn bimetallic NPs. Our results highlight how seemingly subtle changes to material synthesis methods can have a large influence on the product atomic structure.
Introduction
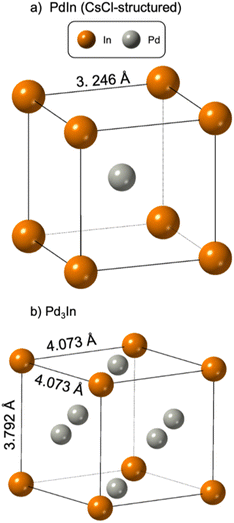
Bimetallic nanoparticles (NPs) have drawn extensive attention due to their widespread use in (electro)catalysis.1 Compared to monometallic NPs, bimetallic NPs provide greater flexibility as their catalytic properties can be tuned by optimizing their surface structure for specific reactions. Palladium based bimetallic systems have emerged as one of the most promising catalysts in the fields of environment protection and renewable energy conversion, as they usually show higher specific activity and selectivity than that of pure Pd for several important reactions.2–4 For example, intermetallic PdIn NPs show higher selectivity for ethane dehydrogenation compared to monometallic Pd catalysts.5,6 Furthermore, bimetallic catalysts such as PdIn make use of non-precious metals to replace parts of Pd, which reduces catalyst costs.Intermetallic NPs, where the different elements are ordered in specific sites in the crystal lattice, very often show better catalytic properties than disordered alloy structures.5,7,8 The atomic ordering affects the interaction energy of the chemical intermediates that adsorb and react during the catalytic reaction, and the catalytic properties can be tuned.7,9,10 When developing synthesis methods for bimetallic NPs, it is therefore important to be able to control the NP atomic structure. Pd–In based NPs are known in several different intermetallic structures, including PdIn, taking the CsCl-structure (Fig. 1a) and tetragonal Pd3In. PdIn is thermodynamically stable up to 1285 °C for Pd% ca. 50–60%, while Pd3In is thermodynamically stable to 1030 °C for Pd% ca. 68–70%.11,12 The Pd3In structure reported in space group P4/mmm is shown in Fig. 1b.13 Pd3In has, however, been described in several tetragonal structures with different levels of order between Pd and In, and neutron diffraction studies by Kohlman and Ritter12,14 have shown that the atoms order further than the simple structure illustrated in Fig. 1b, leading to larger unit cells.12,14 Other compositions and structures have also been reported, including orthorhombic In3Pd5 and InPd2.11,12
Intermetallic PdIn NPs with the CsCl type structure are commonly synthesized using high temperature (e.g. 700 °C) annealing or by using harsh reducing agents (e.g. NaBH4).5,6,15 However, due to the tendency of NPs to undergo sintering and degradation at high annealing temperatures, the ability to design small, monodisperse nanoparticles is severely constrained when using this synthesis approach. When using a harsh reducing agent, rapid nucleation can occur which hinders control of the NP formation and growth. Recently, new synthesis pathways of binary metal NPs using organic solvents have been developed, which enable controlled reactions at lower temperatures (e.g. 200 °C).16–18 These methods rely on reduction of metal salts or seed-mediated approaches. However, despite the recent developments in the field, the reaction mechanism of the formation of intermetallic NPs, including PdIn are not well understood. To control NP structure and obtain the desired properties, it is critical to obtain insight into the relation between synthesis and structure.
By combining synthesis parameter studies and in situ X-ray scattering studies,19–22 we here show that the formation of PdIn intermetallic NPs can be controlled by using selected capping agents in the synthesis. Our results show an initial formation of a Pd-rich, Pd3In-like phase which eventually transforms into PdIn NPs. The phase transformation process can be slowed down by using oleic acid (OA) as a surfactant in the synthesis. When adding trioctylphosphine (TOP) in the synthesis, an indium hydroxide phase, In(OH)3, initially forms and transforms into an oxide phase (In2O3), which forms along with Pd3In. When OA and TOP are added together to the synthesis, the In2O3 phase forms directly, followed by the formation of Pd3In. Our study thus shows how addition of surfactants and capping agents have a large influence on the NP formation pathway and their atomic structure.
Methods
Chemicals
Palladium(II) acetylacetonate (Pd(acac)2, 99%), palladium(II) bromide (PdBr2, 99%), indium(III) acetate (In(ac)3, 99.99%), trioctylphosphine (TOP, 97%), oleic acid (OA, 90%), ascorbic acid and oleylamine (OLA, 70%) were all purchased from Sigma-Aldrich. Indium(III) chloride (InCl3, 99%) was purchased from Alfa Aesar. Hexane (97%) and ethanol (96%) were bought from VWR Chemicals. All the chemicals were used as received.Synthesis of PdIn NPs
In a typical synthesis, a mixture of 1.12 mmol Pd-precursor (PdBr2 or Pd(acac)2), 1.12 mmol In-precursor (In(ac)3 or InCl3), 7.8 mL of OLA, 0.77 mL OA and 0.77 mL TOP were heated in air to 110 °C under magnetic stirring in a 100 mL three-neck flask for 30 minutes. The resulting mixture was further heated to 235 °C, where the NP formation was clearly observed by a color change in the solution from yellow to black. The colloidal suspension was maintained at this temperature for 2 hours before it was cooled to room temperature. The final product was collected by centrifugation at 9000 rpm and washed with an ethanol/hexane mixture five times. The product was dispersed in 4 mL of hexane.Characterization
The resulting samples were drop-casted and dried on a glass wafer and mounted on a zero-background sample holder. Laboratory powder X-ray diffraction (PXRD) measurements were performed on a Bruker D8 instrument with Cu Kα radiation in the 2θ range 10°–80°. The PXRD data were analyzed using Rietveld refinement in Topas Academic.23 The instrument resolution function was determined using a corundum (Al2O3) standard sample. Refined parameters include the scale factor and the lattice parameters for the respective phases. The average crystallite sizes were determined from all observed reflections using the integral breadth of the respective profile functions fitted with Gaussian and Lorentzian components and given by the Topas suite as LVol-IB.TEM images were acquired on an FEI Tecnai Spirit using a Tungsten filament at an acceleration voltage of 80 kV. For sample preparation, the powders were first dispersed in ethanol (∼0.8 mg mLEtOH−1). Using both a bath and a horn sonicator, the dispersion was homogenized. The EtOH/sample vial was cooled in an ice bath when using the horn sonicator. Then, 20 μL of the respective sample dispersion was pipetted onto a cuprous TEM grid (QUANTIFOIL, Classic Holey Carbon films). The grids were then left to dry at ambient conditions.
Absorption spectra were recorded on a Lambda 1050 UV/VIS/NIR absorption spectrometer from PerkinElmer using a halogen lamp as excitation source. The samples were prepared by filtering off any larger aggregates with syringe filters (Frisenette QMax RR syringe filters 13 mm PTFE hydrophobic). Heptane was used for the solvent background and was subtracted manually from the spectra. Slits were kept at 1 nm.
In situ X-ray total scattering (TS) studies
All X-ray TS data were collected at beamline P21.1, DESY, Hamburg, Germany. All data were collected using an X-ray wavelength of 0.122 Å and an area detector, placed ca. 39 cm from the sample. The synthesis experiments were done using a 3 mm NMR tube, which was filled with precursor solution and heated to 235 °C using a block heater while collecting temperature-resolved X-ray TS patterns. Calibration of instrumental parameters was done using Fit2D and the data were integrated using Dioptas.24,25 The total scattering data were corrected and normalized to obtain the reduced total scattering function F(Q), which was Fourier transformed to obtain the Pair Distribution Function (PDF) using xPDFsuite.26 The following parameters were used in xPDFsuite: Qmin = 1.6 Å−1, Qmax = 18 Å−1, Qmaxinst = 23 Å−1 and rpoly = 0.9 Å. The PDFs were modeled using PDFgui.27Results and discussion
Influence of metal precursor salt
We first consider how the metal ion precursors affect the atomic structure of the resulting NPs, as these can have a large influence on the NP formation process. Specifically, we investigate metal halides (chlorides and bromides) and metal acetyl acetonates. Metal halides are commonly used for synthesis of bi- and intermetallic NPs.17,28 Firstly, it is well-known that halide ions (e.g. Cl−, Br−) can modify reduction kinetics and the atom diffusion/exchange rate by coordinating with metal ions during the synthesis of metallic NPs.28 Secondly, halide ions facilitate oxidative etching in the presence of oxygen, which can influence the growth mode.29 Metal acetylacetonate (acac) and acetate precursors are also commonly used in NP synthesis due to their low decomposition temperatures, large coordination capacity, and potential for commercialization.30,31 Acac and acetate ligands furthermore have a high degree of resonance stabilization, making them ideal leaving groups in reduction reactions.Here, we investigate palladium(II) bromide (PdBr2) and indium(III) chloride (InCl3) as halide precursors, and palladium(II) acetylacetonate (Pd(acac)2) and indium(III) acetate (In(ac)3) as metal organic precursors. Four syntheses with different combinations of metal precursors were carried out: (a1) InCl3 + Pd(acac)2, (b1) InCl3 + PdBr2, (c1) In(ac)3 + PdBr2, and (d1) In(ac)3 + Pd(acac)2. The synthesis method used here is inspired by a study from Wang et al.,32 where mixed metal precursors and oleylamine (OLA) are heated in air to a certain reaction temperature to obtain intermetallic NPs.
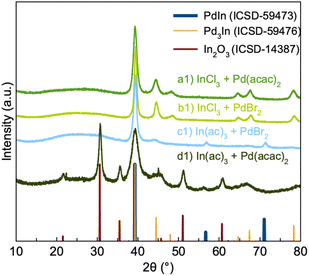
Powder X-ray diffraction (PXRD) patterns of the products from the four syntheses are shown in Fig. 2. If first considering synthesis a1 and b1, we see that the PXRD pattern from their products show diffraction peaks corresponding to Pd3In. However, quantitative analysis through Rietveld analysis shows that a single Pd3In phase does not give a sufficient description of the data. Fits were done using both the simple Pd3In structure in spacegroup P4/mmm (Fig. 1b), and the structures described by Kohlman and Ritter to take the TiAl3 and ZrAl3 structures in spacegroup I4/mmm. The difference between the structures is the distribution of Pd and In atoms. As Pd and In scatter X-rays very similarly (46 and 49 electrons, respectively) we are not able to distinguish the structures, and they yield comparable, poor fit qualities for our data. Specifically, the asymmetry and width seen in the peak at ca. 45° are poorly fitted by all reported phases. Instead, we found that including a second Pd3In phase, whose lattice parameters are refined independently of the first, provides an adequate description of the data (Fig. S1b†). For simplicity, both phases are described by the small unit cell in space group P4/mmm. The lattice parameters of the two phases in sample a1 (Table S1†) refine to a = 4.0929(8) Å, c = 3.759(1) Å and a = 4.044(2) Å, c = 3.833(3) Å. The need for two separate Pd3In phases may relate to the presence of different stoichiometries than Pd3In in the particles. In has a slightly larger metallic radius than Pd, and a higher In content will thus lead to larger unit cells. It has previously been suggested that intermetallics of the Pd3In structure type may form even for non-ideal stoichiometries.12 We thus hypothesize that the product from synthesis a1 and b1 may not be stoichiometric Pd3In, but rather particles with a continuum of different Pd–In ratios, as will be discussed further below when describing the in situ experiments.
Our Rietveld analyses indicate average Pd3In crystallite sizes (averaged over the two Pd3In phases used for fitting the data) of ca. 6 and 10 nm for sample a1 and b1, respectively (Fig. S1b(e), (f) and Table S1†). The results suggest that bromide ions from the precursor may promote NP growth. A previous study has shown that Br− ions allow NP growth by destabilizing the interaction between the NP surface atoms and the stabilizing agents/surfactants in the synthesis.32 Here, we thus hypothesize that Br− ions in synthesis b1 destabilize the OLA-NPs surface interaction, resulting in the formation of larger Pd3In NPs.
The PXRD pattern of the product from synthesis c1 displays peaks from both Pd3In and PdIn. Quantitative analysis was again done through Rietveld refinement (Fig. S1a(a)†). For simplicity, the Pd3In signal was here described with a single phase, which gives an adequate description of the data. The refinements indicate ca. equal amounts of PdIn (46%) and Pd3In (54%) obtained from synthesis c1 (Table S1†). The only difference between synthesis b1 and c1 is the use of In(ac)3 in synthesis c1, and the nature of the indium precursor thus appears to be critical for forming PdIn. The acetate ligand is a better leaving group compared to the chloride ion due to its high degree of resonance stabilization. We hypothesize that this leads to more indium to be incorporated into the NP structure, leading to the formation of a 1![[thin space (1/6-em)]](https://www.rsc.org/images/entities/char_2009.gif) :
:![[thin space (1/6-em)]](https://www.rsc.org/images/entities/char_2009.gif) 1 intermetallic phase. The crystallite sizes refine to ca. 4 nm for Pd3In and 10 nm for PdIn.
1 intermetallic phase. The crystallite sizes refine to ca. 4 nm for Pd3In and 10 nm for PdIn.
The PXRD pattern of the product from synthesis d1 shows peaks from both Pd3In and In2O3 along with sharp peaks around 22° and 45° 2θ which likely originate from unreduced metal precursors. This again suggests that the presence of bromide is important for forming the intermetallic PdIn phase.
Influence of surfactants
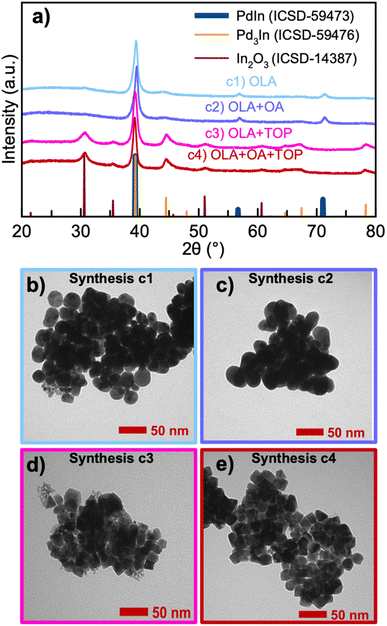
As observed above, formation of PdIn can be promoted using specific metal ion precursors. Besides using the precursor salt for controlling the inherent ligand environment surrounding the metal, the local chemistry can also be tuned through ligand exchange by introducing different surfactants of varying binding affinities. Normally, surfactants are introduced in colloidal NP syntheses to obtain different NP sizes and morphologies.33,34 However, surfactants can also influence the formation of nanocrystals by forming metal–ligand complexes through ligand exchange.35 We here consider the use of oleic acid (OA) and trioctylphospine (TOP) as surfactants. OA is often used as a surfactant because of its ability to form metal-oleate complexes. Previously, Park et al. have shown that metal-oleate complexes formed from metal ions and OA ligands thermally decompose into monodisperse NPs.36 TOP has been used as surfactant in the synthesis of cubic metal NPs to promote certain facets.37,38 Together with OA, TOP has furthermore been used to obtain shape control of nanocrystals.39 In order to study the effect of OA and TOP in the synthesis of PdIn NPs, we performed three additional syntheses. PXRD data from these are shown in Fig. 3a, where the syntheses are labeled as (c1) OLA, (c2) OLA + OA, (c3) OLA + TOP, and (c4) OLA + OA + TOP. In all four syntheses, In(ac)3 and PdBr2 were used as metal precursors. TEM images from the four syntheses are shown in Fig. 3b–e.We first investigate synthesis c2 with the addition of OLA and OA. As also seen when only using OLA (i.e., synthesis c1), synthesis c2 produces both PdIn and Pd3In NPs. Rietveld refinement (Fig. S1a(b)†) reveals that NPs from synthesis c2 also consist of ca. equal amounts of the two phases (53% PdIn and 47% Pd3In), and as was seen for synthesis c1, the PdIn crystallites are much larger than the Pd3In particles (11.0(1) and 3.9(2) nm, respectively). At a first glance, the addition of OA thus has little effect on the synthesis, although this will be discussed further when describing in situ results below.
The TEM images for synthesis c1 and c2 show highly agglomerated nanoparticles of mostly spherical shape. While the agglomeration makes further analysis from these images difficult, the TEM images show nanoparticles of varying sizes. The image presented for synthesis c1 show the presence of smaller nanoparticles (less than 5–10 nm) along with larger particles in the 20–40 nm size range. The large size distribution agrees with the PXRD results, and indicates that the Pd3In and PdIn phases exist as separate particles. However, we note that our current analysis does not allow to determine if core–shell, core–satellites, or janus particles have formed, or if the OA addition has a significant effect on the particle shape. Further high resolution TEM analyses of the nanostructure in the samples would be needed to address this, which is beyond the scope of the study.
Both syntheses c3 and c4 with the presence of TOP produce NPs with a mix of two phases: Pd3In and In2O3 (see Fig. 3a). Rietveld refinement (Fig. S1a(c), (d) and Table S1†) shows that c3 leads to ca. 67 w% Pd3In, while c4 leads to ca. 76 w% Pd3In. Here, we have again described the Pd3In component with two phases with different lattice parameters, which indicates the presence of Pd3In-structured nanoparticles with different compositions. The presence of In2O3 shows that part of the In3+ ions are not reduced. It is well-known that TOP coordinates with Pd2+ ions to form a Pd(II)–TOP complex,40–42 and a change in the absorption is indeed observed when Pd(II) is added to a solution containing TOP (Fig. S2†). The presence of TOP may therefore have slowed down the reduction of Pd as TOP binds with Pd2+ and blocks access from the OLA. This hinders the formation of the bimetallic phase with In, which leads to the formation of In2O3. Indeed, previous studies have shown that thermal decomposition of In(ac)3 in air is followed by the formation of In2O3.43 It is observed from TEM images, see Fig. 3d and e, that NPs with different morphologies start to emerge in syntheses c3 and c4. NPs in rectangular or triangular shapes with sharp edges are present in both syntheses. This can be related to the fact that TOP favors binding on specific facets and thereby influences the shape of NPs.37,44
To promote In3+ reduction, syntheses with ascorbic acid (AA) were performed. AA is commonly used in NP synthesis to facilitate faster reduction of metal ion species. We conducted four additional syntheses, using (c5) OLA + AA, (c6) OLA + OA + AA, (c7) OLA + TOP + AA and (c8) OLA + OA + TOP + AA. As seen in Fig. S3,† syntheses c5 and c6 produce PdIn and Pd3In, and the results are thus comparable to syntheses c1 and c2. Nevertheless, slightly more PdIn forms in the presence of AA, with 64 w% PdIn for c5, and 67 w% PdIn for c6. However, when comparing syntheses c3 and c4 (with TOP present) with syntheses c7 and c8 (with TOP and AA present), they all produce both Pd3In and In2O3 NPs. This suggests that the addition of AA does not directly promote the reduction of In3+ due to the continued presence of In2O3. However, AA promotes the formation of PdIn when the right conditions for its formation are already present, as is the case for synthesis c5 and c6.
Influence of reaction temperature
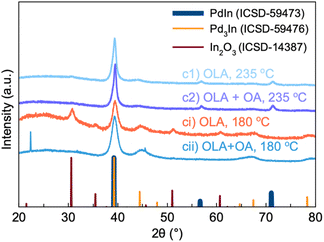
We also carried out syntheses c1 and c2 (synthesis in pure OLA and with the addition of OA) with all synthetic conditions kept the same, except a reaction temperature of 180 °C instead of 235 °C. Fig. 4 compares the PXRD patterns for the products from syntheses c1 and c2 and those obtained at lower reaction temperature, referred to as syntheses ci and cii. Interestingly, synthesis ci produces Pd3In and In2O3 NPs. Rietveld refinements are shown in Fig. S1b(c) and (d).† On the other hand, synthesis cii with OA does not yield In2O3. Instead, Rietveld refinements show that the product can again be described by two Pd3In phases. However, the lattice parameters for one of the phases refines to be almost cubic and close to that of pure Pd (Table S1,†a = 4.009(2) Å and c = 3.906(2) Å). A similar fit quality can be obtained if using a cubic fcc Pd phase along with the tetragonal Pd3In phase. The results from reaction ci and cii show that the reaction temperature is crucial for forming the PdIn intermetallic phase. At 235 °C, more indium appears to be incorporated into the NPs, which can promote the formation of stoichiometric PdIn.We here note that while most pronounced in sample cii, the tendency of the second Pd3In phase to refine towards a cubic phase is also present in the other samples (Table S1†). In general, the lattice parameters for Pd3In vary significantly stronger than the ones of PdIn and In2O3, which always refine to the same values. This fact strengthens our hypothesis that the Pd3In structure can form with different chemical distributions of Pd and In.
In situ studies of PdIn nanoparticle formation: influence of OA
From the parametric synthesis study, we found that in both pure OLA and with OA added (syntheses c1 and c2), a two-phase mixture of Pd3In and PdIn was formed, while the addition of TOP (syntheses c3 and c4) lead to Pd3In and In2O3 NPs. To obtain further insight into the formation process and role of surfactants, we performed in situ X-ray scattering experiments. In situ X-ray TS with Pair Distribution Function (PDF) analysis allows us to follow the real-time structural changes during the reaction and to identify the key intermediate structures involved.
Fig. 5 displays in situ data from synthesis c1 and c2. The data are presented as the reduced structure function F(Q), which is obtained from the X-ray scattering data as:
![[thin space (1/6-em)]](https://www.rsc.org/images/entities/char_2009.gif) sin(θ)/λ. The presentation of the reduced structure function F(Q) rather than the raw scattering data highlights the scattering features also at higher Q-values.
sin(θ)/λ. The presentation of the reduced structure function F(Q) rather than the raw scattering data highlights the scattering features also at higher Q-values.
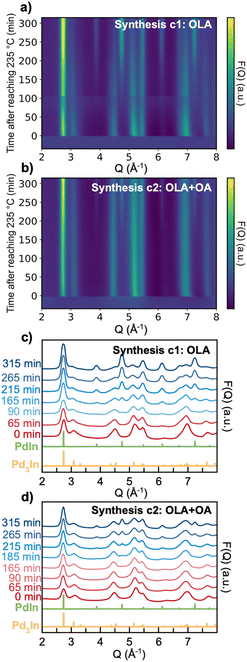
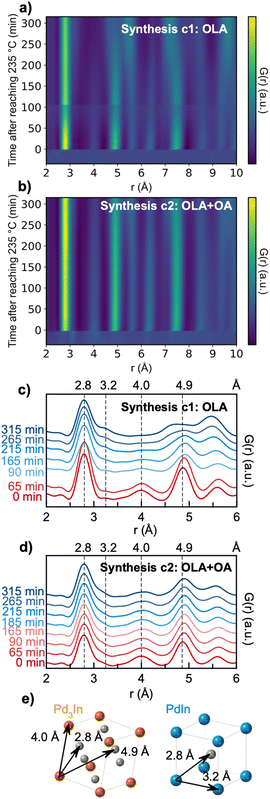
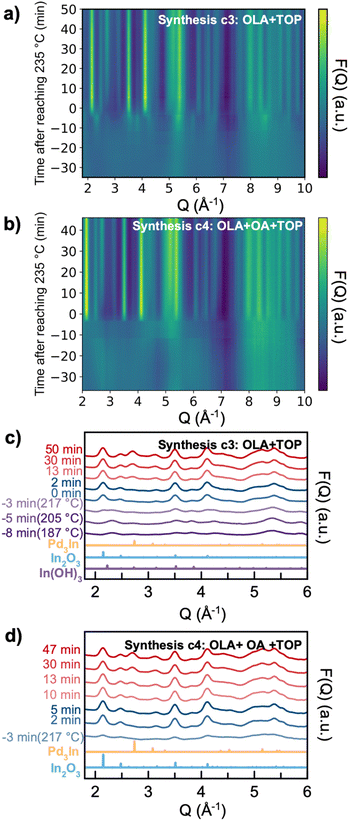
As seen from the F(Q) contour plots in Fig. 5a and b, we observe three different stages during the formation of PdIn NPs in both synthesis c1 and c2. In the first stage, before the reaction temperature has been reached (i.e., before t = 0 min), we do not observe any Bragg peaks, but only very broad scattering features. These are expected to arise from the small precursor–ligand complex structure. When the temperature reaches 235 °C (t = 0 min), rapid crystallization takes place for both syntheses and Bragg peaks agreeing with the Pd3In phase appear (see Fig. 5c and d, showing selected F(Q)s). With continuous heating, a new phase emerges, which from its Bragg peaks can be identified as PdIn. For synthesis c1, peaks from PdIn slowly appear after approximately 90 min with heating at 235 °C. PdIn forms slower in synthesis c2, where the first indication of the intermetallic phase is observed after 185 min at 235 °C.
Fig. 6 shows the real-space representation of the TS data, presented as the reduced Pair Distribution Function (PDF), G(r). G(r) is the Fourier transform of the normalized and corrected scattering data:
The PDF represents a histogram of interatomic distances present in the sample, and is thus an intuitive tool for studying structural changes during the reaction.46 The PDFs of the precursor structures from synthesis c1 and c2 are shown in Fig. S4.† The relatively low concentration of metal precursor in the solution means that the majority of the scattered signal comes from the OLA solvent, which is subtracted before the Fourier transform. This limits the quality and resolution of the PDF from the small precursor complex. However, the data indicate that the precursor PDFs from the two syntheses are similar. The first highlighted peak at ca. 2.1 Å can be assigned to the In–O bond in In(ac)3, while the broad shoulder at 2.0 Å relates to the Pd–N coordination to OLA. The second highlighted peak at ca. 2.5 Å can be assigned to a Pd–Br pair.47 Peaks at higher r-values may originate from distances between Pd or In and C in acetate, however, these are difficult to distinguish from noise.
Fig. 6a and b present the time-resolved PDFs from synthesis c1 and c2, respectively, while selected PDFs are plotted in Fig. 6c and d. Calculated PDFs of the Pd3In and PdIn structures are plotted in Fig. S5.† PDF peaks at 2.8 Å and 4.0 Å can be assigned to the nearest Pd–In and second nearest In–In distances in the Pd3In structure, and peaks at 4.9 Å can be assigned to the third closest Pd–In distance as indicated in Fig. 6e. If considering first synthesis c1, the formation of the PdIn structure results in gradual disappearance of the Pd3In peaks. In the meantime, a shoulder at 3.2 Å slowly shows up, relating to the nearest In–In bond distance in the PdIn structure. The data from synthesis c2 (Fig. 6d) show a similar trend. However, for c2, the peaks related to Pd3In are pronounced until the end of the reaction.
To obtain quantitative information from the data we performed sequential fitting of the PDFs. The PDFs were modelled with the PdIn and Pd3In structure. Due to the very small amount of PdIn in the early stage of the reaction, a single phase Pd3In model was used to fit the data from 0 to 115 min of heating at 235 °C in synthesis c1, and 0 to 190 min for synthesis c2. The parameters obtained from single-phase modelling are plotted in orange, while the parameters obtained from two-phase modelling are plotted in red and blue in Fig. 7. PDF fits of the last frame in each experiment and Rwp values of the sequential refinements can be found in Fig. S6, S7 and Table S2.† For the total scattering data, we were able to describe the Pd3In signal with a single phase, as the RA-PDF setup used limits the Q-resolution in the data, making it difficult to distinguish Bragg peaks from materials with similar lattice parameters.
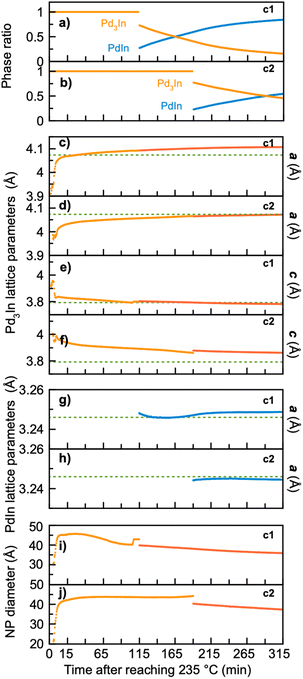 | ||
| Fig. 7 Results from sequential PDF refinement showing the temporal evolution in (a) and (b) phase ratio, (c)–(f) Pd3In lattice parameters a and c, (g) and (h) PdIn lattice parameters, (i) and (j) NP diameter of Pd3In during the experiment. Parameters from synthesis c1 are shown in (a), (c), (e) and (g) while (b), (d), (f) and (h) present parameters from synthesis c2. In (c)–(h) the data in red are from Pd3In single-phase modelling, while the data in orange and blue are from two-phase modelling. In (c)–(f) the green dashed line represents the standard unit cell parameters from Pd3In.13 For both syntheses, the Pd3In single-phase modelling starts from 15 min after reaching 235 °C due to continued presence of the precursor cluster. | ||
For both syntheses, the refined phase fractions (Fig. 7a and b) show that the amount of PdIn increases at the expense of Pd3In. The refinements show that the final product in synthesis c1 consists of 84% PdIn and 16% Pd3In. For synthesis c2 the final product contains 54% PdIn and 46% Pd3In. The only difference between the two synthesis approaches is the addition of OA in synthesis c2, which indicates that the transformation rate is influenced by the local chemistry affected by the surfactant used.48 However, OA does not prevent the transformation process to occur, and it is reasonable to assume that if the reaction time has been prolonged, the Pd3In phase would fully convert to PdIn in both syntheses.
Fig. 7c–f show the refined lattice parameters for Pd3In and PdIn during the reaction. The in situ data show a clear change in the Pd3In structure as the synthesis takes place. During the reaction, lattice parameter a increases, while lattice parameter c slowly decreases. In has a larger atomic radius than Pd, and the changing parameters and increase in unit cell volume (Fig. S7b†) could thus indicate that more indium incorporates into the Pd3In structure during the reaction. This observation agrees with the ex situ study described above, where the Pd3In signal was best described when using two Pd3In phases with different lattice parameters. The data thus support our hypothesis that nanoparticles with different stoichiometries can take the Pd3In structure. We expect this change in structure to be due to the different reduction rates of Pd and In. Pd exhibit a much higher reduction potential compared to In (0.915 V compared to −0.34 V). The Pd rich phase thus forms first, and as more and more In reduce, the NP stoichiometry changes.
Eventually, stoichiometric PdIn eventually appears. The lattice parameters of PdIn from both syntheses (Fig. 7g and h) are stable around the standard values indicated by green dashed lines. To analyse the change from Pd3In to PdIn further, we consider the refined crystallite diameter of Pd3In in Fig. 7i and j. For both syntheses, the Pd3In phase forms as NPs of ca. 2–3 nm followed by rapid growth to ca. 4 nm. A small decrease in size is seen as the PdIn particles form. The PdIn particle size is not shown here, as the size refines to larger values than can be robustly and reliably quantified from PDF analysis. This agrees well with the TEM analysis described above, showing PdIn sizes in the range from 20–40 nm. The large differences in particle size between Pd3In and PdIn speaks against the stoichiometry changing gradually all the way from Pd3In and PdIn within the individual nanoparticles. The reaction does thus not take place through the conventional Bain transformation, which we have previously observed for PdCu.17 Instead, the PdIn particles may form either through dissolution-precipitation of the Pd3In-structured nanoparticles, or through rapid growth from several Pd3In-structured nanoparticles when enough reduced Pd and In is available in the synthesis. Further characterization using e.g. HR-TEM and STEM-EDX would be required to fully address the nanostructural changes taking place during PdIn growth.
Insights into formation pathways of Pd3In NPs from TOP-derived synthesis
We next investigate the reaction pathway for syntheses c3 (with OLA + TOP) and c4 (with OLA + OA + TOP). From the ex situ studies presented above, we learned that the products for both syntheses are Pd3In and In2O3. In situ TS data of syntheses c3 and c4 are shown in Fig. 8. Here, we again set the time relative to the time reached the reaction temperature 235 °C (i.e., t = 0 minutes) and show the data as the reduced structure function F(Q). We first consider synthesis c3 (Fig. 8a). From the beginning of the reaction until 10 minutes before reaching the reaction temperature (t = −10 minutes), we see no sharp Bragg peaks, showing that the precursor mixture has no long-range order. In the time from −10 to −3 min, a crystalline intermediate phase appears, which we identify as In(OH)3 as shown in Fig. 8c. Upon heating, the In(OH)3 phase disappears, as it transforms to In2O3. A similar reaction pathway has been reported by Nielsen et al.49 in a solvothermal synthesis. Soon after the temperature has reached 235 °C, we observe formation of Pd3In NPs, whose Bragg peaks increase in intensity along with the In2O3 phase. In synthesis c4 (Fig. 8b), Bragg peaks do not appear until −3 min. Differently from synthesis c3, we do not observe In(OH)3; instead, In2O3 appears to nucleate directly from solution, at least within the time resolution available here. The In2O3 phase appears at −3 min, and is followed by Pd3In at t = 5 min.PDFs from precursor solutions are shown in Fig. S8,† where the highlighted peak at ca. 2.4 Å shown may be assigned to a Pd–Br pair from the initial precursor.47 The precursor PDFs from syntheses c3 and c4 are quite different from the ones from syntheses c1 and c2 (Fig. S4†), indicating that with TOP included in the synthesis, the initial precursor complex structures are different. However, the low quality of the precursor PDF prevents further analysis of the precursor complex here.
Quantitative analysis of the sequential data was again performed through PDF modelling. The resulting parameters from the refinement are shown in Fig. 9, while PDF fits of the last frame and the Rwp values from sequential refinements are shown in Fig. S9, S10 and Table S3.† For both syntheses, a model with In2O3 and a single Pd3In phase was used to describe the data. As seen in Fig. 9a and b, both syntheses result in ca. 90 wt% Pd3In and 10 w% In2O3. This may explain why PdIn does not form, as there is not sufficient surplus of free indium to form the stoichiometric phase in the later stage of the reaction. Fig. 9c–f show the refined Pd3In lattice parameters. The refinements again show that lattice parameter a increases, while lattice parameter c slowly decreases. The a parameter reaches the value expected for bulk Pd3In (indicated by the green dashed lines in the figure) and remains stable for the rest of the reaction. However, the c parameter value does not reach the bulk value of 3.79 Å, but stays at ca. 3.91 Å. We also notice that for both syntheses, the starting value of Pd3In lattice parameters, a and c, are the same, indicating that the initial Pd3In unit cell is initially pseudo-cubic and possibly Pd rich.
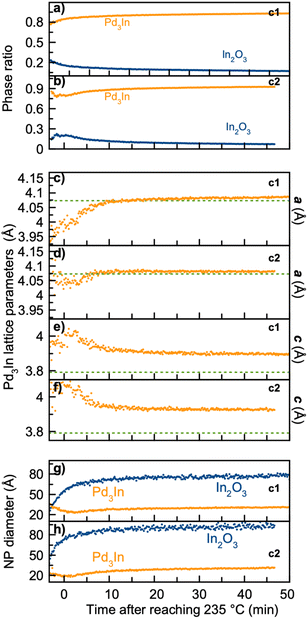 | ||
| Fig. 9 Results from sequential PDF refinements showing the temporal evolution in (a) and (b) scale factor, (c)–(f) Pd3In unit cell parameters a and c, (g) and (h) NP diameter of Pd3In and In2O3 during the experiment. Parameters from synthesis c3 are shown in (a), (c), (e) and (g) while (b), (d), (f) and (h) present parameters from synthesis c4. Parameters related to Pd3In are shown in orange, and parameters from In2O3 are shown in blue. In (c)–(f) the green dashed line represents the standard unit cell parameters from Pd3In structure.13 | ||
The refined NPs sizes are shown in Fig. 9g and h. For both syntheses, the NP diameter of the Pd3In phase is stable with a diameter of ca. 3 nm. For the In2O3 phase, the diameter is much larger, and refines to ca. 8 nm in synthesis c3 and 9 nm in synthesis c4.
Conclusion
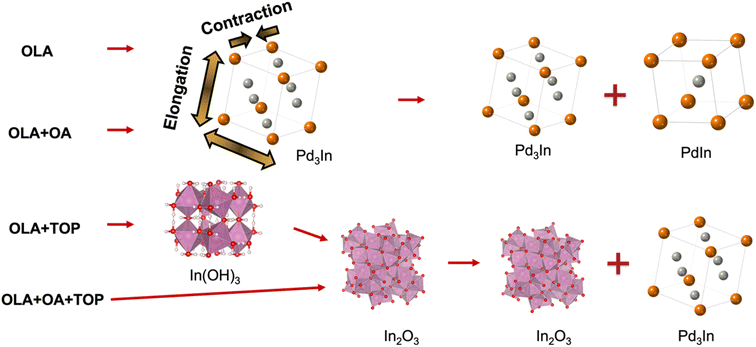
In summary, we have demonstrated how to control the formation of intermetallic PdIn by using selected surfactants, OA and TOP. Through synthesis parameter studies and in situ X-ray TS and PDF analysis, new insights into the formation of PdIn are provided and more intermediate structures are revealed. The results are summarized in Fig. 10. We first found that the choice of anion in the metal precursor is essential, and PdIn was only obtained when using indium acetate and palladium bromide in the synthesis. For both syntheses c1 and c2, we observe initial formation of a Pd-rich Pd3In phase, which is then transformed into PdIn with the CsCl structure. We expect that the phase transformation happens when sufficient In has reduced to form the stoichiometric phase, and our data indicate that Pd3In-structured nanoparticles with different compositions appear in the reaction. In situ studies show that OA slows down the reaction. With the addition of TOP in the synthesis (synthesis c3 and c4), In2O3 forms initially, followed by Pd3In. This may be related to the strong coordination between TOP and Pd(II). The In2O3 phase is stable also at the reaction temperature,50 and the lack of In in the solution hinders the formation of the stoichiometric PdIn phase. Our studies have focused on the evolution of atomic structure and has provided insight into how nanoparticles with different crystal structures can form. However, questions remain on the evolution of nanoscale structure during synthesis, and further studies are needed to resolve these.Author contributions
BW, JKM and KMØJ conceptualized the project. BW performed the material synthesis with guidance from JKM. AK performed Rietveld refinements. NS performed TEM analysis. BW, ASA, FLJ, AK, OAF and TMN collected synchrotron data. ETSK and ASA assisted BW in treatment of synchrotron data. MST and RKJ collected UV-vis spectroscopy data. MA and KMØJ supervised the project.Conflicts of interest
There are no conflicts to declare.Acknowledgements
We are grateful for funding from the Villum Foundation through a Villum Young Investigator Grant (VKR00015416). Funding from the Danish Ministry of Higher Education and Science through the SMART Lighthouse is gratefully acknowledged. We acknowledge support from the Danish National Research Foundation Center for High Entropy Alloy Catalysis (DNRF 149). M. A. received funding from the Swiss National Science Foundation (SNSF) via the project no. 200021 184742. The Danish Research Council is acknowledged for covering travel expenses in relation to the synchrotron experiment (DanScatt). We acknowledge DESY (Hamburg, Germany), a member of the Helmholtz Association HGF, for the provision of experimental facilities. Parts of this research were carried out at beamline P21.1 and we would like to thank Soham Banerjee and Ann-Christin Dippel for assistance in using the beamline. Beamtime was allocated for proposal I-20210946 EC.References
- M. Sankar, N. Dimitratos, P. J. Miedziak, P. P. Wells, C. J. Kiely and G. J. Hutchings, Designing bimetallic catalysts for a green and sustainable future, Chem. Soc. Rev., 2012, 41(24), 8099–8139 RSC.
- L. Zhang, Z. Xie and J. Gong, Shape-controlled synthesis of Au–Pd bimetallic nanocrystals for catalytic applications, Chem. Soc. Rev., 2016, 45(14), 3916–3934 RSC.
- M. Cui, G. Johnson, Z. Zhang, S. Li, S. Hwang, X. Zhang and S. Zhang, AgPd nanoparticles for electrocatalytic CO2 reduction: bimetallic composition-dependent ligand and ensemble effects, Nanoscale, 2020, 12(26), 14068–14075 RSC.
- W. Du, K. E. Mackenzie, D. F. Milano, N. A. Deskins, D. Su and X. Teng, Palladium–tin alloyed catalysts for the ethanol oxidation reaction in an alkaline medium, ACS Catal., 2012, 2(2), 287–297 CrossRef CAS.
- Z. Wu, E. C. Wegener, H.-T. Tseng, J. R. Gallagher, J. W. Harris, R. E. Diaz, Y. Ren, F. H. Ribeiro and J. T. Miller, Pd–In intermetallic alloy nanoparticles: highly selective ethane dehydrogenation catalysts, Catal. Sci. Technol., 2016, 6(18), 6965–6976 RSC.
- D. Pavesi, F. Dattila, R. C. Van de Poll, D. Anastasiadou, R. García-Muelas, M. Figueiredo, G.-J. M. Gruter, N. López, M. T. Koper and K. J. P. Schouten, Modulation of the selectivity of CO2 to CO electroreduction in palladium rich palladium-indium nanoparticles, J. Catal., 2021, 402, 229–237 CrossRef CAS.
- Y. Yan, J. S. Du, K. D. Gilroy, D. Yang, Y. Xia and H. Zhang, Intermetallic nanocrystals: syntheses and catalytic applications, Adv. Mater., 2017, 29(14), 1605997 CrossRef PubMed.
- M. Armbrüster, Intermetallic compounds in catalysis–a versatile class of materials meets interesting challenges, Sci. Technol. Adv. Mater., 2020, 21(1), 303–322 CrossRef.
- E. Casado-Rivera, D. J. Volpe, L. Alden, C. Lind, C. Downie, T. Vázquez-Alvarez, A. C. Angelo, F. J. DiSalvo and H. D. Abruña, Electrocatalytic activity of ordered intermetallic phases for fuel cell applications, J. Am. Chem. Soc., 2004, 126(12), 4043–4049 CrossRef CAS PubMed.
- Z. Cui, H. Chen, M. Zhao and F. J. DiSalvo, High-performance Pd3Pb intermetallic catalyst for electrochemical oxygen reduction, Nano Lett., 2016, 16(4), 2560–2566 CrossRef CAS PubMed.
- H. Okamoto, In-Pd (indium-palladium), J. Phase Equilib., 2003, 24(5), 481 CrossRef CAS.
- H. Kohlmann and C. Ritter, Refinement of the Crystal Structures of Palladium-rich In-Pd Compounds by X-Ray and Neutron Powder Diffraction, Zeitschrift für Naturforschung B, 2007, 62(7), 929–934 CrossRef CAS.
- I. Harris, M. Norman and A. Bryant, A study of some palladium-indium, platinum-indium and platinum-tin alloys, J. Less-Common Met., 1968, 16(4), 427–440 CrossRef CAS.
- H. Kohlmann and C. Ritter, Reaction Pathways in the Formation of Intermetallic InPd3 Polymorphs, Z. Anorg. Allg. Chem., 2009, 635(11), 1573–1579 CrossRef CAS.
- D. Pavesi, F. S. Ali, D. Anastasiadou, T. Kallio, M. Figueiredo, G.-J. M. Gruter, M. T. Koper and K. J. P. Schouten, CO2 electroreduction on bimetallic Pd–In nanoparticles, Catal. Sci. Technol., 2020, 10(13), 4264–4270 RSC.
- Q. Feng, S. Zhao, Y. Wang, J. Dong, W. Chen, D. He, D. Wang, J. Yang, Y. Zhu and H. Zhu, Isolated single-atom Pd sites in intermetallic nanostructures: high catalytic selectivity for semihydrogenation of alkynes, J. Am. Chem. Soc., 2017, 139(21), 7294–7301 CrossRef CAS PubMed.
- J. K. Mathiesen, E. D. Bøjesen, J. K. Pedersen, E. T. Kjær, M. Juelsholt, S. Cooper, J. Quinson, A. S. Anker, G. Cutts and D. S. Keeble, Breaking with the Principles of Coreduction to Form Stoichiometric Intermetallic PdCu Nanoparticles, Small Methods, 2022, 2200420 CrossRef CAS.
- C. Y. Wang, D. P. Chen, X. H. Sang, R. R. Unocic and S. E. Skrabalak, Size-Dependent Disorder-Order Transformation in the Synthesis of Monodisperse Intermetallic PdCu Nanocatalysts, ACS Nano, 2016, 10(6), 6345–6353 CrossRef CAS PubMed.
- K. M. Ø. Jensen, C. Tyrsted, M. Bremholm and B. B. Iversen, In Situ Studies of Solvothermal Synthesis of Energy Materials, ChemSusChem, 2014, 7(6), 1594–1611 CrossRef CAS PubMed.
- Y. Sun and Y. Ren, In situ synchrotron X-ray techniques for real-time probing of colloidal nanoparticle synthesis, Part. Part. Syst. Charact., 2013, 30(5), 399–419 CrossRef CAS.
- S. Wu, M. Li and Y. Sun, In Situ Synchrotron X-ray Characterization Shining Light on the Nucleation and Growth Kinetics of Colloidal Nanoparticles, Angew. Chem., Int. Ed., 2019, 58(27), 8987–8995 CrossRef CAS PubMed.
- K. Bakken, O. G. Grendal and M.-A. Einarsrud, In situ characterisation for studying nucleation and growth of nanostructured materials and thin films during liquid-based synthesis, J. Sol-Gel Sci. Technol., 2023, 105(2), 596–605 CrossRef CAS.
- A. Coelho, TOPAS and TOPAS-Academic: an optimization program integrating computer algebra and crystallographic objects written in C++, J. Appl. Crystallogr., 2018, 51(1), 210–218 CrossRef CAS.
- A. Hammersley, FIT2D: a multi-purpose data reduction, analysis and visualization program, J. Appl. Crystallogr., 2016, 49(2), 646–652 CrossRef CAS.
- C. Prescher and V. B. Prakapenka, DIOPTAS: a program for reduction of two-dimensional X-ray diffraction data and data exploration, High Pressure Res., 2015, 35(3), 223–230 CrossRef CAS.
- X. Yang, P. Juhas, C. L. Farrow and S. J. Billinge, xPDFsuite: an end-to-end software solution for high throughput pair distribution function transformation, visualization and analysis, arXiv, 2014, preprint arXiv:14023163.
- C. L. Farrow, P. Juhas, J. W. Liu, D. Bryndin, E. S. Bozin, J. Bloch, T. Proffen and S. J. Billinge, PDFfit2 and PDFgui: computer programs for studying nanostructure in crystals, J. Phys.: Condens. Matter, 2007, 19(33), 335219 CrossRef CAS PubMed.
- A. L. Wang, L. Zhu, Q. Yun, S. Han, L. Zeng, W. Cao, X. Meng, J. Xia and Q. Lu, Bromide Ions Triggered Synthesis of Noble Metal-Based Intermetallic Nanocrystals, Small, 2020, 16(40), 2003782 CrossRef CAS PubMed.
- Y. Zheng, J. Zeng, A. Ruditskiy, M. Liu and Y. Xia, Oxidative etching and its role in manipulating the nucleation and growth of noble-metal nanocrystals, Chem. Mater., 2014, 26(1), 22–33 CrossRef CAS.
- A. M. Pourrahimi, D. Liu, L. K. Pallon, R. L. Andersson, A. M. Abad, J.-M. Lagarón, M. S. Hedenqvist, V. Ström, U. W. Gedde and R. T. Olsson, Water-based synthesis and cleaning methods for high purity ZnO nanoparticles–comparing acetate, chloride, sulphate and nitrate zinc salt precursors, RSC Adv., 2014, 4(67), 35568–35577 RSC.
- R. K. Sodhi and S. Paul, An overview of metal acetylacetonates: developing areas/routes to new materials and applications in organic syntheses, Catal. Surv. Asia, 2018, 22(1), 31–62 CrossRef CAS.
- C. Wang, D. P. Chen, X. Sang, R. R. Unocic and S. E. Skrabalak, Size-dependent disorder–order transformation in the synthesis of monodisperse intermetallic PdCu nanocatalysts, ACS Nano, 2016, 10(6), 6345–6353 CrossRef CAS.
- Y. Xia, Y. Xiong, B. Lim and S. E. Skrabalak, Shape-controlled synthesis of metal nanocrystals: simple chemistry meets complex physics?, Angew. Chem., Int. Ed., 2009, 48(1), 60–103 CrossRef CAS PubMed.
- D. Zherebetskyy, M. Scheele, Y. Zhang, N. Bronstein, C. Thompson, D. Britt, M. Salmeron, P. Alivisatos and L.-W. Wang, Hydroxylation of the surface of PbS nanocrystals passivated with oleic acid, Science, 2014, 344(6190), 1380–1384 CrossRef CAS PubMed.
- M. Xie, Z. Lyu, R. Chen and Y. Xia, A Mechanistic Study of the Multiple Roles of Oleic Acid in the Oil-Phase Synthesis of Pt Nanocrystals, Chem.–Eur. J., 2020, 26(67), 15636–15642 CrossRef CAS PubMed.
- J. Park, K. An, Y. Hwang, J.-G. Park, H.-J. Noh, J.-Y. Kim, J.-H. Park, N.-M. Hwang and T. Hyeon, Ultra-large-scale syntheses of monodisperse nanocrystals, Nat. Mater., 2004, 3(12), 891–895 CrossRef CAS PubMed.
- J. Li, F. Li, S.-X. Guo, J. Zhang and J. Ma, PdCu@Pd nanocube with Pt-like activity for hydrogen evolution reaction, ACS Appl. Mater. Interfaces, 2017, 9(9), 8151–8160 CrossRef CAS.
- W. Zhao, L. Yang, Y. Yin and M. Jin, Thermodynamic controlled synthesis of intermetallic Au3Cu alloy nanocrystals from Cu microparticles, J. Mater. Chem. A, 2014, 2(4), 902–906 RSC.
- S. L. Bueno, X. Zhan, J. Wolfe, K. Chatterjee and S. E. Skrabalak, Phase-Controlled Synthesis of Pd–Sn Nanocrystal Catalysts of Defined Size and Shape, ACS Appl. Mater. Interfaces, 2021, 13(44), 51876–51885 CrossRef CAS PubMed.
- N. Ortiz and S. E. Skrabalak, Manipulating local ligand environments for the controlled nucleation of metal nanoparticles and their assembly into nanodendrites, Angew. Chem., Int. Ed., 2012, 124(47), 11927–11931 CrossRef.
- Z. Yang and K. J. Klabunde, Synthesis of nearly monodisperse palladium (Pd) nanoparticles by using oleylamine and trioctylphosphine mixed ligands, J. Organomet. Chem., 2009, 694(7–8), 1016–1021 CrossRef CAS.
- Y. Liu, C. Wang, Y. Wei, L. Zhu, D. Li, J. S. Jiang, N. M. Markovic, V. R. Stamenkovic and S. Sun, Surfactant-induced postsynthetic modulation of Pd nanoparticle crystallinity, Nano Lett., 2011, 11(4), 1614–1617 CrossRef CAS PubMed.
- S. I. Al-Resayes, Isothermal decomposition of γ-irradiated indium acetate, J. Saudi Chem. Soc., 2009, 13(3), 243–246 CrossRef CAS.
- Q. Gao, Y. M. Ju, D. An, M. R. Gao, C. H. Cui, J. W. Liu, H. P. Cong and S. H. Yu, Shape-Controlled Synthesis of Monodisperse PdCu Nanocubes and Their Electrocatalytic Properties, ChemSusChem, 2013, 6(10), 1878–1882 CrossRef CAS PubMed.
- T. Egami and S. J. L. Billinge, Underneath the Bragg peaks, Pergamon, Oxford, 1 edn, 2003, vol. 16, pp. 1–404 Search PubMed.
- T. L. Christiansen, S. R. Cooper and K. M. Jensen, There's no place like real-space: elucidating size-dependent atomic structure of nanomaterials using pair distribution function analysis, Nanoscale Adv., 2020, 2(6), 2234–2254 RSC.
- A. A. Wells, The crystal structure of certain bridged palladium compounds, Proc. R. Soc. London, Ser. A, 1938, 167(929), 169–189 CAS.
- E. Bøjesen and B. Iversen, The chemistry of nucleation, CrystEngComm, 2016, 18(43), 8332–8353 RSC.
- I. G. Nielsen, S. Sommer and B. B. Iversen, Phase control for indium oxide nanoparticles, Nanoscale, 2021, 13(7), 4038–4050 RSC.
- G. Korotcenkov, V. Brinzari, M. Ivanov, A. Cerneavschi, J. Rodriguez, A. Cirera, A. Cornet and J. Morante, Structural stability of indium oxide films deposited by spray pyrolysis during thermal annealing, Thin Solid Films, 2005, 479(1–2), 38–51 CrossRef CAS.
Footnote |
| † Electronic supplementary information (ESI) available. See DOI: https://doi.org/10.1039/d3na00582h |
| This journal is © The Royal Society of Chemistry 2023 |

![[3 with combining macron]](https://www.rsc.org/images/entities/char_0033_0304.gif)
