
 Open Access Article
 This Open Access Article is licensed under a Creative Commons Attribution-Non Commercial 3.0 Unported Licence
Green AOT reverse micelles as nanoreactors for alkaline phosphatase. The hydrogen bond “dances” between water and the enzyme, the reaction product, and the reverse micelles interface†
Gustavo A. Monti *ab,
R. Darío Falconea,
Fernando Moyano*a and
N. Mariano Correaa
*ab,
R. Darío Falconea,
Fernando Moyano*a and
N. Mariano Correaa
aInstituto para el Desarrollo Agroindustrial y de la Salud (IDAS, CONICET-UNRC), Departamento de Química, Universidad Nacional de Río Cuarto, Río Cuarto, Argentina. E-mail: gmonti@exa.unrc.edu.ar; fmoyano@exa.unrc.edu.ar
bInstituto de Investigaciones en Tecnologías Energéticas y Materiales Avanzados (IITEMA, CONICET-UNRC), Departamento de Tecnología Química, Universidad Nacional de Río Cuarto, Río Cuarto, Argentina
First published on 4th January 2023
Abstract
In this work, we present an investigation of the influence of water encapsulated in 1,4-bis-2-ethylhexylsulfosuccinate/methyl laurate and 1,4-bis-2-ethylhexylsulfosuccinate/isopropyl myristate reverse micelles on the enzymatic hydrolysis of 1-naphthyl phosphate by alkaline phosphatase. Our results show that the enzyme is active in the biocompatible reverse micelles studied and that the Michaelis–Menten kinetic model is valid in all systems. We found that both micellar systems studied have a particular behavior toward pH and that the penetration of external solvents into the interfaces is crucial to understanding the effect. Methyl laurate does not disrupt the interface and is not necessary to control the pH value since alkaline phosphatase in the center of the micelles is always solvated similarly. In contrast, isopropyl myristate disrupts the interfaces so that the water and 1-naphthol molecules cannot form hydrogen bond interactions with the polar head of the surfactant. Then, when the water is at pH = 7, the 1-naphthol moves away to the interfaces inhibiting alkaline phosphatase which is not observable when the water is at pH = 10. Our study shows that the concept of pH cannot be used directly in a confined environment. In addition, our research is of great importance in the field of reactions that occur in reverse micelles, catalyzed by enzymes.
Introduction
Many biological phenomena occur at interfaces and not in homogeneous solutions.1,2 In this sense, reverse micelles (RMs) are a simplified model to study membrane-protein interactions.3 The large interfacial region of these systems can enhance some effects, such as hydrogen bond interactions between peptide bonds because in these media the amphipathic essence of a biological membrane is preserved.4,5 RMs are supramolecular assemblies made up of surfactant molecules dissolved in non-polar solvents.6 One of the most widely used anionic surfactants that can encapsulate water and form RMs is sodium 1,4-bis-2-ethylhexyl sulfosuccinate (AOT, Scheme 1a).7 The water content that can be solubilized inside RMs is defined by W0 = [water]/[AOT] and its maximum value may depend on the surfactant polar head, the non-polar organic solvent, and temperature, among others.8 Regarding the nature of the confined water, it is known that the main changes in the water structure occur at W0 < 10, due to the interaction with the polar head of the surfactant.9 In RMs, the polar heads of the surfactants are oriented towards the interior of the supramolecular structure, while the hydrocarbon tails extend towards the non-polar organic solvent.10 At least three regions can be established in RMs: an internal aqueous region, known as the “polar nucleus or aqueous pool”; the micellar interface, and the external organic phase.11 The aqueous pool is useful for a wide variety of applications, such as polymer12 synthesis, nanoparticle13 synthesis, and chemical reaction;8 even for modeling the behaviour of water molecules in a confined cellular environment, as the properties of the water are affected when restricted to the nanoscopic scale.14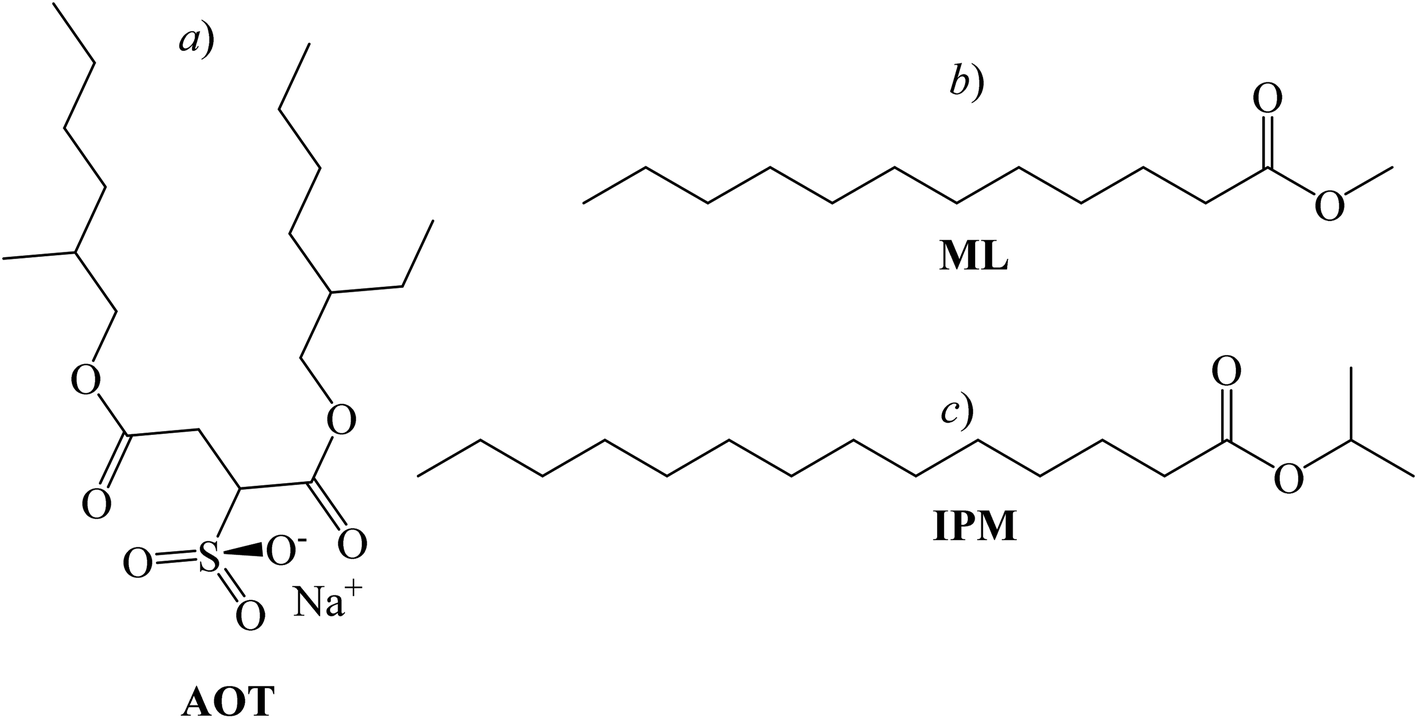 | ||
| Scheme 1 Chemical structure of the surfactant sodium 1,4-bis-2-ethylhexylsulfosuccinate (AOT, a), biocompatible solvents methyl laurate (ML, b) and isopropyl myristate (IPM, c), respectively. | ||
Most of the traditional non-polar solvents used in RMs preparation are toxic and can cause environmental problems. An ecological alternative is to use biocompatible solvents.15 In this regard, lipophilic esters such as methyl laurate (ML, Scheme 1b) and isopropyl myristate (IPM, Scheme 1c) have been widely used in biological model systems, pharmaceutics, and drug delivery.11,16
RMs formed in biocompatible organic solvents are effective and harmless nanoreactors with potential use in enzymatic catalysis since they allow the solubilization of hydrophilic biological molecules such as enzymes.17–19 Many studies of enzyme kinetics inside RMS formed with traditional non-polar solvents have been reported.8,20–23 One of the enzymes that have been studied is the alkaline phosphatase (AP), which is a hydrophilic and globular protein that will reside exclusively in the aqueous pool of the RMs.24–26 The AP activity is mainly to act as a catalyzer for biological dephosphorylation and becomes optimally active in alkaline environments (pH values between 8 and 11).27,28 Specifically, AP is a hydrolase enzyme responsible for removing phosphate groups from various types of molecules, such as nucleotides, proteins, and other phosphorylated compounds.29–32
Enzymatic activity of AP in AOT RMs formed with conventional organic solvents (aliphatic and aromatic) has been reported.33–36 The effects of water content, temperature, external solvent, and surfactant concentration on enzyme activity were evaluated.37 However, even though the pH value is one of the most relevant parameters for this enzyme, it has not been studied in detail in micellar systems formed by biocompatible solvents. It is important to evaluate whether the enzyme is sensitive to the pH value inside the RMs, since the kinetic properties of AP in the RMs such as the initial velocity of the reaction and catalytic efficiency, could depend on the structural properties of the ions (OH− or H3O+) in confined media.
In this work, we have investigated the influence of AOT RMs systems formed by two different non-toxic solvents, IPM and ML, in the hydrolysis of 1-naphthyl phosphate (1-NP) catalyzed by AP (see Scheme 2). In both RMs, we have determined the influence of the variation of the external solvent, the surfactant concentration, and the variation of the W0 and the pH. The hydrolysis rates of 1-NP were established by absorption spectroscopy and the kinetic parameters were determined by the Michaelis–Menten model, which explains the experimental data in the RM systems.
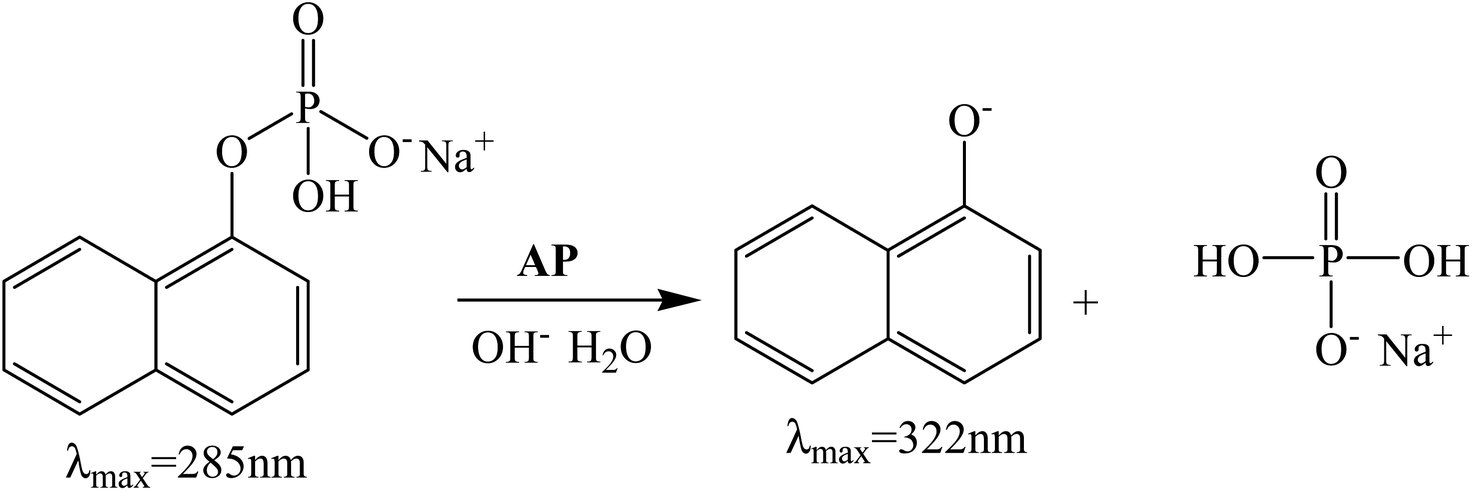 | ||
| Scheme 2 Enzymatic hydrolysis of 1-NP in basic media by using AP. | ||
Results and discussion
Catalysis in buffer
Although the 1-NP enzymatic hydrolysis by AP was previously reported37 we have tested if in our experimental conditions the reaction proceeds in a similar manner. The kinetic was followed by UV-vis spectroscopy. Fig. 1 shows typical absorption spectra for the 1-NP hydrolysis at different times in a buffer solution of pH = 10. As can be seen, the absorbance value of the band at λmax = 332 nm increases evidencing the formation of the product (1-naphtholate), while the band at λmax = 285 nm, which corresponds to 1-NP disappears with time (insert Fig. 1). Furthermore, a clear isosbestic point at λ = 300 nm is observed indicating the absence of detectable intermediate and/or decomposition of the product.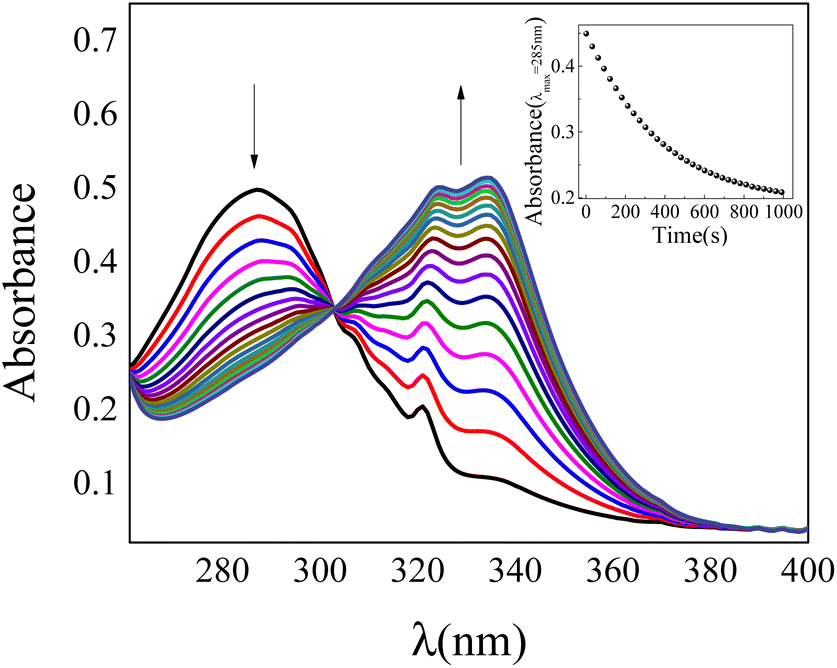 | ||
| Fig. 1 UV-vis spectra for hydrolysis of 1-NP catalyzed by AP in Na2CO3/NaHCO3 buffer solution at 35 °C. pH = 10. Inset: absorbance values (λmax = 285 nm) of 1-NP in buffer at different times. [1-NP] = 7.5 × 10⁻⁵ M. [AP] = 1 × 10⁻⁷ M. | ||
Fig. 2 shows the effect of 1-NP concentration on the initial rate of reaction (v0). The best model found that explains the experimental data obtained at different concentrations of 1-NP is the Michaelis–Menten, described in the ESI.† The catalytic rate constant (kcat) and the Michaelis constant (KM) values were determined by fitting the experimental data to eqn (1).
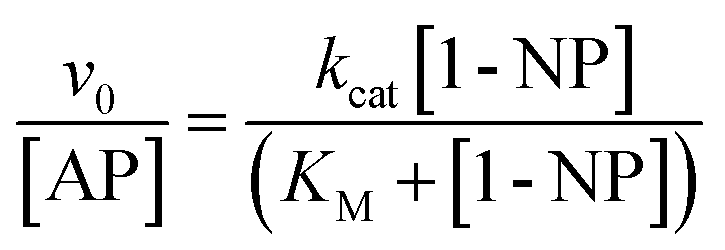 | (1) |
 | ||
| Fig. 2 Effect of 1-NP concentration on the initial reaction rate (ν0) of 1-NP hydrolysis catalyzed by AP at pH = 10. T = 35 °C. [AP] = 1.0 × 10⁻⁷ M. [1-NP]: 1.0 × 10⁻⁵ M, 2.3 × 10⁻⁵ M, 6.7 × 10⁻⁵ M, 1.0 × 10⁻⁴ M, 1.5 × 10⁻⁴ M, 2.0 × 10⁻⁴ M, 3.0 × 10⁻⁴ M. The experimental data were fitted according to the eqn (1), (—) solid lines. | ||
The kcat and KM values found are 7.43 ± 0.03 s−1 and (34.44 ± 0.05) × 10−5 M, respectively. The catalytic efficiency (kcat/KM) determined for the enzyme is 2.15 × 10⁴ M−1 s−1. These values are well-matched with those reported in the literature38,39 and make us confident that, in our experimental conditions the reaction follows the same model.
Catalysis in ML/AOT/water and IPM/AOT/water RMs
Before studying the enzymatic reaction in AOT RMs media, the stability of AP was tested by emission spectroscopy in both systems: ML/AOT/water and IPM/AOT/water RMs at pH = 10. The AP emission spectrum was performed at λexc = 280 nm in buffer, in presence of urea, and both micellar systems with W0 = 10 at pH = 10 (Fig. S1†).
It is also important to note that the fast dynamics of the process ensures that the AP and substrates are homogeneously distributed in the RMs. Thus, the speed of the enzymatic reaction is not altered by the exchange of material between micelles.42,43
In homogeneous media at pH = 10, the emission spectrum of the enzyme has a band that peaks around λemi = 339 nm. However, when the enzyme is dissolved in an 8 M urea solution, where AP is completely denatured, the maximum emission band peaks at λemi = 355 nm. When the enzyme is dissolved in the different RMs media, it can be seen that the AP emission band shows fine structure; probably due to the confinement effect on the freedom degree of the enzyme. In addition, the emission band in both RMs systems does not show a bathochromic shift and is centered around 339 nm. These facts suggest that the AP encapsulated in both AOT RMs is not denatured and, preserves the activity.44 A similar result was found using pure water in both RMs systems. Moreover, DLS experiments (not shown) to corroborated that no changes in the RMs sizes are found with and without the presence of the enzyme.45
However, it is worth highlighting that in RMs systems an important effect to be investigated is if the reaction depends, or not, on the pH control by buffer as it is mandatory in bulk solution. We have demonstrated that there is a proton gradient from the center of RMs toward the interface leaving the interior neutral46 and, the water molecules entrapped inside the AOT RM systems show its electron donor ability enhanced in comparison with its water bulk structure.20,47 Water plays a central role in the solvation of the enzyme, improving or decreasing the catalytic efficiency and, we will show how the water structure upon confinement affects the enzymatic reaction. Fig. 3a and b show the effect of the 1-NP concentration on the initial reaction rate for the hydrolysis reaction in RMs systems at different W0 values. The kcat and KM values were determined by fitting the experimental data to eqn (1) for each system. Tables 1 and 2 summarize the kinetic parameters determined for the ML/AOT/water and IPM/AOT/water RMs, respectively.
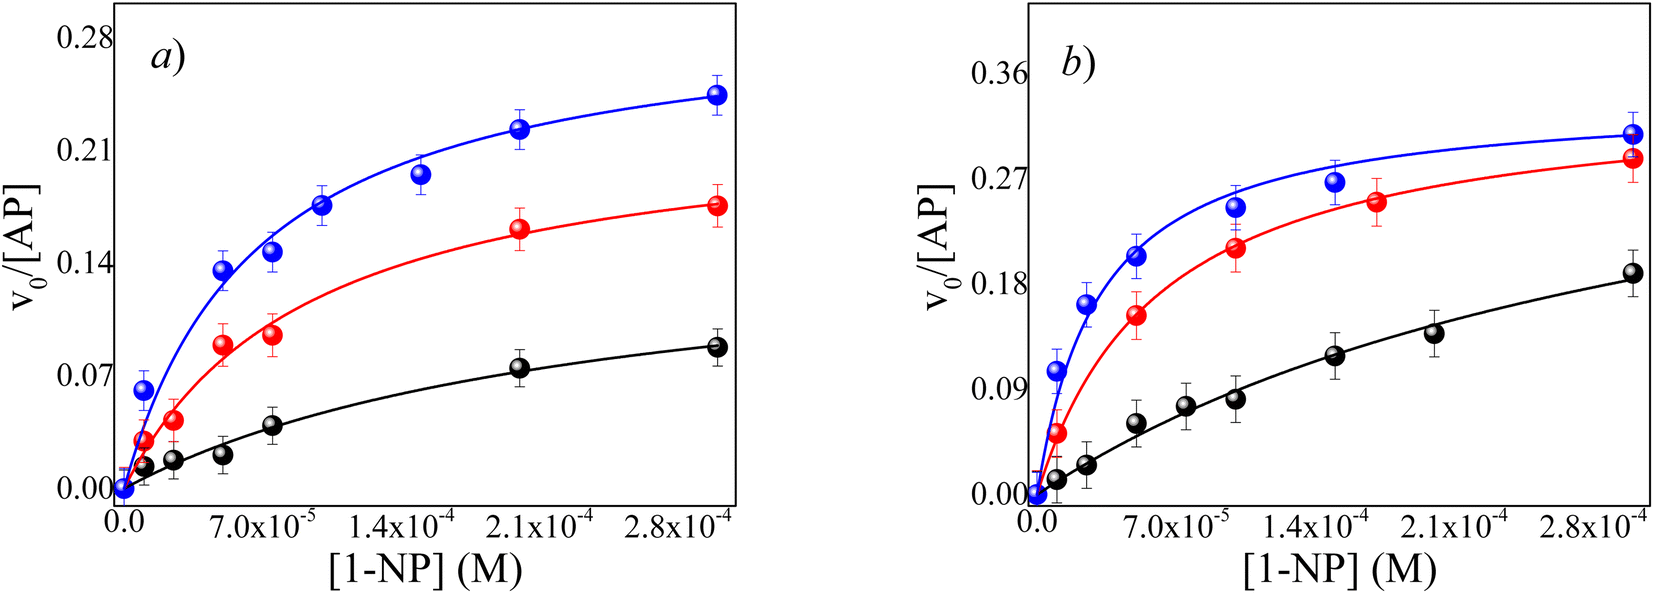 | ||
Fig. 3 Effect of 1-NP concentration on the v0 values for the hydrolysis reaction catalyzed by AP in RMs at different W0, pH = 10 and, T = 35 °C. (●) W0 = 2, ( ) W0 = 6 and, ( ) W0 = 6 and, ( ) W0 = 10. [AOT] = 0.1 M. [AP] = 1 × 10⁻⁷ M. (a) ML/AOT/water RMs (b) IPM/AOT/water RMs. ) W0 = 10. [AOT] = 0.1 M. [AP] = 1 × 10⁻⁷ M. (a) ML/AOT/water RMs (b) IPM/AOT/water RMs. | ||
| Kinetic parameters | W0 = 2 | W0 = 6 | W0 = 10 |
|---|---|---|---|
| kcat (s−1) | 0.16 ± 0.02 | 0.24 ± 0.02 | 0.28 ± 0.02 |
| KM (M) × 10−5 | 23.49 ± 2.00 | 9.78 ± 0.80 | 5.74 ± 0.70 |
| kcat/KM (M−1 s−1) | 681 ± 20 | 2454 ± 200 | 4878 ± 270 |
| Kinetic parameters | W0 = 2 | W0 = 6 | W0 = 10 |
|---|---|---|---|
| kcat (s−1) | 0.40 ± 0.03 | 0.34 ± 0.02 | 0.31 ± 0.02 |
| KM (M) × 10−5 | 34.95 ± 3.00 | 6.21 ± 0.60 | 2.42 ± 0.20 |
| kcat/KM (M−1 s−1) | 1144 ± 90 | 5555 ± 280 | 12![[thin space (1/6-em)]](https://www.rsc.org/images/entities/char_2009.gif) 810 ± 410 810 ± 410 |
As can be seen in Fig. 3a and b, the v0 increases with the water content inside both RMs (Fig. S3†). Consequently, there is an increase in the kcat/KM values as the buffer content increases. For example, in the ML/AOT/water system at W0 = 2, the value of kcat/KM is 681 M−1 s−1 and it increases by a factor of 7.1 at W0 = 10, while when the buffer content increases from W0 = 2 to W0 = 10 in IPM//AOT/water system the factor is slightly larger, 11.1. These results can be explained by considering the effect that occurs in the encapsulation of enzymes in RMs. The interactions between water and the enzyme, the reaction product, and the reverse micelles interface are transcendent to clarify the result.
It is known47 that the trapped water molecules' structure is different inside AOT RMs and so are their properties. Furthermore, it is known that AOT is very good at accepting H-bond interactions.48,49.In this way, at a low W0 value, all the water molecules interact with the polar head of AOT at the interface by hydrogen bond and, only a few molecules of water could solvate the catalytic region of the enzyme. As the water content increases, there are more free water molecules in the micellar core where there are no interactions with the polar head of AOT. Therefore, at a high W0 value, the AP localized in the center of RMs has the catalytic region better solvated due to major concentrations of free water. In other words, when the water content increases in the RMs systems, the RMs interfaces and the catalytic regions of the enzyme are fully solvated and, consequently, the catalytic efficiencies increase in both systems RMs.
It is necessary to highlight that the catalytic efficiency found in IPM/AOT/water systems compared to the ML/AOT/water systems, at the same W0 is always higher. That is, in the ML/AOT/water system at W0 = 2, W0 = 6, W0 = 10, the kcat/KM values found are 681 M−1 s−1, 2454 M−1 s−1 and, 4878 M−1 s−1, respectively; while in IPM//AOT/water systems the values found are 1144 M−1 s−1, 5555 M−1 s−1 and, 12810 M−1 s−1 at the same W0 value (see Tables 1 and 2).
These results could be explained considering the chemical structure of the external solvents and the penetration to the RMs interfaces. Previous studies have shown an interesting comparison of water properties inside AOT RMs formed in two biocompatible solvents: ML and IPM.11,50 The droplet size values, the maximum amount of water solubilized, and the aggregation number of both AOT RMs are dissimilar considering the chemical structure of the external solvents.51 In the same way Girardi et al.50 studied the micropolarity and hydrogen bonding capacity of the RMs interfaces of LM/AOT and IPM/AOT by using the solvatochromism of a molecular probe: 1-methyl-8-oxyquinolinium betaine and infrared spectroscopy. They showed that the water molecules in the interfaces form stronger hydrogen bond interactions with the polar head of AOT in ML than in IPM RMs media. This was explained considering the better penetration of the IPM solvent to the interface of the RMs systems.11 In other words, when the solvent can penetrate the AOT interfaces disturb the hydrogen bond interaction between water and AOT with the consequent changes in the RMs sizes and water structure. As a consequence, in the system formed by IPM/AOT/water, there is greater availability of free water in the center of RMs to stabilize the active sites of AP, in comparison with ML/AOT/water RMs.11 These facts are the main reason why catalytic efficiencies in IPM/AOT/water systems are always higher compared to ML/AOT/water systems, at the same W0 value.
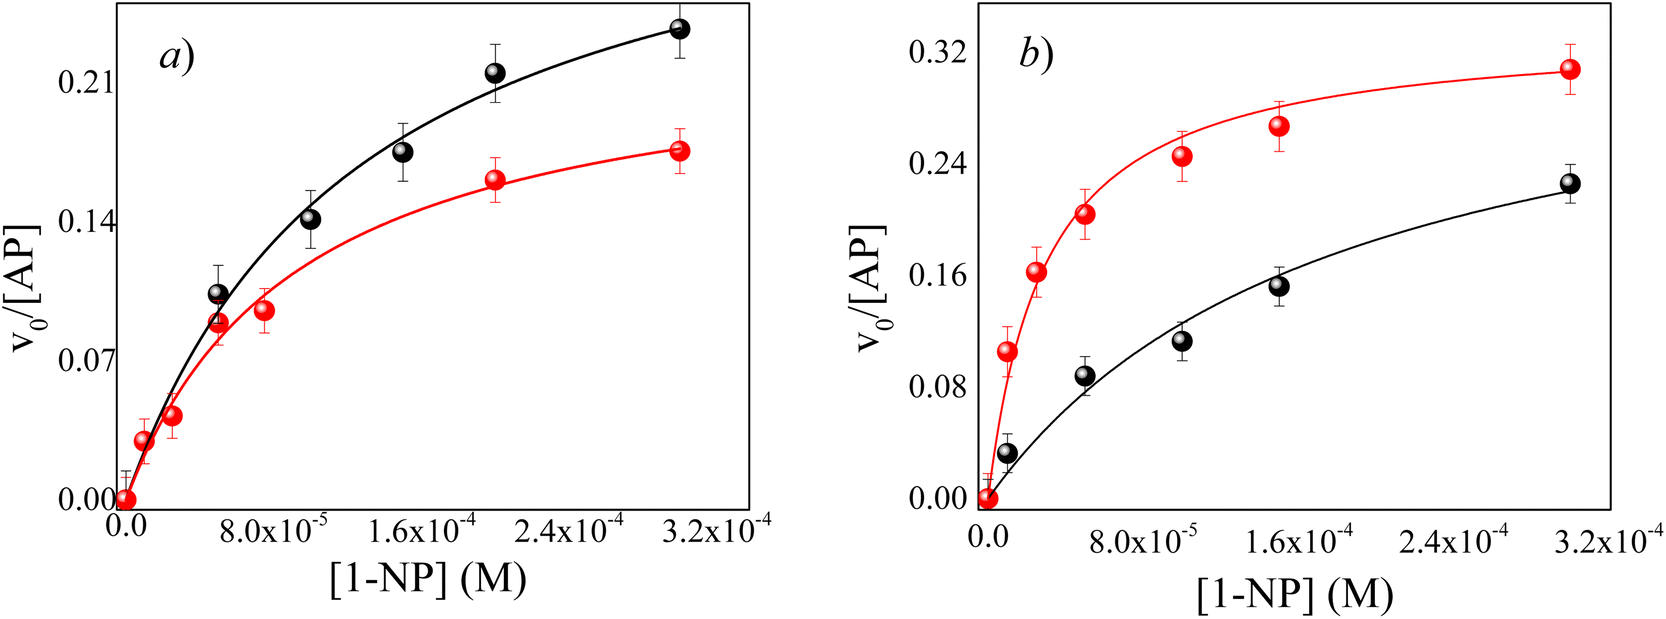 | ||
Fig. 4 Effect of AOT concentration on the relationship between the v0 and the analytical concentration of 1-NP in different RMs at pH = 10 and, T = 35 °C. [AOT]: (●) 0.05 M, ( ) 0.1 M. (a) ML/AOT/water RMs at W0 = 6 (b) IPM/AOT/water RMs at W0 = 10. ) 0.1 M. (a) ML/AOT/water RMs at W0 = 6 (b) IPM/AOT/water RMs at W0 = 10. | ||
| Kinetic parameters | ML/AOT/watera | IPM/AOT/watera | ||
|---|---|---|---|---|
| [AOT] 0.05 M | [AOT] 0.1 M | [AOT] 0.05 M | [AOT] 0.1 M | |
| a ML/AOT at W0 = 6, IPM/AOT at W0 = 10. | ||||
| kcat (s−1) | 0.35 ± 0.04 | 0.24 ± 0.02 | 0.35 ± 0.04 | 0.31 ± 0.03 |
| KM (M) × 10−5 | 12.99 ± 1.22 | 9.78 ± 0.91 | 18.15 ± 1.30 | 2.42 ± 0.21 |
| kcat/KM (M−1 s−1) | 2694 ± 110 | 2454 ± 105 | 1928 ± 98 | 12810 ± 410 |
Since AP and 1-NP are soluble in the aqueous pool of the RMs, a variation in the concentration of AOT should not change the kcat/KM values. It can be appreciated that the kcat/KM values do not change with the AOT concentration for ML/AOT/water (≈2570 M−1 s−1) RMs system. However, surprisingly for the IPM/AOT system the kcat/KM decreases by an order of magnitude at low AOT concentrations. This is difficult to explain, probably the penetration of the solvent may be the cause. Thus, the difference in kcat/KM with the surfactant concentration can be attributed to the ability of the external solvent to penetrate the interfaces of the RMs formed by ML and IPM, respectively, which may cause differences in the enzyme-substrate interaction (KM).
In systems where external solvents do not penetrate the interface such as n-heptane and ML,11 water molecules have the same capacity to solvate the AOT polar head at any surfactant concentration.11 In other words, the kcat/KM values obtained for ML/AOT/water are not surprising since the interface is solvated similarly and the free water molecules are in the center of RMs, independently of AOT concentration. That is, the interfacial water molecules interact and form a hydrogen bond with the AOT polar head, so the free water in the center of the RMs has the same availability to stabilize the AP active sites at any AOT concentration. However, the situation is different for IPM/AOT/buffer RMs systems where there is a significant decrease in the kcat/KM ratio value at low AOT concentration. Also, the KM value is greater than at high AOT concentration (Table 3), being smaller the enzyme-substrate interaction and, consequently, the enzyme efficiency. It is interesting how two biocompatible solvents with a similar structure have different behavior in AOT RMs and can modify the aqueous interface in presence of water, and be sensed by the enzyme localized in the pool aqueous of RMs.
Here, the effect of the pH value on AP enzymatic activity in both micellar systems was studied. The behavior of AP inside ML/AOT and IPM/AOT RMs, in the presence of pure water, was investigated and compared with the water (pH = 10). We found that the enzymatic catalysis in ML/AOT and IPM/AOT RMs, in the presence of water at both pH values (7 and 10), shows a UV-vis absorption band at λmax = 323 nm, corresponding to the formation of 1-naphthol as the reaction product. Fig. 5 shows the typical profile of the reaction rate at different 1-NP concentrations for IPM/AOT RMs, in the presence of pure water and water (pH = 10). The experimental data were analyzed in a similar way to that discussed above and the kinetic parameters obtained are summarized in Table 4.
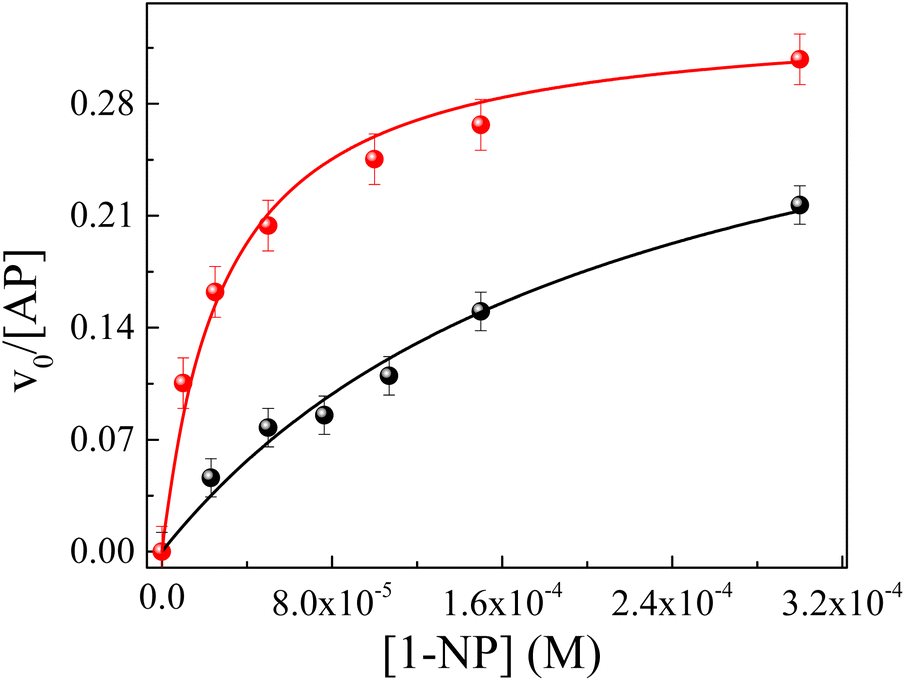 | ||
Fig. 5 Effect of the AP enzyme on the relationship between the v0 and the analytical concentration of 1-NP in RMs of IPM/AOT/water at T = 35 °C. (●) W0 = 10 at pH = 7 and ( ) W0 = 10 at pH = 10. ) W0 = 10 at pH = 10. | ||
| Kinetic parameters | ML/AOT/water | IPM/AOT/water | ||
|---|---|---|---|---|
| pH = 7 | pH = 10 | pH = 7 | pH = 10 | |
| kcat (s−1) | 0.22 ± 0.02 | 0.18 ± 0.03 | 0.37 ± 0.04 | 0.32 ± 0.03 |
| KM (M) × 10−5 | 6.97 ± 0.60 | 5.74 ± 0.60 | 22.02 ± 1.10 | 2.42 ± 0.20 |
| kcat/KM (M−1 s−1) | 3156 ± 112 | 3300 ± 120 | 1680 ± 93 | 13223 ± 310 |
It can be seen from Table 4, that in ML/AOT RMs there are no appreciable differences in the catalytic efficiency values of the enzyme when water at pH = 7 and pH = 10 is used. To explain these results, an analysis of the hydrolysis reaction inside AOT RMs was performed taking into account the possible interaction between the reaction product and the RMs interface. Thus, as ML molecules do not penetrate the RM interface, AOT molecules are prompted to make hydrogen bond interactions with any protic molecules that are around. At pH = 7, water molecules and 1-naphthol make a strong hydrogen bond interaction with the AOT component of the micelles and, the enzyme is not disturbed by the acidic product.
In presence of OH− at pH = 10, the reaction product 1-naphtholate is initially generated inside the aqueous pool. After that, and as it was previously demonstrated with other phenols, is converted to 1-naphthol and the driving force is the strong hydrogen bond interaction with AOT molecules.53 Thus, for AP located in the RM water pool, the enzyme is always solvated by water molecules independently if the pH value is 7 or 10 (Scheme 3).
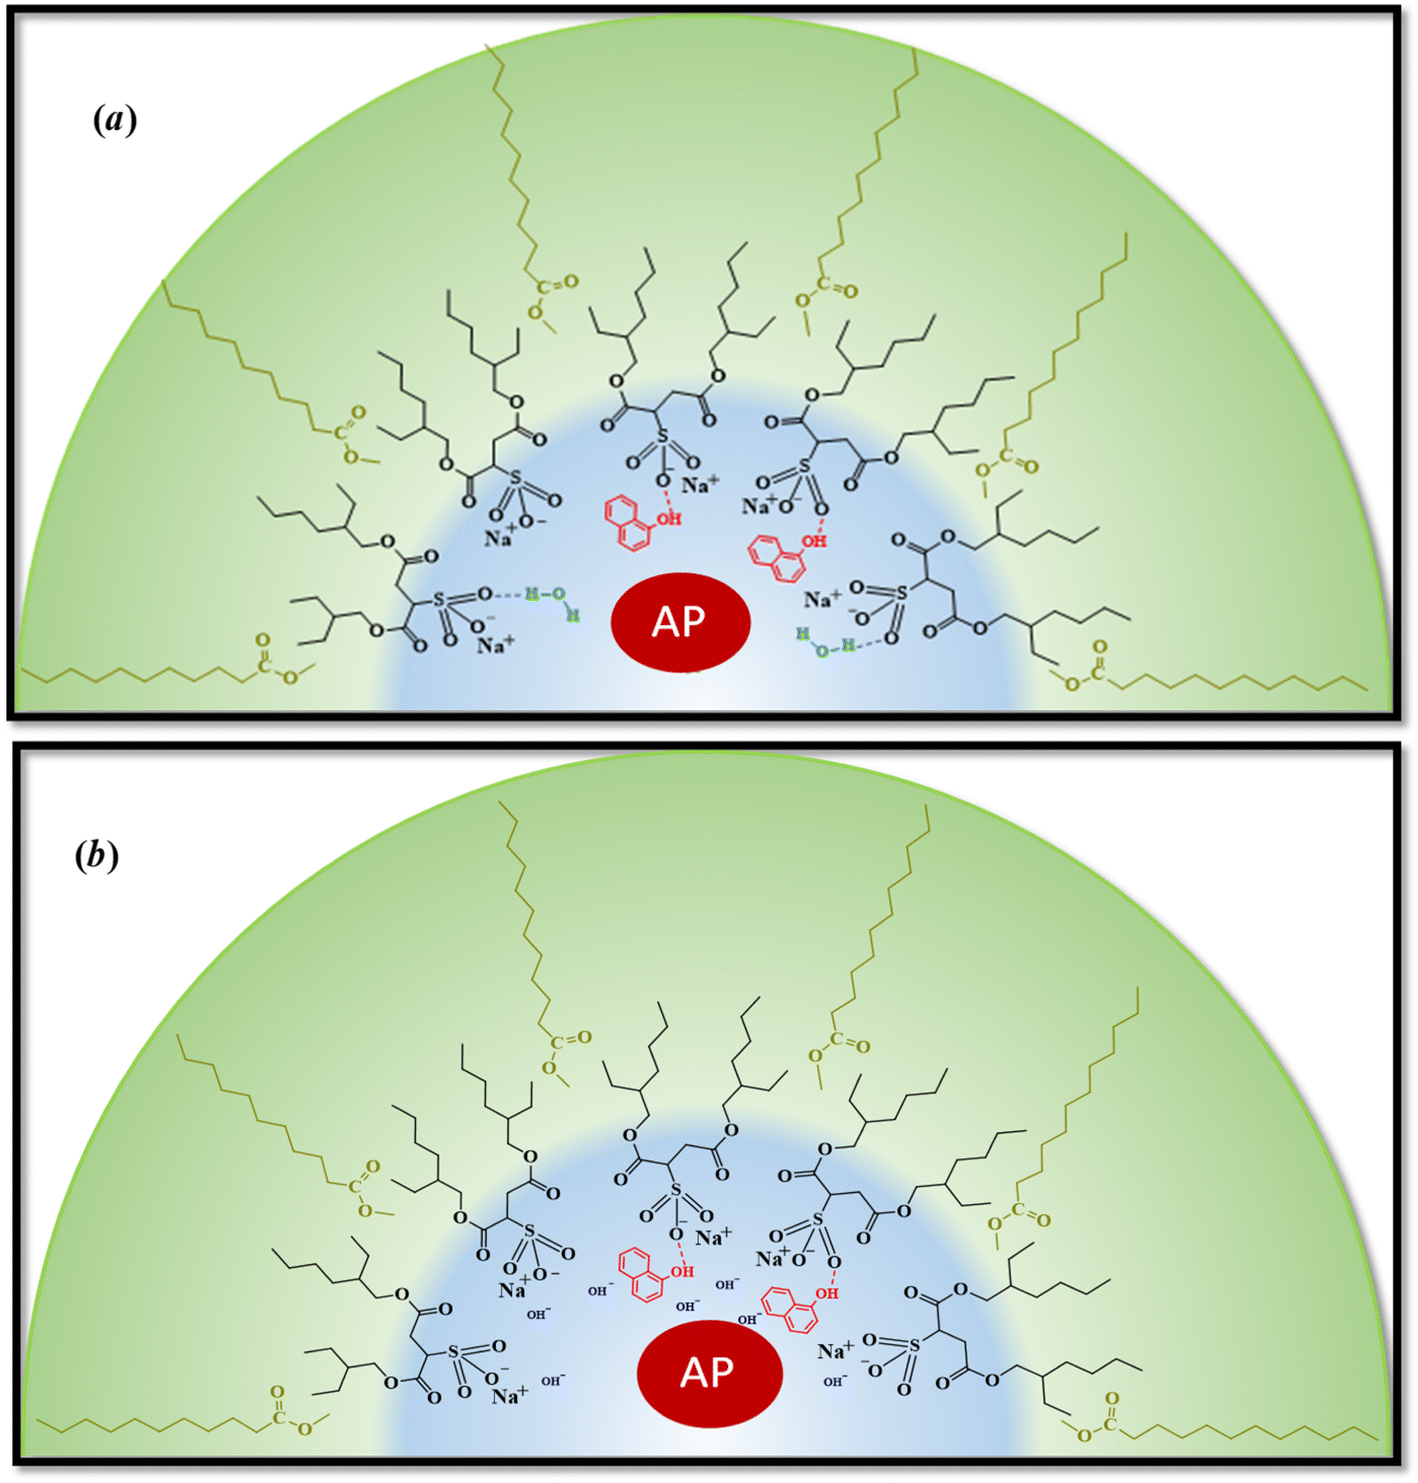 | ||
| Scheme 3 Schematic representation of the effect on ML/AOT/water, (a) water at pH = 7 and (b) water at pH = 10 RMs. The product is generated in the aqueous pool, migrates, and interacts with the interface. In this way, the AP perceives the same environment around the catalytic regions if the RMs are formed at different pH. | ||
However, the catalytic efficiency found in IPM/AOT/water RMs using water (pH = 10) compared to the one found at pH = 7, is significantly higher at the same aqueous pool content. As can be seen in Table 4, the kcat/KM values for pH = 10 and pH = 7 are 13223 M−1 s−1 and 1680 M−1 s−1, respectively. As IPM has a greater ability to penetrate the interface of AOT RMs, it could modify the hydrogen bond interactions with the AOT. That is, the IPM penetrates the micellar interface, so the water and 1-naphthol molecules cannot form hydrogen bond interactions with the polar head of AOT, independently of the aqueous pool made up of water at pH = 7 or pH = 10 (see Scheme 4). Even more, for pH = 7 the reaction product is the 1-naphthol. So it is possible to assume that the 1-naphthol does not give 1-naphtholate due to the lack of hydrogen bond interaction with the AOT at the interface. Thus, probably AP loses its activity if it is surrounded by the acidic 1-naphthol, as it happens at pH 7 in pure water (Scheme 4). This fact can be the reason that we observe a low catalytic efficiency in IPM/AOT/water RMs at pH = 7 in comparison to pH = 10. In contrast, in IPM/AOT/water RMs at pH = 10, the enzyme is active since the AP is surrounded by OH− and 1-naphtholate molecules.
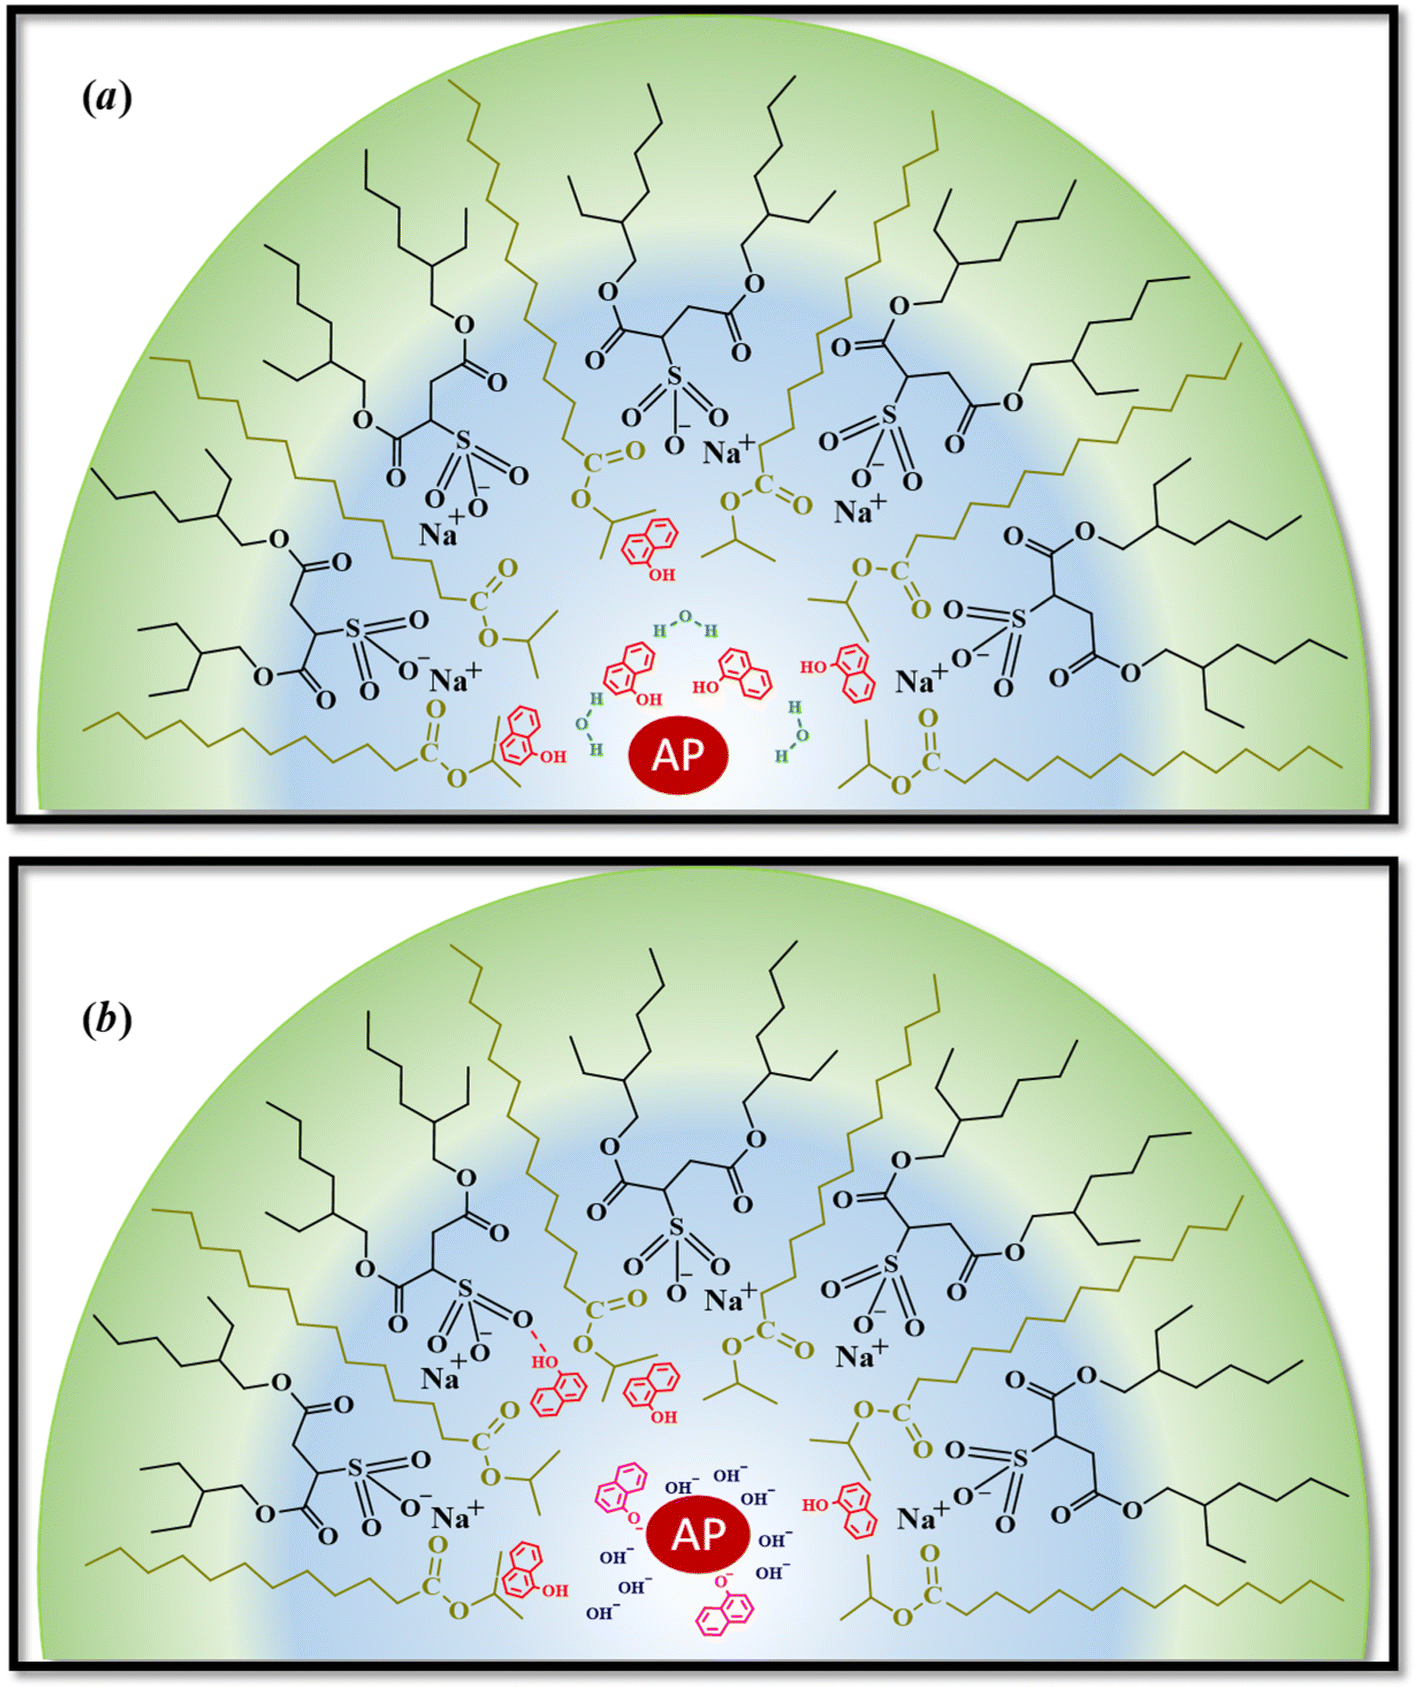 | ||
| Scheme 4 Schematic representation of the effect of pH inside of IPM/AOT/water RMs. (a) Water at pH = 7 and, (b) water at pH = 10. At pH: 7, 1-naphthol does not interact with the interface and is located near the AP. The enzyme is not active under these conditions. In the presence of water at pH = 10 in RMs, the AP is surrounded by OH− and 1-naphtholate, so the enzyme is active. | ||
Conclusion
This work shows how AOT RMs formed in two different biocompatible solvents, ML and IPM, are used in the hydrolysis of 1-NP by AP and very valuable information is obtained about different RMs properties. The catalytic efficiencies increase in both systems micellar when the water content increases because the enzyme is better solvated when the water content is high. However, the penetration capacity of the external solvents in the micellar interface determines the catalytic activity of the AP, despite the similarity in the nonpolar solvent's structures. LM is a solvent that can not penetrate the AOT RMs while IMP can do that easily and, this behavior has dramatic consequences on the enzyme performance. For example, the solvent penetration makes that the IPM/AOT/water has greater availability of free water in the polar core of the RMs to hydrate the active sites of AP, increasing the catalytic efficiency of this system in comparison with ML/AOT/water RMs. Also, the catalytic efficiencies do not change with the concentration of surfactant in the RMs of ML/AOT/water (≈2570 M−1 s−1), but it decreases by an order of magnitude at low AOT concentrations in IPM/AOT/water. At low AOT concentrations, the IPM penetrates less to the interface making more rigid than the AOT RMs since there is less competition between IPM and the water molecules to solvate the polar head of AOT. Consequently, there is less availability of free water in the polar core of the RMs and the kcat/KM value decreases.Finally, the results found using water at pH 7 and 10 demonstrate that the pH concept cannot be used directly in a confined environment such as RMs. Specifically, it is incorrect to assume that the pH of the solution used to prepare the RMs will necessarily be the same as that of the micellar interface since in LM/AOT RMs the enzyme efficiency is the same regardless of the pH value used for the experiment. It is worth highlighting that, in homogeneous media AP only works at pH = 10.
Conflicts of interest
There are no conflicts to declare.Acknowledgements
Financial support from the Consejo Nacional de Investigaciones Científicas y Técnicas, Universidad Nacional de Río Cuarto, Universidad Nacional del Sur, Agencia Nacional de Promoción Científica y Técnica (PICT-2019-2159, PICT-2019-0543 and PICT 2018-0508), is gratefully acknowledged. N. M. C., R. D. F., and, F. M. hold a research position at CONICET. G. M. thanks from CONICET for a research doctoral fellowship.References
- K. Wandelt, Surface and Interface Science, Volumes 7 and 8: Volume 7-Solid-Liquid and Biological Interfaces; Volume 8-Applications of Surface, John Wiley & Sons, 2020 Search PubMed.
- K. Ariga, ChemNanoMat, 2016, 2(5), 333–343 CrossRef CAS.
- M. Senske, Y. Xu, A. Bäumer, S. Schäfer, H. Wirtz, J. Savolainen, H. Weingärtner and M. Havenith, Phys. Chem. Chem. Phys., 2018, 20(13), 8515–8522 RSC.
- K. Kundu, A. P. Singh, S. Panda, V. Singh, R. L. Gardas and S. Senapati, ChemistrySelect, 2018, 3(17), 4768–4776 CrossRef CAS.
- I. León, J. Millán, E. J. Cocinero, A. Lesarri and J. A. Fernández, Angew. Chem., Int. Ed. Engl., 2013, 52(30), 7772–7775 CrossRef PubMed.
- N. M. Correa, J. J. Silber, R. E. Riter and N. E. Levinger, Chem. Rev., 2012, 112(8), 4569–4602 CrossRef CAS PubMed.
- C. M. O. Lépori, N. M. Correa, J. J. Silber, R. D. Falcone, M. López-López and M. L. Moyá, Langmuir, 2020, 36(36), 10785–10793 CrossRef PubMed.
- E. I. Gomez Rodríguez, R. D. Falcone, P. R. Beassoni, F. Moyano and N. M. Correa, ChemistrySelect, 2019, 4(24), 7204–7210 CrossRef.
- A. E. L. Aferni, M. Guettari, T. Tajouri and A. Rahdar, J. Mol. Liq., 2020, 318, 114012 CrossRef CAS.
- R. Nagarajan, Self-assembly: from surfactants to nanoparticles, John Wiley & Sons, 2019 Search PubMed.
- V. R. Girardi, J. J. Silber, N. Mariano Correa and R. Darío Falcone, Colloids Surf., A, 2014, 457, 354–362 CrossRef CAS.
- M. J. Antony, C. A. Jolly, K. R. Das and T. S. Swathy, Colloids Surf., A, 2019, 578, 123627 CrossRef.
- G. A. Monti, G. A. Fernández, N. M. Correa, R. D. Falcone, F. Moyano and G. F. R. Silbestri, Soc. Open Sci., 2017, 4(7), 170481 CrossRef PubMed.
- M.-L. Arsene, I. Răut, M. Călin, M.-L. Jecu, M. Doni and A.-M. Gurban, Processes, 2021, 9(2), 345 CrossRef.
- S. S. Silva, J. M. Gomes, R. L. Reis and S. C. Kundu, ACS Appl. Bio Mater., 2021, 4(5), 4000–4013 CrossRef CAS PubMed.
- N. Dib, J. J. Silber, N. M. Correa and R. D. Falcone, J. Mol. Liq., 2020, 313, 113592 CrossRef CAS.
- R. Syah, M. Zahar and E. Kianfar, Int. J. Chem. React. Eng., 2021, 19(10), 981–1007 CrossRef CAS.
- N. L. Klyachko, A. V. Levashov, A. V. Kabanov, Y. L. Khmelnitsky and K. Martinek in Kinetics and catalysis in microheterogeneous systems, CRC Press, 2020, pp. 135–182 Search PubMed.
- C. Silva, M. Martins, S. Jing, J. Fu and A. Cavaco-Paulo, Crit. Rev. Biotechnol., 2018, 38(3), 335–350 CrossRef CAS PubMed.
- F. Moyano, R. F. Falcone, J. C. Mejuto, J. J. Silber and N. M. Correa, Chem.–Eur. J., 2010, 16(29), 8887–8893 CrossRef CAS PubMed.
- F. Moyano, E. Setien, J. J. Silber and N. M. Correa, Langmuir, 2013, 29(26), 8245–8254 CrossRef CAS PubMed.
- A. V. Kabanov, S. N. Nametkin, N. L. Klyachko and A. V. Levashov, FEBS Lett., 1991, 278(2), 143–146 CrossRef CAS PubMed.
- P. Singh, D. Mukherjee, S. Singha, R. Das and S. K. Pal, Chem.–Eur. J., 2019, 25(41), 9728–9736 CrossRef CAS PubMed.
- A. B. Rahman, H. Imafuku, Y. Miyazawa, A. Kafle, H. Sakai, Y. Saga and S. Aoki, Inorg. Chem., 2019, 58(9), 5603–5616 CrossRef CAS PubMed.
- A. Mishra, S. Dhiman and S. George, J. Angew. Chem., 2021, 133(6), 2772–2788 CrossRef.
- P. F. A. Costa, R. de Abreu, A. B. Fontana, H. D. Fiedler, A. J. Kirby, F. H. Quina, F. Nome and A. P. Gerola, J. Colloid Interface Sci., 2021, 588, 456–468 CrossRef CAS PubMed.
- U. Sharma, D. Pal and R. Prasad, Indian J. Clin. Biochem., 2014, 29(3), 269–278 CrossRef CAS PubMed.
- Z. Tang, H. Chen, H. He and C. Ma, TrAC, Trends Anal. Chem., 2019, 113, 32–43 CrossRef CAS.
- S. Vimalraj, Gene, 2020, 754, 144855 CrossRef CAS.
- D. M. Zaher, M. I. El-Gamal, H. A. Omar, S. N. Aljareh, S. A. Al-Shamma, A. J. Ali, S. Zaib and J. Iqbal, Arch. Pharm., 2020, 353(5), e2000011 CrossRef CAS PubMed.
- J. E. Coleman, Annu. Rev. Biophys. Biomol. Struct., 1992, 21(1), 441–483 CrossRef CAS PubMed.
- G. M. Santos, S. Ismael, J. Morais, J. R. Araújo, A. Faria, C. Calhau and C. Marques, Microorganisms, 2022, 10(4), 746–761 CrossRef CAS PubMed.
- C. M. L. Carvalho, P. Cunnah, M. R. Aires-barros and J. M. S. Cabral, Biocatal. Biotransform., 2000, 18(1), 31–57 CrossRef CAS.
- S. Gupta, L. Mukhopadhyay and S. P. Moulik, Colloids Surf., B, 1994, 3(4), 191–201 CrossRef CAS.
- E. V. Kudryashova, V. L. Bronza and A. V. Levashov, Biochemistry, 2009, 74(3), 342–349 CAS.
- S. Patra, A. K. Pandey, S. K. Sarkar and A. Goswami, RSC Adv., 2014, 4(63), 33366–33369 RSC.
- M. A. Biasutti, E. B. Abuin, J. J. Silber, N. M. Correa and E. A. Lissi, Adv. Colloid Interface Sci., 2008, 136(1–2), 1–24 CrossRef CAS.
- N. Dib, V. R. Girardi, J. J. Silber, N. M. Correa and R. D. Falcone, Org. Biomol. Chem., 2021, 19(22), 4969–4977 RSC.
- G. Cathala and C. Brunel, J. Biol. Chem., 1975, 250(15), 6046–6053 CrossRef CAS.
- M. Gonnelli and G. B. Strambini, J. Phys. Chem., 1988, 92(10), 2854–2857 CrossRef CAS.
- M. Bortolato, F. Besson and B. Roux, Proteins: Struct., Funct., Bioinf., 1999, 37(2), 310–318 CrossRef CAS.
- G. Eskici and P. H. Axelsen, Langmuir, 2018, 34(7), 2522–2530 CrossRef CAS PubMed.
- N. J. Palmer, G. Eskici and P. H. Axelsen, J. Phys. Chem. B, 2020, 124(1), 144–148 CrossRef CAS PubMed.
- H.-C. Hung and G.-G. Chang, Biophys. J., 2001, 81(6), 3456–3471 CrossRef CAS PubMed.
- D. Blach, V. R. Girardi, J. J. Silber, N. M. Correa and R. D. Falcone, Colloids Surf., A, 2022, 652, 129812 CrossRef CAS.
- B. Baruah, J. M. Roden, M. Sedgwick, N. M. Correa, D. C. Crans and N. E. Levinger, J. Am. Chem. Soc., 2006, 128(13), 12758–12765 CrossRef CAS PubMed.
- S. S. Quintana, F. Moyano, R. D. Falcone, J. J. Silber and N. M. Correa, J. Phys. Chem. B, 2009, 113(19), 6718–6724 CrossRef CAS PubMed.
- N. M. Correa, E. N. Durantini and J. Silber, J. Colloid Interface Sci., 2001, 240(2), 573–580 CrossRef CAS PubMed.
- L. Zingaretti, N. Mariano Correa, L. Boscatto, S. M. Chiacchiera, E. N. Durantini, S. G. Bertolotti, C. R. Rivarola and J. Silber, J. Colloid Interface Sci., 2005, 286(1), 245–252 CrossRef CAS PubMed.
- V. R. Girardi, J. J. Silber, R. D. Falcone and N. M. Correa, ChemPhysChem, 2018, 19(6), 759–765 CrossRef CAS PubMed.
- E. Odella, R. D. Falcone, M. Ceolín, J. J. Silber and N. M. Correa, J. Phys. Chem. B, 2018, 122(15), 4366–4375 CrossRef CAS PubMed.
- F. Moyano, R. F. Falcone, J. C. Mejuto, J. J. Silber and N. M. Correa, Chem. Eur. J., 2010, 16(29), 8887–8893 CrossRef CAS PubMed.
- O. F. Silva, M. A. Fernández, J. J. Silber, R. H. de Rossi and N. M. Correa, ChemPhysChem, 2012, 13(1), 124–130 CrossRef CAS PubMed.
Footnote |
| † Electronic supplementary information (ESI) available. See DOI: https://doi.org/10.1039/d2ra06296h |
| This journal is © The Royal Society of Chemistry 2023 |