 Open Access Article
Study on ethanol electro-oxidation over a carbon-supported Pt–Cu alloy catalyst by pinhole on-line electrochemical mass spectrometry
Kyong-Sik Ju *a,
In-Ho Jangb,
Yong-A. Choea,
Song-Chun Ria,
Hyon-Tae Pakb and
Su-Ok Hongc
aHigh-Tech Research and Development Center, Kim Il Sung University, Pyongyang, Democratic People's Republic of Korea. E-mail: ks.ju1025@ryongnamsan.edu.kp
bFaculty of Chemistry, Kim Il Sung University, Pyongyang, Democratic People's Republic of Korea
cDigital Laboratory, Kim Il Sung University, Pyongyang, Democratic People's Republic of Korea
First published on 22nd December 2022
Abstract
A carbon supported Pt–Cu electrocatalyst was synthesized by the microwave-polyol method following acid-treatment and physically characterized by different techniques including X-ray diffraction (XRD) and transmission electron microscopy (TEM). Both potentiodynamic and potentiostatic measurements with pinhole on-line electrochemical mass spectrometry were carried out to study the electrocatalytic activity and reaction intermediates of Pt/C and Pt–Cu/C electrocatalysts during the ethanol oxidation reaction. The results of potentiodynamic and potentiostatic measurements showed that the Pt–Cu/C electrocatalyst has higher ethanol oxidation efficiency and incomplete ethanol oxidation to acetaldehyde and acetic acid prevails under the given conditions. After calibration of the m/z = 44 mass signal, the CO2 current efficiencies on Pt/C and PtCu-3/C were ∼7% and ∼12%, respectively, which reveal that the presence of copper enhances the complete ethanol oxidation to CO2.
1. Introduction
In recent years, direct ethanol fuel cells (DEFCs) have attracted much attention as alternative power sources for portable electronic devices due to their unique properties including high energy density (8.0 kW h kg−1), low operating temperature (60–100 °C), ease of handling liquid fuel and natural availability from biomass, as well as low toxicity with respect to other fuels such as methanol.1–4Although DEFCs are good alternative power sources, the slow kinetics of ethanol oxidation reaction (EOR) and the poor selectivity of ethanol complete oxidation to CO2 diminish the overall performance of DEFCs, and restrain its commercialization.5–8 Carbon-supported Pt catalyst is commonly employed as anode catalyst for ethanol oxidation in low temperature fuel cells. However, pure Pt is well known to be easily poisoned on its surface by adsorbed species such as carbon monoxide (CO) coming from the dissociative adsorption process of ethanol, hence leading to substantial losses in operation potentials.9–13 In order to solve this problem and improve the catalytic activity towards ethanol oxidation, adding a second metal to Pt is to form Pt alloy catalysts. For example, transition metals (Ru, Sn, Rh, Ir, Mn, Cu etc.) have been used as a second metal for Pt alloying to reduce the cost and enhance the activity of Pt alloy catalysts. Pt–Sn and Pt–Ru catalysts with optimized compositions and structures have been already reported to show an enhanced activity compared to other catalysts.14–24 Rh and Ir metal have performances of C–C bond breaking and, consequently, Pt–Rh/C and Pt–Ir/C alloy catalysts showed high selectivity of the ethanol oxidation reaction (EOR) toward the CO2 formation.25–29 Pt–Mn and Pt–Cu activity towards EOR is not as high as Pt–Sn and Pt–Ru, but they have also enhanced catalytic activity compared to pure Pt catalyst.30–36 Ammam et al.33 have formed PtCu/C alloy catalyst and Pt(Cu)/C core–shell type catalyst, and investigated that PtCu/C displayed a better activity with respect to Pt(Cu)/C in terms of oxidation current and onset potential. Magalhães et al.34 have studied that ternary PtSnCu catalyst show a drastic reduction of the onset potential in comparison with PtSn and PtCu beyond Pt. Huang et al.35 have investigated that AC-PtCu-4/C synthesized by the microwave-polyol technique following acid-treatment can enhance the C–C bond cleavage of ethanol than that of Pt/C under the same conditions, because the AC-PtCu-4/C has high-density atomic steps caused by acid treatment. And a handful of studies have been reported for alcohol oxidation using PtCu and these dealt more specifically with methanol oxidation applications, rather than with ethanol oxidation.37–39 However, the investigation on the mechanism of EOR on Pt–Cu alloy catalysts has hardly ever been reported in previous studies.
In this work, we reported the electrocatalytic mechanism of the EOR on carbon supported Pt and Pt–Cu alloy catalysts in acid medium at room temperature by Pinhole on-line electrochemical mass spectrometry (POEMS). Pt–Cu/C electrocatalyst was synthesized by the microwave-polyol method following acid-treatment, and their physical properties were evaluated using X-ray diffraction (XRD), inductively coupled plasma optical emission spectroscopy (ICP-OES), and transmission electron microscopy (TEM). The microwave-polyol method following acid-treatment (chemical dealloying) can synthesize small dealloyed Pt–Cu alloy nanoparticles with uniform dispersion and sharp size distribution and avoid aggregation. The product yields were measured by POEMS and a quantification of the CO2 current efficiency (CCE) was carried out after calibration of the signal m/z = 44.
2. Experimental
2.1 Catalyst synthesis
All materials are purchased from the indicated suppliers and used as received without further purification. All the solutions were prepared with ultrapure water (Millipore, 18.2 MΩ cm−1). Vulcan XC-72R carbon black (Cabot Corp.) served as support material for all catalysts.PtCu-3/C electrocatalyst was synthesized by microwave-polyol method following acid-treatment in ethylene glycol (EG, Aladdin, 98%) solution with H2PtCl6·6H2O (Alfa Aesar, 98%) and Cu(CH3COO)2·H2O (Aladdin, 98%) as precursor salts. Initially, the precursor salts were added to achieve Pt to Cu molar ratio of 1![[thin space (1/6-em)]](https://www.rsc.org/images/entities/char_2009.gif) :
:![[thin space (1/6-em)]](https://www.rsc.org/images/entities/char_2009.gif) 3 and a total metal loading of 20%. Briefly, 40 mg of Vulcan XC-72R carbon black was dispersed into the mixed solution of 60 mL containing isopropyl alcohol (Aladdin, 98%) and EG (V/V = 1
3 and a total metal loading of 20%. Briefly, 40 mg of Vulcan XC-72R carbon black was dispersed into the mixed solution of 60 mL containing isopropyl alcohol (Aladdin, 98%) and EG (V/V = 1![[thin space (1/6-em)]](https://www.rsc.org/images/entities/char_2009.gif) :
:![[thin space (1/6-em)]](https://www.rsc.org/images/entities/char_2009.gif) 4) in 100 mL beaker under ultrasonic treatment for 1 h to form uniform carbon ink. 0.67 mL of H2PtCl6·6H2O solution (0.03914 mol L−1) and 15.52 mg of Cu(CH3COO)2·H2O were added into the uniform carbon ink with urgent agitation for 2 h. The pH value of the ink was adjusted to 11.0 by adding dropwise 1 mol L−1 NaOH–EG solution. The beaker was placed the center of a microwave oven (2450 MHz, 800 W) and argon gas was fed into the ink for 20 min to expel oxygen, and then the ink was heated up to boiling point by microwave and refluxed for 5 min so that the Pt4+ and Cu2+ ions were reduced completely. The mixture was allowed to cool down to room temperature with continuous stirring and 0.1 mol L−1 HNO3 solution was added drop by drop into the cooled mixture to adjust its pH value to ∼3. The mixture was kept stirring for 8 h and then the suspension was washed and filtered thoroughly with ultrapure water. The filtered cake was dried at 80 °C for 6 h in a vacuum oven. Then the filtered cake was ground and dispersed in 20 mL ethanol under ultrasonic treatment for 30 min to form ink. 50 mL of 3 mol L−1 H2SO4 solution was mixed with ink and the mixture was kept for 24 h. Finally the mixture was filtered and washed by ultrapure water, and the filter cake was dried in a vacuum oven at 25 °C for 8 h. Pt/C (20 wt%) electrocatalyst was only prepared by the microwave-polyol method.
4) in 100 mL beaker under ultrasonic treatment for 1 h to form uniform carbon ink. 0.67 mL of H2PtCl6·6H2O solution (0.03914 mol L−1) and 15.52 mg of Cu(CH3COO)2·H2O were added into the uniform carbon ink with urgent agitation for 2 h. The pH value of the ink was adjusted to 11.0 by adding dropwise 1 mol L−1 NaOH–EG solution. The beaker was placed the center of a microwave oven (2450 MHz, 800 W) and argon gas was fed into the ink for 20 min to expel oxygen, and then the ink was heated up to boiling point by microwave and refluxed for 5 min so that the Pt4+ and Cu2+ ions were reduced completely. The mixture was allowed to cool down to room temperature with continuous stirring and 0.1 mol L−1 HNO3 solution was added drop by drop into the cooled mixture to adjust its pH value to ∼3. The mixture was kept stirring for 8 h and then the suspension was washed and filtered thoroughly with ultrapure water. The filtered cake was dried at 80 °C for 6 h in a vacuum oven. Then the filtered cake was ground and dispersed in 20 mL ethanol under ultrasonic treatment for 30 min to form ink. 50 mL of 3 mol L−1 H2SO4 solution was mixed with ink and the mixture was kept for 24 h. Finally the mixture was filtered and washed by ultrapure water, and the filter cake was dried in a vacuum oven at 25 °C for 8 h. Pt/C (20 wt%) electrocatalyst was only prepared by the microwave-polyol method.
2.2 Characterization of physical properties
To study the crystallographic information of the electrocatalysts, XRD analysis was carried out by D/max-RB X-ray diffractometer with the Cu Kα X-ray source at 40 kV and 100 mA. The morphology and microstructure of the electrocatalysts were further studied by TEM (TECNAI G2 F30). Quantitative determination of the composition of electrocatalyst was confirmed by ICP-OES (iCAP 6300 Thermo).2.3 Electrode preparation and electrochemical measurements
![[thin space (1/6-em)]](https://www.rsc.org/images/entities/char_2009.gif) :
:![[thin space (1/6-em)]](https://www.rsc.org/images/entities/char_2009.gif) 1) for 30 min. Next, 7.5 μL of this ink was transferred onto a polished glassy carbon disk, and onto which 10 mL of a 5 wt% Nafion® solution (5 wt% solution in a mixture of lower aliphatic alcohols and DuPont water) in order to form a homogeneous thin catalyst layer (39.8 μgmetal cm−2). For the sake of comparison, the electrochemical results expressed hereafter are normalized by the Pt mass at the working electrode.
1) for 30 min. Next, 7.5 μL of this ink was transferred onto a polished glassy carbon disk, and onto which 10 mL of a 5 wt% Nafion® solution (5 wt% solution in a mixture of lower aliphatic alcohols and DuPont water) in order to form a homogeneous thin catalyst layer (39.8 μgmetal cm−2). For the sake of comparison, the electrochemical results expressed hereafter are normalized by the Pt mass at the working electrode.Before the CO-stripping experiments, the working electrode was treated by continuous cycling at a scan rate of 50 mV s−1 for 20 min in Ar-purged 0.1 M HClO4 to activate and clean catalyst surface (from 0.05 to 1.2 V). CO was feed into 0.1 M HClO4 solution for 15 min to saturate the surface of the electrocatalyst with CO when the working electrode was kept at 0.10 V. Then remaining dissolved CO in the electrolyte was removed by N2 bubbling for 30 min. CO-stripping and ethanol oxidation reaction were carried out with scan rate 10 mV s−1. Potentiostatic experiments were performed on Pt/C and PtCu-3/C electrocatalysts at fixed potential to quantify the products formed in the EOR. The process of the experiments was as follows; at first, working electrode was cleaned and electrolyte was exchanged from the supporting electrolyte (0.1 M HClO4 solution) to the electrolyte containing ethanol (0.1 M HClO4 + 0.1 M EtOH solution), keeping the electrode potential of 0.05 V for 15 min. And then, the electrode potential was stepped to the respective adsorption/reaction potential for 3 min to obtain steady-state currents, recording the faradaic current and the mass spectrometric ion currents simultaneously.
2.4 Calibration of the electrochemical MS setup
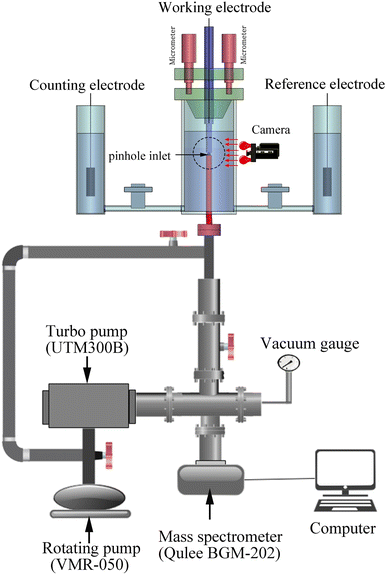
Pinhole on-line electrochemical mass spectrometry (POEMS) was first reported by Gao.40 POEMS setup employed in our experiment consists of a Qulee BGM-202 mass spectrometer, vacuum system, micron-sized pinhole which use as inlet of mass spectrometer, homemade micro-controlled system, camera and electrochemical cell (Fig. 1).The working electrode was installed above PTFE membrane and the distance between working electrode and pinhole inlet for MS was adjusted about 15 μm by micro-controlled system. The micro-controlled system not only allows being short the responsive time of mass spectra but also decreasing the effect of concentration polarization.
In general, electrochemical MS can detect volatile products such as CO2 and CH3CHO in EOR, but not CH3COOH. The m/z = 44 mass signal is the main peak of true CO2 fragment, corresponding to [CO2+]. However, the acetaldehyde molecular species [CH3CHO+] also contributes to the m/z = 44 mass signal as well as CO2 molecular species [CO2+]. In order to estimate the true CO2 production, the ion current for m/z = 44 has to be corrected by subtracting the contribution of the interfering fragment of acetaldehyde. This can be achieved through the experimental determination of the relative intensity of the [CH3CHO+] fragment (m/z = 44) with respect to the main acetaldehyde peak [CHO+] (m/z = 29) using pure acetaldehyde.32,41 The current efficiency for the reaction product CO2 formation Aq(CO2) was calculated using the following equation:
 | (1) |
 is the calibration constant for m/z = 44 determined from the CO-stripping experiment on a Pt/C catalyst by the following equation:
 | (2) |
Similarly, the current efficiency for acetaldehyde formation Aq(CH3CHO) was calculated using the following equation:
 | (3) |
 was determined from the selective oxidation of ethanol (the concentration of 1 M) to acetaldehyde on a Au electrode at 1.70 V.41 Here, we have used the experimental result that the current efficiency of acetaldehyde formation on a Au electrode under these conditions is about 90%:42
 | (4) |
Because acetic acid formation could not be directly detected due to its low vapor pressure, acetic acid yields were determined indirectly, calculating the difference between the measured faradaic current and the partial currents for ethanol oxidation to CO2 and acetaldehyde, which were determined from the corresponding ion currents as described above. Here, it was assumed that only CO2, CH3CHO and CH3COOH are formed as the main products during EOR. The current efficiency for acetic acid formation Aq(CH3COOH) was calculated using the following equation:
| Aq(CH3COOH) = 1 − Aq(CO2) − Aq(CH3CHO) | (5) |
3. Results and discussion
3.1 Physical characterization
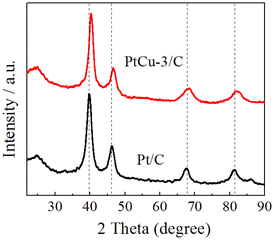
Fig. 2 shows X-ray diffraction (XRD) patterns of the Pt/C and PtCu-3/C electrocatalysts. The diffraction peak at about 2θ = 25° observed in the XRD patterns of the catalysts is due to the (002) of Vulcan XC-72R carbon support. Four characteristic peaks corresponding to (111), (200), (220) and (311) planes of the face-centered cubic (fcc) crystalline Pt are observed at 2θ = 39.9°, 46.6°, 67.5° and 81.8° in XRD patterns, respectively.32,35 The typical fcc Pt diffraction peaks in the PtCu-3/C electrocatalyst seem to be broadened and there are no noticeable peaks for phase separated structures such as a pure Cu or its oxides/hydroxides in XRD pattern, indicating a common degree of alloying between Pt and Cu.In particular, the diffraction peaks were slightly shifted to the high 2θ values in the PtCu-3/C electrocatalyst as compared to those of the Pt/C electrocatalyst, in agreement with Vegard's law.43 The metal particle sizes for Pt/C and PtCu-3/C calculated from the Scherrer's equation44,45 using the full width at half maximum (FWHM) of the respective (220) diffraction peak were 3.12 and 2.91 nm, respectively.
Before and after the acid-treatment, the composition of Pt–Cu electrocatalyst was measured by ICP-OES. The results showed the presence of 10.03 wt% Pt and 10.06 wt% Cu (Pt1Cu3.08/C) before the acid-treatment, and 10.71 wt% Pt and 3.91 wt% Cu (Pt1Cu1.12/C) after the acid-treatment.
TEM images, HRTEM images and histograms of particle size distribution for the synthesized electrocatalysts are shown in Fig. 3. The metal nanoparticles are uniformly distributed on the carbon support, and the average sizes of nanoparticles in the Pt/C and PtCu-3/C were 3.04 and 2.85 nm, respectively, which are in good agreement with the XRD results. HRTEM image indicates that the d-spacing of PtCu-3/C was ∼0.228 nm, showing this result match the (111) plane of the fcc Pt–Cu alloy.
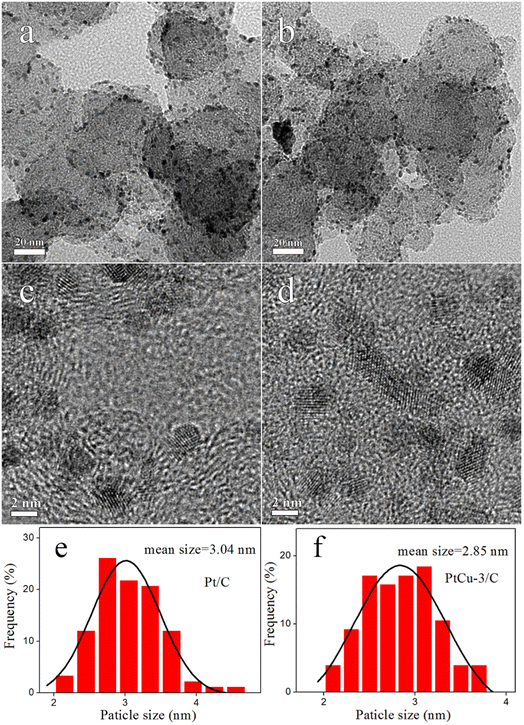 | ||
| Fig. 3 TEM and HRTEM images of (a and c) Pt/C, (b and d) PtCu-3/C and histograms of particle size distribution (e and f). | ||
3.2 CV of the base electrolyte and CO-stripping
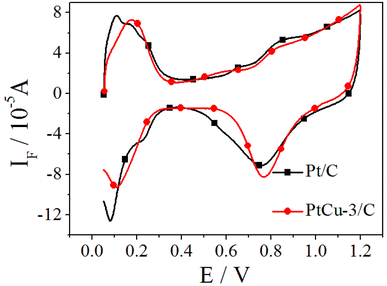
The cyclic voltammetry curves of Pt/C and PtCu-3/C performed at 10 mV s−1 in 0.1 M HClO4 are shown in Fig. 4. The usual features of the so-called hydrogen and oxygen regions can be observed.46 The hydrogen adsorption/desorption region as well as the oxide region on Pt/C electrocatalyst is clearly higher than on PtCu-3/C because of the decrease in the amount of Pt which has better hydrogen atom adsorption/desorption ability. The presence of clearly resolved hydrogen adsorption/desorption peaks at low potential suggests that any surface copper oxide layer was been removed, revealing the Pt–Cu alloy surface. The ECSAs of the electrocatalysts are determined by H-adsorption. The calculated ECSAs of Pt/C and PtCu-3/C were 76.2 and 91.3 m2 gPt−1, respectively.The CO-stripping voltammetry curves and the corresponding MSCVs for the m/z = 44 mass signals recorded on Pt/C and PtCu-3/C at 10 mV s−1 are shown in Fig. 5. The onset potentials of Pt/C and PtCu-3/C for CO stripping are 0.61 and 0.49 V, respectively, and the peak potential of CO stripping on PtCu-3/C was shifted negatively by 43.7 mV compared to Pt/C. This phenomenon implies that the PtCu-3/C electrocatalyst is less susceptible to self-poisoning (because of intermediate species such as CO generated during EOR) compared with Pt/C. Faster kinetics for CO stripping on Pt–Cu bimetallic alloy can be deduced that surface effects produced by chemical dealloying of Pt–Cu alloy increase OH adsorption due to surface defects.47 Thus, the PtCu-3/C electrocatalyst shows enhanced intermediate species tolerance.
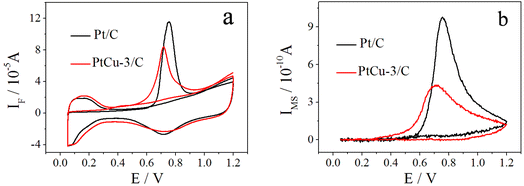 | ||
| Fig. 5 CO-stripping CVs (a) in 0.1 M HClO4 and corresponding MSCVs (b) for m/z = 44 of the CO stripping on Pt/C and PtCu-3/C; scan rate = 10 mV s−1, t = 25 °C. | ||
3.3 Potentiodynamic ethanol oxidation
Simultaneously recorded CVs, and m/z = 29 and 44 MSCVs for the ethanol oxidation on Pt/C and PtCu-3/C catalysts in 0.1 M HClO4 + 0.1 M EtOH solution are shown in Fig. 6. The faradaic signal on EOR has subtracted the background signal in 0.1 M HClO4 to obtain complete EOR current (Fig. 6a and b). The mass signals of m/z = 29 and 44 represent acetaldehyde and CO2, respectively. By the way, since the signal of m/z = 44 corresponds to the ion current for [CO2+] and [CH3CHO+], a pure [CO2+] signal was obtained by eliminating the interference of [CH3CHO+] fragment signal from the initial signal of m/z = 44 (Fig. 6c and d). The faradaic current for EOR on the Pt/C is slightly higher compared to that on the PtCu-3/C, and the peak potential for EOR on PtCu-3/C is slightly lower than that on Pt/C. Fig. 6e and f show a simultaneous increase of the Faraday and ion currents of m/z = 29 which correspond to the defragmentation of acetaldehyde molecule in [CHO+], indicating that the acetaldehyde is one of the main products during EOR. Fig. 6c and d display that the CO2 yield on PtCu-3/C during EOR is obviously higher than that on Pt/C, implying the significant effect of Cu for the breaking of C–C bond.35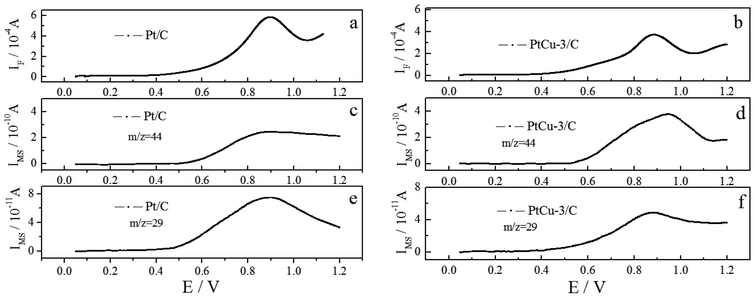 | ||
| Fig. 6 Simultaneously recorded CVs and MSCVs for m/z = 29, 44 for the oxidation of ethanol on Pt/C and PtCu-3/C in 0.1 M HClO4 + 0.1 M EtOH solution; scan rate = 10 mV s−1. | ||
Acetic acid, one of the main products during EOR is determined by calculating the difference between the measured faradaic current and the acquired partial currents for ethanol oxidation to CO2 and CH3CHO. As already mentioned, this calculation is based on the assumption that CO2, acetaldehyde, and acetic acid are the main production during EOR. Table 1 shows the current efficiencies of CO2, acetaldehyde, and acetic acid calculated by using the eqn (1), (3) and (5), respectively. As shown in Table 1, the Pt/C has lower average current efficiencies for CO2 and CH3COOH and higher average current efficiency for CH3CHO compared with PtCu-3/C. The superior faradaic current on Pt/C can be attributed to higher productions of CH3CHO and CH3COOH. Here, the current efficiency of CO2 on Pt/C is somewhat different from the previous study,32 because of the difference of the catalyst synthesis method. The fact that the current efficiency of CO2 on the PtCu-3/C is remarkably higher than Pt/C demonstrated that the presence of Cu lead to higher CO2 current efficiency, indicating PtCu-3/C with high-density of surface defects caused by acid treatment can significantly enhances the C–C bond cleavage of ethanol than Pt/C.35
| Catalysts | Aq(CO2) (%) | Aq(CH3CHO) (%) | Aq(CH3COOH) (%) |
|---|---|---|---|
| Pt/C | 7.2 | 27.3 | 65.5 |
| PtCu-3/C | 11.7 | 13.6 | 74.7 |
3.4 Potentiostatic ethanol oxidation
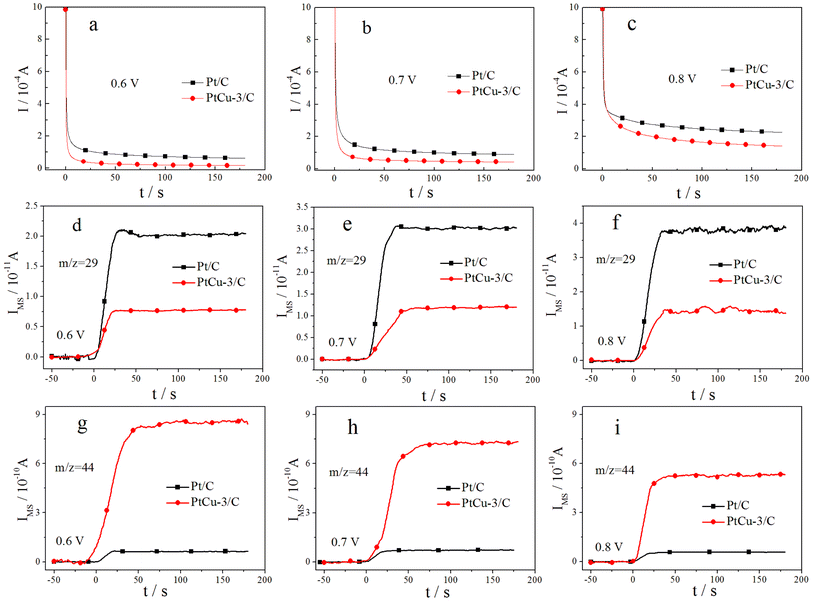
More direct information on the EOR activity of Pt/C and PtCu-3/C catalysts comes from quantitative potentiostatic electrochemical measurements, evaluating the EOR activity of these catalysts in 0.1 M ethanol solution. Fig. 7 shows faradaic and ion current transients, following CO2 formation (m/z = 44) and CH3CHO formation (m/z = 29) in 0.1 M HClO4 + 0.1 M EtOH solution after a potential step from 0.05 V to the respective reaction potential. The investigated reaction potentials include 0.6, 0.7, and 0.8 V at room temperature. The steady-state faradaic current density increases with increasing the reaction potential on Pt/C and PtCu-3/C catalysts. The faradaic current on Pt/C is higher than on PtCu-3/C at all reaction potentials because of the faster dehydrogenation of ethanol on Pt/C that has higher Pt contents.To analyze the EOR product distribution on the Pt/C and PtCu-3/C catalysts in detail, the current efficiencies for CO2, CH3CHO and CH3COOH formation in 0.1 M HClO4 + 0.1 M EtOH solution at different potentials 3 min after the potential step were calculated and compiled in Table 2. As seen in Table 2, acetaldehyde and acetic acid are the majority products in the EOR at the investigated reaction potentials. The current efficiencies for CO2 and CH3CHO formation decrease with increasing the reaction potential on two catalysts, while that for acetic acid formation increase correspondingly. Here, the higher production of acetic acid on the PtCu-3/C catalyst can be interpreted by increasing of OH adsorption due to surface effects produced by chemical dealloying of Pt–Cu alloy, making re-adsorption and further oxidation of acetaldehyde more effective on the PtCu-3/C catalyst than on Pt/C. Especially, the CO2 current efficiency is 8.4% for Pt/C, and 18.7% for PtCu-3/C at the reaction potential of 0.6 V. In addition, the CO2 current efficiency on the PtCu-3/C catalyst is much higher than on the Pt/C catalyst at each of the investigated reaction potentials. These results above further prove the ability of Cu for the C–C bond cleavage.
| Pt/C | PtCu-3/C | |||||
|---|---|---|---|---|---|---|
| V vs. RHE | 0.6 | 0.7 | 0.8 | 0.6 | 0.7 | 0.8 |
| Aq(CO2) (%) | 8.4 | 6.3 | 4.1 | 18.7 | 14.2 | 9.6 |
| Aq(CH3CHO) (%) | 38.6 | 31.6 | 25.7 | 32.8 | 23.1 | 19.8 |
| Aq(CH3COOH) (%) | 51.7 | 63.4 | 72.4 | 48.5 | 62.7 | 70.6 |
4. Conclusions
Carbon-supported Pt–Cu alloy electrocatalyst was synthesized by the microwave-polyol method following acid-treatment. The physical characterization of the electrocatalyst was carried out by XRD, ICP-OES and TEM. The XRD patterns showed crystalline nanostructured material and illustrated that Pt–Cu alloy was formed. The uniform dispersion of the synthesized catalyst nanoparticles on the carbon black support together with the narrow size particle distribution (3.04 and 2.85 nm for Pt/C and PtCu-3/C, respectively) was testified.The PtCu-3/C catalyst possesses the obviously higher CO2 current efficiency (11.7%) than the Pt/C catalyst (7.2%) in the potentiodynamic EOR measurements. The potentiostatic EOR measurements on the synthesized electrocatalysts exhibited a higher kinetics in the potential range from 0.6 V to 0.8 V (vs. RHE) on Pt/C compared to PtCu-3/C because of the faster dehydrogenation of ethanol on Pt/C. POEMS results showed that production of CO2 on PtCu-3/C during EOR is higher than that on Pt/C. After calibration of m/z = 44 mass signal, the CO2 current efficiencies for Pt/C and PtCu-3/C up to 8.4% and 18.7%, respectively. These results suggested that the presence of Cu not only accelerates the oxidation of CO to CO2 by providing more OH species due to the surface effects produced by chemical dealloying of Pt–Cu alloy, but also enhances the C–C bond cleavage, producing more CO2 for ethanol electrooxidation. Nonetheless the faradaic current peak on Pt/C was still higher than on PtCu-3/C because of the higher amount of platinum in the Pt/C catalyst. Furthermore, the onset and peak potential during the EOR on PtCu-3/C do not show obvious advantages than that on Pt/C. However, the addition of co-metal may help enhancing electrocatalytic performances.
Author contributions
Kyong-Sik Ju: conceptualization, methodology, investigation. In-Ho Jang: investigation. Yong-A Choe: writing – original draft. Song-Chun Ri, Hyon-Tae Pak: experiment. Su-Ok Hong: writing – review & editing.Conflicts of interest
There are no conflicts to declare.Acknowledgements
This work was supported by National Natural Science Foundation of China (Grant No. 21373072, and 51321061) and National Committee of Science and Technology in DPR Korea.References
- N. S. Marinkovic, M. Li and R. R. Adzic, Top. Curr. Chem., 2019, 377:11, 1–39 Search PubMed.
- Y. Qu, Y. Gao, L. Wang, J. Rao and G. Yin, Chem.–Eur. J., 2016, 22, 193–198 CrossRef CAS PubMed.
- P. G. Corradini and J. Perez, J. Solid State Electrochem., 2018, 22, 1525–1537 CrossRef CAS.
- N. S. Nia, A. Martucci and G. Granozzi, et al., Electrochim. Acta, 2019, 304, 80–86 CrossRef.
- S. Thilaga, S. Durga, V. Selvarani, S. Kiruthika and B. Muthukumaran, Ionics, 2018, 24, 1721–1731 CrossRef CAS.
- M. R. Ayats, O. G. Villafuerte, G. García, M. S. Vicedo, E. Pastor and M. V. M. Huerta, Appl. Catal., B, 2018, 237, 382–391 CrossRef.
- H. M. Liu, J. H. Li, L. J. Wang, Y. W. Tang, B. Y. Xia and Y. Chen, Nano Res., 2017, 10(10), 3324–3332 CrossRef CAS.
- A. B. Delpeuch, T. Asset, M. Chatenet and C. Cremers, Fuel Cells, 2015, 15, 352–360 CrossRef.
- T. Iwasita, R. Dalbeck, E. Pastor and X. Xia, Electrochim. Acta, 1994, 39, 1817–1823 CrossRef CAS.
- C. W. Xu, P. K. Shen and Y. L. Liu, J. Power Sources, 2007, 164, 527–531 CrossRef CAS.
- Q. Wang, G. Q. Sun, L. H. Jiang, Q. Xin, S. G. Sun, Y. X. Jiang, S. P. Chen, Z. Jusys and R. J. Behm, Phys. Chem. Chem. Phys., 2007, 9, 2686–2696 RSC.
- H. Ishitobi, Y. Ino and N. Nakagawa, Int. J. Hydrogen Energy, 2017, 42, 26897–26904 CrossRef CAS.
- S. Ghosh and H. Remita, et al., J. Mater. Chem. A, 2015, 3, 9517–9527 RSC.
- F. Colmati, E. Antolini and E. R. Gonzalez, Appl. Catal., B, 2007, 73, 106–115 CrossRef CAS.
- R. Crisafulli, R. Antoniassi, A. O. Neto and E. Spinace, Int. J. Hydrogen Energy, 2014, 39, 5671–5677 CrossRef CAS.
- F. E. Lopez-Suarez and C. T. Carvalho-Filho, et al., Int. J. Hydrogen Energy, 2015, 40, 12674–12686 CrossRef CAS.
- H. Wang, Q. P. Zhao and Q. Ma, Ionics, 2015, 21, 1703–1709 CrossRef CAS.
- R. Rizo, D. Sebastián, M. J. Lázaro and E. Pastor, Appl. Catal., B, 2017, 200, 246–254 CrossRef CAS.
- M. A. R. Queiroz and J. Ribeiro, Catalysts, 2019, 9(277), 1–16 Search PubMed.
- M. Wang, J. Chen, Z. Fan, H. Tang, G. Deng and D. He, et al., Carbon, 2004, 42, 3257–3260 CrossRef CAS.
- V. D. Colle, A. Berna, G. T. Filho, E. Herrero and J. M. Feliu, Phys. Chem. Chem. Phys., 2008, 10, 3766–3773 RSC.
- F. I. Pires, P. G. Corradini, V. A. Paganin, E. Antolini and J. Perez, Ionics, 2013, 19, 1037–1045 CrossRef CAS.
- Y. Hu, A. Zhu, Q. Zhang and Q. Liu, Int. J. Hydrogen Energy, 2016, 44, 11359–11368 CrossRef.
- R. M. Altarawneh and P. G. Pickup, J. Power Sources, 2017, 366, 27–32 CrossRef CAS.
- L. Rao, Y. X. Jiang, B. W. Zhang, Y. R. Cai and S. G. Sun, Phys. Chem. Chem. Phys., 2014, 16, 13662–13671 RSC.
- E. H. Fontes, S. G. da Silva, E. V. Spinace, A. O. Neto and R. F. B. de Souza, Electrocatal, 2016, 7, 297–304 CrossRef CAS.
- J. Tayal, B. Rawat and S. Basu, Int. J. Hydrogen Energy, 2011, 36, 14884–14897 CrossRef CAS.
- M. Li, D. A. Cullen, K. Sasaki, N. S. Marinkovic, K. More and R. R. Adzic, J. Am. Chem. Soc., 2013, 135, 132–141 CrossRef CAS PubMed.
- Y. T. Qu, L. Wang, C. Li, Y. Z. Gao, J. K. Sik, J. C. Rao and G. P. Yin, Int. J. Hydrogen Energy, 2017, 42, 228–235 CrossRef CAS.
- M. Ammam, L. E. Prest, A. D. Pauric and E. B. Easton, J. Electrochem. Soc., 2012, 159, 195–200 CrossRef.
- M. Z. Ghavidel and E. B. Easton, Catalysts, 2015, 5, 1016–1033 CrossRef CAS.
- K. S. Ju, S. N. Pak and C. N. Ri, et al., Chem. Phys. Lett., 2019, 727, 78–84 CrossRef CAS.
- M. Ammam and E. B. Easton, J. Power Sources, 2013, 222, 79–87 CrossRef CAS.
- M. M. Magalhães and F. Colmati, J. Braz. Chem. Soc., 2014, 25, 1317–1325 Search PubMed.
- M. Huang, Y. Jiang, C. Jin, J. Ren, Z. Zhou and L. Guan, Electrochim. Acta, 2014, 125, 29–37 CrossRef CAS.
- J. Maya-Cornejo, R. C. Cerritos, D. Sebastian, J. L. Garcia, L. G. Arriaga, A. S. Arico and V. Baglio, Int. J. Hydrogen Energy, 2017, 42, 27919–27928 CrossRef CAS.
- M. X. Gong, X. Jiang, T. Y. Xue, T. Y. Shen, L. Xu, D. M. Sun and Y. W. Tang, Catal. Sci. Technol., 2015, 5, 5105–5109 RSC.
- R. G. C. S. dos Reis and F. Colmati, J. Solid State Electrochem., 2016, 20, 2559–2567 CrossRef CAS.
- K. Wang, R. Sriphathoorat, S. Luo, M. Tang, H. Du and P. K. Shen, J. Mater. Chem. A, 2016, 4, 13425–13430 RSC.
- Y. Z. Gao, H. Tsuji, H. Hattori and H. Kita, J. Electroanal. Chem., 1994, 372, 195–200 CrossRef CAS.
- H. Wang, Z. Jusys and R. J. Behm, J. Power Sources, 2006, 154, 351–359 CrossRef CAS.
- G. Tremiliosi-Filho, E. R. Gonzalez, A. J. Motheo, E. M. Belgsir, J. M. Leger and C. Lamy, J. Electroanal. Chem., 1998, 444, 31–39 CrossRef CAS.
- E. Antolini, F. Colmati and E. R. Gonzalez, J. Power Sources, 2009, 193(2), 555–561 CrossRef CAS.
- W. J. Zhoua, S. Q. Songa, W. Z. Lia, G. Q. Suna, Q. Xina, S. Kontoub, K. Poulianitisb and P. Tsiakarasb, Solid State Ionics, 2004, 175, 797–803 CrossRef.
- K. Zhang, H. Xu, B. Yan, J. Wang, Z. Gu and Y. Du, Appl. Surf. Sci., 2017, 425, 77–82 CrossRef CAS.
- J. F. Gomes, D. Profeti and L. J. Deiner, ChemElectroChem, 2014, 1, 655–662 CrossRef.
- Z. Y. Zhou, Z. Z. Huang, D. J. Chen, Q. Wang, N. Tian and S. G. Sun, Angew. Chem., Int. Ed., 2010, 49, 411–414 CrossRef CAS PubMed.
| This journal is © The Royal Society of Chemistry 2023 |

