 Open Access Article
Creative Commons Attribution 3.0 Unported Licence
Phonon transport in Janus monolayer siblings: a comparison of 1T and 2H-ISbTe
Viet-Ha Chu a,
Tien-Ha Le
 b,
Truong-Tho Phamc and
Duc-Long Nguyen
 *cd
*cd
aDepartment of Physics, TNU-University of Education, Thai Nguyen, 250000, Vietnam
bInstitute of Sciences and Technology, TNU-University of Sciences, Thai Nguyen, Vietnam
cLaboratory of Applied Physics, Science and Technology Advanced Institute, Van Lang University, Ho Chi Minh City, Vietnam. E-mail: nguyenduclong@vlu.edu.vn
dFaculty of Applied Technology, School of Technology, Van Lang University, Ho Chi Minh City, Vietnam
First published on 1st February 2023
Abstract
In the last decade, two-dimension materials with reduced symmetry have attracted a lot of attention due to the emerging quantum features induced by their structural asymmetry. Two-dimensional Janus materials, named after the Roman deity of beginnings and endings who has two faces, have a structure with broken mirror symmetry because the two sides of the material have distinct chemical compositions. Extensive study has been undertaken on phonon transport for Janus monolayers for their strong applicability in thermoelectrics compared to their parent material, while Janus materials with the same space group but a distinct crystal protype have received very little attention. Using first-principles calculations and the Boltzmann transport equation accelerated by a machine learning interatomic potential, we explore the phonon transport of 1T and 2H-ISbTe. ISbTe possesses significant intrinsic phonon–phonon interactions, resulting in a low lattice thermal conductivity, as a result of its covalent bonding and low elastic constants. A thorough examination of phonon group velocity, phonon lifetime, and heat carrier identification reveals that 2H has a low lattice thermal conductivity of 1.5 W mK−1, which is 2.3 times lower than its 1T sibling. This study demonstrates Janus ISbTe monolayers have extensive physical phenomena in their thermal transport characteristics, which might provide a new degree of control over their thermal conductivity for applications such as thermal management and thermoelectric devices.
1 Introduction
By allowing the transformation of waste heat into electricity, thermoelectric (TE) materials are viewed as playing a crucial role in meeting the current worldwide push for green and sustainable energy.1–4 There have been multiple discoveries of extremely efficient bulk TE materials thanks to the decade of continued study into thermoelectrics.5–11 Theoretically, increasing the TE figure of merit (ZT) by alloying, doping, or nanostructuring is the most effective way to improve the performance of TE materials.12 By definition, ZT = S2σT/κ, where S is the Seebeck coefficient, σ is the electrical conductivity, κ is the overall thermal conductivity (a sum of electronic (κe) and lattice (κL) contributions), and T is the absolute temperature. The potential of low-dimensional materials has attracted a lot of attention in this field because of the significance of nanostructuring in hindering lattice heat transfer in bulk materials. Low lattice thermal conductivities at room temperature have been reported for a number of two-dimensional (2D) materials, including stanene,13 phosphorene,14 MoS2, MoSe2,15 and WSe2.16When it comes to the potential applications of the aforementioned 2D materials, transition metal dichalcogenides (2D-TMDs) stand out because of their distinctive structure and semiconducting characteristics. These less complex compounds, including SnS2, SnSe2 and SnSe,17,18 combine chemical stability, low toxicity, and earth abundance to potentially produce high thermoelectric performance 2D materials. Janus monolayers, in which the chalcogen atoms in each layer are bonded to atoms of a different element, are a more sophisticated type of 2D-TMD structure that are the subject of extensive research in this field.19,20 Because of the existence of two distinct chalcogen surfaces, Janus monolayers of TMDs are so named after the Roman god of transitions as they are unable to sustain out-of-plane mirror symmetry. When compared to their classical counterparts, Janus monolayers have a number of benefits. These include the lack of inversion and mirror symmetry, the presence of a vertical enormous polarization field, and a whole new set of characteristics. Electronics, optoelectronics, and piezoelectronics are only a few of the areas where Janus monolayers have been proposed for use. Regarding thermal transport, it has been predicted that the lattice thermal conductivities of Janus MoSSe/SnSSe/PtSSe 2D-TMDs will be much lower than those of the MoS2/SnS2/PtS2 monolayers.21–23 These results are consistent with the common knowledge that a more complicated unit cell results in greater phonon scattering and a lower thermal conductivity. Specifically, Guo et al. estimated the thermal conductivity of MoSSe monolayers by solving the phonon Boltzmann equation in the single-mode relaxation time approximation, and found that it is intermediate between that of MoS2 and MoSe2 monolayers.21 The lattice thermal conductivity of the Janus SnSSe monolayer at room temperature is ≈1.5 times lower than SnS2, according to first-principles calculations by Liu et al.22 Patel et al. found that Janus WSSe and WSTe monolayers had much lower lattice thermal conductivities than their parent compound WS2 monolayers.24 The thermal transport of 2D Janus materials with the same symmetry but a different crystal prototype has received surprisingly little attention from researchers. There is significant scientific interest in elucidating the thermal characteristics of Janus monolayers since solving these issues might have far-reaching implications for the use of Janus 2D materials in the future. We investigate the thermal conductivity of the lattice in two Janus monolayers of ISbTe that share the same space group P3m1, 2H-ISbTe and 1T-ISbTe. Due to its lower group velocity and shorter phonon lifetime, we found that 2H-ISbTe has a lattice thermal conductivity that is just half that of its sibling.
The remaining parts of the article are structured as described below. In the following section, the computational details of the electronic structures, and electron and phonon transports are presented. In the third part, we will discuss the ISbTe monolayer's elastic characteristics, electronic structures, and phonon transports. In the final part of this article, the fourth segment, we will provide our conclusions.
2 Computational methods
The electronic structures of ISbTe monolayers were performed using density functional theory.25,26 The exchange and correlation interactions are treated using the Perdew–Burke–Ernzerhof (PBE) form of the generalized gradient approximation27 as implemented in Quantum ESPRESSO.28–30 The kinetic energy cutoffs for the wave functions and charge density are 40 Ry and 320 Ry, respectively. We utilised a 15 Å vacuum layer in the z direction so that there would be no contact between the monolayers when we applied periodic boundary conditions. Atoms and lattices were relaxed according to the Hellman–Feynman forces using the conjugate gradient method during structural optimization. This process continued until the atomic forces were reduced to a value that was lower than 0.001 eV Å−1. The first Brillouin zone (BZ) was sampled with 13 × 13 × 1 Monkhorst–Pack k-point grid.31 The Phonopy code32 is utilised in the calculation of phonon dispersion relations as well as harmonic force constants. Through the use of the MLIP software,33 moment tensor potentials, often known as MTPs, are trained to assess phononic properties. Simulations of ab initio molecular dynamics (AIMD)34 are run with a time step of 1 ps for 5 × 5 × 1 supercells with k-point mesh 3 × 3 × 1. The preparation of the training sets necessary for the formation of MTPs is accomplished by running two independent AIMD simulations, one from 0 to 200 K and the other from 200 to 700 K for 1000 time steps each. Following each individual calculation, a subsample of 1800 trajectories was selected for inclusion in the whole training set while the other 200 subsamples are used for the test set. We then used the trained MTPs to construct anharmonic third-order interatomic force constants by calculating for 5 × 5 × 1 supercells without imposing any cutoff pair-distance (which required force calculations for 1899 structures with 75 atoms for both cases 2H and 1T-ISbTe). Direct solution of linearized phonon Boltzmann equation35 together with the single mode relaxation time approximation (RTA) with q-point sampling meshes 101 × 101 × 1 are used to calculate the lattice thermal conductivity with the Phono3py package.36 In order to keep the rotational symmetry of free space intact, the second-order IFCs are corrected using the Hiphive package,37 which ensures that the out-of-plane (ZA) branch is strictly quadratic around the Γ point. The Born–Huang38 sets of linear constraints, commonly known as sum rules, are used by the Hiphive implementation to impose rotational symmetry on the Cartesian representation of IFCs. It should be kept in mind that the z-coordinate of the unit cell length affects the computed lattice thermal conductivities for a 2D material. The calculated result needs to be multiplied by the factor Ld/d, where Ld is the length of the unit cell along the z-axis and d is the sum of the 2D material's thickness, h, and the van der Waals radii of the outermost atoms of the monolayer.3 Main results and discussion
The Janus monolayer ISbTe, unlike ordinary 2H-TMD materials, has no reflection symmetry with regard to the centre Sb atoms since the outermost atom has been replaced. the crystal structures of the 1T and 2H-ISbTe monolayers are shown in Fig. 1. 1T-ISbTe has a trigonal omega-derived structured and crystallizes in the trigonal P3m1 space group. The monolayer consists of one ISbTe sheet oriented in the z direction. Sb is bonded to three equivalent Te and three equivalent I atoms to form edge-sharing SbTe3I3 octahedra. All dSb–Te bond lengths are 3.01 Å. All dSb–I bond lengths are 3.22 Å. Te atoms are bonded in a distorted T-shaped geometry to three equivalent Sb atoms. Iodine atoms are bonded in a distorted T-shaped geometry to three equivalent Sb atoms. The calculated lattice constant of 1T-ISbTe is 4.32 Å, with the shown orientation, Te atoms located on top, Sb atoms at the centre, and I atoms at the bottom forming a single layer thickness of 3.71 Å. A summary of the basic crystal structures of the 2 phases of ISbTe is shown in Table 1. On the other hand the 2H-ISbTe has a similar 2H-TMD crystal structure, it is a molybdenite-derived structured and crystallizes in the trigonal P3m1 space group. Sb atoms are bonded to three equivalent Te and three equivalent I atoms to form distorted edge-sharing SbTe3I3 pentagonal pyramids. All dSb–I bond lengths are 3.28 Å. Te atoms are bonded in a distorted T-shaped geometry to three equivalent Sb atoms. I atoms are bonded in a 3-coordinate geometry to three equivalent Sb atoms, as summarized in Table 1.| ISbTe | a (Å) | dSb–Te(Å) | dSb–I(Å) | h(Å) | Egap (eV) |
|---|---|---|---|---|---|
| 1T | 4.322 | 3.01 | 3.22 | 3.710 | 1.15 |
| 2H | 4.192 | 3.02 | 3.28 | 4.018 | 1.21 |
To further examine the bonding features of Sb–I and Sb–Te, the electron localization function (ELF) for ISbTe monolayers has been determined. The ELF typically indicates the following: the negative position, depicted in blue, is the electron divergence region, where electrons are lost, and the positive position, depicted in yellow, is the electron convergence region, where electrons are gained.39 The covalent bond electrons converge toward the centre of the two atoms, whereas the ionic bond electrons are biassed toward one side. Fig. 1(e and f) depict the ELF along the (110) plane, where ELF values range from 0 to 1. The results indicate that the ELF values of both case 1T and 2H-ISbTe exhibit similar characteristics. At the atomic sites, the electron localization force (ELF) is high, while in the bonding regions it is lower, the electron localises between Sb and Te with an ELF value of 0.695, whereas the value of the region between Sb and I atoms is only 0.43. In the case of covalent bonds, it is known that the bonding electrons are delocalized, whereas lone-pair electrons are concentrated near to the atoms. Sb–Te and Sb–I are thus bonded by covalent bonds, with Sb–I bonds being weaker. Strong covalent bonds can result in significant intrinsic phonon–phonon scattering, which in turn can result in low lattice thermal conductivities in ISbTe monolayers.
To determine whether or not the ISbTe monolayers are able to maintain their mechanical integrity, we calculate their elastic constants by fitting the strain-energy relationship as described in ref. 40. Because of the hexagonal symmetry, there are 2 independent elastic constants denoted by C11 and C12 and C66 = (C11 − C12)/2 to form the stiffness matrix:
Table 2 shows the elastic constants Cij, Young's modulus Y2D, shear modulus G2D in units of (N m−1) and the dimensionless Poisson's ratio ν of 1T and 2H-ISbTe. The 2D Young's moduli (in-plane stiffness) for strains in the Cartesian [10] and [01] directions are (here C11 = C22)41
 | (1) |
| ISbTe | C11 = C22 | C12 | C66 = G2D | Y2D[10] = Y2D[01] | ν[10] = ν[01] |
|---|---|---|---|---|---|
| 1T | 27.038 | 7.791 | 9.624 | 24.793 | 0.288 |
| 2H | 29.090 | 15.265 | 6.913 | 21.080 | 0.525 |
The corresponding dimensionless Poisson's ratios are
 | (2) |
| G2D = C66 | (3) |
We found C11 = 27.038 N m−1, C12 = 7.791 N m−1 and C66 = 9.624 N m−1 for 1T-ISbTe which are in accordance with the Born requirements for the mechanical stability of the material:41 C11 > 0, C11 > |C12| and C66 > 0. The values are 29.090 N m−1, 15.265 N m−1 and 6.913 N m−1 for 2H-ISbTe as summarized in Table 2. The result are in good agreement with literature results42 which demonstrates the accuracy of our present calculations. The Young's modulus’ for 1T and 2H-ISBTe are 24.793 and 21.080 N m−1 respectively which are smaller than that in Janus MoXY (X/Y = S, Se, and Te) (102–134) N m−1 (ref. 21 and 43) and comparable to BiXY (X = S, Se, Te and Y = F, Cl, Br, I).44 As a result of their low Young's modulus’, ISbTe monolayers may readily undergo significant in-plane strain engineering, which is crucial for fine-tuning the material's physical characteristics through strain. The Poisson's ratios ν of Janus ISbTe monolayers are isotropic, the calculated values are 0.288 and 0.525 for 1T and 2H-ISbTe respectively.
The electronic band structures of Janus 1T and 2H-ISbTe are shown in Fig. 2. As we can clearly see, these sibling Janus monolayers are indirect band gap semiconductors with the valence band maximum (VBM) located in the middle of K–Γ. While 1T-ISbTe has the conduction band minimum (CBM) located at the Γ point to form an indirect band gap of 1.15 eV (at the PBE accuracy level), in contrast 2H-ISbTe has its CBM located at the K point to form an indirect band of 1.21 eV, which is somewhat higher than that of the 1T structure and in good agreement with previous theoretical studies.45,46 There is an additional band valley between Γ and M, which is visible in both cases and may contribute to better thermoelectric performance.47 While 2H-ISbTe has a somewhat lower band valley, the 1T-ISbTe valley is almost degenerate with the VBM. The valley in 1T-ISbTe enables it to have a more pronounced density of states (DOS) peak around the Fermi level than 2H-ISbTe, where the p-orbital is prominent.
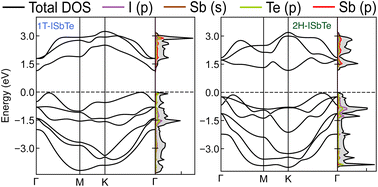 | ||
| Fig. 2 Electronic band structures and projected density of states of Janus 1T (left) and 2H-ISbTe (right). The Fermi level is set to the valence band maximum (VBM). | ||
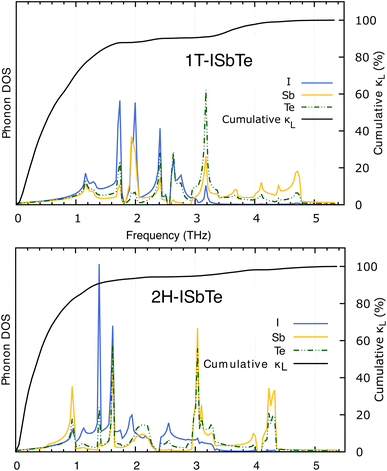
We now discuss the lattice dynamics of these two Janus systems. At first glance, the phonon dispersion of 1T-ISbTe shows no imaginary frequency modes indicating its dynamical stability as shown in Fig. 3. The computed phonon dispersion curves of the trained machine-learning interatomic potentials are also displayed on the same figure to demonstrate the trained model's precision. With the exception of a few unavoidable differences, the two curves almost coincide, illustrating the precision of the trained MLIP. Having 3 atoms in a primitive cell, the phonon dispersion of 1T-ISbTe consists of 3 acoustic and 6 optical phonon branches. The acoustic branch in the z-axis (ZA) is quadratic, which is typical of 2D materials,48–50 whereas the LA and TA branches are linear in the vicinity of the Γ point.
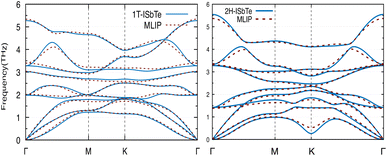 | ||
| Fig. 3 Phonon dispersion curves of 1T-ISbTe (left) and 2H-ISbTe (right) monolayers. The solid lines and dash lines represent the DFT and MLIP results respectively. | ||
The maximum phonon mode frequency of 1T-ISbTe is 5.26 THz, which is somewhat lower than that of 2H-ISbTe. Acoustic phonon modes of 1T-ISbTe span up to 1.85 THz and are nearly entangled with the optical modes at the K point, whereas the acoustic modes of 2H-ISbTe span to the same values and are substantially separated from the optical modes. At the K point, the ZA mode of 2H-ISbTe exhibits a softening characteristic. The first optical modes of 1T-ISbTe at Γ degenerate at 1.98 THz, which is higher than those of 2H-ISbTe at 1.42 THz. These variations will be discussed in view of their potential to provide insight on the lattice thermal conductivity behaviour in these two systems. In both systems, the lattice thermal conductivity may benefit from the wide dispersion of the two highest optical modes.
Lattice thermal conductivity can be obtained as follows36
 | (4) |
 | (5) |
in which Γλ(ω) takes the form analogous to the Fermi golden rule:
 | (6) |
The lifetimes of phonons are directly related to the κL. Therefore, the calculated phonon lifetime as a function of frequencies is shown in Fig. 4. The phonon modes are shown as black dots on a coloured background, with regions of high phonon mode density indicated in blue and low density in white. In 1T-ISbTe, from 0 THz onwards, the phonon lifetime rapidly decreases with frequency, with an intermediate increase and a drop between 1 THz and 1.7 THz. In the range of 1.7–3.4 THz, the average phonon lifetime is around 2.5 picoseconds. We can see from the phonon lifetime distribution that 1T-ISbTe has very low phonon lifetimes, the maximum phonon lifetime of 1T-ISbTe at 300 K is determined to be 276.8, 240.4, and 112.5 ps for ZA, LA, and TA modes, respectively, whereas the mean values are 16.7, 13.5, and 7.7 ps for the aforementioned modes. 75% of the phonon lifetime of the ZA, LA, and TA modes of 1T-ISbTe is less than 9.1, 12.3, and 7.86 ps, respectively. The mean value of phonon lifetime for the optical modes is only 2.08 ps. In 1T-ISbTe, the κL is lowered because the phonons have short lifetimes, leading to increased phonon–phonon scattering rates. The longest phonon lifetimes are seen between 0.8 and 1.7 THz. In accordance with the phonon DOS presented in Fig. 5, the phonon lifetimes are concentrated in the 0.8–1.7 THz, 1.7–3.4 THz, and 4.4–4.8 THz ranges. Since there are several phonon modes concentrated at these epoch-defining points (blue or white-green backgrounds), phonon annihilation is the end outcome of the massive phonon–phonon scattering or Umklapp processes that take place there. Three acoustic modes mostly contribute to the total κL, with the LA phonon mode contributing the most at 33.5%, followed by TA and ZA at 29.9% and 24.4%, respectively. It is important to note that the 8th optical mode contributes up to 7.6% of the κL, which is uncommon compared to other thermoelectric materials in which optical modes contribute rarely. This observation is consistent with Fig. 5, which depicts the contribution of the vibration modes of each atom to the κL of the two phases 1T-ISbTe. The behaviour of the large dispersion of high phonon frequencies likewise reflects this completely. In contrast to its sibling 1T, 2H-ISbTe exhibits a distinctive phonon lifetime distribution due to its distinct phonon dispersion property. The LA mode has a maximum phonon lifetime of 597 ps, but the ZA and TA modes have substantially lower lifetimes of 174.7 and 152 ps, respectively. The maximum values appear to be higher than those of the 1T structure, however the mean values of the three acoustic modes are only 8.9, 8.3, and 2.84 ps, which is considerably less than the 1T case. For ZA, LA, and TA modes, 75% of the phonon lifetime is determined to be less than 5.5, 4.8, and 2.0, respectively. The average phonon lifetime of the optical modes of 2H-ISbTe is only 0.79 ps, which is much lower than that of the 1T case, highlighting the distinction between the two structures. This numerical analysis is visibly supported in Fig. 4(b and d) for the two cases, which depicts the substantially lower concentration of phonon lifetime in the 2H case compared to the 1T scenario.
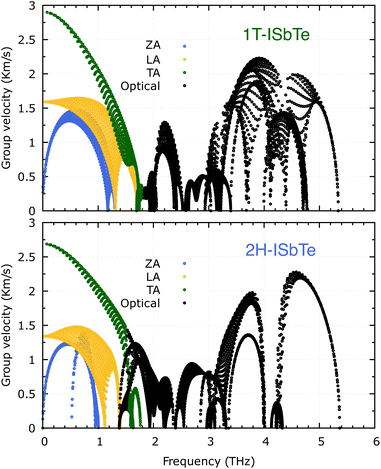
It is also fascinating to examine how phonon lifetime varies across the Brillouin zone across the various phonon branches. As can be seen in Fig. 4(a and c), the phonon lifetime of the three acoustic modes is longest around the Γ point and decreases monotonically as one moves closer to the M and K zone boundaries. Despite sharing certain essential features with 1T-ISbTe in terms of phonon transport, the 2H structure's κL is likely to be substantially lower due to a number of key differences. We start with the similar characteristics, that is the contribution to the total κL coming mostly from the acoustic modes, as shown in Fig. 6 where the LA mode contributes 35.4%, followed by the TA mode and ZA mode with 32% and 24.7%, respectively. It also has a similar distribution of phonon lifetime across the Brillouin zone, where the large values can be found near the zone center and shortening when coming near to the zone boundaries, as shown in Fig. 4. However, the 2H-ISbTe has lower group velocities of the three most important modes, the acoustic ones, with the maximum group velocities of the ZA, LA, and TA modes being 1.39, 1.48 and 2.69 km s−1 as compared to 1.47, 1.65 and 2.90 km s−1 for 1T-ISbTe, respectively (see Fig. 7). Unique compared to its brother, the softening phonon mode ZA near K exhibits an additional waterfall group velocity at around 0.5 THz; this behaviour significantly reduces the overall group velocity in 2H-ISbTe. In both structures, the optical modes exhibit fascinating behaviour, in which their group velocity is equivalent to or greater than that of their acoustic mode, which is rare among 2D materials.51–53 The maximum group velocity for the optical modes of 1T-ISbTe is determined to be 2.23 km s−1, which is even greater than its LA and ZA modes, resulting in a contribution of up to 7.63% to the κL from the 8th optical mode in this structure.
 | ||
| Fig. 6 Phonon mode contribution to the total lattice thermal conductivity of 1T (top) and 2H-ISbTe (bottom). The 8th optical mode's contribution of 1T-ISbTe is shown in red color. | ||
To further explore the heat carrier identity on Janus ISbTe monolayers, we studied the detailed vibration modes and their correlation to the κL. Cumulative lattice thermal conductivity with respect to frequency is defined as:
 | (7) |
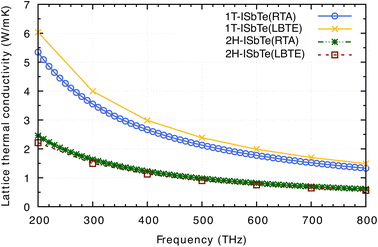
Having all the ingredients to obtain the κL from eqn (4), we can now discuss the differences in the κL between the two structures of interest. Fig. 8 shows the calculated κL of 1T and 2H-ISbTe using the relaxation time approximation (RTA) and direct-solution of phonon Boltzmann equation (LBTE). For 1T-ISbTe, the LBTE is slightly higher than that of RTA and exhibits a κL of 3.55 (4.00) W mK−1 using RTA (LBTE). The 2H-ISbTe result is less sensitive to κL calculation methods, exhibiting values of 1.63 and 1.5 W mK−1 for RTA and LBTE, respectively. The different values of κL in the 2 phases are large at low temperatures and gradually reduce when the temperature increases. Both cases have low isotropic lattice thermal conductivity as compared to other 2D materials such as TMDs54,55 and Janus materials,56,57 and stand among the promising thermoelectric materials in low dimensions.58,59
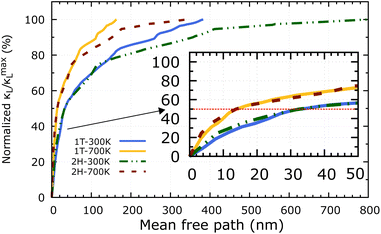
Apart from the phonon spectrum, analysing the distributions of phonon mean free paths (MFPs) can provide us a more complete view of phonon transport. We can learn about the size-dependent thermal transport and the origins of the lattice's low thermal conductivity from these. Fig. 9 shows the cumulative κL as a function of phonon MFPs. When only phonons with an MFP below a specific threshold are used in the calculations, this number represents the hypothetical lattice thermal conductivity. In particular, we focus on the percentage amount of total κL accumulation (normalised to the κmaxL) that can be attributed to phonons with MFPs below the threshold. The 2H-ISbTe and 1T-ISbTe phonon mean free paths are 800 nm and 383 nm, respectively, which is shorter than other monolayer TMDs.55 Significantly, the 50% κL accumulation MFP values at room temperature are 14 nm and 32 nm for 1T and 2H-ISbTe respectively, as shown in the inset of Fig. 9, which allows room to further reduce κL by nanostructuring. To significantly reduce κL below its fundamental values, nanostructures with typical diameters below 14 nm and 32 nm for 1T and 2H-ISbTe, respectively, would be required. We further demonstrate the temperature effect of MFPs by showing that at both 300 K and 700 K, the contribution of phonons with MFPs that allow a 50% reduction in κ − L is found to be about the same. This result suggests that the same amount of effort required for phonon transport at low temperatures may be used when nanostructuring materials to operate at higher temperatures.
Before coming to the conclusion of our work, we would want to explore the significance of the supercell size impact on the convergence κL calculation. As shown in Fig. 10 a small supercell size such as 3 × 3 × 1 or 4 × 4 × 1 for calculating the third order force constants would clearly underestimate the converged values of 2H-ISbTe. At 300 K, the values are 0.77 and 1.32 W mK−1 for 3 × 3 × 1 and 4 × 4 × 1, respectively. The results we have presented use a supercall size of 5 × 5 × 1 which converges nicely with the larger cell 6 × 6 × 1 to avoid slipping into the misleading conclusion of ‘ultralow’ values that the smaller supercell size may demonstrate.
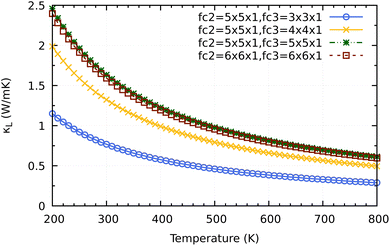 | ||
| Fig. 10 Supercell size influence on the convergence of κL calculations for 2H-ISbTe. Fc2 is the supercell size for second order force constant and fc3 is for the third order force constant. | ||
4 Conclusion
Using first-principles calculations and the Boltzmann transport equation accelerated by machine learning interatomic potential, we investigated the phonon transport characteristics of Janus ISbTe siblings. 2H-ISbTe is found to have a substantially lower κL than 1T-ISbTe. Although the two siblings share a comparable covalent boding and low elastic constant, their phonon group velocity and lifetime distinguish them significantly. Sb atoms are the dominant heat carriers in 2H-ISbTe, whereas I atoms dominate the phonon transport in 1T-ISbTe, as shown by an exhaustive analysis of their phononic properties. In addition, 1T-ISbTe has a peculiar property where its optical modes contribute significantly to κL. Nanostructuring is found to be simpler in 2H-ISbTe than in 1T when the sample size is 32 nm in 2H-ISbTe versus 14 nm in 1T. In addition to shedding light on the behavior of these specific Janus monolayers, our results encourage both the experimental and theoretical development of two-dimensional materials as high-performance thermoelectric materials.Author contributions
Viet-Ha Chu: writing – original draft, methodology. Tien-Ha Le and Truong-Tho Pham: formal analysis, investigation, Duc-Long Nguyen: conceptualization, writing – review & editing, visualization, supervision.Conflicts of interest
The authors declare that they have no conflict of interest.Acknowledgements
This research was funded by Projects B2022-TNA-37 of the Vietnam Ministry of Education and Training. The authors would like to thank Van Lang University for its support. We would like to express our appreciation to Prof. Ching-Ming Wei, Institute of Atomic and Molecular Sciences, Academia Sinica, Taipei, Taiwan for providing us with the computational resources necessary to complete this study.Notes and references
- G. J. Snyder and E. S. Toberer, Nat. Mater., 2008, 7, 105–114 CrossRef CAS PubMed.
- A. Shakouri, Annu. Rev. Mater. Res., 2011, 41, 399–431 CrossRef CAS.
- M. Zebarjadi, K. Esfarjani, M. Dresselhaus, Z. Ren and G. Chen, Energy Environ. Sci., 2012, 5, 5147–5162 RSC.
- J. He and T. M. Tritt, Science, 2017, 357, eaak9997 CrossRef PubMed.
- H. Liu, X. Shi, F. Xu, L. Zhang, W. Zhang, L. Chen, Q. Li, C. Uher, T. Day and G. J. Snyder, Nat. Mater., 2012, 11, 422–425 CrossRef CAS PubMed.
- K. F. Hsu, S. Loo, F. Guo, W. Chen, J. S. Dyck, C. Uher, T. Hogan, E. Polychroniadis and M. G. Kanatzidis, Science, 2004, 303, 818–821 CrossRef CAS PubMed.
- L.-D. Zhao, S.-H. Lo, Y. Zhang, H. Sun, G. Tan, C. Uher, C. Wolverton, V. P. Dravid and M. G. Kanatzidis, Nature, 2014, 508, 373–377 CrossRef CAS PubMed.
- S. I. Kim, K. H. Lee, H. A. Mun, H. S. Kim, S. W. Hwang, J. W. Roh, D. J. Yang, W. H. Shin, X. S. Li and Y. H. Lee, et al., Science, 2015, 348, 109–114 CrossRef CAS PubMed.
- Y. Luo, J. Yang, Q. Jiang, W. Li, D. Zhang, Z. Zhou, Y. Cheng, Y. Ren and X. He, Adv. Energy Mater., 2016, 6, 1600007 CrossRef.
- G. Joshi, X. Yan, H. Wang, W. Liu, G. Chen and Z. Ren, Adv. Energy Mater., 2011, 1, 643–647 CrossRef CAS.
- R. K. Vankayala, T.-W. Lan, P. Parajuli, F. Liu, R. Rao, S. H. Yu, T.-L. Hung, C.-H. Lee, S.-i. Yano and C.-R. Hsing, et al., Adv. Sci., 2020, 7, 2002494 CrossRef CAS PubMed.
- J. R. Sootsman, D. Y. Chung and M. G. Kanatzidis, Angew. Chem., Int. Ed., 2009, 48, 8616–8639 CrossRef CAS PubMed.
- B. Peng, H. Zhang, H. Shao, Y. Xu, X. Zhang and H. Zhu, Sci. Rep., 2016, 6, 1–10 CrossRef PubMed.
- G. Qin, X. Zhang, S.-Y. Yue, Z. Qin, H. Wang, Y. Han and M. Hu, Phys. Rev. B, 2016, 94, 165445 CrossRef.
- C. Sevik, Phys. Rev. B: Condens. Matter Mater. Phys., 2014, 89, 035422 CrossRef.
- W.-X. Zhou and K.-Q. Chen, Sci. Rep., 2015, 5, 1–8 Search PubMed.
- A. Shafique, A. Samad and Y.-H. Shin, Phys. Chem. Chem. Phys., 2017, 19, 20677–20683 RSC.
- J. W. Villanova and S. Barraza-Lopez, Phys. Rev. B, 2021, 103, 035421 CrossRef CAS.
- A.-Y. Lu, H. Zhu, J. Xiao, C.-P. Chuu, Y. Han, M.-H. Chiu, C.-C. Cheng, C.-W. Yang, K.-H. Wei and Y. Yang, et al., Nat. Nanotechnol., 2017, 12, 744–749 CrossRef CAS PubMed.
- J. Zhang, S. Jia, I. Kholmanov, L. Dong, D. Er, W. Chen, H. Guo, Z. Jin, V. B. Shenoy and L. Shi, et al., ACS Nano, 2017, 11, 8192–8198 CrossRef CAS PubMed.
- S.-D. Guo, Phys. Chem. Chem. Phys., 2018, 20, 7236–7242 RSC.
- G. Liu, H. Wang, Z. Gao and G.-L. Li, Phys. Chem. Chem. Phys., 2020, 22(29), 16796–16803 RSC.
- L. Pan, Z. Wang, J. Carrete and G. K. Madsen, Phys. Rev. Mater., 2022, 6, 084005 CrossRef CAS.
- A. Patel, D. Singh, Y. Sonvane, P. Thakor and R. Ahuja, ACS Appl. Mater. Interfaces, 2020, 12, 46212–46219 CrossRef CAS PubMed.
- P. Hohenberg and W. Kohn, Phys. Rev., 1964, 136, B864 CrossRef.
- W. Kohn and L. J. Sham, Phys. Rev., 1965, 140, A1133 CrossRef.
- J. P. Perdew, K. Burke and M. Ernzerhof, Phys. Rev. Lett., 1996, 77, 3865 CrossRef CAS PubMed.
- P. Giannozzi, S. Baroni, N. Bonini, M. Calandra, R. Car, C. Cavazzoni, D. Ceresoli, G. L. Chiarotti, M. Cococcioni and I. Dabo, et al., J. Phys.: Condens. Matter, 2009, 21, 395502 CrossRef PubMed.
- P. Giannozzi, O. Andreussi, T. Brumme, O. Bunau, M. B. Nardelli, M. Calandra, R. Car, C. Cavazzoni, D. Ceresoli and M. Cococcioni, et al., J. Phys.: Condens. Matter, 2017, 29, 465901 CrossRef CAS PubMed.
- P. Giannozzi, O. Baseggio, P. Bonfà, D. Brunato, R. Car, I. Carnimeo, C. Cavazzoni, S. De Gironcoli, P. Delugas and F. Ferrari Ruffino, et al., J. Chem. Phys., 2020, 152, 154105 CrossRef CAS PubMed.
- H. J. Monkhorst and J. D. Pack, Phys. Rev. B: Solid State, 1976, 13, 5188 CrossRef.
- A. Togo and I. Tanaka, Scr. Mater., 2015, 108, 1–5 CrossRef CAS.
- I. S. Novikov, K. Gubaev, E. V. Podryabinkin and A. V. Shapeev, Mach. Learn.: Sci. Technol., 2020, 2, 025002 Search PubMed.
- R. Car and M. Parrinello, Phys. Rev. Lett., 1985, 55, 2471 CrossRef CAS PubMed.
- L. Chaput, Phys. Rev. Lett., 2013, 110, 265506 CrossRef PubMed.
- A. Togo, L. Chaput and I. Tanaka, Phys. Rev. B: Condens. Matter Mater. Phys., 2015, 91, 094306 CrossRef.
- F. Eriksson, E. Fransson and P. Erhart, Adv. Theory Simul., 2019, 2, 1800184 CrossRef.
- M. Born, K. Huang and M. Lax, Am. J. Phys., 1955, 23, 474 CrossRef.
- A. Savin, R. Nesper, S. Wengert and T. F. Fässler, Angew. Chem., Int. Ed. Engl., 1997, 36, 1808–1832 CrossRef CAS.
- M. Topsakal, S. Cahangirov and S. Ciraci, Appl. Phys. Lett., 2010, 96, 091912 CrossRef.
- R. C. Andrew, R. E. Mapasha, A. M. Ukpong and N. Chetty, Phys. Rev. B: Condens. Matter Mater. Phys., 2012, 85, 125428 CrossRef.
- S.-D. Guo, X.-S. Guo, Z.-Y. Liu and Y.-N. Quan, J. Appl. Phys., 2020, 127, 064302 CrossRef CAS.
- L. Dong, J. Lou and V. B. Shenoy, ACS Nano, 2017, 11, 8242–8248 CrossRef CAS PubMed.
- M. J. Varjovi and E. Durgun, Phys. Rev. Mater., 2021, 5, 104001 CrossRef CAS.
- S.-D. Guo, A.-X. Zhang and H.-C. Li, Nanotechnology, 2017, 28, 445702 CrossRef PubMed.
- H.-Q. Xu, G. Xiao, W.-Z. Xiao and L.-L. Wang, Micro Nanostruct., 2022, 170, 207396 CrossRef CAS.
- Y. Tang, Z. M. Gibbs, L. A. Agapito, G. Li, H.-S. Kim, M. B. Nardelli, S. Curtarolo and G. J. Snyder, Nat. Mater., 2015, 14, 1223–1228 CrossRef CAS PubMed.
- C. Lin, S. Poncé and N. Marzari, npj Comput. Mater., 2022, 8, 1–11 CrossRef.
- A. Taheri, S. Pisana and C. V. Singh, Phys. Rev. B, 2021, 103, 235426 CrossRef CAS.
- N. Bonini, J. Garg and N. Marzari, Nano Lett., 2012, 12, 2673–2678 CrossRef CAS PubMed.
- T. Li, P.-H. Du, L. Bai, Q. Sun and P. Jena, et al., Phys. Rev. Mater., 2022, 6, 064009 CrossRef CAS.
- L. Liu, C. Peng, S. Jiang, Z. Feng, G. Zhang, C. Wang, P. Zhang and M. Hu, Mater. Res. Express, 2021, 8, 075007 CrossRef CAS.
- B. Marfoua and J. Hong, ACS Appl. Mater. Interfaces, 2019, 11, 38819–38827 CrossRef CAS PubMed.
- Y. Hong, J. Zhang and X. C. Zeng, J. Phys. Chem. C, 2016, 120, 26067–26075 CrossRef CAS.
- M. Zulfiqar, Y. Zhao, G. Li, Z. Li and J. Ni, Sci. Rep., 2019, 9, 1–7 CrossRef CAS PubMed.
- H. Qin, K. Ren, G. Zhang, Y. Dai and G. Zhang, Phys. Chem. Chem. Phys., 2022, 24, 20437–20444 RSC.
- M. Xiong, Z.-Y. Chen, C.-E. Hu, Y. Cheng and H.-Y. Geng, Mater. Today Commun., 2021, 26, 101995 CrossRef CAS.
- S. S. Naghavi, J. He, Y. Xia and C. Wolverton, Chem. Mater., 2018, 30, 5639–5647 CrossRef CAS.
- X. Chen, Y. Huang, J. Liu, H. Yuan and H. Chen, ACS Omega, 2019, 4, 17773–17781 CrossRef CAS PubMed.
| This journal is © The Royal Society of Chemistry 2023 |


