 Open Access Article
Creative Commons Attribution 3.0 Unported Licence
Microwave assisted sol–gel approach for Zr doped TiO2 as a benign photocatalyst for bismark brown red dye pollutant†
Gorli Divyaa,
G. Jaishreea,
T. Sivarao *a and
K. V. Divya Lakshmib
aDept of Chemistry, Andhra University, Visakhapatnam, 530003, India. E-mail: sivaraoau@gmail.com
bBio Enviro Chemical Solutions, Visakhapatnam, 530003, India
First published on 15th March 2023
Abstract
A microwave supported sol–gel approach was developed in this study to fabricate Zr-doped TiO2 mesoporous nanostructures for efficient photocatalytic activity on bismark brown red (BBR) dye under visible light illumination. Sophisticated analytical techniques such as X-ray diffraction (XRD), X-ray photoelectron spectroscopy (XPS), high resolution transmission electron microscopy (HRTEM), field emission scanning electron microscopy (FESEM) with energy dispersive X-ray spectroscopy (EDX), X-ray fluorescence analysis (XRF), Fourier transform infrared (FT-IR), ultraviolet-visible diffuse reflectance (UV-vis-DRS) spectroscopy and Brunauer–Emmet–Teller (BET) surface area analyses were used to obtain their structural, electrical: optical and spectroscopic characteristics. The analysis results revealed that the developed nanostructures exhibited strong broad absorption in the visible region with good adsorption capacity and thus enhanced photocatalytic performance. The average crystallite size was found to be 12.5 nm (UTO), 6.4 nm (ZT4), and 4.7 nm (ZT4M4) respectively. The nanocatalysts (ZT4M4) showed a decrease in bandgap and particle size with an increase in the surface area of the Zr-TiO2 nanoparticles (119 m2 g−1). In comparison to previous studies on the photocatalytic degradation of BBR dye under visible light irradiation employing Ni–S co-doped (110 min), Cu-doped TiO2 (75 min), etc., ZT4M4 exhibited a remarkable degradation rate of 99% in 50 minutes. This may be due to the hydroxyl radicals being the principle reactive species responsible for the BBR dye oxidative degradation. The present study showed that ZT4M4 was found to be the best photocatalyst for the BBR dye degradation under the optimal conditions.
1 Introduction
When dated back, the heating impact of microwaves was discovered by accident while working on radar applications.1,2 The use of microwave irradiation has progressed as a simple, rapid, and mild synthesis route for producing a wide variety of nanomaterials with perfect control over their morphology and size.3,4 In addition, it has enabled the rapid implementation of novel reactions with broad applications in multiple disciplines of the chemical sciences, such as solid-state chemistry, nanomaterial synthesis,5 nanotechnology,6 and organic synthesis.7 It is an in situ method8 of conversion of energy that provides the advantage of consistent dielectric heating without the consequences of thermal gradients,9 as the heat is generated internally within the particles rather than from external sources.10 It uses fewer chemicals and is therefore considered an environmentally friendly process.11 Due to their lower activation energy and greater diffusion rates, microwaves can minimise processing temperature while creating small particle size, controllable morphology, purity, and homogeneous microstructure.12,13Thus, microwave-assisted synthesis is one of the prospective tools to ameliorate the quality of life in the field of nanoscience and technology, resulting in a substantial advancement in the large-scale synthesis of numerous functional metal oxide nanomaterials with novel structures and properties.14,15 Also, because microwave radiation is so important and involved in making metal oxide nanomaterials, it can be used to make doped semiconductor nanomaterials that are active in visible light.
TiO2 is one of the best semiconductors due to its chemical and biological inertness, high performance under UV light irradiation and long-term photostability.16 Based on the above the application of microwaves has advanced as a simple, quick, and mild synthetic route for creating a wide range of nanomaterials with precise control over their morphology and size3 merits of TiO2, Ding et al. produced TiO2 nanocrystals having anatase phase with identical shape and size.17 Cui et al. created TiO2 nanotubes using a hydrothermal process assisted by microwaves.18 Simonsen et al. used the microwave-assisted sol–gel technique to make TiO2 films, which they then used to study how OH groups affect TiO2's ability to act as a photocatalyst.19 Their research showed that this method makes thin films of TiO2 that are very uniform and do not need a high-temperature heat treatment to crystallise. Unfortunately, TiO2's high photo-generated charge carrier recombination rate and large band gap (3.2 eV) limit it from being employed as a visible-light photocatalyst.20 To overcome the aforementioned drawbacks and improve TiO2's quantum efficiency in the visible range, the electron–hole (e−/h+) recombination and band gap must be lowered by doping TiO2 with non-metal or metal ions. To ameliorate the drawbacks of TiO2, researchers reported the synthesis of metal doped and non-metal doped TiO2 with the assistance of microwave radiation.
In the framework of the present study, microwave assisted sol gel technique was used to fabricate zirconium-doped TiO2. As zirconium is biologically inert, nontoxic and possesses the same valence shell state, valence shell structure and comparable ionic radii as titanium (Zr-0.72 Å, Ti-0.68 Å), which can facilitate the substitutional doping of Ti4+ with Zr4+, which results in reducing the band gap and high efficiency in the segregation of photogenerated charge carriers.21,22 Their porosity results in a enhanced absorption, high surface area, and rapid transfer of contaminants.23 Numerous reports describe the fabrication of Zr-doped TiO2 with enhanced photocatalytic activity by using high calcination temperatures.24,25 Therefore, it is necessary to design a method for generating nanoparticles at low temperatures. For the Zr-doped TiO2 synthesis, we opted a microwave-irradiation method, which has various advantages over traditional heating, such as high thermal homogeneity, quick and selective heating, which will assist in lowering calcination temperatures.26 Various methodologies are employed to characterise the synthesised catalysts.
The degradation of BBR dye was used to evaluate the photocatalytic efficacy of the synthesised nanocatalysts. BBR dye is a negative dye that is persistent in the environment and causes carcinogenicity. It is primarily employed in the leather and textile industries as a colouring agent.26,27 The ecosystem is in grave danger as a result of the discharge of these dyes as washouts into the aquatic environment.
2 Experimental
2.1 Required chemicals and reagents
Tetra butyl ortho titanate Ti(OBu)4 and zirconium nitrate Zr(NO3)2 are the main precursors of titanium and zirconium, and they are used to synthesize Zr-doped and undoped (UTO) TiO2 catalysts. The compounds obtained were AR-Grade E. Merck chemicals (Germany). From High media India the Bismarck brown red an anionic textile dye (pollutant) is obtained. In the reaction procedure, E-Merck (India) nitric acid and Hayman ethanol are utilised. All of the aforementioned compounds were employed without purification, and using deionised water their solutions were freshly prepared.2.2 Synthesis of Zr-doped TiO2
The synthesis process involves two steps:| Power level | Output | Time |
|---|---|---|
| Low | 180 W | 20 min |
| Medium low | 360 W | 20 min |
| Medium | 540 W | 15 min |
| Medium high | 720 W | 15 min |
| High | 900 W | 10 min |
| S. no. | Dopant weight percentages Zr/wt% | Name assigned to catalyst |
|---|---|---|
| 1 | 0.25 | ZT1 |
| 2 | 0.50 | ZT2 |
| 3 | 0.75 | ZT3 |
| 4 | 1.00 | ZT4 |
| 5 | 1.25 | ZT5 |
| S. no. | At different watts | Name assigned to catalyst |
|---|---|---|
| Microwave assisted sol gel synthesized catalyst | ||
| 1 | 180 W | ZT4M1 |
| 2 | 360 W | ZT4M2 |
| 3 | 540 W | ZT4M3 |
| 4 | 720 W | ZT4M4 |
| 5 | 900 W | ZT4M5 |
2.3 Sophisticated instrumental techniques are employed for the characterization of the catalyst
The instrument Shimadzu 3600 UV-vis DRS NIR spectrophotometer was used to determine the band gap and absorption edges of all the co-doped catalysts and undoped TiO2. In order to measure the UVDRS values between 200 nm and 800 nm, the reference standard BaSO4 was loaded by mixing with nano samples as pellet in the quartz cell. The instrumental technique PXRD (model-Ultima IV Rigaku) equipped with an anode Cu Kα at source λ = 1.5406 nm was used to identify the crystalline phase of Ba/Cu co-doped titanium dioxide and undoped TiO2 nanomaterials. From the FWHM results, the average crystallite sizes for all the samples measured using the Debye–Scherer equation. By using PHI quantum ESCA microprobe XPS system was used to determine the oxidation states and elemental composition of the catalysts. These spectra were captured by using X-ray radiation of 1253.6 eV with Al Kα 250 W at 16 mA current, 12.5 kV voltage. The particle size, shape, and SAED pattern of the nanoparticles were obtained from the High Resolution-Transmission Electron Microscope (model: Jeol/JEM 2100) at 200 kV equipped with a LaB6 electron gun having point resolution of 0.23 nm and a lattice resolution of 0.14 nm. The Field Emission Gun-Scanning Electron Microscope (FEG-SEM) of model JEOL JSM 7600F with an Energy Dispersive X-ray spectrophotometer (EDX) operated at 20 kV and was used to evaluate the photocatalyst's elemental composition and surface morphology. The X-ray Fluorescence (XRF) with X-ray tube 50 kV max, 1 mA with Rh target (XGT 5200, Horiba, Japan) was also used to determine the elemental composition. The pore size, surface area, and pore volume of the photocatalyst were calculated using the Brunauer–Emmett–Teller (BET) surface area analyzer (model: Gemini VII 2390 series micro metrics). The FTIR spectra were recorded using FTIR spectrometer (Bruker, Germany model: 3000 Hyperion Microscope with Vertex 80 FTIR system) in the range of 400–4000 cm−1. The photoluminescence spectral analysis was done by using a setup of both 150 V PMT and 2.5 nm slit (Horiba Jobin Fluoro Max-4). A Shimadzu 1601 UV-visible spectrophotometer was used for investigation of the extent and rate of degradation of dye. Elico's digital pH meter (model: IIIE, EI) was used for monitoring and adjusting the pH of reaction mixture during the degradation process. The microwave power source utilized for synthesis is LG model no. MC2846SL of microwave power 1350 W and frequency 2450 MHz with RF output of 900 W.2.4 Framework for photocatalytic activity of the catalyst-degradation of BBR dye
The photocatalytic effectiveness of the produced catalysts was determined by observing the breakdown of BBR dye in the presence of visible light. To optimise the performance of catalysts, reaction parameters were investigated. In the experimental setup for photocatalytic degradation, a high pressure 400 W (35![[thin space (1/6-em)]](https://www.rsc.org/images/entities/char_2009.gif) 000 lumen) metal halide lamp (Osram, India) is utilised as the visible radiation source the distance between the beaker and radiation source with the UV-blocking filter was maintained at 20 centimetres (Oriel, No. 51472). The reaction beaker has a cold water supply circulating around it to filter off infrared radiation and to maintain the reaction at ambient temperature throughout the entire procedure. Prior to irradiation, the pH of the solution was adjusted by adding either 0.1 N HCl or 0.1 N NaOH.28,29 In order to achieve equilibrium between dye and catalyst, 100 mL of BBR dye solution was combined with a certain amount of catalyst at a particular pH in a reaction beaker and swirled continuously for 30 minutes in the absence of visible light. After exposing the reaction mixture to visible light for degradation, aliquots of 5 mL are periodically removed using a Millipore syringe. Using a UV-vis spectrophotometer, the variation in the concentration of dye is monitored by measuring its absorbance at (max 459 nm). The following formula was used to calculate the percentage of dye degradation (BBR).
000 lumen) metal halide lamp (Osram, India) is utilised as the visible radiation source the distance between the beaker and radiation source with the UV-blocking filter was maintained at 20 centimetres (Oriel, No. 51472). The reaction beaker has a cold water supply circulating around it to filter off infrared radiation and to maintain the reaction at ambient temperature throughout the entire procedure. Prior to irradiation, the pH of the solution was adjusted by adding either 0.1 N HCl or 0.1 N NaOH.28,29 In order to achieve equilibrium between dye and catalyst, 100 mL of BBR dye solution was combined with a certain amount of catalyst at a particular pH in a reaction beaker and swirled continuously for 30 minutes in the absence of visible light. After exposing the reaction mixture to visible light for degradation, aliquots of 5 mL are periodically removed using a Millipore syringe. Using a UV-vis spectrophotometer, the variation in the concentration of dye is monitored by measuring its absorbance at (max 459 nm). The following formula was used to calculate the percentage of dye degradation (BBR).| Percentage of degradation = A0 − At/A0 × 100 |
The reaction parameters were optimised by varying conditions such as concentration of dopant, effect of pH, catalyst concentration, and initial concentration of dye.
3 Results and discussion
3.1 XRD analysis
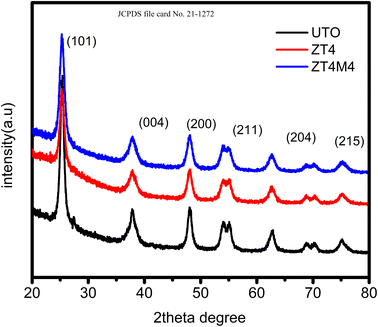
As shown in Fig. 1, the powder XRD patterns depicted the phase and structure of doped and undoped TiO2 samples. The 2θ peak values were determined to be 25.3°, 37.8°, 48.2°, 54.8°, 55.2°, 62.7°, 69.8°, 70.5°, and 75.2°, indicating a sign of the presence of an anatase. These results demonstrated that the anatase phase of TiO2 is not influenced by the presence of dopants. The absence of a peak at 2θ = 27.8° indicates that Zr4+ ion doping into TiO2 lattice has no effect on the structure of the material. Zr4+ ions replace Ti4+ ions since Zr4+ has a ionic radius close to that of Ti4+ (0.720 Å). This could be evidence that no additional peaks for ZrO2 and ZrTiO4 were found.30 During synthesis, the replacement of Ti4+ ions with Zr4+ ions inhibit crystallite growth. The Debye–Scherrer equation determines the average size of crystallites.31D = kλ/β![[thin space (1/6-em)]](https://www.rsc.org/images/entities/char_2009.gif) cos cos![[thin space (1/6-em)]](https://www.rsc.org/images/entities/char_2009.gif) θ θ |
3.2 XPS
The oxidation states and chemical composition of elements in the ZT4M4 were investigated using XPS. The complete survey spectrum of ZT4M4 elemental composition is depicted in Fig. 2a, which includes titanium, oxygen, zirconium, and standard carbon. This spectrum represented the existence of dopant elements in the catalyst. By evaluating the magnification spectra of the elements, Fig. 2e shows that the binding energies of 464.11 eV and 458.003 eV corresponds to doublet peaks at Ti 2p1/2 and Ti 2p3/2, respectively. The presence of the Ti4+ ion is indicated by the 6.10 eV splitting energy between these two peaks. Ti4+ in undoped TiO2 has binding energies of Ti 2p3/2 and Ti 2p1/2 of 464.6 eV and 459.9 eV, respectively with a peak energy splitting difference of 5.7 eV, which is lower than doped TiO2.32 This minor shift is due to the incorporation of Zr4+ into the TiO2 lattice. The O1s spectrum in Fig. 2c has doublet peaks, lattice oxygen in Ti–O bonds contributes to the prominent peak at 530.266 eV, while weakly physically adsorbed oxygen species on the surface (OH and O2− groups), account for the smaller peak at 532.593 eV.32 The Zr4+ oxidation state is responsible for the absorption of the Zr 3d5/2 and Zr 3d3/2 peaks, which have binding energies of 178.250 eV and 181.250 eV, respectively (Fig. 2d).33 The spectra thus affirmed the incorporation of zirconium into the lattice of TiO2 and also the presence of a strong interaction between the dopants and the TiO2 lattice.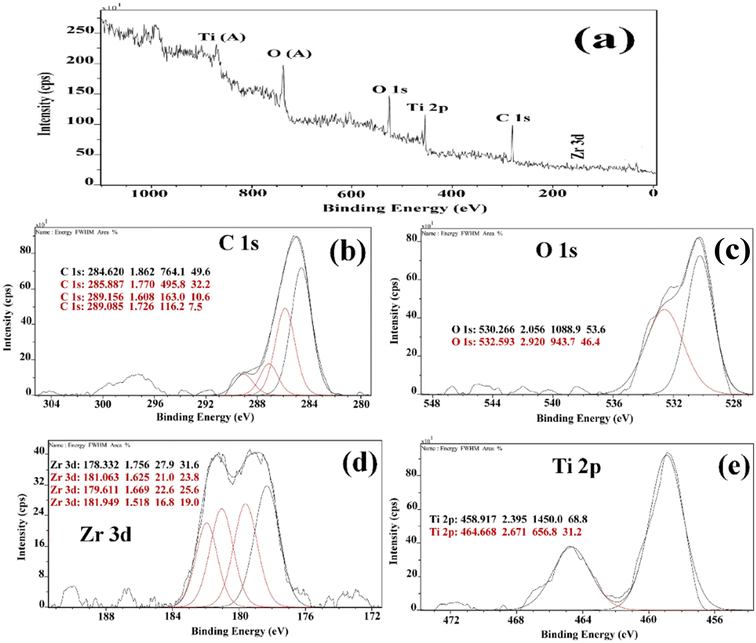 | ||
| Fig. 2 (a) XPS survey spectrum of Zr doped TiO2 and high resolution spectrum of (b) c 2p (c) O1s (d) Zr 3d (e) Ti 2p Respectively. | ||
3.3 Morphology study
Fig. 3a–c depict TEM images of ZT4M4, ZT4, and UTO nanocatalysts, in addition to their particle size distributions. ZT4 and ZT4M4 particles (Fig. 3b and c) exhibit significantly less agglomeration and smaller particles than TiO2 particles (Fig. 3a) with pseudospherical shape. The HRTEM image reveals that Zr-TiO2 contains nanocrystals with anatase phases that are randomly oriented. It was determined that the particles interplanar spacing (0.30 nm) corresponded to the anatase plane (d-spacing). Fig. 3d displays selected region electron diffraction patterns in addition to HRTEM (SAED). The existence of a crystalline anatase phase is also pointed by concentric rings. Using Gaussian fitting method, histograms of particle size distribution were generated to reveal the average particle size.34 According to the data, the average particle size of ZT4M4 is smaller than ZT4, which is smaller than UTO, which measures 13, 6.5, and 5.3 nm.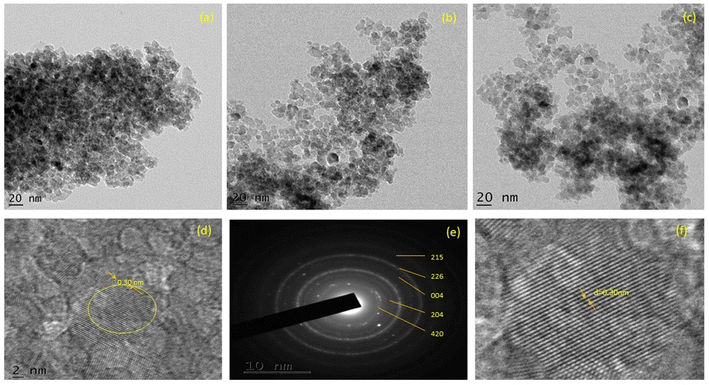 | ||
| Fig. 3 TEM micrograph of (a) UTO, (b) ZT4, (c) ZT4M4, (d) HRTEM image of ZT4M4, (e) SAED pattern and (f) lattice fringes of ZT4M4. | ||
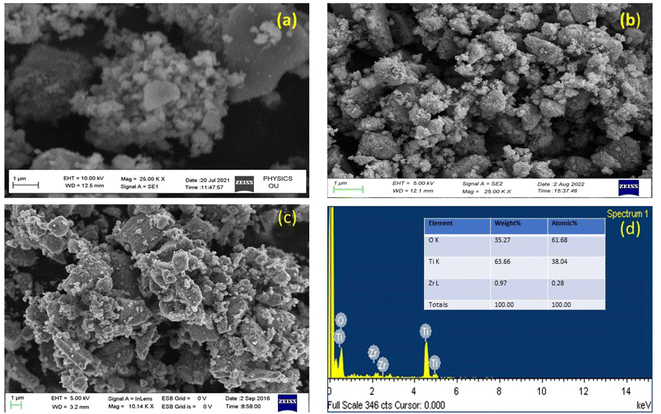
FESEM and EDX analyses were used to investigate the morphological properties and composition of prepared UTO, ZT4, and ZT4M4 catalysts, and the corresponding images are shown in Fig. 4a–d. The SEM images of UTO ZT4 and ZT4M4 show a spherical shape with rough morphology, indicating effective Zr doping of TiO2. The chemical composition was determined by EDX in the range of 0 to 14 keV binding energy area, given in Fig. 4d. The spectral peaks at 4.52, 4.96, and 0.54 keV K correspond to the components Ti and O of TiO2. The presence of Zr was also indicated by two diffraction peaks that were seen at 2.1 and 2.5 keV. The quantitative results (Fig. 4d inset) confirmed the presence of 0.97 wt% Zr relative to Ti (9.87 wt% is taken as 100%), which coincides with the quantity of doped Zr (1.00 wt%). The SEM analysis of catalysts at different power levels was represented in ESI S1.†
3.4 X-ray fluorescence analysis
X-ray fluorescence analysis is a widely accepted effective method for determining the qualitative and quantitative composition of a material by irradiating the sample with high-energy X-photons and observing the outgoing X-ray fluorescence.15 This approach provides for the accurate identification of chemical elements with atomic numbers ranging from 16 (sulphur) to 92 (uranium). The experimental results indicated that the wt% of the doped element were almost coincides with the actual amount doped into the TiO2 lattice given in Table 3. The spectral data corresponding to all these samples were shown as ESI (S2).†| Sample | Titanium (wt%) | Zirconium (wt%) |
|---|---|---|
| ZT1 | 99.77 | 0.23 |
| ZT2 | 99.56 | 0.44 |
| ZT3 | 99.28 | 0.72 |
| ZT4 | 99.04 | 0.96 |
| ZT5 | 98.81 | 1.19 |
3.5 FTIR study
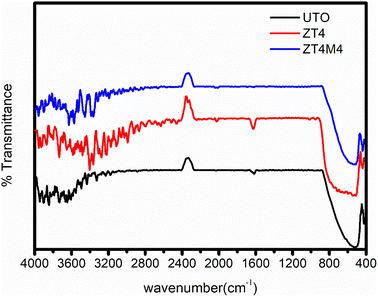
The FTIR spectra of ZT4, ZT4M4, and UTO nanoparticles are represented in Fig. 5. The catalysts that were synthesised exhibited a broad absorption band in the vicinity of 3660–2600 cm−1; this band corresponded to the surface hydroxyl group's (Ti–OH) stretching vibration. Additionally, the samples exhibited an absorption peak at 1631 cm−1; this peak was ascribed to the (H–OH) bending vibration of water molecules.35 Characteristic absorbance peaks at 549 indicate the stretching vibrations of Ti–O–Ti in UTO which where it is moved towards lower wavenumber of 490 cm−1 (range 400–900 cm−1). This change is a result of the successful substitutional doping of Zr4+ into the lattice of TiO2 in place of Ti4+ Due to the development of the Zr–O network, the adsorbed –OH stretching band has shifted.36 No characteristic band is observed at 470 cm−1, which indicates the absence of ZrO2. Due to the development of the Zr–O network, the adsorbed –OH stretching band has shifted. The peak around 619–835 cm−1 is attributed to stretching and bending vibrations of the Zr–O–Ti bond,37 which clearly says that Zr is doped into the TiO2 lattice.3.6 BET analysis
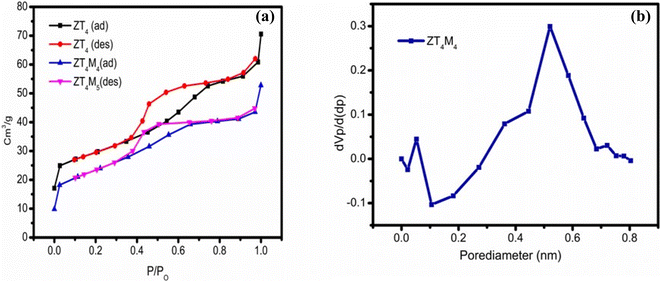
The pore size, surface area, and pore volume analysis of the UTO, ZT4 and ZT4M4 photocatalytic nanomaterials were determined by BET analysis. The N2 adsorption desorption measurements of the samples show type-IV isotherms with H2 hysteresis loops which are represented in Fig. 6a.38 The corresponding pore size distributions are estimated and using the BJH method, which is based on isothermal adsorption and are given Fig. 6b. ZT4M4 was observed to have a higher surface area (119 m2 g−1) over ZT4 (90 m2 g−1), which is higher than UTO. According to the data, the particles have high surface area and are mesoporous. In the Table 4 are the appropriate values for pore size, pore volume, and surface area. ZT4M4 synthesised with the aid of microwaves has a greater adsorbent surface area than ZT4, indicating that microwave-assisted synthesis increases the nanomaterials' surface area.| S. no. | Catalyst code no. | Crystallite size (nm) | Band gap energy (eV) | BET surface area analysis | ||
|---|---|---|---|---|---|---|
| Surface area (m2 g−1) | Pore volume (cm3 g−1) | Pore size (nm) | ||||
| 1 | UTO | 12.5 | 3.07 | 61 | 0.21 | 4.2 |
| 2 | ZT4 | 6.4 | 2.68 | 90 | 0.43 | 4.8 |
| 3 | ZT4M4 | 4.7 | 2.66 | 119 | 0.52 | 5.8 |
3.7 UV-vis DRS spectral analysis
UV-vis DRS was employed to study the photoabsorbance characteristics of UTO, ZT4, and ZT4M4 samples in the wavelength range of 200–800 nm. The undoped TiO2 shows its absorption at 300–400 nm wavelength range. Due to the metal–ligand charge transfer between O2− (valence band) and Ti4+ (conduction band) and reflects the most light in the visible range of 400 to 800 nm. According to Fig. 7a, Zr4+ doping shifts the absorption edge (red shift) towards higher wavelengths, i.e. the visible light region. This is due to TiO2 being swapped by Zr4+ ions, resulting in intermediate energy levels or surface trap states.39 These smaller band gaps and red shifts were probably generated by defects induced by smaller doses of Zr4+ in the TiO2 lattice or by enlarged crystal domains.40 Using the Tauc plot method, and Kubelka–Munk formalism the band gap of the catalysts was determined using reflectance spectra [F(R)]. From the figure, the band gap energies of the intercepting target will approximate the band gap energies of the samples. The predicted band gap values for UTO and ZT (ZT1–ZT5) samples are between 3.07–2.68 eV.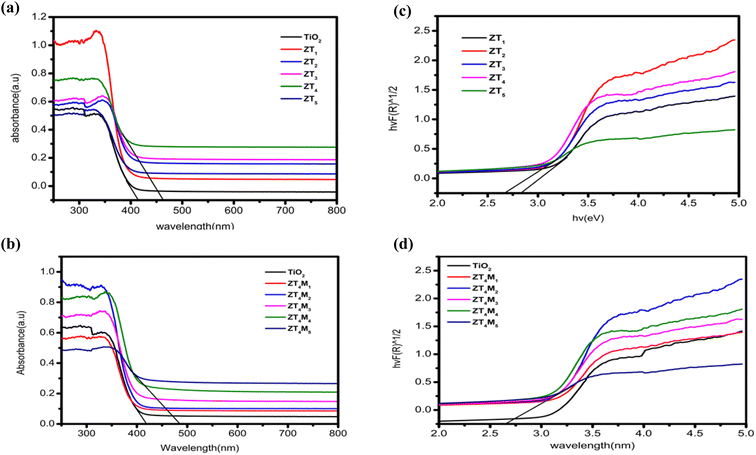 | ||
| Fig. 7 UV-vis DRS (a, b) the DRS spectra and (c, d) plots of transformed square root of Kubelka–Munk functions of UTO, ZT and ZT4M samples. | ||
Among them, ZT4 samples show a lower band gap of 2.68 eV, which was further fabricated using the microwave-assisted approach and the band gaps of as-synthesized ZT4M (ZT4M1–ZT4M5) samples were determined and found to be within 2.8 and 2.66 eV. The band gap of ZT4M4 was the smallest at 2.66 eV. The results demonstrated that Zr-doping increased absorption intensity, causing the samples' photo response to shift towards the visible region. The Table 2 is provided with band gap of each sample for comparison.
The characterisation data of XRD, BET, UV-vis DRS were represented in Table 4.
4 Assessment of the photocatalytic activity of the catalyst
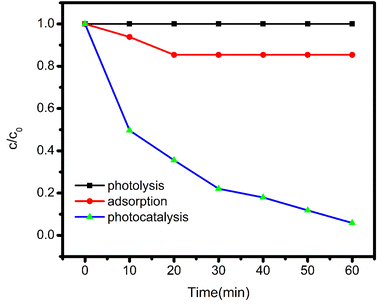
Under visible light irradiation, experiments were conducted to investigate the photodegradability and adsorption capability of BBR dye with as synthesised catalyst. Before starting with the aforesaid procedure, preliminary experiments were undertaken to evaluate the interdependency between dye, catalyst, and visible light; the results are depicted in Fig. 8.4.1 Photolysis
In a 150 mL Pyrex glass container, 100 mL of a 5 mg L−1 BBR dye solution was poured and exposed to the light for 1 hour. 5 mL samples were collected at different intervals of time, the reaction mixture's absorbance was determined at 459 nm. There was no visible distinction in the dye's absorption. The deterioration of BBR dye is implied to be unaffected by light in the figure by a straight line that is parallel to the X-axis.4.2 Adsorption
In the reaction vessel the solution containing 5 mg L−1 dye with a concentration of 50 mg L−1 catalyst at pH 3 was taken. The reaction mixture was kept in dark, continuously stirred for 60 min and the absorbance as measured. A modest decrease in dye absorbance was observed, indicating dye molecule adsorption on the charged catalyst's surface.4.3 Photocatalysis
The above-mentioned reactants (catalyst and dye) were placed in another reaction vessel and subjected to the visible light radiation under continuous stirring for 60 minutes. At different time intervals, the absorbance was measured by collecting 5 mL aliquots of the dye solution. The absorbance of the dye showed a drastic change caused due to activation of the catalyst. These outcomes indicate that both catalyst and the light were essential for the degradation of the dye.The efficiency of the catalyst is also reliant on a variety of operating reaction parameters, including initial BBR dye concentration, dopant concentration, pH influence, and catalyst dosage. The influence of these parameters was investigated to attain the optimal conditions for catalyst's high photocatalytic activity.
4.4 Influence of dopant loadings on the photocatalytic activity of TiO2
Experiments were conducted with dopant concentrations ranging between 0.25–1.25 wt% to determine the effect of dopant loadings on visible light-induced degradation of BBR dye catalysts. Keeping other parameters constant, like solution pH 3, catalyst dosage of 0.05 g L−1, and initial dye concentration of 5 mg L−1. Fig. 9 demonstrates that, relative to UTO, the photocatalytic performance of all catalysts (ZT1–ZT5) showed better performance than UTO. Among all, ZT4 had the best efficiency of any doped sample due to the greatest reduction in bandgap, which enables higher quanta absorption per particle in visible light radiation, hence enhancing photocatalytic activity.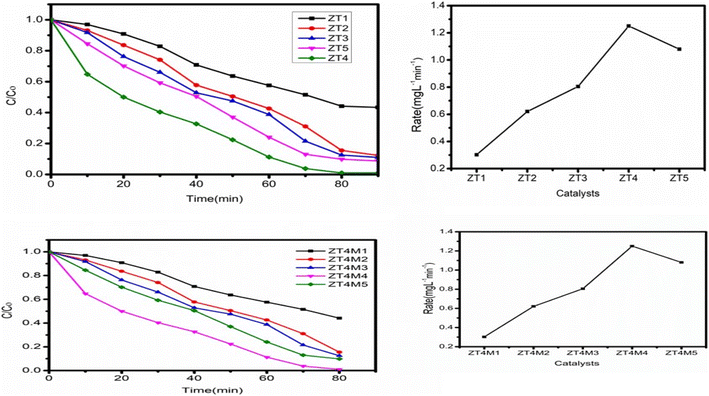 | ||
| Fig. 9 Shows the effect of dopant concentration on degradation of BBR dye. Ccatalyst dosage 0.05 g L−1, solution pH 3, and initial dye concentration 5 mg L−1. | ||
In addition to light absorption, the effectiveness of the catalyst is dependent on the surface area of the particle, which facilitates dye adsorption on the catalyst's surface. Consequently, the scissoring of particle size with microwave irradiation is an ecologically benign procedure that decreases particle size. On this basis, the ZT4 catalyst was synthesised utilising microwaves, and the photocatalytic performance of the produced catalysts (ZT4M1, ZT4M2, ZT4M3, ZT4M4, and ZT4M5) was evaluated using the method described before. Fig. 9 demonstrates that ZT4M4 possesses excellent photocatalytic activity. We have therefore chosen ZT4M4 as the most effective catalyst for the breakdown of BBR dye.
4.5 Role of pH on the photocatalytic activity of TiO2
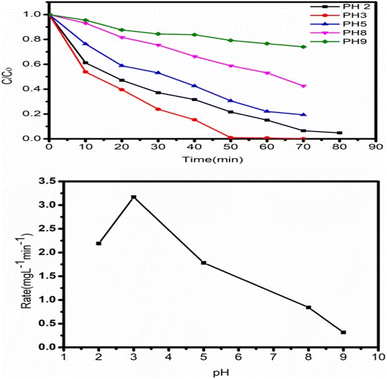
The initial pH of the solution is also crucial for the catalyst's photocatalytic efficiency changes in pH can alter the surface property of the catalyst, thereby affecting the adsorption of the target compounds. Therefore, the pH effect on the photocatalytic degradation and degree of adsorption of dye utilising (ZT4M4) nanomaterial was examined by altering pH 2, 3, 5, 8, and 9 while keeping the other parameters constant: catalyst dosage at 0.05 g L−1 and 5 mg L−1 of initial dye concentration. The results are displayed in Fig. 10. The adsorption of negatively charged dye molecules enhanced by Electrostatic interaction under acidic circumstances because the surface titanol group (Ti–OH) is protonated (Ti–OH2+), hence increasing the surface area. Consequently, the rate of breakdown of adsorbed dye molecules has risen. Due to a decrease in the positive charge on the catalysts surface, the concentration of H+ ions at pH 5 decreases.41| TiOH + H+ → TiOH2+, pH < 6.25 |
Titanol (Ti–OH) is converted to TiO− by the removal of a water molecule as the pH increases. This is due to the fact that at basic pH, the charge on the catalyst's surface becomes negative. Therefore, it may not be feasible to adsorb the negatively charged dye molecules, and the degradation rate is low.42 According to the data, the ideal pH for dye degradation is 3, as the catalyst's positively charged surface increases dye adsorption.
| TiOH → TiO− + H+, pH > 6.25 |
4.6 Efficacy of the catalyst as determined by its concentration
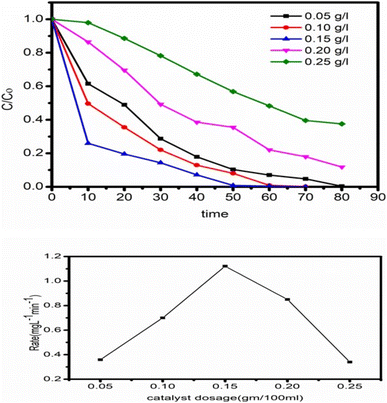
To determine the impact of catalyst concentration (ZT4M4) on the photocatalytic BBR dye degradation. Experiments were conducted with catalyst concentrations ranging from 0.05 mg L−1 to 0.25 mg L−1, while pH 3 and initial dye concentration of 5 mg L−1 remained unchanged Fig. 11 depicts the experimental results demonstrating that the degradation rate increases, as the amount of catalyst increases up to 0.15 mg L−1, then decreases gradually. After attaining the ideal concentration of catalyst, degradation slows as a result of an increase in turbidity of the solution and non-availability of dye molecules.434.7 The significant effect of the initial dye concentration
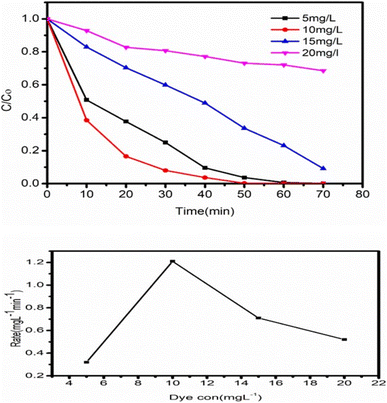
Examining the impact of initial dye concentration on the photocatalytic activity of ZT4M4 nanomaterial. Experiments were conducted by increasing the dye concentration from 5 mg L−1 to 20 mg L−1, with a constant dose of 0.15 mg L−1 catalyst at a pH of 3. The outcomes are shown in the figure. The degradation rate enhances with increase in dye concentration up to 10 mg L−1, at which point it decreases. Inspite of an increase in the dye molecules concentration, the degradation rate reduces due to the absence of active catalyst particles. In other terms, the decrease in dye degradation rate is well explained by the blanket effect,44 which states that once the first layer of dye molecules is adsorbed on the surface of the catalyst, it may not be possible to adsorb a second layer. As a result of the blanket effect, the second layer's adsorption is delayed until the initial layer is totally degraded. Thus, increasing the dye concentration slows the rate of degradation.The optimal conditions for effective (99%) degradation of BBR dye by ZT4M4 were 0.15 g L−1 of catalyst, 10 mg mL−1 of dye, and a pH of 3.
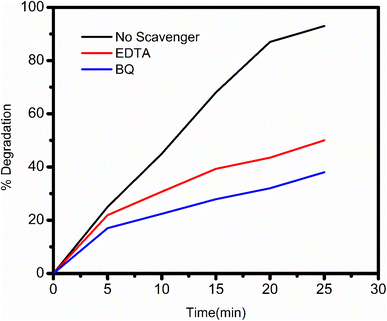
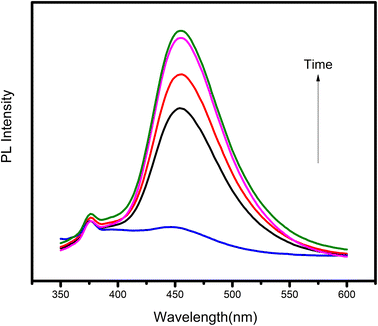
4.8 Scavenger tests to identify active species in ZT4M4 photocatalysis
Scavenger reagents were used to identify e−/h+, superoxide radical, and hydroxyl radical; EDTA, 1,4-benzoquinone, and coumarin reagents were used for the identification of above said reactive species.45 Under the impact of these chemicals, BBR dye degradation studies using visible light photocatalysis were conducted.4.9 Stability test
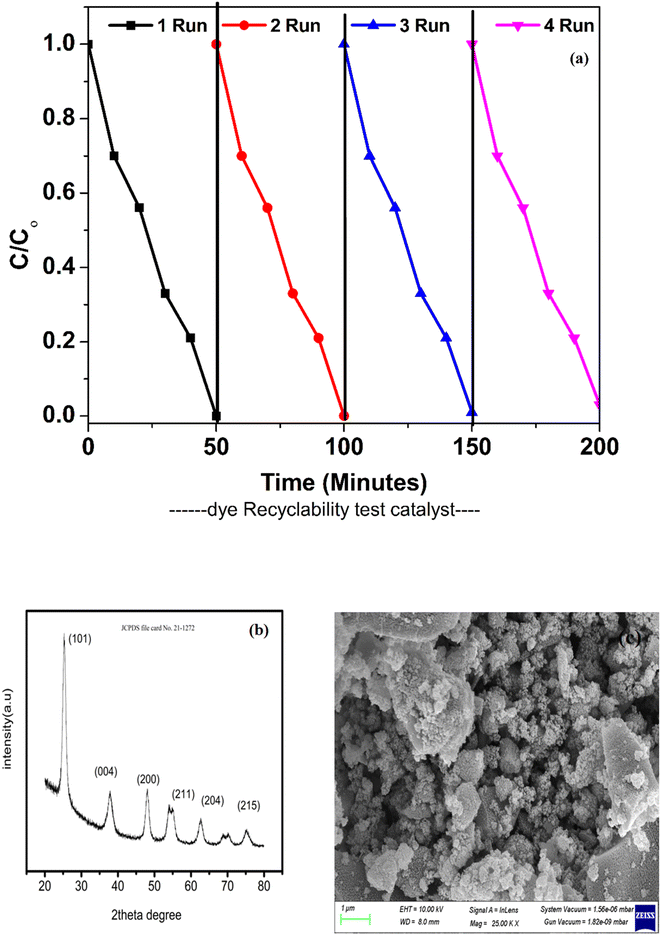
When considering the potential of a catalyst, its stability is a crucial factor to consider. Throughout the photocatalytic reactions, the catalyst must be durable and sustain high photoactivity for practical applications. In addition, the catalyst should be conveniently collected or recovered after each cycle of reaction. After being exposed to visible light, the catalyst's recyclability was evaluated. Each time, the photocatalyst degradation pattern was examined for approximately 50 minutes under ideal reaction conditions. After every 50 minutes of photocatalytic degradation, the catalyst was removed from the solution and rinsed with deionized water before being reused. Throughout this entire process, the optimal conditions for decomposition were always maintained. Fig. 16 depicts the slight reduction in photocatalytic activity of the ZT4M4 catalyst towards the dye over the period of four cycles. In acidic settings, however, BBR dye continued to degrade with high repeatability and robust photocatalytic activity. This phenomenon has an effect on the photoactivity of the catalyst due to the difficulty of cleaning its surface.Later in order to further determine its stability of the catalyst after recycling process of degradation of BBR dye XRD and FEBBR analysis have been performed.
XRD was analysed to determine the crystalline nature and was found to be in anatase phase same as that of pure catalyst. The peaks were still evident in the recycled catalyst, showing that there were no much deformations in the catalyst even after it had been through four cycles.
FESEM analysis was used to analyse the surface morphology of the recycled catalyst. The analysis revealed that the surface was still uniform with a rough texture, with minimal change in morphology. The above results show that the catalyst retained its stability after recycling. The figures corresponding to recyclability test, XRD and SEM analysis were represented in Fig. 15.
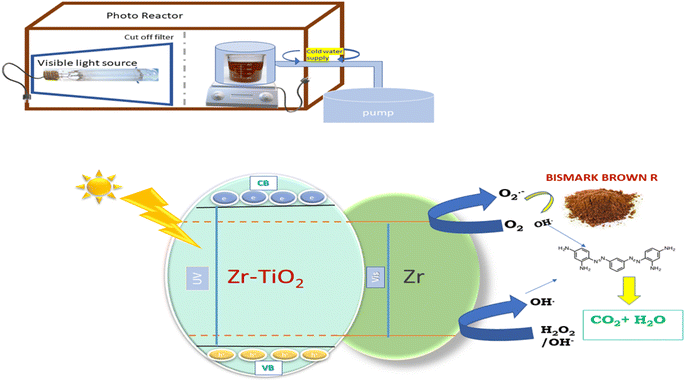
4.10 A precise mechanism for ZT4M4's photocatalytic activity
When visible light strikes Zr-TiO2, shifting of an electron from the valence band to the conduction band takes place, thereby creating a hole in the valence band.| Zr-TiO2 + hv → Zr-TiO2 (VBh+) + Zr-TiO2 (CBe−) |
| Zr-TiO2 (CBe−) + Zr3+ → Zr-TiO2 + Zr2+ |
The hydroxyl radical and H+ ion is produced when generated electron holes react with H2O or the surface hydroxyl group.
| Zr-TiO2 (VBh+) + H2O → Zr-TiO2 + OH− + H+ |
| Zr-TiO2 (VBh+) + OH− → Zr-TiO2 + ˙OH |
In reaction with O2, the excited electrons in the conduction band generate super oxide radicals.
| Zr-TiO2 (CBe−) + O2 → Zr-TiO2TiO2 + O2−˙ |
This reaction produces a hydroperoxyl radical and a hydroxyl ion.
| Zr-TiO2 (CBe−) + O2−˙ + H2O → Zr-TiO2 + HO2˙ + OH− |
Together with h+, the hydroperoxyl radicals form an intermediate. In turn, hydrogen peroxide oxidises the holes to produce hydroxyl radicals and hydroxyl ions.
| Zr-TiO2 (CBe−) + HO2˙ + H+ → Zr-TiO2 + H2O2 |
| Zr-TiO2 (CBe−) + H2O2 → Zr-TiO2 + OH˙ + OH− |
These hydroxyl radicals attack and degrade the BBR dye, adsorbing it to the surface of the catalyst.
| OH(hν) + pollutant → degradation products |
The structure of BBR dye and schematic representation of photocatalytic activity was given in Fig. 16 and 17.
The comparative study on degradation of BBR Dye was represented in Table 5.
| Nanomaterial nano catalyst | Dye pollutant | Degradation/% | Degradation time | Ref. |
|---|---|---|---|---|
| Ni–S co-doped | Bismark brown | 99 | 110 min | 20 |
| Fe0/HP/UV | Bismark brown | 73 | 60 min | 46 |
| Cr2O3–NiO | Bismark brown | 97 | 60 min | 47 |
| Cu | Bismark brown | 95.6 | 75 min | 48 |
| ZT4 | Bismark brown | 99 | 80 min | Present study |
| ZT4M4 | Bismark brown | 99 | 50 min | Present study |
5 Conclusions
In this study, the synthesis of Zr-doped TiO2 using the microwave assisted sol gel technique is thoroughly described. The complete strategic method was devised to evaluate thoroughly the BBR dye degradation capability of as-produced Zr-doped TiO2 driven by visible light. ZT4M4 was found to be the most efficient of the as-synthesized catalysts, which can be attributed to its rough spherical morphology and lattice planes that coincide with the XRD, confirming the pure anatase form of the catalyst. ZT4M4 demonstrated the best performance in terms of reduced crystallite size (4.7 nm), band gap (2.66 eV), and surface area (119 m2 g−1). The TEM clearly displays the comparable particle size distribution of ZT4M4 without any agglomeration. The photodegradability of BBR dye, which reached 99% after 50 min of exposure to visible light, demonstrates the characterization results. The scavenger test demonstrates the presence of reactive species such as superoxide radicals (˙O2), e-holes, and hydroxyl radicals (˙OH).Conflicts of interest
Authors stated that no conflicts of interest.References
- R. J. Giguere, T. L. Bray, S. M. Duncan and G. Majetich, Tetrahedron Lett., 1986, 27, 4945–4948 CrossRef CAS.
- R. Gedye, F. Smith, K. Westaway, H. Ali, L. Baldisera, L. Laberge and J. Rousell, Tetrahedron Lett., 1986, 27, 279–282 CrossRef CAS.
- X. Wang, J. Tian, C. Fei, L. Lv, Y. Wang and G. Cao, RSC Adv., 2015, 5, 8622–8629 RSC.
- M. I. Dar, A. K. Chandiran, M. Grätzel, M. K. Nazeeruddin and S. A. Shivashankar, J. Mater. Chem. A, 2014, 2, 1662–1667 RSC.
- B. Baruwati, V. Polshettiwar and R. S. Varma, Green Chem., 2009, 11, 926 RSC.
- J. Virkutyte and R. S. Varma, Chem. Sci., 2011, 2, 837–846 RSC.
- V. Polshettiwar, M. N. Nadagouda and R. S. Varma, Aust. J. Chem., 2009, 62, 16 CrossRef CAS.
- E. H. Alsharaeh, T. Bora, A. Soliman, F. Ahmed, G. Bharath, M. G. Ghoniem, K. M. Abu-Salah and J. Dutta, Catalysts, 2017, 7, 133 CrossRef.
- R. Wei, P. Wang, G. Zhang, N. Wang and T. Zheng, Chem. Eng. J., 2020, 382, 122781 CrossRef CAS.
- L. C. Nehru and C. Sanjeeviraja, J. Adv. Ceram., 2014, 3, 171–176 CrossRef CAS.
- F. T. Li, X. J. Wang, Y. Zhao, J. X. Liu, Y. J. Hao, R. H. Liu and D. S. Zhao, Appl. Catal., B, 2014, 144, 442–453 CrossRef CAS.
- P. E. Imoisili, T. C. Jen and B. Safaei, Nanotechnol. Rev., 2021, 10, 126–136 CrossRef CAS.
- Z. Wang, J. Zhu, W. Xu, J. Sui, H. Peng and X. Tang, Mater. Chem. Phys., 2012, 135, 330–333 CrossRef CAS.
- G. Zhong, S. Xu, C. Chen, D. J. Kline, M. Giroux, Y. Pei, M. Jiao, D. Liu, R. Mi, H. Xie, B. Yang, C. Wang, M. R. Zachariah and L. Hu, Adv. Funct. Mater., 2019, 29, 1904282 CrossRef CAS.
- Q. Saleem, M. Torabfam, H. Kurt, M. Yüce and M. K. Bayazit, React. Chem. Eng., 2022, 7, 1510–1524 RSC.
- J. Zhang, X. Xiao and J. Nan, J. Hazard. Mater., 2010, 176, 617–622 CrossRef CAS.
- K. Ding, Z. Miao, Z. Liu, Z. Zhang, B. Han, G. An, S. Miao and Y. Xie, J. Am. Chem. Soc., 2007, 129, 6362–6363 CrossRef CAS PubMed.
- L. Cui, K. Hui, K. Hui, S. Lee, W. Zhou, Z. Wan and C. N. H. Thuc, Mater. Lett., 2012, 75, 175–178 CrossRef CAS.
- M. E. Simonsen, Z. Li and E. G. Søgaard, Appl. Surf. Sci., 2009, 255, 8054–8062 CrossRef CAS.
- K. Divya Lakshmi, T. Siva Rao, J. Swathi Padmaja, I. Manga Raju and M. Ravi Kumar, Chin. J. Chem. Eng., 2019, 27, 1630–1641 CrossRef.
- P. Demircivi and E. B. Simsek, Water Sci. Technol., 2018, 78, 487–495 CrossRef CAS PubMed.
- P. Zhang, Y. Yu, E. Wang, J. Wang, J. Yao and Y. Cao, ACS Appl. Mater. Interfaces, 2014, 6, 4622–4629 CrossRef CAS PubMed.
- J. Du, H. Wang, H. Chen, M. Yang, X. Lu, H. Guo, Z. Zhang, T. Shang, S. Xu, W. Li, P. Wang and I. Shakir, Nano, 2016, 11, 1650068 CrossRef CAS.
- K. M. Rahulan, L. D. Stephen and C. C. Kanakam, Appl. Surf. Sci., 2013, 266, 326–331 CrossRef CAS.
- K. V. Bineesh, D. K. Kim and D. W. Park, Nanoscale, 2010, 2, 1222 RSC.
- M. B. Gawande, S. N. Shelke, R. Zboril and R. S. Varma, Acc. Chem. Res., 2014, 47, 1338–1348 CrossRef CAS PubMed.
- M. Panizza and M. A. Oturan, Electrochim. Acta, 2011, 56, 7084–7087 CrossRef CAS.
- M. Abutariq, M. Faisal and M. Muneer, J. Hazard. Mater., 2005, 127, 172–179 CrossRef CAS PubMed.
- N. Daneshvar, D. Salari and A. Khataee, J. Photochem. Photobiol., A, 2003, 157, 111–116 CrossRef CAS.
- B. Gao, T. M. Lim, D. P. Subagio and T. T. Lim, Appl. Catal., A, 2010, 375, 107–115 CrossRef CAS.
- S. R. Miditana, S. R. Tirukkovalluri, I. M. Raju, S. A. Alim, G. Jaishree and M. L. V. P. Chippada, Sustainable Environ. Res., 2021, 32(6) DOI:10.1186/s42834-021-00078-8.
- D. Briggs, Surf. Interface Anal., 1981, 3, 108–109 Search PubMed.
- D. S. Meshesha, R. C. Matangi, S. R. Tirukkovalluri and S. Bojja, J. Asian Ceram. Soc., 2017, 5, 136–143 CrossRef.
- E. Gharibshahi and E. Saion, Int. J. Mol. Sci., 2012, 13, 14723–14741 CrossRef CAS PubMed.
- I. Manga Raju, T. Siva Rao, K. V. Divya Lakshmi, M. Ravi Chandra, J. Swathi Padmaja and G. Divya, J. Environ. Chem. Eng., 2019, 7, 103211 CrossRef CAS.
- G. N. Shao, S. Imran, S. J. Jeon, M. Engole, N. Abbas, M. Salman Haider, S. J. Kang and H. T. Kim, Powder Technol., 2014, 258, 99–109 CrossRef CAS.
- S. X. Luo, F. M. Wang, Z. S. Shi and F. Xin, Mater. Res. Innovations, 2009, 13, 64–69 CrossRef CAS.
- Y. Nishi and M. Inagaki, Mater. Sci. Eng. C, 2016, 227–247 CAS.
- D. Jiang, T. A. Otitoju, Y. Ouyang, N. F. Shoparwe, S. Wang, A. Zhang and S. Li, Catalysts, 2021, 11, 1039 CrossRef CAS.
- S. M. Chang and R. A. Doong, J. Phys. Chem. B, 2006, 110, 20808–20814 CrossRef CAS PubMed.
- Z. Jia, J. Miao, H. Lu, D. Habibi, W. Zhang and L. Zhang, J. Taiwan Inst. Chem. Eng., 2016, 60, 267–274 CrossRef CAS.
- Z. Jia, J. Miao, H. Lu, D. Habibi, W. Zhang and L. Zhang, J. Taiwan Inst. Chem. Eng., 2016, 60, 267–274 CrossRef CAS.
- V. Strokova, E. Gubareva, Y. Ogurtsova, R. Fediuk, P. Zhao, N. Vatin and Y. Vasilev, Nanomaterials, 2021, 11, 866 CrossRef CAS PubMed.
- A. K. Subramani, K. Byrappa, S. Ananda, K. M. Lokanatha Rai, C. Ranganathaiah and M. Yoshimura, Bull. Mater. Sci., 2007, 30, 37–41 CrossRef CAS.
- H. Huang, K. Xiao, T. Zhang, F. Dong and Y. Zhang, Appl. Catal., B, 2017, 203, 879–888 CrossRef CAS.
- L. G. Devi, K. A. Raju, S. G. Kumar and K. E. Rajashekhar, J. Taiwan Inst. Chem. Eng., 2011, 42, 341–349 CrossRef CAS.
- J. Mohammad, M. M. Kareem and A. J. Atiyah, Asian J. Chem., 2018, 30, 2527–2532 CrossRef.
- M. Raju, T. S. Rao and M. S. Rao, Trends Sci., 2022, 19, 1715 CrossRef.
Footnote |
| † Electronic supplementary information (ESI) available. See DOI: https://doi.org/10.1039/d3ra00328k |
| This journal is © The Royal Society of Chemistry 2023 |

