 Open Access Article
Creative Commons Attribution 3.0 Unported Licence
Investigation of structural, optical and electrical conductivity of a new organic inorganic bromide: [C12H17N2]2ZnBr4†
I. Kammoun *a,
M. Belhouchet
 b,
A. Ben Ahmed
 c,
J. Lhoste
 d and
M. Gargouria
aUniversity of Sfax, Faculty of Sciences, Laboratory of Spectroscopic Characterization and Optical Materials, 3018 Sfax, BP1171, Tunisia. E-mail: kammoun.fss@gmail.com
bPhysico-Chemistry of Solid State Laboratory, Department of Chemistry, Faculty of Sciences of Sfax, 3000 Sfax, BP1171, Tunisia
cUniversity of Sfax, Faculty of Sciences of Sfax, Department of Physic, Laboratory of Applied Physic, B.P. No. 802, 3018 Sfax, Tunisia
dInstitute for Molecules and Materials Le Mans, University of Maine, Avenue Olivier Messiaen, 72085 Le Mans Cedex 9, France
First published on 10th March 2023
Abstract
A new organic–inorganic hybrid, namely the [C12H17N2]2ZnBr4 compound, has been synthesized and studied by single-crystal X-ray diffraction and optical and complex impedance spectroscopy. It crystallized in the centrosymmetric P21/n space group at room temperature. The asymmetric unit is constituted by [ZnBr4]2− anions, showing slightly distorted tetrahedral geometry, surrounded by four organic (C12H17N2)+ cations. The crystal packing is stabilized by N–H⋯Br and C–H⋯Br hydrogen bonds arranged in a three-dimensional network. The optical absorption measurement confirms the semiconductor nature with a band gap of around 3.94 eV. Additionally, the analysis of Nyquist plots (−Z′′ vs. Z′) shows that the electrical properties of the material are heavily dependent on frequency and temperature, indicating a relaxation phenomenon and semiconductor-type behavior. Reduction in Z′ was observed as a function of temperature and frequency which indicates an increase in ac conductivity and the negative temperature coefficient of resistance. The frequency dependent plots of (−Z′′) show that the electrical relaxation is non-Debye in nature. The ac conductivity spectrum obeys Jonscher's universal power law. The Correlated barrier hopping model CBH has been suggested to agree with the conduction mechanism of σac for the [C12H17N2]2ZnBr4 compound.
1. Introduction
In recent years, organic–inorganic hybrid compounds have constituted a large class of materials thanks to the improvement of their physico-chemical properties through which it was possible to gather both organic and inorganic components as well as outstanding properties from the different parts.1–3 A special place in this group of materials is occupied by organic–inorganic hybrids based on divalent metal halides (Cu, Zn, Co, Ni…) whose temperature-dependent optical and electrical properties are relevant for emerging applications in optical devices, information storage, solar cells, photocatalysts, etc.4–8 An important feature of organic–inorganic hybrids is their structural tenability. In fact, some structural differences are observed if the counter ions of the inorganic parts are monoprotonated or diprotonated amines. The crystallographic orientation and the thickness of the inorganic sheets may vary according to the choice of the appropriate organic cations.9,10 Due to the structural flexibility of the hybrid compound, the choice of different organo-ammoniums to stabilize various orientations or dimensions of inorganic sheets is an interesting area to explore the relationship between structures and physico-chemical properties within a single structure family.11,12 The organic divalent zinc bromide has several applications in various domains such as catalysis, biochemistry, dielectric transition and magnetism material science. In addition, the study of such zinc-based materials has received much attention recently in the light of photovoltaic and multifunctional properties.13The new [C12H17N2]2ZnBr4 compound has therefore been prepared with the aim of studying its optical and electrical properties by using UV-vis and complex impedance spectroscopy, respectively. Its crystal structure was determined from X-ray diffraction data collected on a single crystal obtained by the slow evaporation method.
2. Experimental
2.1. Synthesis
The synthesis of the [C12H17N2]2ZnBr4 sample was carried out using the reported preparation procedure.14 The organic parts 1,2-phenylenediamine (purity 99.5%, FLUKA) was dissolved in acetone and ZnBr2 (purity 98%, FLUKA), dissolved in hydrochloric acid solution (1 M), in molar ratio 2![[thin space (1/6-em)]](https://www.rsc.org/images/entities/char_2009.gif) :
:![[thin space (1/6-em)]](https://www.rsc.org/images/entities/char_2009.gif) 1. By slow evaporation at room temperature, yellow crystals suitable for X-ray single crystal analysis were obtained.
1. By slow evaporation at room temperature, yellow crystals suitable for X-ray single crystal analysis were obtained.
2.2. X-ray data collection
Single crystal sized (0.35, 0.25, 0.20) mm3 was carefully selected to perform its structural analysis by X-ray diffraction. The crystallographic data were collected on a Bruker AXS CCD diffractometer at room temperature using graphite-monochromated Mo Kα radiation (λ = 0.71073 Å). All intensities were corrected for Lorentz, polarization and absorption effects.15 The structural determination procedure was carried out using SHELXS97 program.16 The structure was solved by direct method and refined with full-matrix least squares methods based on F2 using SHELXL97.17 The space group was determined to be P21/n. A total of 54568 reflections were collected in the θ range 2.2–27.5°. In this structure, all non-hydrogen atoms were refined with anisotropic displacement parameters. H-atoms were set in calculated positions and treated as riding on their parent atom with constrained thermal parameters. The final discrepancy factors R1 and wR2 are 0.053 and 0.134, respectively. Crystal data of (C12H17N2)2ZnBr4 are given in Table 1. Molecular plots were made with ORTEP18 and Diamond.19| Empirical formula | [C12H17N2]2[ZnBr4] |
| Formula weight | 763.56 |
| Temperature (K) | 296 |
| Wavelength (Å) | 0.71073 |
| Crystal system, space group | Monoclinic, P21/n |
| Unit cell dimensions | |
| a (Å) | 12.1363(6) |
| b (Å) | 14.9001(8) |
| c (Å) | 16.2525(9) |
| β (°) | 98.612(2) |
| V (Å3) | 2905.8(3) |
| Z | 4 |
| Density (calculated) (g cm−3) | 1.745 |
| Reflections collected | 54568 |
| Independent reflections | 6663 |
| Reflections observed with I > 2σ(I) | 3046 |
| Rint | 0.136 |
| Number of refined parameters | 298 |
| Goodness-of-fit on F2 | 0.99 |
| Final R indices [I > 2σ(I)] | R1 = 0.053 and wR2 = 0.134 |
| Largest diff. peak and hole, e Å−3 | 1.02 and −0.90 |
| CCDC no. | 2![[thin space (1/6-em)]](https://www.rsc.org/images/entities/char_2009.gif) 090 090![[thin space (1/6-em)]](https://www.rsc.org/images/entities/char_2009.gif) 035 035 |
Atomic coordinates anisotropic displacement parameters, tables for all bond distances, and angles have been deposited at the Cambridge Crystallographic Data Centre (deposition number: CCDC 2090035).
2.3. Impedance spectroscopy
Furthermore, the impedance measurements of the investigated [C12H17N2]2ZnBr4 compound were performed using two platinum electrodes. As a fact, the fine grain samples were pressed into a cylindrical pellet of typical dimension 8 mm diameter and 1.1 mm thickness pressed at a pressure of 3 ton per cm2. Then, thin gold films, (with a thickness of a few nanometers), were manually deposited on both flat faces of the pellet. The measurements were performed as a function of both temperature and frequency employing using an 1260 Solartron Impedance Analyzer.2.4. UV-visible measurements
UV-visible measurement was carried out using a conventional UV-visible spectrophotometer (HITACHI, U-3300) in the range 200–800 nm.3. Results and discussion
3.1. Crystal structure
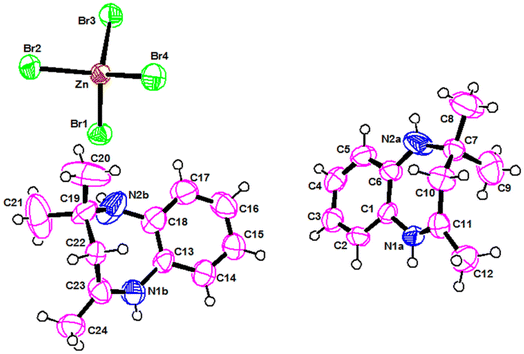
As shown in Fig. 1, the asymmetric unit is constituted by one tetabromozincate [ZnBr4]2− anion and two protonated [C12H17N2]+ cations. The zinc atom is coordinated to four Br atoms forming a slightly distorted tetrahedron, as it can be deduced from the value of both the Zn–Br bond lengths, ranging from 2.3638(11) to 2.4464(10) Å, and the Br–Zn–Br angles, ranging from 105.35(4)° to 113.89(4)° (Table S1)†. The structural parameters of the present compound agree well with those found in similar compounds characterized by [ZnBr4]2− tetrahedral units.20The two chemically identical monoprotonated cations [C12H17N2]+ are crystallographically independent and are noted respectively: Cation (A) {N1a, N2a} and Cation (B) {N2a, N2b}. The values of C–C and C–N distance, in the two cations, range from 1.284(8) to 1.539(10) Å while C–C–C and C–C–N angles are between 105.2(7) and 133.3(6) (Table S2)†. Both cations are ordered and have slightly different torsions angles.21,22
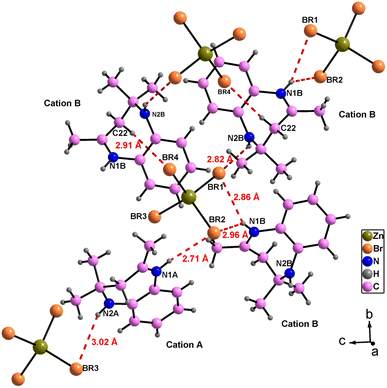
The atomic arrangement of the studied compound is built of alternated organic and inorganic layers (Fig. 2). The crystal packing is stabilized by cation-to-anion N–H⋯Br and C–H⋯Br hydrogen bonds (four simple and one bifurcated) leading to a three-dimensional network. Hydrogen bonding parameters are listed in Table S3.† In this structure each [ZnBr4]2− anions is surrounded by four organic (C12H17N2)+ cations (one cation A and three cations B (Fig. 3),). In addition, no face-to-face π–π interactions exist since the distance between centroid phenyl rings is equal to 7 Å.
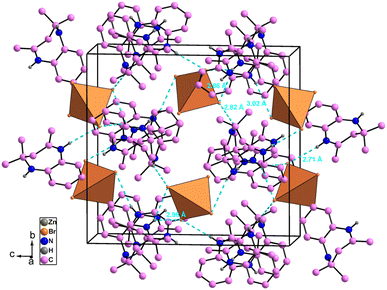 | ||
| Fig. 2 Crystal packing of [C12H17N2]2[ZnBr4] compound in the (b, c) plane (hydrogen bonds shown as dashed lines). | ||
3.2. Electrical impedance spectroscopy
Impedance spectroscopy is the most important technique to study the dynamics of mobile and bound charges in the bulk and interfacial areas of the materials. Generally, help in identifying the grain, grain boundary and electrode interface contributions in the polarization mechanism.23,24Fig. 4 shows the variation of real part of the impedance (Z′) with frequency at different temperatures. At low frequencies, the magnitude of Z′ increases with the temperature at range from 353 K to 373 K. Then it is observed that beyond 373 K, the value of Z′ decreases on increasing temperature, which can be explained by the reduction of trapped charge density and a thermal activation of their mobility.25 Besides, the values of Z′ merge at high frequencies (>104 Hz). This can be understood by the fact that charge carriers acquired sufficient energy to overcome the potential barrier.26
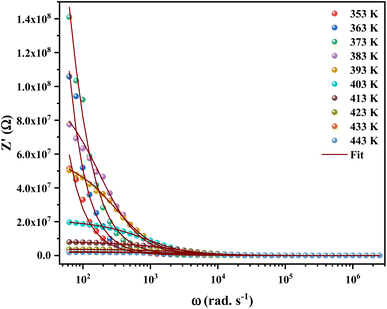 | ||
| Fig. 4 Variation of the real part (Z′) of the impedance of [C12H17N2]2ZnBr4 compound as a function of angular frequency for different temperatures. | ||
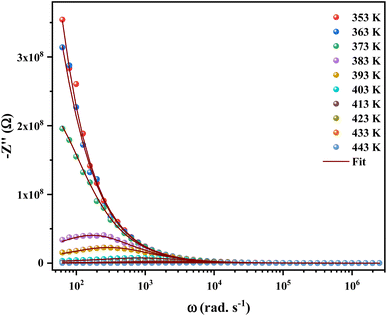
Fig. 5 shows the temperature-dependent variations of the imaginary part (−Z′′) as a function of frequency over the temperature range of 353 K to 443 K. The peaks appearing in the plots of frequency versus Z′′max were found to shift towards the side of higher frequencies. Furthermore, the broadening of peaks and decreasing value of Z′′max with increasing temperature, indicating the fact that multiple relaxation processes are occurring simultaneously.27
The Nyquist plot between the real Z′ and imaginary (−Z′′) part of impedance is used to analyze the conduction mechanism in any sample. These graphs usually appear in the form of semicircles and each semicircle is a manifestation of unique relaxation process.28
Fig. 6 shows the imaginary part of the impedance (−Z′′) versus the real part (Z′) over a wide range of frequencies and at different temperatures. The colored symbols demonstrate the actual experimental data, whereas the solid-red lines represent the fit administered by Zview software.29 This spectrum is characterized by the appearance of semicircular arc centered below the real axis which is temperature dependent. Depression of semicircle is originated from the presence of distribution of relaxation times. The radius of semicircle decreases with increasing temperature due to increase in conductivity of the material. In reality, the non-Debye type of relaxation is obtained which obeys Cole–Cole model.30 In order to analyze these spectra and to extract the different electrical parameters, an equivalent circuit model was proposed from the fit of experimental data to investigate the relationship between microstructure and electrical properties of sample. The best fit using Zview software was obtained using an equivalent circuit formed by a parallel combination of bulk resistance R capacitance C, and fractal capacitance CPE as depicted in the inset of Fig. 6. The constant phase element (CPE) is evaluated from the formula:
 | (1) |
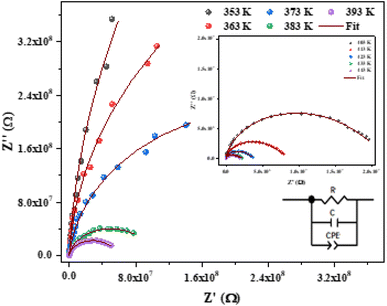 | ||
| Fig. 6 Nyquist plot fitted with an equivalent circuit for [C12H17N2]2ZnBr4 compound at different temperatures. | ||
The theoretical values of the real (Z′) and imaginary (−Z′′) parts of thecomplex impedance, derived from the equivalent circuit, were deduced using the following expressions:
 | (2) |
 | (3) |
The parameters R, C, α and CPE obtained from the fitting results were evaluated and listed in Table 2. An overview in this table, the bulk resistance R decreases with increasing temperature, this behavior is related to increasing the mobility of charge carriers.31
| T (K) | R (Ω) | C (10−11 F) | Q (10−11 F) | α |
|---|---|---|---|---|
| 353 | 2.83 × 10⁹ | 1.56 | 3.34 | 0.960 |
| 363 | 1.19 × 10⁹ | 2.09 | 3.07 | 0.943 |
| 373 | 5.06 × 10⁸ | 3.27 | 4.93 | 0.785 |
| 383 | 1.06 × 10⁸ | 3.46 | 20 | 0.621 |
| 393 | 6.18 × 10⁷ | 3.47 | 30.7 | 0.588 |
| 403 | 2.23 × 10⁷ | 3.49 | 84 | 0.513 |
| 413 | 8.76 × 10⁶ | 3.50 | 205 | 0.461 |
| 423 | 4.04 × 10⁶ | 3.50 | 434 | 0.426 |
| 433 | 2.45 × 10⁶ | 3.47 | 755 | 0.414 |
| 443 | 2.15 × 10⁶ | 3.44 | 960 | 0.412 |
The justification of the choice of the equivalent circuit is confirmed by the variations of the experimental values of (Z′) and (−Z′′) at various temperatures versus the calculated ones using the parameters of the equivalent circuit model (Fig. 7a and b). From this figure, it is evident that the slope obtained from a linear fit of the data points at each temperature is nearly equal to the unity. This behavior reveals that the adopted equivalent circuit describes well the electric properties of the investigated compound.
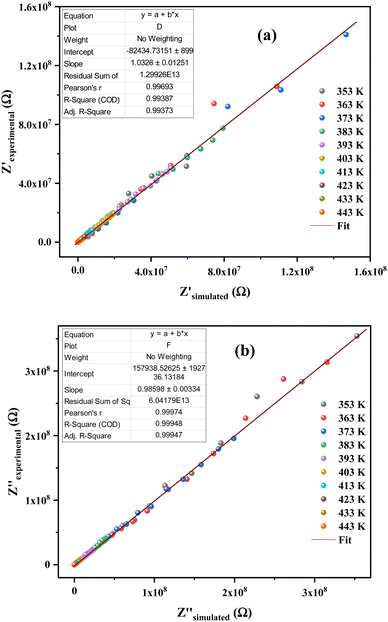 | ||
| Fig. 7 (a) and (b) Plots of measured values versus simulated values of the real and imaginary parts of the impedance. | ||
The electrical conductivity can be a well-established process for describing the hopping dynamics of the frees carriers. The obtained values of bulk resistance (R), corresponding to the grain, are used to determine the electrical conductivity sg as follows:
 | (4) |
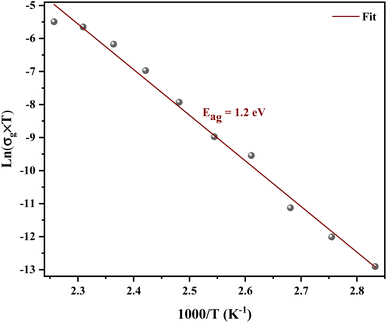
Fig. 8 shows the variation of the conductivity σg for grains. The linearity of ln(σg) versus 1000/T justifies that the title compound does not have a phase transition in the temperature range studied. We note that the conductivity increases with increase in temperature, which indicates the semiconductor behavior.32 The linear region is fitted with the Arrhenius equation:
 | (5) |
3.3. ac conductivity analysis
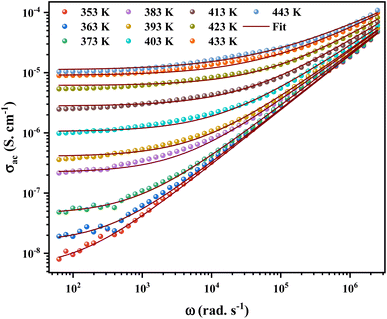
ac conductivity analysis helps to identify the type of transport for the charge carriers, which is responsible for the conduction process and its response as a function of frequency and temperature.35The angular frequency dependence of the ac conductivity at several temperatures for [C12H17N2]2ZnBr4 compound is shown in Fig. 9. The conductivity spectrum can be visually defined for two distinct regions. In the first region, a plateau is remarked at a low frequency up to a specific value known as the hopping frequency ωh = 105 rad s−1, which indicates a frequency-independent conductivity. The conductivity increasing with temperature, this implies a semiconductor behavior for the prepared sample.36 For the second region, the conductivity increases with increasing frequency. Moreover, to identify the suitable mechanism ac conductivity, an analysis of the frequency and conductivity (σac) data are fitted by the Jonscher power law:37
| σac (ω) = σdc + Aωs | (6) |
To define the predominant conduction mechanism of the ac conductivity of [C12H17N2]2ZnBr4 compound, several theoretical models correlating the conduction mechanism with the exponent s(T) behavior were used to determine this objective. We have fitted the ac conductivity data by using eqn (4) and the best fits can be obtained by consecutively varying A and s parameter.
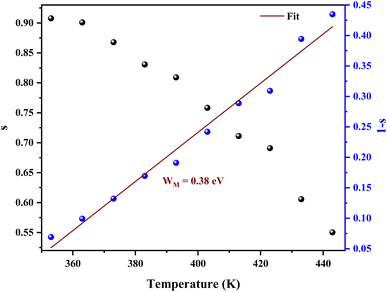
From Fig. 10 it is possible to determine the conduction process in the prepared sample. Thus, s tends to decrease with increasing temperature. This decreasing trend behavior of s with temperature suggests that the conduction mechanism in the compound can be explained by the Correlated Barrier Hopping (CBH) model in the sample.38
In the CBH model, the charge carriers can move from one location to another by performing a hopping over a potential barrier.39 The frequency exponent s is represented by following equation:
 | (7) |
 | (8) |
The average value of the barrier energy WH average was calculated as 0.31 eV by the slope of the line given in Fig. 7. This value is approximately a quarter of the activation energies  which indicates that the single polaron hopping is the dominating conduction mechanism in [C12H17N2]2ZnBr4.41
In this formalism, the alternating conductivity ac is given by:42–44
 | (9) |
 | (10) |
NNP is given by: NNP = NT2 (for bipolaron hopping), where NT is the number of states density. NNP = NT2 e(−Ueff/2kBT) (for single polaron hopping).
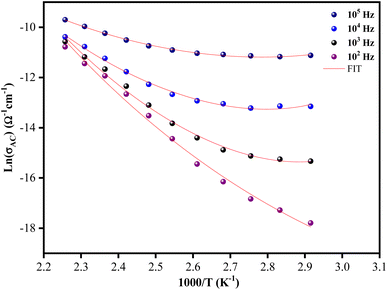
The temperature dependence of the ac conductivity for [C12H17N2]2ZnBr4 at selected frequencies is reported in Fig. 11. Clearly this plots shows that the theoretical calculations fitted by eqn (9) are good with the experimental data. The calculated fitting parameters are listed in Table 3. It can be noted that the values of the density of states N(EF) as a function of frequency are reasonable for localized states.45 Due to the strong electron–phonon interaction, the effective Hubbard intrasite correlation energy Ueff is found to be negative.46
| F (Hz) | NEF (eV−1 m−1) | Ueff |
|---|---|---|
| 102 | 6.8018 × 10¹³ | −0.08364 |
| 103 | 4.4729 × 10¹⁴ | −0.08933 |
| 104 | 5.3397 × 10¹⁵ | −0.0692 |
| 105 | 1.1309 × 10¹⁶ | −0.04252 |
3.4. Optical properties
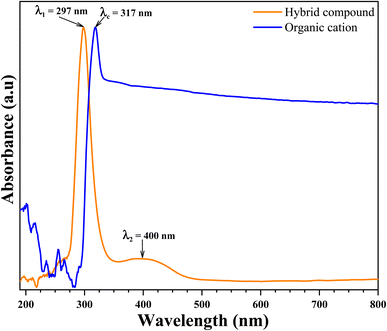 | ||
| Fig. 12 UV-visible absorption spectra of organic cation (blue line) and organic-inorganic hybrid compound (orange line). | ||
As can be seen Fig. 12, the absorption spectrum of organic cation shows one strong distinguished peak centered at λc = 317 nm. This strong absorption peak in the UV region have been attributed to π → π* transitions in the organic cation ring. This peak has been shifted to the strong distinguished peak centered at λ1 = 297 nm appeared in the absorption spectrum of hybrid compound. This shift caused by the new environment (inorganic anion) characterized by the charge transferred from organic cation the inorganic anion. Another medium band centered at λ2 = 400 nm is also showed in the absorption spectrum of hybrid compound in visible region. This absorption band have been attributed to metal charge transferred in inorganic anion from metal atom (Zn) to halogen atom (Br).
 | (11) |
The absorption coefficient is given by the following Pankove's relation:49
 | (12) |
The coefficient p = 2 for allowed direct transitions and p = 0.5 for indirect allowed transitions. B is the probability parameter for the transition and Eg the optical bandgap energy.
The Eg value corresponding to direct band gap transitions can be calculated via the (αhν)2 versus hν, using the formula:
| (αhν)2 = B(hν − Eg) | (13) |
The Eg value corresponding to indirect band gap transitions can be considered via the (αhν)0.5 versus hν, using the formula:
| (αhν)0.5 = B(hν − Eg) | (14) |
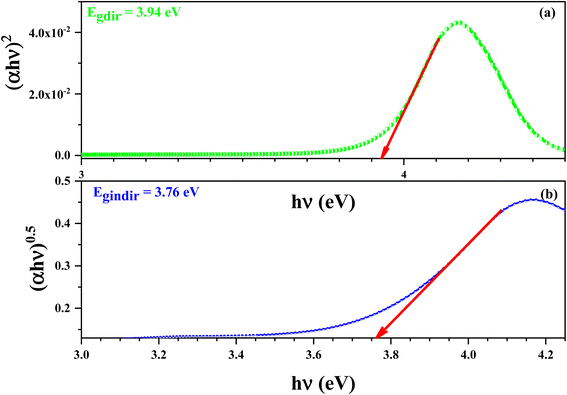
Fig. 13 demonstrate the variation of (αhν)2 (a) and (αhν)0.5 (b) versus hν of this compound. The values of Egd and Egind were estimated from the intersection of the extrapolated linear part of the (αhν)2 and (αhν)0.5 curves with energy axis.
The values of Egd and Egind were estimated from the intersection of the extrapolated linear part of the (αhν)2 and (αhν)0.5 curves with energy axis. The optical absorption measurement near the fundamental absorption edge is a standard method for estimation of the band gap energy. The direct band gap of the 3.94 eV results in an energy gap of 3.76 eV.
4. Conclusion
In this work, a new [C12H17N2]2ZnBr4 sample, with a centrosymmetric P21/n space group, was prepared and its optical, electrical and ac conductivity are investigated as a function of temperature and frequency. The asymmetric unit is constituted by one tetabromozincate [ZnBr4]2− anion and two protonated [C12H17N2]+ cations.The energy of the optical gap was found to be approximately 3.94 eV for a direct transition and 3.76 eV for an indirect one. This leads us to conclude that the [C12H17N2]2ZnBr4 compound is a good candidate for the application of semiconductors.
The Nyquist plots were satisfactorily fitted with the one-cell circuit model R/C/CPE, with the exception of adding a CPE element in series from the temperature of phase transition. The temperature dependency of Z′ with an inverse variation suggests a semiconducting behavior. The ac conductivity, over the studied temperature and frequency range, is described by Jonscher's power law. The thermal behavior of the extracted exponent s confirmed that the CBH model is the appropriate model for this compound.
Conflicts of interest
The authors declare that they have no known competing financial interests or personal relationships that could have appeared to influence the work reported in this paper.References
- K. E. Lee, N. Morad, T. T. Teng and B. T. Poh, Chem. Eng. Sci., 2012, 203, 370 CrossRef CAS.
- F. Garnier, Chem. Phys., 1998, 227, 253 CrossRef CAS.
- A. Gagor, M. Wojtas, A. Pietraszko and R. Jakubas, Acta Crystallogr., Sect. B: Struct. Sci., 2008, 64, 558 CrossRef CAS PubMed.
- A. Oueslati and M. Gargouri, J. Alloys Compd., 2018, 739, 1089 CrossRef CAS.
- H. Zhang, X. Wang, K. Zhang and B. K. Teo, Coord. Chem. Rev., 1999, 183(1), 157 CrossRef CAS.
- M. Ben Bechir, K. Karoui, M. Tabellout, K. Guidara and A. Ben Rhaiem, J. Alloys Compd., 2014, 588(5), 551 CrossRef CAS.
- S. Karoui, S. Kamoun and A. Jouini, J. Solid State Chem., 2013, 197, 60 CrossRef CAS.
- B. Saparov and D. B. Mitzi, Chem. Rev., 2016, 116, 4558 CrossRef CAS.
- H. Zhang, X. Wang, K. Zhang and B. K. Teo, Coord. Chem. Rev., 1999, 183, 157 CrossRef CAS.
- L. Li, M. M. Turnbull, C. P. Landee, J. Jornet, M. Deumal, J. J. Novoa and J. L. Wikaira, Inorg. Chem., 2007, 46, 11255 Search PubMed.
- S. Wang, D. B. Mitzi, C. A. Field and A. Guloy, J. Am. Chem. Soc., 1995, 117, 5297 CrossRef CAS.
- D. B. Mitzi, K. Liang and S. Wang, Inorg. Chem., 1998, 37, 321 CrossRef CAS.
- N. Chihaoui, B. Hamdi and R. Zouari, J. Mol. Struct., 2017, 114 Search PubMed.
- I. Chaabane, F. Hlel and K. Guidara, PMC Phys. B, 2008, 1, 1 CrossRef.
- R. H. Blessing, Acta Crystallogr., Sect. A: Found. Crystallogr., 1995, 51, 33 CrossRef.
- G. M. Sheldrick, SHELXS-97: Program for Crystal Structure Solution, University of Göttingen: Göttingen, Germany, 1997 Search PubMed.
- G. M. Sheldrick, SHELXL-97: Program for Crystal Structure Refinement, University of Göttingen: Göttingen, Germany, 1997 Search PubMed.
- L. J. Farrugia, J. Appl. Crystallogr., 1997, 30, 565 CrossRef CAS.
- K. Brandenburg, Diamond Version 2.0 Impact GbR, Bonn, Germany, 1998 Search PubMed.
- A. R. Lim, RSC Adv., 2022, 12, 28720 RSC.
- A. Srinivasa Rao, E. Sunil Babu, K. C. Kumara Swamy and S. K. Das, Polyhedron, 2010, 29, 1706 CrossRef.
- I. Chaabane, F. Hlel and K. Guidara, J. Alloys Compd., 2008, 461, 495 CrossRef CAS.
- N. Kumar, A. Shukla, C. Behera and R. N. P. Choudhary, J. Alloys Compd., 2016, 688, 858 CrossRef CAS.
- J. R. Macdonald, Impedance Spectroscopy. John Wiley and Sons, New York, 1987 Search PubMed.
- K. Omri, R. Lahouli and L. El Mir, Results Phys., 2019, 12, 2141 CrossRef.
- Y. Pu, Z. Dong, P. Zhang, Y. Wu, J. Zhao and Y. Luo, J. Alloys Compd., 2016, 672, 64 CrossRef CAS.
- P. Nayak, T. Badapanda, A. K. Singh and S. Panigrahi, RSC Adv., 2017, 7, 16319 RSC.
- R. Pattanayak, S. Panigrahi, T. Dash, R. Muduli and D. Behera, Phys. B, 2015, 474, 57 CrossRef CAS.
- D. Johnson, ZPlot, ZView Electrochemical Impedance Software, Version 2.3b, Scribner Associates Inc., North Carolina, 2000 Search PubMed.
- B. Behera, P. Nayak and R. N. P. Choudhary, J. Mater. Sci.: Mater. Electron., 2008, 19, 1005 CrossRef CAS.
- A. Omri, M. Bejar, E. Dhahri, M. Es-Souni, M. Valente, M. Graça and L. Costa, J. Alloys Compd., 2012, 536, 173 CrossRef CAS.
- M. M. Costa, G. F. M. Pires Jr, A. J. Terezo, M. P. F. Graca and A. S. B. Sombra, J. Appl. Phys., 2011, 110, 034107 CrossRef.
- M. Hamdi, A. Oueslati, I. Chaabane and F. Hlel, International Scholarly Research Network ISRN Condensed Matter Physics, 2012, vol. 1, p. 750497 Search PubMed.
- M. Amine Fersi, I. Chaabane and M. Gargouri, Phys. E, 2016, 83, 306 CrossRef.
- A. Oueslati, Ionics, 2016, 10, 1878 Search PubMed.
- E. Barsoukov and J. Ross Macdonald, Impedance Spectroscopy Theory, Experiment, and Applications, Wiley Interscience, 2005, p. 14 Search PubMed.
- A. K. Pradhan, S. Saha and T. K. Nath, Appl. Phys. A, 2017, 123, 715 CrossRef.
- I. G. Austin and N. F. Mott, Adv. Phys., 1969, 18, 41 CrossRef CAS.
- A. Oueslati, Ionics, 2017, 23, 857 CrossRef CAS.
- A. A. A. Darwish, E. F. M. El-Zaidia, M. M. El-Nahass, T. A. Hanafy and A. A. Al-Zubaidi, J. Alloys Compds, 2014, 589, 393 CrossRef CAS.
- G. A. Khan and C. A. Hogarth, J. Mater. Sci., 1991, 26, 17 CrossRef CAS.
- M. Jebli, C. Rayssi, J. Dhahri and K. Khirouni, Appl. Phys. A: Mater. Sci. Process., 2020, 126, 108 CrossRef.
- A. Zolanvari, N. Goyal and S. K. Tripathi, Pramana, 2004, 63, 617 CrossRef CAS.
- A. Oueslati and M. Gargouri, J. Alloys Compd., 2018, 739, 1089 CrossRef CAS.
- M. Ben Bechir, K. Karoui, M. Tabellout, K. Guidara and A. Ben Rhaiem, J. Appl. Phys., 2014, 115, 203712 CrossRef.
- S. R. Elliott, Adv. Phys., 1987, 36, 135 CrossRef CAS.
- M. Abid Derbel, S. Nasr, H. Naïli and W. Rekik, Inorg. Chem. Commun., 2022, 142(6), 109654 CrossRef CAS.
- J. Wang, X. Deng, F. Zhang, D. Chen and W. Ding, Nanoscale Res. Lett., 2014, 9, 117 CrossRef PubMed.
- M. Arakha, M. Saleem, C. Mallick Bairagi and S. Jha, Sci. Rep., 2015, 5, 1 Search PubMed.
Footnote |
| † Electronic supplementary information (ESI) available. CCDC 2090035. For ESI and crystallographic data in CIF or other electronic format see DOI: https://doi.org/10.1039/d3ra00561e |
| This journal is © The Royal Society of Chemistry 2023 |

