DOI:
10.1039/D3RA01463K
(Paper)
RSC Adv., 2023,
13, 16126-16135
Simulation of a thermo-electrochemical cell with graphite rod electrodes†
Received
5th March 2023
, Accepted 4th May 2023
First published on 30th May 2023
Abstract
The rapid development of human society has resulted in the extensive release of waste heat. The thermo-electrochemical cell (TEC), a cutting-edge technology that converts low-grade waste heat into electricity, has garnered increasing attention. However, the complex interactions among various processes, such as fluid flow, electrochemical reactions and heat transfer, make it challenging to evaluate their effect on the overall performance of the TEC. Understanding the synergistic mechanisms and coupling effects of these processes is crucial for optimizing and implementing TECs in practical applications. In this paper, a mathematical model is developed by coupling electrochemical reactions and heat/mass transfer. The distributions of ion concentration, electrolyte velocity and temperature are analyzed under varying temperature differences and electrode distances. The results demonstrate a significant interaction between heat transfer and electrolyte flow. Higher temperatures not only improve the open circuit voltage, but also promote ion transport convection and hence enhance the current density. In addition, a higher concentration of ions or smaller electrode spacing exhibits an apparently improved performance of the TEC, due to the facilitated ion transport and reduced concentration overpotential. Notably, electrode spacing has a negligible effect on the maximum power density of the TEC under a constant heat flux, but it does enhance the current density due to the combined effect of heat and ion transfer. Overall, the proposed mathematical model provides deeper insight into the physical–chemical processes involved in TECs and offers valuable guidance for TEC design and practical applications.
1. Introduction
Extensive consumption of fuel has resulted in the discharge of waste heat, which accounts for over 60% of total energy.1–3 The releasing of waste heat not only reduces energy efficiency, but also contributes to severe thermal pollution.4,5 Recovering waste heat is a promising approach to improve the energy efficiency of industrial plants, vehicles and residential buildings. While high-temperature heat can be directly reused in industries, the utilization and recovery of low-grade waste heat is difficult using conventional technologies due to the low energy density.6,7 In the past decades, several approaches have been developed for low-grade heat utilization, such as the organic Rankine cycle, Kalina cycle and thermoelectric generators, etc.8–11 However, these technologies still face several challenges including the huge size and weight of thermodynamic cycle systems or the low Seebeck coefficient of thermoelectric materials.12,13
Significantly, the thermo-electrochemical cell (TEC) is a technology that generates electricity through temperature-dependent redox reactions occurring at the surface of electrodes, with a Seebeck coefficient typically in the order of mV K−1.14,15 In TECs, the electrode with higher temperature is designated as the anode, while the cold electrode acts as the cathode, assuming the entropy of the redox reaction is negative. In general, the voltage output of TECs is proportional to the entropy of the redox reactions, which is determined by the reaction and transport of chemical species.16,17 In TECs, two electrodes are maintained at different temperatures to produce voltage output, due to differences in entropy between anode and cathode. Most TECs were operated at a stagnant cell, in which thermal energy exchanged between anode and cathode without the flow of electrolytes and chemical species into or out of the cell.18–21 The reactions were maintained by the transport of reactants and products between anode and cathode. However, the concentration gradient of the reactants or products was observed near the electrode surface, resulting in the concentration overpotential, which limited the power generation of TECs in stagnant cell design, as reported in the literatures.19,22
To evaluate the heat and mass transfer in TECs, the concentration and temperature distribution were analyzed by researches. For example, Gunathilaka et al. applied operando magnetic resonance imaging approach to collect the quantitative spatial maps of electrolyte temperature and ion concentrations in TECs.22 Hasan et al. evaluated the temperature distribution in TECs with a membrane using infrared thermography, and analyzed the effect of membrane position on cell performance.23,24 However, it should be noted that the physical–chemical processes in TECs were complex due to the coupling of ion transport, fluid flow, heat transfer and electrochemical reactions. In TECs, the density of electrolyte varies with temperature from the anode to cathode, resulting in the formation of density difference that leads to natural convection flow of electrolyte. The electrolyte flow will prompt ion transport and heat transfer between the anode and cathode, consequently affecting the reaction rate and power output.25–27 The interplays among these different processes make it challenging to understand the individual effects on the overall performance of TECs.
Mathematical model is effective tool to reveal the interactions among different processes in electrochemical systems. Qian et al. reported a numerical model to evaluate the thermodiffusion coefficients of potassium ferri/ferrocyanide in TECs, identifying coefficients of −8.30 × 10⁻¹², −6.56 × 10⁻¹² and −3.48 × 10⁻¹² m2 (s K)−1 for ferricyanide, ferrocyanide and potassium ion, respectively. However, the convection of heat and mass transfer was not considered in this model.28 Kazim et al. proposed a model to analyze the heat transfer and hydrodynamic features of electrolyte in a macro-channel flow TEC, and quantitatively calculated the heat transfer coefficient, thermal resistance and Nusselt number at different flow rates or Reynolds numbers.29 However, the ion transport and electrochemical performance were not involved in the model. Therefore, it is necessary to develop a global model to analyze the interactions among various processes in TECs.
Herein, this paper developed a coupling model involving electrochemical reactions and heat/mass transfers to evaluate the interactions among various processes and their effects on the TEC performance. The distributions of ion concentration, electrolyte velocity and temperature were analyzed at different temperature differences and electrode distances. In addition, this paper highlighted the key limitations in TECs aiming to achieve the optimization of performance. In all, the proposed models contribute to a better understanding of the physical–chemical processes in TECs and provide guidance for TEC design and applications.
2. Methodology
2.1 Experimental description
A TEC was constructed based on graphite electrodes. As shown in Fig. 1a, a graphite electrode (diameter 4 mm, length 60 mm) was fixed at both side of the reactor with one end immersed into the electrolyte (15 mm). The cylindrical acrylic acid reactor was constructed with a diameter of 7 mm and a length of 20 mm. The electrolyte prepared with 0.4 M Fe(CN)64−/Fe(CN)63− solution. The power generation performance of TEC was investigated with electrolyte sealing model at temperature difference 20 °C. The voltage–current density curve of TEC was drawn by adjusting the resistance box from 5 to 10![[thin space (1/6-em)]](https://www.rsc.org/images/entities/char_2009.gif) 000 Ω at 0.4 mol per L Fe(CN)64−/Fe(CN)63− and temperature difference 20 °C. The power density of the TEC was calculated according to equation P = UI/A, where A is the anodes project area, I and U the sustainable current and cell voltage after the TEC reached steady-state, respectively.
000 Ω at 0.4 mol per L Fe(CN)64−/Fe(CN)63− and temperature difference 20 °C. The power density of the TEC was calculated according to equation P = UI/A, where A is the anodes project area, I and U the sustainable current and cell voltage after the TEC reached steady-state, respectively.
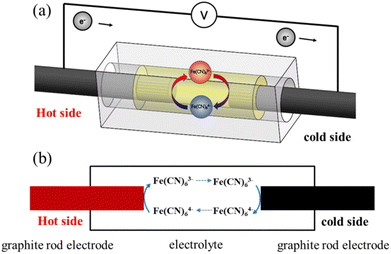 |
| | Fig. 1 (a) 3D schematic representation and (b) the mathematical model of thermo-electrochemical cell. | |
2.2 Model description
Fig. 1b showed the mathematical model of thermo-electrochemical cell. The model was established based on following assumptions:
(1) The system was at steady state.
(2) Ion transport was controlled by diffusion and convection.
(3) Electrolyte was incompressible.
(4) The surface of electrode and cell was non-slip boundary conditions.
The redox reactions at the electrodes are expressed as:
| | |
Fe(CN)63− + e− ↔ Fe(CN)64−
| (1) |
The voltage of the TEC was obtained based on following equation:
| | |
VOCV = −STEC(Ta − Tc)
| (2) |
where
STEC is the Seebeck coefficient of the TEC.
2.2.1 Heat transfer in the TEC. The heat transfer in the TEC can be expressed as follows:| |
 | (3) |
where Cp, ρ and u are the heat capacity, density and velocity of fluid, k is thermal conductivity, the term S is the heat source.
2.2.2 Electrochemical reaction. In the TEC, the electrochemical reaction is a function of overpotential, the current density of electrode is descried using concentration-dependent Butler–Volmer equation:30Anode:
| |
 | (5) |
Cathode:
| |
 | (6) |
where
i0 is the exchange current density,
n is the transferred number of electrons,
α and
β are electron transfer coefficient.
ηa and
ηc are overpotentials of anode and cathode, as expressed:
The electron and ion transfer in the electrode and electrolyte are expressed as:
where
j is the current density,
σ is the conductivity,
∅ is the electrode potential and
J is the current source.
2.2.3 Mass transport of ion species. The transport of diluted ions including oxidized and reduced species in the TEC is described by following equations:31where Ni, Si, Di and u are the molar flux vector, the source term, the diffusion coefficient and the velocity vector of electrolyte.The reaction source term of electrode is calculated by:
| |
 | (15) |
where
e and
ni are the stoichiometric coefficient and the transferred electron number.
2.2.4 Fluid flow. The mass conservation of the TEC can be expressed as:| |
 | (16) |
Momentum conservation was described by the Navier–Stokes equations:
| |
 | (17) |
The density of electrolyte are the temperature-dependent parameters, as follows:32
| | |
ρ = 1063 + 0.546 × T − 0.00147 × T2
| (19) |
2.2.5 Boundary condition. Apart from the two-side of electrode, other boundaries are the insulated boundary:The potential of anode and cathode was set as zero and cell voltage. Except for the two-side of electrode, other boundaries are insulating boundary:
The flux at the wall of TEC was zero:
The mathematical model was solved based on COMSOL Multiphysics and the model parameters were showed in Table S1.† During the calculation, the electric field was first obtained based on the electrochemical reaction kinetics. And heat transfer and fluid flow were then solved to obtain the distribution of temperature and velocity. Finally, the mass transport of chemical species was solved based on Nernst–Planck equation. To verify the reliability of the model, the modeling data was compared with experimental results (Fig. 2). One can see that the modeling data match well with experiment.
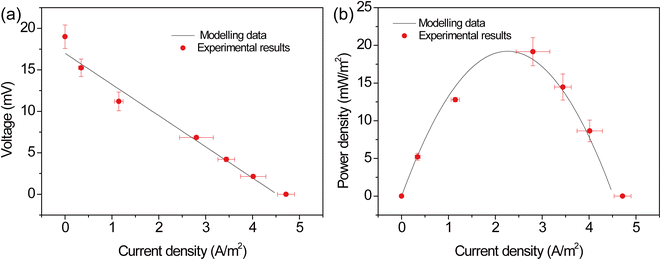 |
| | Fig. 2 Comparison between modelling data and experimental results. | |
3. Results and discussion
3.1 Field distribution of TEC
The ion transport, temperature distribution and ion concentration distribution inside the TEC were interacted and jointly determined the cell performance. Therefore, it is of great importance to explore field of the velocity, temperature and concentration and reveal the interplays among these processes. Fig. 3a depicted a cloud diagram illustrating the velocity of the electrolyte inside the TEC. It can be seen that the electrolyte velocity is higher near both the anode and cathode compared to the top and bottom of the TEC. This is mainly attributed to the temperature difference between anode and cathode, which leads to a density difference in the electrolyte and hence the formation of a natural flow. In detail, the electrolyte near the anode, this was at a higher temperature, ascended and flowed towards to the cathode. Subsequently, the electrolyte near the cathode descended due to the higher density at a lower temperature. Consequently, a ring-like natural flow was formed in the TEC. Notably, this natural flow can enhance the transfer of Fe(CN)64−/Fe(CN)63− between the anode and cathode. Nevertheless, it should be noted that the flow of electrolyte also prompts the heat transfer from the anode to cathode. As depicted in Fig. 3b, the temperature of the electrolyte was higher at the upper of the TEC. The heat was carried to the cathode from anode through electrolyte. Consequently, the colder electrolyte was flowed back to the anode through the lower area of the TEC. According to the flow direction of the electrolyte, it is clear that the Fe(CN)63− produced at anode were transfer to cathode through the upper of the TEC, while the/Fe(CN)64− was transferred back to anode through the lower area of the TEC, consistent with the flow direction of the electrolyte. The facilitated ion convection transport can alleviate the concentration overpotential and enhance the cell performance. However, it should be noted that the velocity of “dead zone” at the corner of the TEC was significantly lower than that in the middle of cell, consequently leading to insufficient supply and expelling of chemical species. The accumulation of products and insufficient supply of reactants resulted in the deterioration of TEC power output.
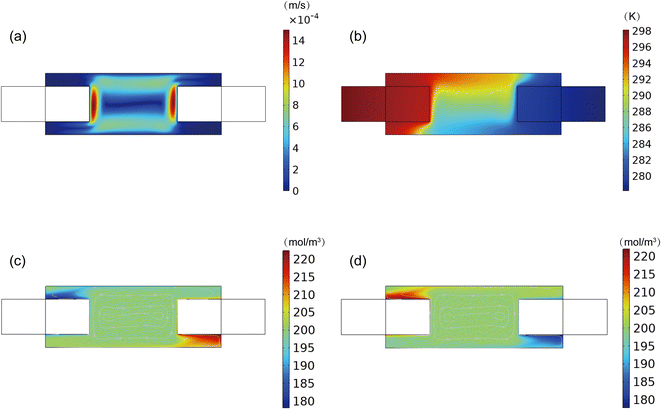 |
| | Fig. 3 Distribution of (a) velocity, (b) temperature, (c) Fe(CN)63− and (d) Fe(CN)64−. | |
3.2 Effect of concentration on the TEC
The concentration of chemical species in a TEC is a key factor that affects the reaction rate of the electrodes. To reveal the relationship between the concentration of Fe(CN)64−/Fe(CN)63− and the reaction rate, the performance of the TEC were studied at different electrolyte concentrations. Fig. 4 shows the polarization and power density curves of the TEC at different concentrations. As can be seen from Fig. 4a, the open-circuit voltage kept almost unchanged with varying concentration, but the concentration of Fe(CN)64−/Fe(CN)63− has a significant impact on the TEC performance. It can be found that the performance of the TEC remarkably increased with increasing concentration. In detail, the short-circuit current density of the TEC increased from 3.2 to 5.7 A m−2, and the maximum power density increased from 13.7 to 24.2 mW m−2 by changing Fe(CN)64−/Fe(CN)63− concentration from 0.2 to 0.8 mol L−1. However, it should be noted that the TEC performance was not linearly changed with Fe(CN)64−/Fe(CN)63− concentration, and the increment in TEC performance gradually decreased at higher concentrations. The maximum power density of the TEC increased by 40.1%, 15.6% and 9.0% when increasing the concentration from 0.2 mol L−1 to 0.4 mol L−1, 0.6 mol L−1 and 0.8 mol L−1, respectively. Above phenomena may be attributed to the reason that the mass transfer limitation was alleviated at higher concentrations of Fe(CN)64−/Fe(CN)63−, which was consistent with previous study.33
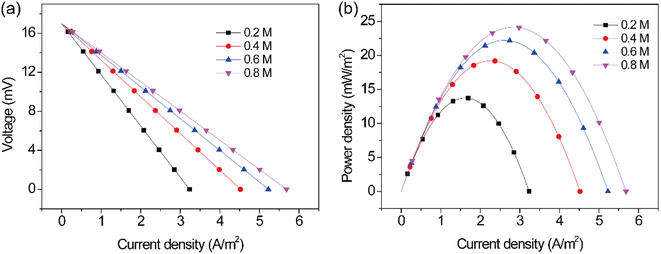 |
| | Fig. 4 (a) Polarization and (b) power density curves at different current densities. | |
In order to further analyze the distribution of Fe(CN)64−/Fe(CN)63− in the TEC, the cloud chart of concentrations distribution at 0.2, 0.4, 0.6 and 0.8 M Fe(CN)64−/Fe(CN)63− was obtained. For better comparison, all data was plotted through dimensionless processing. From Fig. 5a–d, one can see that Fe(CN)63− was mainly accumulated in the upper area of the anode, while it was insufficient supplied in the lower area of the cathode. At a higher Fe(CN)64−/Fe(CN)63− concentration, this phenomenon was still appeared. However, higher concentrations can alleviate the accumulation of products and the insufficient supply of reactant. Deviation of concentration near the electrode surface was quantified by calculating the average concentration of Fe(CN)64−/Fe(CN)63− at different current densities, as shown in Fig. 5e and f. At an electrode current density of 0 A m−2, the concentration on the electrode surface was consistent with the bulk concentration. However, with the increase of the electrode current density, an obvious concentration deviation was observed, resulting in a concentration difference between bulk solution and electrode surface. In addition, it can be found that the concentration deviation was remarkably alleviated at higher concentrations. At a current density of 3.2 A m−2, the concentration deviation decreased by 50.8%, 26.4.6% and 13.7%, when increasing the concentration from 0.2 mol L−1 to 0.4 mol L−1, 0.6 mol L−1 and 0.8 mol L−1. A lower deviation implies a smaller overpotential resulting from concentration difference between electrode surface and bulk solution. This result is consistent with the analysis in Fig. 4.
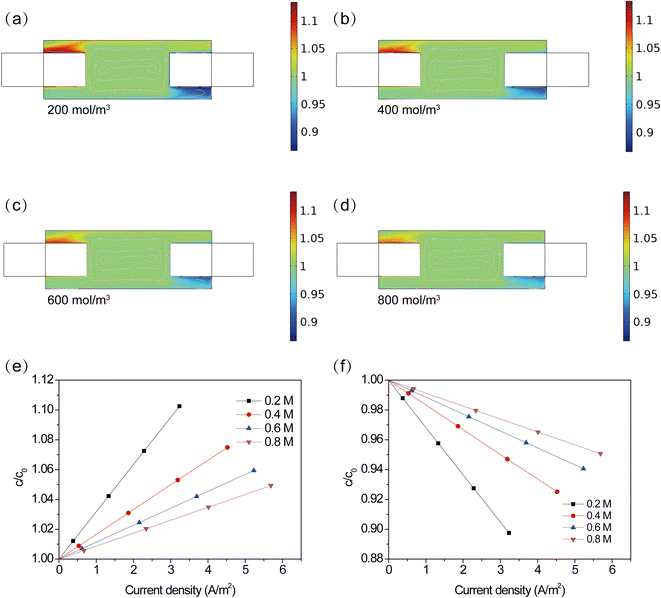 |
| | Fig. 5 (a–d) Cloud chart of concentration distribution at 0.2, 0.4, 0.6 and 0.8 M Fe(CN)64−/Fe(CN)63−, (e) and (f) concentration of products and reactant on the surface of electrode. | |
In general, the concentration is a key factor affecting the reaction kinetics in the TEC. However, the short circuit current and the maximum power density of the TEC were not linearly increased with increasing concentration, especially at a high concentration. This phenomenon suggests that further increasing concentration higher than 0.8 mol L−1 is uneconomical due to the amplification of reaction kinetics and power density was smaller. In addition, the viscosity coefficient of electrolyte will increase at a higher concentration. According to the Stokes–Einstein equation, the viscosity of the electrolyte is inversely proportional to the diffusion coefficient and fluid flow. That is, the increasing viscosity will lead to the inhibition of ion diffusion and convection, eventually resulting in a higher overpotential and deteriorating the TEC performance.
According to the above analysis, one can see that increasing concentration from 0.2 to 0.4 mol L−1 exhibited a higher increment of power density. The increment became smaller when further increasing Fe(CN)64−/Fe(CN)63− concentration from 0.6 to 0.8 mol L−1, implying that a concentration of 0.4–0.6 mol L−1 is preferred in this work. Although further increasing concentration of Fe(CN)64−/Fe(CN)63− can also improve the TEC performance, the increment is not economically feasible in practical applications.
3.3 Effect of temperature difference on the TEC
Apart from the concentration of Fe(CN)64−/Fe(CN)63−, temperature is another factor affecting the performance of the TEC. As shown in Fig. 6, the polarization and power density curves of the TEC were obtained at various temperature differences. It can be seen that the temperature difference has a significant impact on the open circuit voltage, short circuit current and maximum power density. Specifically, with the increase of the temperature difference, the open circuit voltage and short circuit current of the TEC basically showed a linear increase. For instance, the open-circuit voltage and short-circuit current density of the TEC increased from 16.9 mV and 4.5 A m−2 to 42.3 mV and 12.6 A m−2, respectively, when increasing temperature difference from 20 to 50 °C. Meanwhile, the maximum power density also improved significantly from 19.2 to 133.9 mW m−2 with the increase of temperature difference (from 20 to 50 °C), corresponding to an increment of approximately 600%. These results indicated that the temperature difference is a crucial factor that determines the TEC power generation.
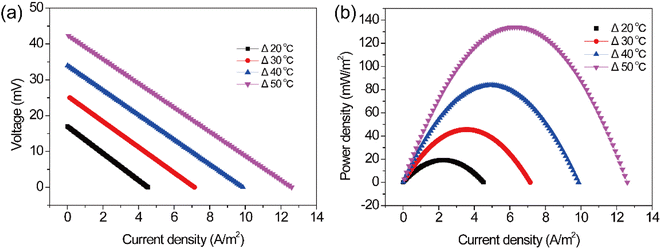 |
| | Fig. 6 (a) Polarization and (b) power density curves at different temperature differences. | |
To further explore the influence of temperature on the performance of the TEC, the distribution and variation of electrolyte concentration were studied at different temperature differences. Fig. 7a–d shows the concentration distribution of Fe(CN)63− in the TEC. It can be seen that changes in temperature difference can obviously affect the local concentration of Fe(CN)63− on the electrode surface. A larger temperature difference resulted in deteriorative ion transport, as evidenced by the concentration deviation between the electrode surface and bulk solution, as shown in Fig. 7e. Smaller concentration deviation was observed at higher temperature difference. A lower concentration difference implies a smaller overpotential and a better electrode reaction kinetics. However, it is worth noting that a faster electrode reaction rate will generate/consume more products/reactants, adversely leading to a larger concentration deviation. This is inconsistent with the results in Fig. 7a–d, implying the presence of an additional factor in the TEC. To explain this phenomenon, velocity profiles were further collected at various temperature differences. One can see that a larger temperature difference resulted in a stronger natural flow, which contributed to the improvement of ion transport and hence alleviated concentration deviation. Therefore, it concluded that the higher power output at a larger temperature difference can be attributed to the improved thermodynamic voltage and facilitated ion transport through electrolyte natural flow.
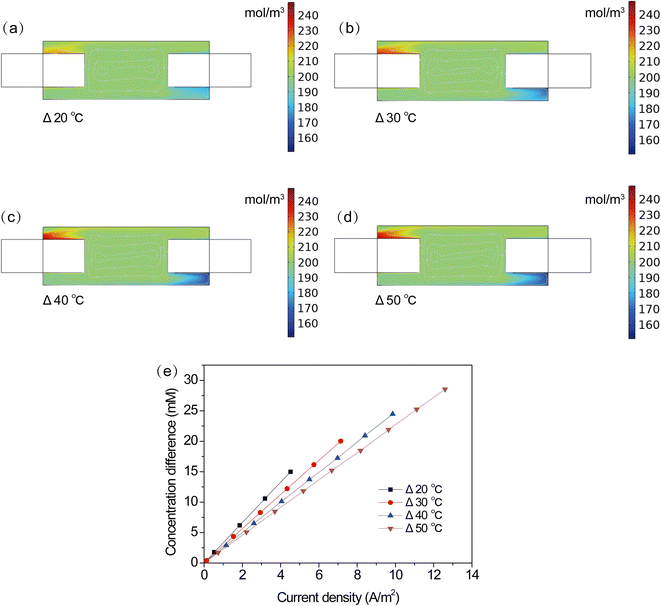 |
| | Fig. 7 (a–d) Cloud chart of concentration distribution, (e) concentration difference at different current densities. | |
3.4 Effect of electrode distance on the TEC
3.4.1 Constant electrode spacing and temperature difference. The structure of the TEC is an important parameter that affects mass transfer, reaction area and internal resistance. The performance output can be improved by optimizing the structure of the TEC. The optimization of electrode spacing is particularly important to improve the TEC performance. To evaluate the influence of electrode distance on the TEC performance, while keeping the electrode reaction area and electrode temperature difference constant. As shown in Fig. 8, the polarization and power density curves of the TEC were obtained at different electrode spacing. One can see that the variation of electrode spacing has a significantly effect on the TEC performance, similar to the effect of concentration. The open circuit voltage of TEC was almost unchanged at different electrode spacings, but the short circuit current density and the maximum power density remarkably decreased. The short circuit current density and the maximum power density decreased from 5.3 A m−2 and 22.7 mW m−2 to 3.5 A m−2 and 15.1 mW m−2, respectively, when increasing electrode spacing from 5 to 20 mm. This suggested that the TEC with the shorter electrode spacing delivered higher power output.
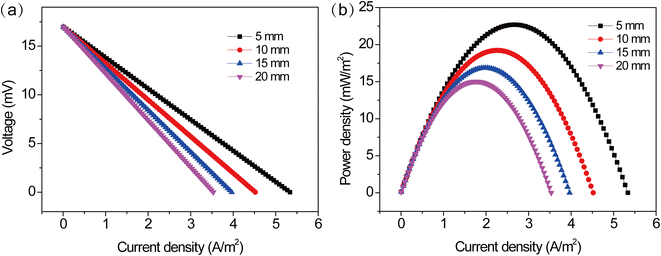 |
| | Fig. 8 (a) Polarization and (b) power density curves at different electrode distances at a temperature difference of 20 °C. | |
To provide a more in-depth analysis of the influence of electrode spacing on the TEC performance, the distribution and variation of concentration were discussed. As shown in Fig. 9a–d, the cloud chart of concentration distribution in the TEC was collected at different electrode spacing. One can see that the increase of electrode spacing had a minor effect on the concentration near the electrode surface, specifically at a temperature difference of 20 °C and the initial concentration of 0.4 mol L−1. This implied that the change of electrode spacing had a negligible effect on the electrode reaction kinetics. Therefore, the increase of electrode spacing mainly led to a longer distance for ion transport between the anode and cathode, consequently resulting in inhibited ion transport and hence deteriorating the TEC performance. Therefore, a higher power output in TECs with shorter electrode spacing mainly arose from the decreased diffusion distance and alleviated concentration overpotential.
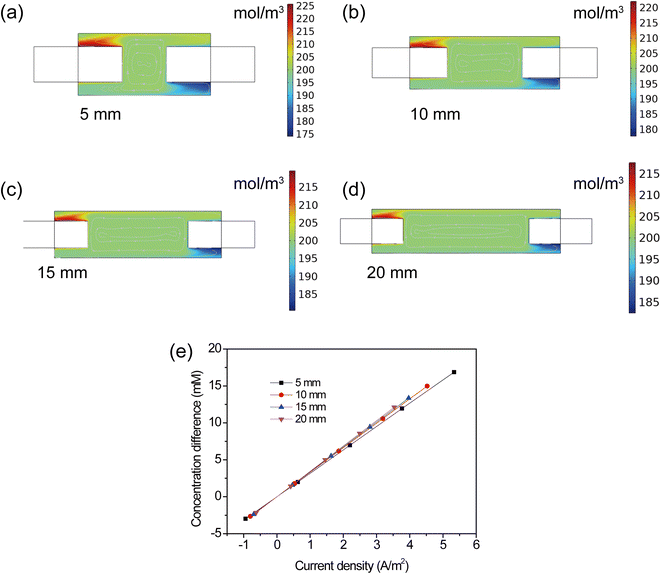 |
| | Fig. 9 (a–d) Cloud chart of concentration distribution, (e) concentration difference at different electrode spacing. | |
3.4.2 Constant heat flux at difference electrode spacing. In the practical application, the temperature difference was usually maintained by using heat sources. To simulate this situation, the electrode surface was set as the boundary with a constant heat flux. The temperature difference, polarization and power density curves were obtained at different electrode spacing, as shown in Fig. 10. One can see that the temperature difference remarkably increased from 7.2 to 8.4 °C by increasing electrode spacing from 5 to 20 mm (Fig. 10a). Notably, a higher open circuit voltage was observed at longer electrode spacing, due to the higher temperature difference. The open-circuit voltage of the TEC increased from 6.1 to 7.1 mV. However, one can see that the TEC with a longer electrode spacing exhibited a lower voltage output and a large slope of V–I curves at a high current density (>0.7 A m−2). Additionally, the short circuit current density decreased from 1.6 to 1.1 A m−2 with the increase of electrode spacing from 5 to 20 mm (Fig. 10b). This was due to the limited ion transport between the anode and cathode at longer electrode spacing, resulting in a larger internal resistance. Therefore, although the TEC could produce a higher open circuit voltage at longer electrode distance, the increased transport resistance conversely limited the power output at high current densities. The overall performance was dominated by above combined effect. As shown in Fig. 10c, it can be seen that the maximum power densities were similar at difference spacing. Due to the limited ion transport, the current density near maximum power density was smaller at longer electrode spacing. Although electrode spacing had little effect on maximum power density, a longer distance was unfavorable to the reaction rate. Therefore, it implies that the slight changes in electrode spacing will not cause a significant fluctuation in power generation. From the point of view of energy output and conversion efficiency, it is preferred to operate the TEC at shorter electrode spacing due to a wider range of current density.
 |
| | Fig. 10 (a) Temperature difference, (b) polarization and (c) power density curves at different electrode spacing at a heat flux of 4000 W m−2. | |
4. Conclusion
In this paper, we developed a mathematical model including electrochemical reactions, heat transfer and ion transport. The distributions of ion concentration, fluid velocity and temperature were collected based on the simulation at different temperature differences and electrode spacing. The results showed that heat transfer was closely coupled with electrolyte flow. The increase in temperature resulted in a remarkable improvement of the TEC performance, due to the facilitated electrolyte flow and ion transport. In addition, the TEC performance was apparently improved at higher concentrations or smaller electrode spacing, attributing to the shortened transport distance and lowered concentration overpotential. Also, the maximum power density of the TEC kept almost unchanged at various electrode spacing, because of the combined effect of heat and ion transfer in the TEC. These results suggested that the developed model is conductive to the understanding of the physical–chemical processes in the TEC and can provide a guidance for TEC design and optimization.
Conflicts of interest
There are no conflicts to declare.
Acknowledgements
The authors are thankful to the Science and Technology Department Project of Henan Province (No. 222102320109) and Foundation Project of Key Laboratory of Low-grade Energy Utilization Technologies and Systems (No. LLEUTS-202015).
References
- Z. Bu, X. Zhang, Y. Hu, Z. Chen, S. Lin, W. Li, C. Xiao and Y. Pei, Nat. Commun., 2022, 13, 237 CrossRef CAS PubMed.
- M. Zebarjadi, K. Esfarjani, M. Dresselhaus, Z. Ren and G. Chen, Energy Environ. Sci., 2012, 5, 5147–5162 RSC.
- G. Schierning, Nat. Energy, 2018, 3, 92–93 CrossRef CAS.
- Y. Chen, C. Li and Z. Zeng, J. Clean. Prod., 2021, 310, 127509 CrossRef.
- X. Ma, J. Chen, S. Li, Q. Sha, A. Liang, W. Li, J. Zhang, G. Zheng and Z. Feng, Appl. Therm. Eng., 2003, 23, 797–806 CrossRef CAS.
- P. Ying, R. He, J. Mao, Q. Zhang, H. Reith, J. Sui, Z. Ren, K. Nielsch and G. Schierning, Nat. Commun., 2021, 12, 1121 CrossRef CAS PubMed.
- A. Härtel, M. Janssen, D. Weingarth, V. Presser and R. Van Roij, Energy Environ. Sci., 2015, 8, 2396–2401 RSC.
- J. Song, X. Li, K. Wang and C. N. Markides, Energy Convers. Manag., 2020, 218, 112999 CrossRef CAS.
- R. Pili, L. G. Martínez, C. Wieland and H. Spliethoff, Renew. Sustain. Energy Rev., 2020, 134, 110324 CrossRef CAS.
- A. S. Kalan, H. Ghiasirad, R. K. Saray and S. Mirmasoumi, Energy Convers. Manag., 2021, 247, 114723 CrossRef.
- S. Shoeibi, M. Saemian, M. Khiadani, H. Kargarsharifabad and S. A. A. Mirjalily, Energy Convers. Manag., 2023, 276, 116504 CrossRef.
- Y. Xiang, X. Guo, H. Zhu, Q. Zhang and S. Zhu, Chem. Eng. J., 2023, 20, 142018 CrossRef.
- C. Xu, Y. Sun, J. Zhang, W. Xu and H. Tian, Adv. Energy Mater., 2022, 12, 2201542 CrossRef CAS.
- Y. Liu, M. Cui, W. Ling, L. Cheng, H. Lei, W. Li and Y. Huang, Energy Environ. Sci., 2022, 15, 3670–3687 RSC.
- T. Xu, W. Li, Z. Ma, Y. Qian, Q. Jiang, Y. Luo and J. Yang, Nano Energy, 2022, 103, 107826 CrossRef CAS.
- M. Li, M. Hong, M. Dargusch, J. Zou and Z.-G. Chen, Trends Chem., 2021, 3, 561–574 CrossRef CAS.
- J. Duan, B. Yu, L. Huang, B. Hu, M. Xu, G. Feng and J. Zhou, Joule, 2021, 5, 768–779 CrossRef CAS.
- R. Hu, B. A. Cola, N. Haram, J. N. Barisci, S. Lee, S. Stoughton, G. Wallace, C. Too, M. Thomas and A. Gestos, Nano Lett., 2010, 10, 838–846 CrossRef CAS PubMed.
- J. H. Kim, Y. Choi, G. Shin, J. G. Jeon, H. J. Kim, Y. Han, B. J. So, S. Yun, T. Kim and T. J. Kang, J. Power Sources, 2023, 563, 232819 CrossRef CAS.
- J. Duan, B. Yu, K. Liu, J. Li, P. Yang, W. Xie, G. Xue, R. Liu, H. Wang and J. Zhou, Nano Energy, 2019, 57, 473–479 CrossRef CAS.
- Q. Shen, Z. Ning, B. Fu, S. Ma, Z. Wang, L. Shu, L. Zhang, X. Wang, J. Xu and P. Tao, J. Mater. Chem. A, 2019, 7, 6514–6521 RSC.
- I. E. Gunathilaka, J. M. Pringle and L. A. O'Dell, Nat. Commun., 2021, 12, 6438 CrossRef CAS PubMed.
- S. W. Hasan, S. M. Said, M. F. M. Sabri, A. S. A. Bakar, N. A. Hashim, M. M. I. M. Hasnan, J. M. Pringle and D. R. MacFarlane, Sci. Rep., 2016, 6, 1–11 CrossRef PubMed.
- S. W. Hasan, S. M. Said, A. S. B. A. Bakar, M. F. M. Sabri, I. H. Sajid and N. A. Hashim, J. Mater. Sci., 2017, 52, 10353–10363 CrossRef CAS.
- M. Dupont, D. MacFarlane and J. Pringle, Chem. Commun., 2017, 53, 6288–6302 RSC.
- M. A. Trosheva, M. A. Buckingham and L. Aldous, Chem. Sci., 2022, 13, 4984–4998 RSC.
- Y. Ikeda, Y. Cho and Y. Murakami, Sustain. Energy Fuels, 2021, 5, 5967–5974 RSC.
- G. Qian, Z. Li, R. Huang, J. Chen and X. Yu, Energy Rep., 2021, 7, 4895–4904 CrossRef.
- A. H. Kazim, A. S. Booeshaghi, S. T. Stephens and B. A. Cola, Sustain. Energy Fuels, 2017, 1, 1381–1389 RSC.
- E. J. Dickinson and A. J. Wain, J. Electroanal. Chem., 2020, 872, 114145 CrossRef CAS.
- A. L. Sehnem and M. Janssen, J. Chem. Phys., 2021, 154, 164511 CrossRef CAS PubMed.
- H. Saraç, M. Patrick and A. Wragg, J. Appl. Electrochem., 1993, 23, 51–55 CrossRef.
- M. A. Buckingham, K. Laws, H. Li, Y. Kuang and L. Aldous, Cell Rep. Phys. Sci., 2021, 2, 100510 CrossRef CAS.
|
| This journal is © The Royal Society of Chemistry 2023 |
Click here to see how this site uses Cookies. View our privacy policy here.  Open Access Article
 a,
Jun Li
 *ab,
Liang Zhang
 ab and
Yang Yang
 ab
ab
![[thin space (1/6-em)]](https://www.rsc.org/images/entities/char_2009.gif) 000 Ω at 0.4 mol per L Fe(CN)64−/Fe(CN)63− and temperature difference 20 °C. The power density of the TEC was calculated according to equation P = UI/A, where A is the anodes project area, I and U the sustainable current and cell voltage after the TEC reached steady-state, respectively.
000 Ω at 0.4 mol per L Fe(CN)64−/Fe(CN)63− and temperature difference 20 °C. The power density of the TEC was calculated according to equation P = UI/A, where A is the anodes project area, I and U the sustainable current and cell voltage after the TEC reached steady-state, respectively.


