 Open Access Article
Inhibitory selectivity to the AKR1B10 and aldose reductase (AR): insight from molecular dynamics simulations and free energy calculations†
Ping Lin*ab and
Yuzhen Niu *ac
*ac
aWeifang University of Science and Technology, Weifang, 262700, China. E-mail: linping07@mails.ucas.ac.cn; niuyzh12@lzu.edu.cn
bInstitute of Modern Physics, Chinese Academy of Science, Lanzhou 730000, China
cShandong Engineering Research Center of Green and High-value Marine Fine Chemical, Weifang University of Science and Technology, Weifang, 262700, China
First published on 6th September 2023
Abstract
AKR1B10 is over-expressed in many cancer types and is related to chemotherapy resistance, which makes AKR1B10 a potential anti-cancer target. The high similarity of the protein structure between AKR1B10 and AR makes it difficult to develop highly selective inhibitors against AKR1B10. Understanding the interaction between AKR1B10 and inhibitors is very important for designing selective inhibitors of AKR1B10. In this study, Fidarestat, Zopolrestat, MK184 and MK204 bound to AKR1B10 and AR were used to investigate the selectivity mechanism. The results of MM/PBSA calculations show that van der Waals and electrostatic interaction provide the main contributions of the binding free energy. The hydrogen bonding between residues Y49 and H111 and inhibitors plays a pivotal role in contributing to the high inhibitory activity of AKR1B10 inhibitors. The π–π stacking interaction between residue W112 and inhibitor also plays a key role in the stability of inhibitors and AKR1B10, but W112 should keep its natural conformation to stabilize the inhibitor–AKR1B10 complex. Highly selective AKR1B10 inhibitors should have a bulky moiety like a phenyl group, which can change its binding with ABP in binding with AR and cannot change its binding with AKR1B10. The free energy decomposition shows that residues W21, V48, Y49, K78, W80, H111, R298 and V302 are beneficial to the stability of the inhibitor–AKR1B10. Our work will provide an important in silico basis for researchers to develop highly selective inhibitors of AKR1B10.
1. Introduction
AKR1B10 (human aldo-ketoreduce family1, Member 10)1 and AKR1B1 (human aldo-ketoreduce family1, Member 1, also named aldose reductase, AR)2 are two members of the AKR1 subfamily B, and the homology between AKR1B10 and AR is 70.89%.3 The human AR is the key enzyme of the polyol pathway, which catalyzes the reduction of glucose to sorbitol with high glucose concentration.4 The overexpression of AR is related to the secondary complications of diabetes,5,6 and it is expressed in various tissues of the human body, so AR inhibitors are mainly used to treat the complications related to diabetes at present.7 However, the overexpression of AKR1B10 in various human tissues is obviously selective.8,9 For example, AKR1B10 is over-expressed in 70% of pancreatic cancer and tumor-like lesions in pancreatic epithelium.10 AKR1B10 is also over-expressed in erosive epithelium of esophagus and Barrett's epithelium, and further deterioration of this can lead to the occurrence of esophageal cancer.11,12 In addition, AKR1B10 is also expressed in the small intestine and colon,13 but at a low level in the liver, prostate, testis and thymus, while it is basically not expressed in most other normal human tissues.14 Therefore, AKR1B10 has become a potential target of anti-tumor drugs in recent years, and the research of its inhibitors has also brought new opportunities for tumor treatment.1 Moreover, AKR1B10 inhibitors can also affect the sensitivity of tumor cells to chemotherapeutic drugs, which can find a new way to improve the effect of tumor chemotherapy.15 Therefore, with the in-depth study of AKR1B10 and its inhibitors, finding efficient and selective AKR1B10 inhibitors will certainly bring new hope for the diagnosis and treatment of tumors.16–18Because of the high similarity of amino acid sequences of AKR1B10 and AR, the three-dimensional structure of them is also similar, which means that commonly developed inhibitors can both bind to AKR1B10 and AR. Selectivity is one of the most important factors affecting side effects in drug design,19 and it is extremely difficult to obtain selectivity in protein which belongs to the same family and has high sequence similarity.20 Therefore, considering the selective expression of AKR1B10 and AR in different tissues, it is necessary to improve the specificity of AKR1B10 inhibitors for anti-cancer by targeting AKR1B10. At present, relevant research on selective inhibitors of AKR1B10 is still scarce, and the researchers try to use AR inhibitors to inhibit the activity of AKR1B10. Fidarestat (1) and Zopolrestat (2) are AR inhibitors21,22 (Fig. 1), which are used to treat diabetic neuropathy clinically. However, the inhibitory activities of these two compounds on AKR1B10 and AR have no obvious difference. MK184 (3) and (4) are two only compounds with high selectivity to AKR1B10 reported to date.23,24 The crystal structures of Zopolrestat binding with AKR1B10 and AR, Fidarestat combined with AR and MK184 binding with AKR1B10 have been determined by X-ray crystallography. Although this structural data is necessary to clarify the inhibition mechanism, the data obtained from the crystal structure is limited, because the crystal structure can only provide a single instantaneous conformation of the complex. Therefore, it is necessary to further clarify the interaction in the kinetic complex of protein or protein–inhibitor complex. Molecular dynamics (MD) simulations, which can be used to observe the dynamic behavior of biomolecules, studies not only the stable snapshot interaction, but also includes the dynamic interaction between the residues and inhibitors and to clarify the mechanism of inhibitor selectivity.
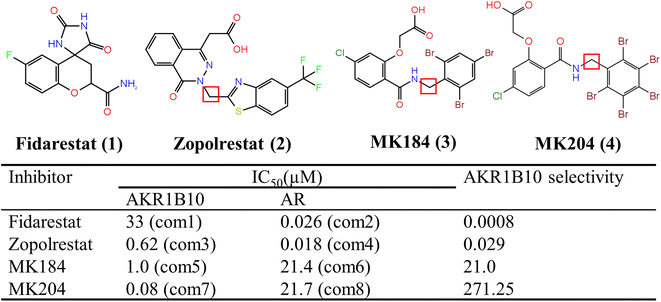 | ||
| Fig. 1 Chemical structures and biological activity to AKR1B10 and AR of inhibitors studied in this work. | ||
Therefore, in this work, we have carried out MD simulations to study the binding of four compounds (Fidarestat, Zopolrestat, MK184 and MK204) to AKR1B10 and AR, and calculated the binding free energy of the equilibrated parts of MD trajectories to clarify the key binding characteristics of compounds with high selectivity to AKR1B10. We got the stable conformation of MK204 binding to AKR1B10 and AR from MD simulations, and strengthened the difference of binding modes between them. We identified the key residues of AKR1B10 and AR contributed to inhibitors binding and estimated the difference of their impact to the binding free energy. Finally, we summarized the binding characteristics of AKR1B10 inhibitors with high selectivity. There is only a few activity test data of AKR1B10 and AR at present, and we believe that our work will provide an important data for researchers to develop highly selective inhibitors of AKR1B10.
2. Materials and methods
2.1 Molecular docking
The crystal structures of Fidarestat/AR, MK184/AR and MK204/AR complexes were not found in PDB database, so we tried to get the initial poses for the four complexes by molecular docking. The molecular docking was performed with Glide in SchrÖdinger 2015 (SchrÖdinger, LLC, New York, NY, USA). The crystal structure of Zopolrestat/AR complex (PDB ID: 4JII25) was used to define the docking grid box for AR protein, while the MK184/AKR1B10 was used to define the docking grid box for AKR1B10, and the ligands were docked into the defined docking pocket using Glide with standard precision (SP) and extra precision (XP). The docking pose with the highest score was selected as their initial binding pose for further evaluation.Induced Fit Docking (IFD)26,27 was performed in SchrÖdinger 2015 to get more accurate initial pose. The protein molecule was minimized with an RMSD cutoff of 0.2 Å, and then was generated the centroid of the residues automatically. The initial docking for each ligand was carried out with Glide. The residues within 5.0 Å of the ligand position are restricted to optimize the side chain. The ligand is strictly docked into the protein structure suitable binding pocket, and as a result, the IFD score of each output posture is generated.
2.2 Molecular dynamics (MD) simulations
The partial charges of the four ligands were computed at the HF/6-31G(d) level of theory and fixed using the RESP methodology.30–32 Each receptor–ligand construct was finally parameterized using the AMBER14SB33 and GAFF force fields. Then, the complexes were solvated with TIP3P water models34 in a 10 Å cubic box using Leap, and Na+ ions were added to neutralize the net charge of the complex.
2.3 MM/PBSA binding free energy calculations and residue decomposition
The Molecular Mechanics with Poisson–Boltzmann/Surface Area (MM/PBSA) method,37,38 widely used in estimating receptor and ligand interaction binding, was employed to estimate the binding free energies for the receptor and ligand interaction.39–46 In MM/PBSA method, the binding free energy can be decomposed into several terms, including the bond, angle, torsion, van der Waals, and electrostatic terms. In MM/PBSA calculations, 2000 snapshots were extracted from the last 200 ns MD trajectory (take one at every 10 snapshots) for the free energy calculations. The binding free energy can be calculated as follows:| 〈ΔGbind〉〈ΔEbond〉 + 〈ΔEangle〉 + 〈ΔEtors〉 + 〈ΔEvdw〉 + 〈ΔEele〉 + 〈ΔGPB〉 + 〈ΔGSA〉 − T〈ΔSMM〉 | (1) |
3. Results and discussion
3.1 Summary the structural characteristics of AKR1B10 and AR
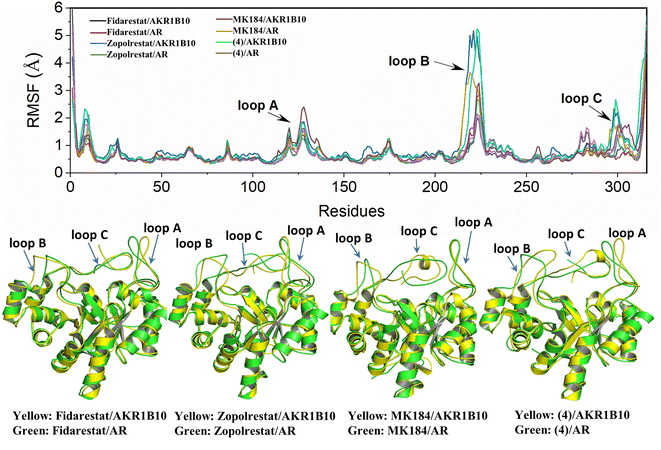
As is shown in Fig. 2, AKR1B10 and AR share an (α/β)8-barrel core motif, which are conserved in metabolic enzymes. Residues Y49, K77, H111 and W112 define a geometrically rigid “anion binding pocket (ABP)” with the nicotinamide moiety of NADP+, which is the conventional binding site of AKR1 inhibitors. Sequence alignment of AKR1B10 and AR shows 71% amino acid identity, and superposition of the 3D structures of AKR1B10 and AR shows that the differences mainly come from the three-segment loop regions, including loop A (residues 110–138), loop B (residues 210–232) and loop C (residues 292–316). The three external and highly variable loops contribute to protein plasticity, substrate specificity and inhibitor selectivity. Meanwhile, there is another specificity pocket (SP) near ABP, which is composed of residues W112, T114 and F123 from loop A and C299, A300, L301, L302, S303 and Y310 from loop C. W112 occupies the hinge area with privileged position between the anion binding pocket and allosteric binding pocket.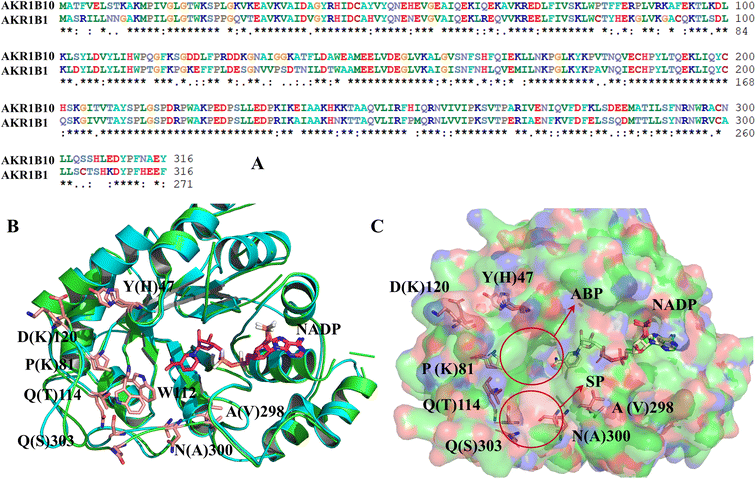 | ||
| Fig. 2 Comparison of the amino acid sequence (A) and the protein structure between AKR1B10 and AR (B) and (C). ABP: anion binding pocket; SP: specificity pocket. | ||
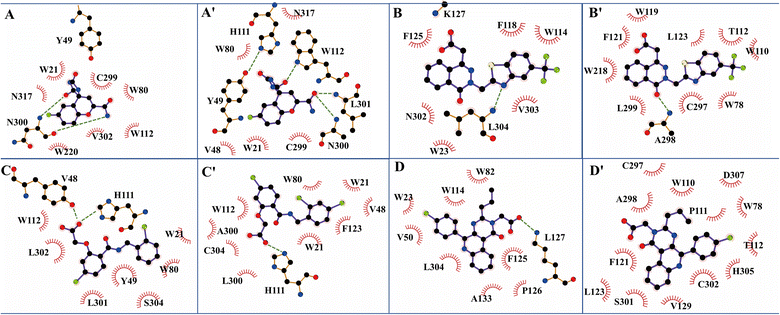
The structure characterization (from empirical data and molecular docking of AKR1B10 and AR in combination with specific inhibitors) has allowed to identify two key differences between AR and AKR1B10. The first one corresponds to a different conformation of the residue W112, and W112 adopts natural conformation through a hydrogen bond network, which includes residues Q114 and S304 located in loop C in AR, but this network cannot be established in AKR1B10 (Fig. 3A and C). The reason why the conformation of W112 in Fig. 3B and C as the same is that the structure is that these conformations are obtained by the IFD method. Another difference is that the residues located in loop C, such as Q(S)303 and S(C)304. The residue W112 also forms π–π stacking interaction in AKR1B10 and AR binding the inhibitors Zopolrestat, MK184 and MK204, but cannot be established in Fidarestat binding AKR1B10 and AR. It is worth mentioning that we can't get the complex structure of MK204 binding AR by Glide docking, but by IFD. The reason may be that the volume of MK204 is too large to accommodate the binding sites of AR, so we tried to obtain the stable conformation of MK204 binding to AR by using long distance MD.
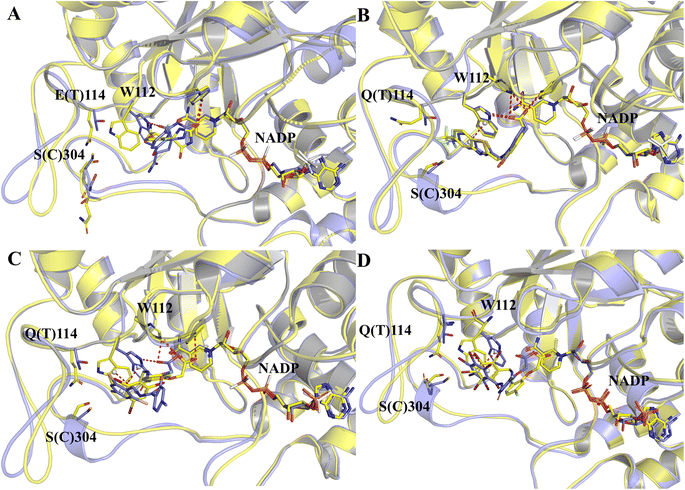 | ||
| Fig. 3 The docking poses of four ligands Fidarestat (A), Zopolrestat (B), MK184 (C) and MK204 (D) with AKR1B10 and AR. | ||
3.2 Evaluation of inhibitors binding to AKR1B10 and AR from MD simulations
| Contribution | Fidarestat/AKR1B10 | Fidarestat/AR | Zopolrestat/AKR1B10 | Zopolrestat/AR | MK184/AKR1B10 | MK184/AR | MK204/AKR1B10 | MK204/AR |
|---|---|---|---|---|---|---|---|---|
| a ΔGnonpolar = ΔEvdw + ΔGSA.b ΔGpolar = ΔEele + ΔGGB. | ||||||||
| ΔEele | −23.25 ± 0.17 | −22.58 ± 0.15 | −8.38 ± 0.24 | −18.61 ± 0.23 | −16.24 ± 0.17 | −9.92 ± 0.11 | −50.63 ± 0.18 | −5.59 ± 0.15 |
| ΔEvdw | −28.80 ± 0.09 | −27.57 ± 0.10 | −44.65 ± 0.14 | −47.05 ± 0.13 | −48.35 ± 0.15 | −46.62 ± 0.14 | −76.95 ± 0.11 | −50.39 ± 0.12 |
| ΔGSA | −3.97 ± 0.01 | −3.58 ± 0.01 | −5.19 ± 0.02 | −5.08 ± 0.01 | −5.50 ± 0.01 | −4.71 ± 0.01 | −5.31 ± 0.01 | −4.67 ± 0.01 |
| ΔGGB | 33.92 ± 0.12 | 31.28 ± 0.09 | 24.08 ± 0.22 | 30.01 ± 0.22 | 29.51 ± 0.14 | 22.8 ± 0.16 | 87.40 ± 0.16 | 17.75 ± 0.25 |
| ΔGnonpolara | −32.77 ± 0.09 | −31.15 ± 0.14 | −49.84 ± 0.14 | −52.13 ± 0.13 | −53.85 ± 0.15 | −51.33 ± 0.14 | −82.86 ± 0.11 | −55.06 ± 0.12 |
| ΔGpolarb | 10.67 ± 0.21 | 8.70 ± 0.17 | 15.70 ± 0.37 | 11.40 ± 0.31 | 13.27 ± 0.22 | 12.88 ± 0.19 | 36.77 ± 0.24 | 12.16 ± 0.29 |
| ΔGTotal | −22.10 ± 0.11 | −22.45 ± 0.11 | −34.14 ± 0.15 | −40.73 ± 0.11 | −40.58 ± 0.14 | −38.45 ± 0.12 | −45.49 ± 0.11 | −42.90 ± 0.14 |
| −TΔS | 17.73 ± 3.65 | 17.79 ± 4.67 | 24.14 ± 4.71 | 24.97 ± 2.55 | 20.14 ± 3.93 | 21.30 ± 6.46 | 19.23 ± 4.39 | 23.23 ± 6.18 |
| ΔGBind | −4.37 ± 3.66 | −4.66 ± 4.68 | −9.90 ± 4.72 | −15.76 ± 2.56 | −20.44 ± 3.94 | −17.15 ± 6.47 | −26.26 ± 4.40 | −19.67 ± 5.72 |
As compounds with apparent selective inhibitory effect on AKR1B10, MK184 and MK204 have apparent difference in binding AKR1B10 and AR. This difference is mainly reflected in the electrostatic component, and van der Waals' contribution to the binding free energy also accounts for the main part, while the entropy contribution has little change. The binding free energy (ΔGbind) of MK184/AKR1B10 (−20.44 kcal mol−1) is lower than that of MK184/AR (−17.15 kcal mol−1), which also is agreement with the experiment data. MK204 is found to have the highest selectivity to AKR1B10 in experiment, and our calculated ΔGbind of MK204/AKR1B10 and MK204/AR is −26.26 kcal mol−1 and −19.67 kcal mol−1, respectively. Electrostatic component (ΔEele) and van der Waals' contribution (ΔEvdw) drive this difference (−127.58 for MK204/AKR1B10 and −55.98 kcal mol−1 for MK204/AKR1B10), and later we will analyze the reasons for the differences from energy decomposition and binding mode of all inhibitors with AKR1B10 and AR.
| Acceptor | DonorH | Donor | Fraca (%) | AvgDistb (Å) | AvgAngb |
|---|---|---|---|---|---|
a The frequency of the hydrogen bond in 20![[thin space (1/6-em)]](https://www.rsc.org/images/entities/char_2009.gif) 000 conformations is counted.b Distance and angle of hydrogen bond. 000 conformations is counted.b Distance and angle of hydrogen bond. |
|||||
| Fidarestat/AKR1B10 | |||||
| N300(O) | Ligand(H10) | Ligand(N3) | 0.23 | 2.89 | 155.47 |
| Ligand(O2) | Y49(HH) | Y49(OH) | 0.70 | 2.76 | 163.68 |
| Ligand(O3) | Asn300(H) | N300(N) | 0.28 | 2.91 | 164.13 |
![[thin space (1/6-em)]](https://www.rsc.org/images/entities/char_2009.gif) |
|||||
| Fidarestat/AR | |||||
| Ligand(O4) | Y49(HH) | W49(OH) | 0.73 | 2.76 | 163.62 |
| Ligand(O3) | W112(HE1) | W112(NE1) | 0.64 | 2.85 | 157.02 |
| Ligand(O2) | L301(H) | L301(N) | 0.37 | 2.88 | 149.89 |
| Ligand(O4) | H111(HE2) | H111(NE2) | 0.28 | 2.88 | 146.62 |
![[thin space (1/6-em)]](https://www.rsc.org/images/entities/char_2009.gif) |
|||||
| Zopolrestat/AR | |||||
| Ligand(O1) | A300(H) | A300(N) | 0.71 | 2.85 | 163.72 |
![[thin space (1/6-em)]](https://www.rsc.org/images/entities/char_2009.gif) |
|||||
| MK184/AKR1B10 | |||||
| Ligand(O2) | Y49(HH) | Y49(OH) | 0.83 | 2.71 | 164.29 |
| Ligand(O4) | H111(HE2) | H111(NE2) | 0.44 | 2.85 | 150.19 |
![[thin space (1/6-em)]](https://www.rsc.org/images/entities/char_2009.gif) |
|||||
| MK184/AR | |||||
| Ligand(O4) | H111(HE2) | H111(NE2) | 0.20 | 2.86 | 159.36 |
![[thin space (1/6-em)]](https://www.rsc.org/images/entities/char_2009.gif) |
|||||
| MK204/AKR1B10 | |||||
| Ligand(O3) | Y49(H) | Y49(OH) | 0.82 | 2.65 | 168.56 |
| Ligand(O4) | Y49(HH) | Y49(OH) | 0.17 | 2.64 | 168.26 |
| Ligand(O4) | H111(HE2) | H111(NE2) | 0.66 | 2.80 | 152.90 |
| Ligand(O3) | H111(HE2) | H111(NE2) | 0.20 | 2.82 | 153.18 |
In Fidarestat/AKR1B10 and Fidarestat/AR complexes, several hydrogen bonds with low occupancy rate were also detected. For example, in Fidarestat/AKR1B10, residue N300 acted as hydrogen bond acceptor and donor, forming hydrogen bond with Fidarestat with ∼24% and ∼28% occupancy, respectively. Fidarestat forms hydrogen bond with residues W112, L301 and H111 with ∼64%, ∼37% and ∼28% occupancy respectively in Fidarestat/AR. Only ∼80% of the hydrogen bond between Zopolrestat with AR were detected, while ∼44% of the hydrogen bond of H111 were detected in MK184/AKR1B10 besides the hydrogen bond between Y49 and MK184. On the contrary, only ∼20% of hydrogen bond between MK184 and H111 were found, which supported the numerical difference of predicted binding free energy between Zopolrestat and MK184 with AKR1B10(AR). No hydrogen bond formation with high occupancy was observed in Zopolrestat/AKR1B10, MK184/AR and MK204/AR (Fig. 5).
3.3 Identification of interactions crucial for binding and inhibitory activities of AKR1B10 inhibitory
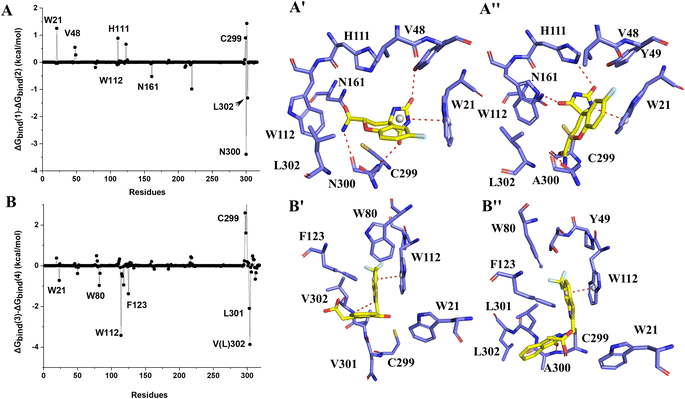
The binding free energies of Zopolrestat/AR estimated by MM/PBSA are relatively lower than that of Zopolrestat/AKR1B10, which is closely consistent with the experimental data. The Fig. 6 shows that almost all the residues W21, W80, W112, F123, V301 and V302 have stronger interactions with Zopolrestat than that with AR, are these residues are hydrophobic interaction. Unlike the binding mode of Fidarestat with AKR1B10(AR), Zopolrestat is far from residue W21, and forms π–π stacking interaction with W112 in both AKR1B10 and AR. The side chain conformation of W112 has always remained the same as the initial structure, while Zopolrestat's carboxylic acid group deviated from ABP, which made it form π–π stacking interaction with W218 and remained stable.
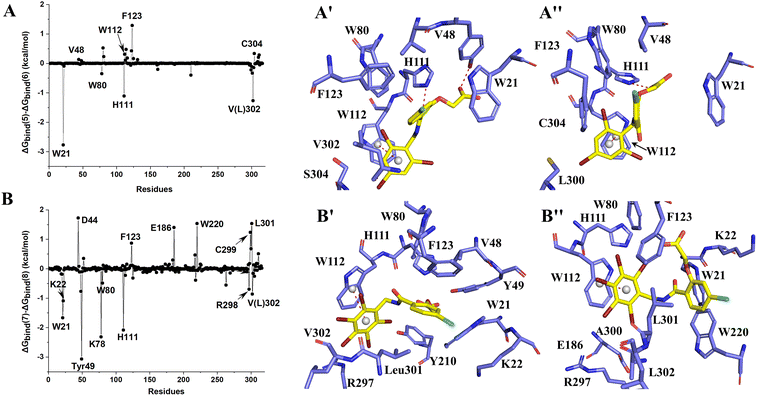
MK204 showed similar behavior to MK184 in binding with AKR1B10 and AR. The benzene ring of MK204 accumulated to the bottom of loop A in the process of binding with AR, and the carboxyl group was far away from the original ABP due to the conformation inversion of the benzene ring, while it was stable with the residue W220 on loop B in the cavity formed by loop A, B and C through the π–π stacking interaction. The difference of this binding mode can also be observed from the energy decomposition spectrum. Clearly, the residues that are more favorable for the binding of MK204 to AR include F123, W220, C299 and L301, while the residues that are more favorable for the binding of MK204 to AR, such as W21, K22, Y49, K78, W80, H111, R298 and V302. Both MK204 and MK184 deviate from the original binding sites when they bind to AR, which indicates that the existence of hydrophobic benzene ring is beneficial to improve the selectivity to AKR1B10.
4. Conclusions
It is a great challenge to develop highly selective inhibitor of AKR1B10 to treat cancer. Understanding of protein–inhibitor interactions is of importance for designing targeted selective inhibitors. In this work, the binding of inhibitors with AKR1B10 and AR were investigated by molecular docking, MD simulations and binding free energy calculations. The slight change of protein conformation may contribute to the selectivity of inhibitors to AKR1B10 and AR. By analyzing the binding mode and calculating the binding free energy of representative inhibitors to AKR1B10 and AR, we concluded that highly selective inhibitors of AKR1B10 should have the following features:(1) The binding at the anion binding pocket (ABP) is important to the inhibitory activity: the hydrogen bonding between Y49 and the inhibitor and the π–π stacking between W112 and the inhibitor play a key role in the stability of the inhibitor and AKR1B10(AR), which contributes to the high inhibitory activity of AKR inhibitors. For example, when MK184 and MK204 binding to AR, their carboxyl groups deviated from ABP, resulting in a significant decrease in their inhibitory activity against AR.
(2) The hydrophobic effect of bulky phenyl enhancing the selectivity to AKR1B10: Zopolrestat, MK184 and MK204 deviate from ABP when they are combined with AR, but remain stable in AKR1B10, which indicates that benzene ring can enhance the selectivity to AKR1B10.
(3) Maintaining the native conformation of W112: the side chain conformation of W112 is different in the crystal structure of the studied inhibitors–AKR1B10(AR), and W112 keeps stable through π–π stacking interaction with the ligand in the whole MD simulations. However, the carboxylic acid group of the ligand deviates from ABP seriously in the inhibitor–AR complex, indicating that although the inhibitor keeps the conformation of W112 stable during the interaction with AR, this conformation is not suitable for stabilizing the inhibitor AKR1B10 complex.
Conflicts of interest
The authors declare that there is no conflict of interest in this work.Acknowledgements
This work was supported by the Natural Foundation of Shandong Province (Grant No. ZR2022MB134).References
- S. Endo, T. Matsunaga and T. Nishinaka, Metabolites, 2021, 11, 332 CrossRef CAS PubMed.
- L. Qiu and C. Guo, Curr. Drug Targets, 2020, 21, 599–609 CrossRef CAS PubMed.
- M. Hojnik, S. Frković Grazio, I. Verdenik and T. L. Rižner, Cancers, 2021, 13, 3398 CrossRef CAS PubMed.
- M. M. Bacha, H. Nadeem, S. Zaib, S. Sarwar, A. Imran, S. U. Rahman, H. S. Ali, M. Arif and J. Iqbal, BMC Chem., 2021, 15, 28 CrossRef CAS PubMed.
- S. Jannapureddy, M. Sharma, G. Yepuri, A. M. Schmidt and R. Ramasamy, Front. Endocrinol., 2021, 12, 636267 CrossRef PubMed.
- A. Kousaxidis, A. Petrou, V. Lavrentaki, M. Fesatidou, I. Nicolaou and A. Geronikaki, Eur. J. Med. Chem., 2020, 207, 112742 CrossRef CAS PubMed.
- L. Quattrini and C. La Motta, Expert Opin. Ther. Pat., 2019, 29, 199–213 CrossRef CAS PubMed.
- J. M. Seliger, S. S. Cicek, L. T. Witt, H. J. Martin, E. Maser and J. Hintzpeter, Molecules, 2018, 23, 3041 CrossRef PubMed.
- W. Xu, Y. Gao, J. Zhang, R. Zhang and Q. Chen, Oncol. Lett., 2021, 22, 683 CrossRef CAS PubMed.
- Y. T. Chung, K. A. Matkowskyj, H. Li, H. Bai, W. Zhang, M. S. Tsao, J. Liao and G. Y. Yang, Mod. Pathol., 2012, 25, 758–766 CrossRef CAS PubMed.
- J. Breton, M. C. Gage, A. W. Hay, J. N. Keen, C. P. Wild, C. Donnellan, J. B. Findlay and L. J. Hardie, J. Proteome Res., 2008, 7, 1953–1962 CrossRef CAS PubMed.
- C. P. Li, A. Goto, A. Watanabe, K. Murata, S. Ota, T. Niki, H. Aburatani and M. Fukayama, Pathol., Res. Pract., 2008, 204, 295–304 CrossRef PubMed.
- Y. Shen, J. Ma, R. Yan, H. Ling, X. Li, W. Yang, J. Gao, C. Huang, Y. Bu, Y. Cao, Y. He, L. Wan, X. Zu, J. Liu, M. C. Huang, W. F. Stenson, D. F. Liao and D. Cao, Clin. Cancer Res., 2015, 21, 1466–1476 CrossRef CAS PubMed.
- D. X. Luo, M. C. Huang, J. Ma, Z. Gao, D. F. Liao and D. Cao, Biochem. J., 2011, 438, 71–80 CrossRef CAS PubMed.
- O. L. Zinovieva, E. N. Grineva, G. S. Krasnov, D. S. Karpov, A. O. Zheltukhin, A. V. Snezhkina, A. V. Kudryavtseva, T. D. Mashkova and N. A. Lisitsyn, J. Cancer, 2019, 10, 4256–4263 CrossRef CAS PubMed.
- L. Huang, R. He, W. Luo, Y. S. Zhu, J. Li, T. Tan, X. Zhang, Z. Hu and D. Luo, Recent Pat. Anti-Cancer Drug Discovery, 2016, 11, 184–196 CrossRef CAS PubMed.
- J. Liu, G. Wen and D. Cao, Recent Pat. Anti-Cancer Drug Discovery, 2009, 4, 246–253 CrossRef CAS PubMed.
- T. M. Penning, Chem.-Biol. Interact., 2015, 234, 236–246 CrossRef CAS PubMed.
- I. R. Edwards and J. K. Aronson, Lancet, 2000, 356, 1255–1259 CrossRef CAS PubMed.
- B. Chen, H. Choi, L. J. Hirsch, A. Katz, A. Legge, R. Buchsbaum and K. Detyniecki, Epilepsy Behav., 2017, 76, 24–31 CrossRef PubMed.
- A. Saxena, R. Tammali, K. V. Ramana and S. K. Srivastava, Curr. Cancer Drug Targets, 2018, 18, 905–911 CrossRef CAS PubMed.
- D. Badawy, H. M. El-Bassossy, A. Fahmy and A. Azhar, Can. J. Physiol. Pharmacol., 2013, 91, 101–107 CrossRef CAS PubMed.
- A. Cousido-Siah, F. X. Ruiz, J. Fanfrlík, J. Giménez-Dejoz, A. Mitschler, M. Kamlar, J. Veselý, H. Ajani, X. Parés, J. Farrés, P. Hobza and A. D. Podjarny, ACS Chem. Biol., 2016, 11, 2693–2705 CrossRef CAS PubMed.
- I. Crespo, J. Giménez-Dejoz, S. Porté, A. Cousido-Siah, A. Mitschler, A. Podjarny, H. Pratsinis, D. Kletsas, X. Parés, F. X. Ruiz, K. Metwally and J. Farrés, Eur. J. Med. Chem., 2018, 152, 160–174 CrossRef CAS PubMed.
- L. Zhang, H. Zhang, Y. Zhao, Z. Li, S. Chen, J. Zhai, Y. Chen, W. Xie, Z. Wang, Q. Li, X. Zheng and X. Hu, FEBS Lett., 2013, 587, 3681–3686 CrossRef CAS PubMed.
- E. B. Miller, R. B. Murphy, D. Sindhikara, K. W. Borrelli, M. J. Grisewood, F. Ranalli, S. L. Dixon, S. Jerome, N. A. Boyles, T. Day, P. Ghanakota, S. Mondal, S. B. Rafi, D. M. Troast, R. Abel and R. A. Friesner, J. Chem. Theory Comput., 2021, 17, 2630–2639 CrossRef CAS PubMed.
- C. A. Sotriffer, Curr. Top. Med. Chem., 2011, 11, 179–191 CrossRef CAS PubMed.
- H. Steuber, M. Zentgraf, C. Gerlach, C. A. Sotriffer, A. Heine and G. Klebe, J. Mol. Biol., 2006, 363, 174–187 CrossRef CAS PubMed.
- O. El-Kabbani, C. Darmanin, T. R. Schneider, I. Hazemann, F. Ruiz, M. Oka, A. Joachimiak, C. Schulze-Briese, T. Tomizaki, A. Mitschler and A. Podjarny, Proteins, 2004, 55, 805–813 CrossRef CAS PubMed.
- P. Cieplak, W. D. Cornell, C. Bayly and P. A. Kollman, J. Comput. Chem., 1995, 16, 1357–1377 CrossRef CAS.
- C. I. Bayly, P. Cieplak, W. Cornell and P. A. Kollman, J. Phys. Chem., 1993, 97, 10269–10280 CrossRef CAS.
- T. Fox and P. A. Kollman, J. Phys. Chem., 1998, 102, 8070–8079 CrossRef CAS.
- C. Tian, K. Kasavajhala, K. A. A. Belfon, L. Raguette, H. Huang, A. N. Migues, J. Bickel, Y. Wang, J. Pincay, Q. Wu and C. Simmerling, J. Chem. Theory Comput., 2020, 16, 528–552 CrossRef PubMed.
- W. L. Jorgensen, J. Chandrasekhar, J. D. Madura, R. W. Impey and M. L. Klein, J. Chem. Phys., 1983, 79, 926–935 CrossRef CAS.
- A. C. Simmonett and B. R. Brooks, J. Chem. Phys., 2021, 154, 054112 CrossRef CAS PubMed.
- J.-P. Ryckaert, G. Ciccotti and H. J. C. Berendsen, J. Comput. Phys., 1977, 23, 327–341 CrossRef CAS.
- P. A. Kollman, I. Massova, C. Reyes, B. Kuhn, S. H. Huo, L. Chong, M. Lee, T. Lee, Y. Duan, W. Wang, O. Donini, P. Cieplak, J. Srinivasan, D. A. Case and T. E. Cheatham, Acc. Chem. Res., 2000, 33, 889–897 CrossRef CAS PubMed.
- P. D. Lyne, M. L. Lamb and J. C. Saeh, J. Med. Chem., 2006, 49, 4805–4808 CrossRef CAS PubMed.
- W. Xue, T. Fu, S. Deng, F. Yang, J. Yang and F. Zhu, ACS Chem. Neurosci., 2022, 13, 340–351 CrossRef CAS PubMed.
- J. Yang, X. Lin, N. Xing, Z. Zhang, H. Zhang, H. Wu and W. Xue, J. Chem. Inf. Model., 2021, 61, 3917–3926 CrossRef CAS PubMed.
- W. Xue, P. Wang, B. Li, Y. Li, X. Xu, F. Yang, X. Yao, Y. Z. Chen, F. Xu and F. Zhu, Phys. Chem. Chem. Phys., 2016, 18, 3260–3271 RSC.
- T. V. Lee, R. D. Johnson, V. L. Arcus and J. S. Lott, Proteins: Struct., Funct., Bioinf., 2015, 83, 2052–2066 CrossRef CAS PubMed.
- N. Li, R. I. Ainsworth, B. Ding, T. Hou and W. Wang, J. Chem. Inf. Model., 2015, 55, 1400–1412 CrossRef CAS PubMed.
- S. Genheden and U. Ryde, Expert Opin. Drug Discovery, 2015, 10, 449–461 CrossRef CAS PubMed.
- D. Pan, W. Xue, W. Zhang, H. Liu and X. Yao, Biochim. Biophys. Acta, Gen. Subj., 2012, 1820, 1526–1534 CrossRef CAS PubMed.
- D. Pan, Y. Niu, W. Xue, Q. Bai, H. Liu and X. Yao, Chemom. Intell. Lab. Syst., 2016, 154, 185–193 CrossRef CAS.
- A. Onufriev, D. Bashford and D. A. Case, Proteins: Struct., Funct., Bioinf., 2004, 55, 383–394 CrossRef CAS PubMed.
- M. Levitt, C. Sander and P. S. Stern, J. Mol. Biol., 1985, 181, 423–447 CrossRef CAS PubMed.
Footnote |
| † Electronic supplementary information (ESI) available. See DOI: https://doi.org/10.1039/d3ra02215c |
| This journal is © The Royal Society of Chemistry 2023 |

