DOI:
10.1039/D3RA02337K
(Paper)
RSC Adv., 2023,
13, 17874-17882
Synthesis, characterization and crystallization kinetics of a bio-based, heat-resistance nylon 5T/10T
Received
9th April 2023
, Accepted 6th June 2023
First published on 13th June 2023
Abstract
The rapid consumption of fossil resources and its adverse impact on the environment require the use of bio-based materials to replace petrochemical products. In this study, we present a bio-based, heat-resistant engineering plastic, poly(pentamethylene terephthalamide) (nylon 5T). To address the issues of the narrow processing window and difficulty in melting processing of nylon 5T, we introduced more flexible decamethylene terephthalamide (10T) units to create a copolymer, nylon 5T/10T. The chemical structure was confirmed by Fourier transform infrared spectroscopy (FTIR) and nuclear magnetic resonance (13C-NMR). We investigated the influence of 10T units on the thermal performance, crystallization kinetics, crystallization activation energy, and crystal structures of the copolymers. Our results demonstrate that the crystal growth mode of nylon 5T is a two-dimensional discoid growth pattern, while nylon 5T/10T exhibits a two-dimensional discoid or three-dimensional spherical growth pattern. The melting temperature, crystallization temperature, and crystallization rate first decrease and then increase, and crystal activation energy first increases and then decreases as a function of 10T units. These effects are attributed to the combined impact of molecular chain structure and polymer crystalline region. Bio-based nylon 5T/10T shows excellent heat resistance (melting temperature > 280 °C) and a wider processing window than nylon 5T and 10T, which is a promising heat-resistant engineering plastic.
1. Introduction
Polyamide, commonly known as nylon, has excellent physical and mechanical strength, which is due to the outstanding molecular chain regularity and strong intermolecular hydrogen bonding.1 Aliphatic polycaprolactam (nylon 6) and polyhexamethylene adipamide (nylon 66) have been widely used in textile and electronic fields.2–4 However, with the development of surface-mount technology (SMT) (≥270 °C), and the high requirements of automobile parts on the heat resistance of materials, its performance has been difficult to meet the market demand.2,5 Wholly aromatic nylons have better heat resistance, but its melting temperature is far higher than its initial thermal decomposition temperature, which cannot be processed by melting and injection molding.6 Semi-aromatic nylon is formed by condensation reaction of aliphatic diamine and aromatic diacid or aromatic diacid and aliphatic diamine. Compared with aliphatic or wholly aromatic nylons, it has excellent heat resistance and could be processed by melting, which attracts researchers' attention.7–9
Poly(hexamethylene terephthalamide) (nylon 6T) is the most widely used semi-aromatic heat-resistant nylon. But its main raw material, hexamethylene diamine, is a petroleum-based product. At present, the adverse impact of rapid consumption of fossil resources on the environment requires bio-based materials to replace petrochemical products.10–13 1,5-Diaminopentane is similar to hexamethylene diamine in structure, which could be enzymatically synthesized from lysine through cell biotransformation or directly prepared by biological fermentation.14,15 At the same time, lysine overcapacity is serious. Development of a new bio-based heat-resistant nylon 5T with 1,5-diaminopentane as raw material has significant social and economic benefits for reducing carbon emissions, digesting excess lysine production capacity and extending the value of the industrial chain.16
However, the DSC and TGA results show that the melting temperature of nylon 5T is close to its initial decomposition temperature, indicating that nylon 5T has an extraordinary narrow processing window (the temperature gap between the melting point and the starting point of degradation)17 (see Fig. 4c), so it will decompose during melt processing, which has a negative impact on product performance.
Generally, copolymerization modification can improve polymer performance through molecular design.18 Therefore, we first prepared nylon 5T from 1,5-diaminopentane and terephthalic acid (PTA) by salt forming + solid state polycondensation. On this basis, more flexible 10T units based on castor oil-based decylenediamine were introduced into the nylon 5T molecular chain to obtain nylon 5T/10T copolymer, which possesses a wider processing window. The structures of heat-resistant nylon 5T, nylon 5T/10T and nylon 10T were confirmed by FTIR and 13C-NMR. Their thermal properties were tested by differential scanning calorimetry (DSC) and thermogravimetric analysis (TGA).
In addition, crystallization kinetics is the critical control factor during the polymer crystallization process. The study of crystallization kinetics is helpful for us to better master the regularity of crystal structure parameters changing with time, so as to guide the polymer processing and molding to obtain high-performance products.19 Nevertheless, the actual polymer processing and production, such as extrusion, molding and film production, are usually carried out under dynamic non-isothermal conditions, which is particularly necessary to analyse and study the non-isothermal crystallization kinetics of polymers.20–22
The non-isothermal crystallization kinetics parameters and crystal growth mechanism of nylon 5T, nylon 5T/10T and nylon 10T were obtained by Jeziorny and Mo methods, and the activation energy was calculated by Kissinger and Takhor methods. The crystal structures were also characterized by wide-angle X-ray diffraction (WAXD).
2. Experimental
2.1 Materials
1,5-Diaminopentane was bought from Cathay Biotech Inc. (Shanghai, China). 1,10-Diaminodecane (DA10) was purchased from Wuxi Yinda Nylons Co. Ltd (Wuxi, China). The PTA was supplied by Shanghai Aladdin Bio-Chem Technology Co. Ltd. (Shanghai, China). Deionized water was self-made.
2.2 Preparation of nylon 5T, 5T/10T and 10T salts
1,5-Diaminopentane, DA10, PTA and deionized water were added to three-port flask according to Table 1, respectively. Then start the mechanical stirring and gradually raise the temperature of the reactant to 60 °C under the protection of nitrogen atmosphere. After continuous reaction for 2 hours, the samples were dried in a vacuum oven for 24 h to obtain nylon 5T, 5T/10T and 10T salts, which are white solids.
Table 1 Composition of nylon 5T, nylon 5T/10T and nylon 10T
| Samples (nylon) |
1,5-Diaminopentane/mol |
DA10/mol |
PTA/mol |
H2O/wt% |
| 5T |
1.00 |
— |
1.00 |
30 |
| 5T/10T-0.1 |
0.90 |
0.10 |
1.00 |
30 |
| 5T/10T-0.2 |
0.80 |
0.20 |
1.00 |
30 |
| 5T/10T-0.3 |
0.70 |
0.30 |
1.00 |
30 |
| 5T/10T-0.4 |
0.60 |
0.40 |
1.00 |
30 |
| 5T/10T-0.5 |
0.50 |
0.50 |
1.00 |
30 |
| 5T/10T-0.6 |
0.40 |
0.60 |
1.00 |
30 |
| 5T/10T-0.7 |
0.30 |
0.70 |
1.00 |
30 |
| 5T/10T-0.8 |
0.20 |
0.80 |
1.00 |
30 |
| 5T/10T-0.9 |
0.10 |
0.90 |
1.00 |
30 |
| 10T |
— |
1.00 |
1.00 |
30 |
2.3 Synthesis of nylon 5T, 5T/10T and 10T
Nylon 5T, 5T/10T and 10T were synthesized through solid state polycondensation. First, put nylon 5T, 5T/10T and 10T salts obtained in Chapter 2.2 into a high-pressure polymerization kettle, respectively. Replace the air with nitrogen three times, then charge with 0.4 MPa nitrogen, and start heating. Raise the temperature to 220 °C within two hours, and keep the pressure in the kettle not more than 1.8 MPa during this period. After the pressure is stable, maintain the temperature and pressure for 1 hour. Then, gradually release the pressure to negative pressure while increasing the temperature to 260 °C, and continue reaction for 3 hours to obtain the nylons.
2.4 Characterization of nylon 5T, 5T/10T and 10T
The manufacturer of FTIR instrument is Thermo Nicolet Corporation, model is IS50, and the test range is 4500–600 cm−1.
Dissolve the sample in deuterated trifluoroacetic acid reagent, and then conduct 13C-NMR (Bruker DPX-400 at 400 MHz) test to confirm their structure.
The DSC measurements were performed using a TA Q20, which under a nitrogen atmosphere (50 mL min−1). Raise the temperature of the crucible containing 3–5 mg sample to above the polymer melting temperature at the rate of 40 °C min−1. Continue to hold at this temperature for 5 min to eliminate the heat history. Then, the sample is cooled to 30 °C at the rate of 5, 10, 20, and 40 °C min−1 respectively. Hold at 30 °C for 5 min, then raise the temperature to above the polymer melting temperature at the rate of 20 °C min−1, and record the DSC curves.
The TGA measurements were carried out on a STA449 instrument from 30 °C to 700 °C at the rate of 10 °C min−1 in nitrogen atmosphere. The thermogravimetric curves were recorded.
WAXD diffraction patterns were obtained with a TD3700 instrument. The test scanning range is 3–50° and the speed is 2° min−1.
3. Results and discussion
3.1 FTIR analysis
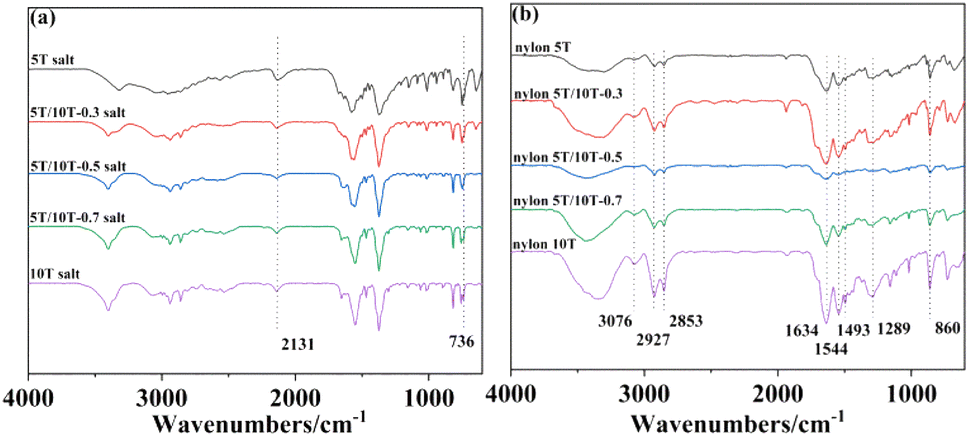
The FTIR spectra of nylon 5T, 5T/10T, 10T salts and nylon 5T, 5T/10T, 10T are shown in Fig. 1a and b, respectively. The peak at 2131 cm−1 is assigned to frequency doubling and combination band of NH3+ and the peak at 736 cm−1 is compounding to the O–H stretching vibration of water molecule (Fig. 1a).23 As depicted in Fig. 1b, all samples have almost identical infrared spectral characteristics. The spectrum was observed at 3076 cm−1 is caused by C–N and N–H stretching vibration. The characteristic peak appeared at 2927 cm−1 is attributed to the stretching vibration of C–H and the in-plane bending vibration of N–H. And the stretching vibration for C–H was also revealed at 2853 cm−1. Moreover, amide absorption band appears in all spectrums. In detail, C![[double bond, length as m-dash]](https://www.rsc.org/images/entities/char_e001.gif) O stretching vibration, the combination of C–N stretching vibration and N–H bending vibration absorption peak, the combination of C–N stretching vibration and C–H bending vibration absorption peak and C–CO stretching vibration were found at 1634, 1544, 1493, 1289 cm−1, corresponding to the amide I, II, III, IV region, respectively. The band at 860 cm−1 is compounding to C–H phenylene vibration.2,17 Interestingly, compared to Fig. 1a, the frequency doubling and combined frequency band peak of NH3+ in Fig. 1b has disappeared, indicating that nylon 5T, 5T/10T, 10T could be synthesized via solid state polymerization.
O stretching vibration, the combination of C–N stretching vibration and N–H bending vibration absorption peak, the combination of C–N stretching vibration and C–H bending vibration absorption peak and C–CO stretching vibration were found at 1634, 1544, 1493, 1289 cm−1, corresponding to the amide I, II, III, IV region, respectively. The band at 860 cm−1 is compounding to C–H phenylene vibration.2,17 Interestingly, compared to Fig. 1a, the frequency doubling and combined frequency band peak of NH3+ in Fig. 1b has disappeared, indicating that nylon 5T, 5T/10T, 10T could be synthesized via solid state polymerization.
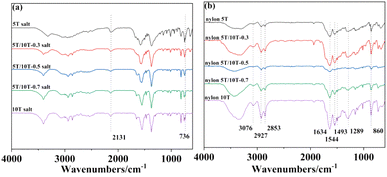 |
| | Fig. 1 Infrared spectra of nylon 5T, 5T/10T, 10T salts (a) and nylon 5T, 5T/10T, 10T (b). | |
3.2 13C-NMR analysis
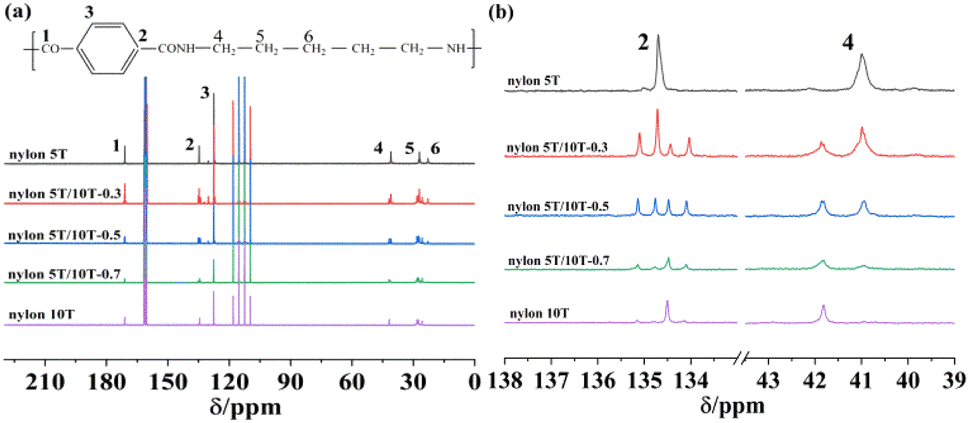
13C-NMR was used to further determine the chemical structure of nylon 5T, 5T/10T and 10T. As depicted in Fig. 2a, the chemical shifts at 170.81–171.18 ppm originate from carbon atom on the carbonyl group (position 1). The peaks at 134.49–134.85 ppm are attributed to carbon atom on benzene ring connected with carbonyl group (position 2). The chemical shifts, in the range of 127.10–127.78 ppm, correspond to carbon atom at position 3 of benzene ring. And the proton signals of carbon atom on methylene linked with N atom of amide group and the remaining methylene of the polymer are in the range of 40.49–41.28 ppm (position 4) and 22.47–27.80 ppm (position 5–6), respectively. It is worth noting that the spectra of nylon 5T/10T and nylon 10T show different shifts at positions 2 and 4, which were expanded in Fig. 2b. Compared with nylon 5T and nylon 10T, nylon 5T/10T has two more peaks at position 2, since the random copolymerization of nylon 5T and 10T, which is consistent with the existing reports.24 In addition, the peak of nylon 10T is slightly offset compared with the peak of nylon 5T (position 4), and the nylon 5T/10T shows two peaks, indicating the ratio of nylon 5T to nylon 10T. The above peaks correspond to the theoretical values of nylon 5T, 5T/10T and 10T, which further confirm their structures.
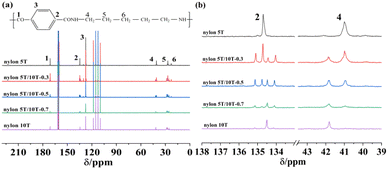 |
| | Fig. 2 13C NMR spectrum of nylon 5T, 5T/10T, 10T (a) and partial enlarged view (b). | |
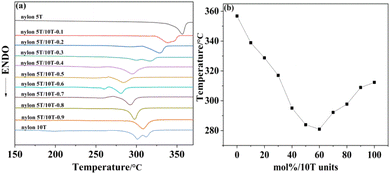
3.3 Melting temperature analysis
The melting temperature results obtained from DSC analysis of nylon 5T, 5T/10T and 10T are summarized in Fig. 3a, and Fig. 3b shows the plot of melting temperature versus 10T molar content. The melting temperature of nylon 5T (356.78 °C) is higher than that of nylon 10T (312.27 °C), which is due to its higher amide density and more rigid molecular chain. As displayed in Fig. 3b, the melting temperature of the copolymer first decreases and then increases with increasing 10T units, and the copolymer with 60% molar content of 10T units has the lowest melting temperature (280.91 °C). These indicate that nylon 5T and nylon 10T may not form co-crystalline.25 Thus, when the content of 10T units is small, they destroy the regularity of nylon 5T and exist as crystalline defect of polymer. At the same time, compared with 5T, 10T is also more flexible. Therefore, the above two factors lead to the decrease of the copolymer's melting temperature, which is consistent with the current research results of many copolymerization modifications.26,27 Intriguingly, once the molar content of 10T units is greater than 60%, the melting temperature of the copolymer starts to rise again, which may be due to the fact that with the further increase of the 10T units content, they exist as the main molecular chain, and the regularity of the copolymer molecular chain is relatively improved. In addition, it can be seen from Fig. 8a that the melting endothermic peak of nylon 5T/10T is wider than that of nylon 5T, which is attribute to the larger crystal size distribution and crystal defects.25
 |
| | Fig. 3 DSC curves (a) and melting temperature versus mol% 10T units of nylon 5T, 5T/10T and 10T (b). | |
3.4 TGA analysis
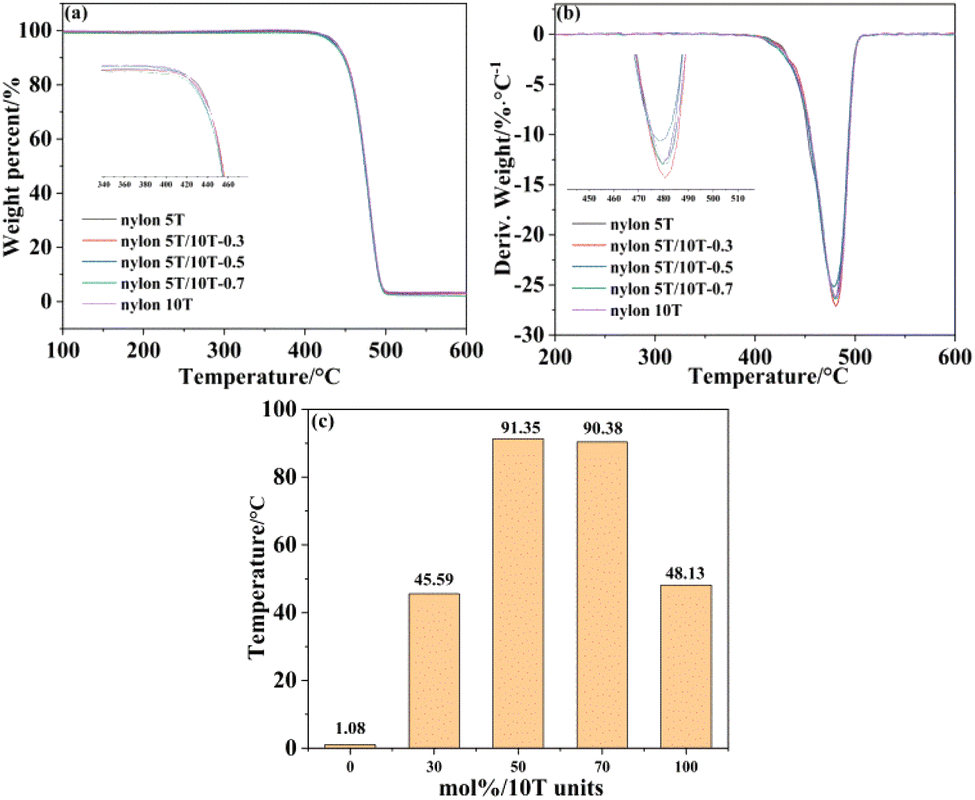
The thermal stability of nylon 5T, 5T/10T and 10T was investigated by TG and DTG, as indicated in Fig. 4a and b, respectively. The TG curves of all samples have only one weight-loss platform and the DTG curves of all samples have only one peak, indicating that the thermal degradation process is one-step degradation, which is in accord with the random chain breaking mechanism of polymers.28 All samples have high thermal decomposition onset temperature and maximum thermal degradation rate temperature, and the addition of 10T units has little impact on the thermal stability of the nylon 5T. Moreover, Fig. 4c shows the dependence of their processing window on the content of 10T units, which were calculated from subtracting the melting temperature from the initial temperature of thermal decomposition. It can be clearly seen that nylon 5T/10T has a wider processing window than nylon 5T and nylon 10T.
 |
| | Fig. 4 TGA (a) and DTG (b) curves, and processing window versus mol% 10T units (c). | |
3.5 Non-isothermal crystallization analysis
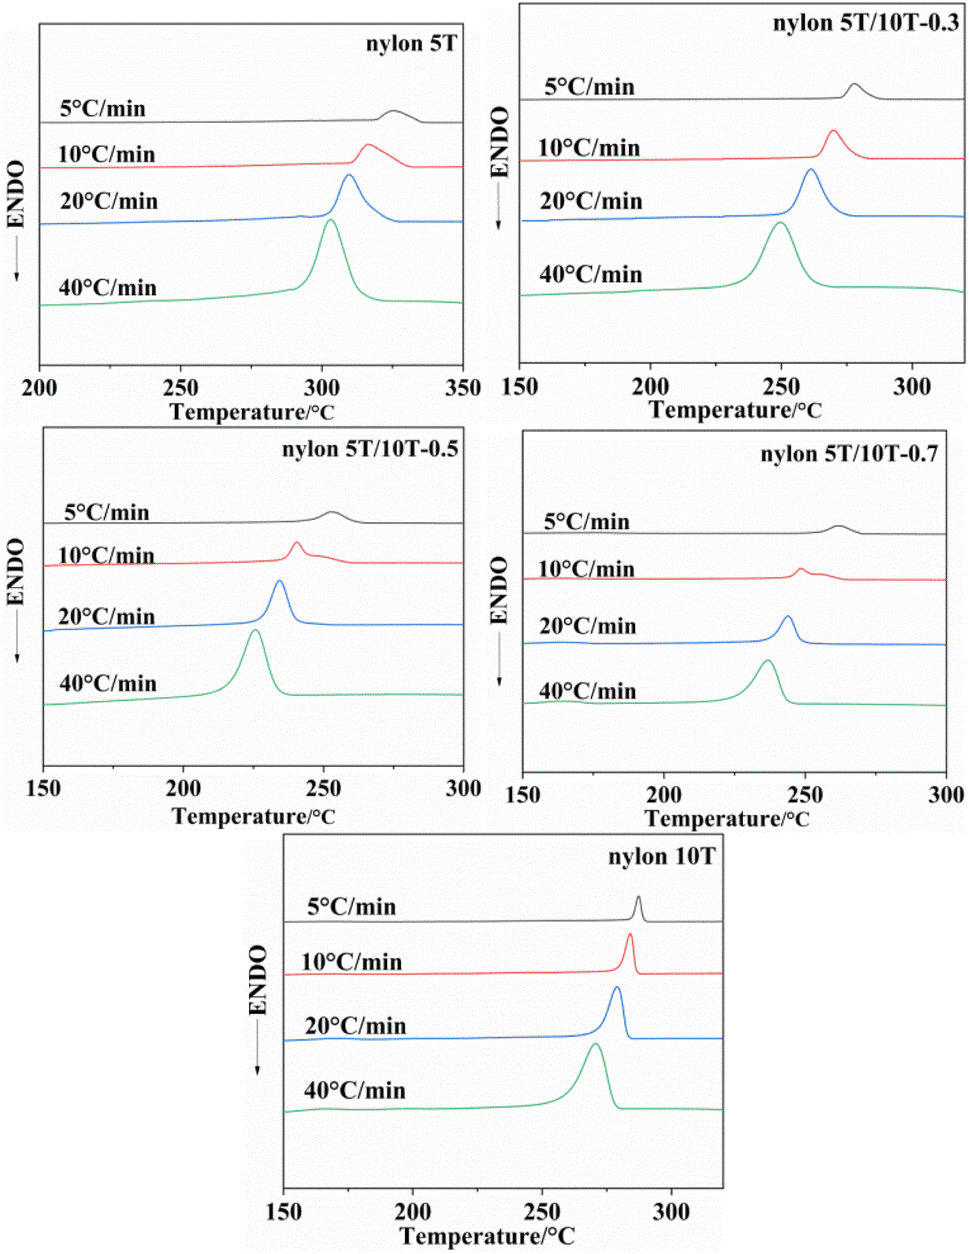
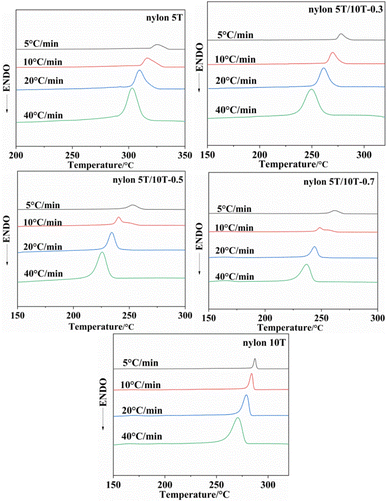
3.5.1 Crystallization behaviors of nylon 5T, 5T/10T and 10T. Fig. 5 shows the non-isothermal crystallization curves of nylon 5T, 5T/10T and 10T, and the crystallization peak temperatures (TP) at different cooling rates are listed in Table 2. As shown in Fig. 5, the crystallization temperature of all samples decreases and crystallization peaks become broader with the increase of cooling rate, which is a common phenomenon of semi-crystalline polymers.22,29 It is because when the cooling rate is high, the molecular chain does not have enough time to overcome the barrier to form perfect crystalline region, so the lower crystallization temperature and wider crystallization peak.30 More excitingly, according to Table 2, at the same cooling rate, the change rule of crystallization temperature is consistent with that of melting temperature, which decreases first and then increases with increasing 10T units. This is also due to the comprehensive effect of the introduction of 10T units on the crystalline region and molecular chain structure of the copolymer.
 |
| | Fig. 5 Non-isothermal crystallization curves of nylon 5T, 5T/10T and 10T. | |
Table 2 Non-isothermal crystallization parameters of nylon 5T, nylon 5T/10T and nylon 10T
| Sample |
Φ/°C min−1 |
Tp/°C |
T1/2/min |
G |
| Nylon 5T |
5 |
325.39 |
1.89 |
0.53 |
| 10 |
316.45 |
1.27 |
0.79 |
| 20 |
309.71 |
0.70 |
1.44 |
| 40 |
303.04 |
0.38 |
2.65 |
| Nylon 5T/10T-0.3 |
5 |
277.61 |
2.06 |
0.49 |
| 10 |
269.83 |
1.30 |
0.77 |
| 20 |
261.32 |
0.77 |
1.30 |
| 40 |
249.60 |
0.40 |
2.48 |
| Nylon 5T/10T-0.5 |
5 |
252.50 |
2.46 |
0.41 |
| 10 |
240.27 |
1.76 |
0.57 |
| 20 |
234.36 |
0.66 |
1.52 |
| 40 |
225.75 |
0.32 |
3.13 |
| Nylon 5T/10T-0.7 |
5 |
262.34 |
1.72 |
0.58 |
| 10 |
249.26 |
1.27 |
0.79 |
| 20 |
244.96 |
0.45 |
2.21 |
| 40 |
238.46 |
0.29 |
3.41 |
| Nylon 10T |
5 |
287.35 |
0.71 |
1.40 |
| 10 |
284.10 |
0.46 |
2.16 |
| 20 |
278.99 |
0.35 |
2.86 |
| 40 |
270.68 |
0.28 |
3.57 |
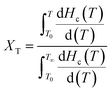
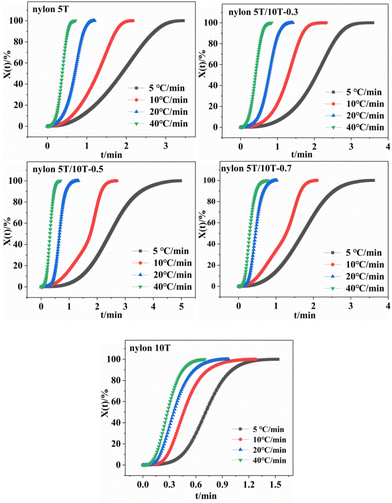
3.5.2 Crystallization kinetics of nylon 5T, 5T/10T and 10T. The relative crystallinity of polymers at a certain temperature can be calculated from the ratio of the area of the crystallization curve formed from the initial crystallization temperature to a certain crystallization temperature to the area of the whole crystallization process.31 The relationship between relative crystallinity XT and crystallization temperature T is shown in eqn (1):| |
 | (1) |
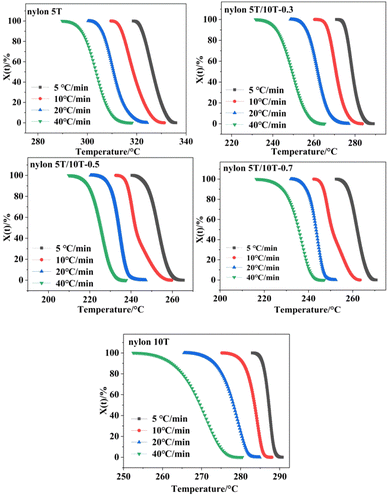
where T0 and T∞ are the initial and final crystallization temperature, respectively. The plots of XT versus T of nylon 5T, 5T/10T and 10T obeyed the eqn (1) are shown in Fig. 6. As described in Fig. 6, the initial crystallization temperature and the temperature corresponding to the same relative crystallinity decrease with the increase of cooling rate, which is caused by the hysteresis effect of crystalline region formation.32
 |
| | Fig. 6 Relative crystallinity versus temperature curves of nylon 5T, 5T/10T and 10T. | |
Under non-isothermal conditions, the crystallization temperature and crystallization time can be converted as follows:33
| |
 | (2) |
where
t and
Φ correspond to the time and the cooling rate, respectively. Combining
eqn (1) and
(2), the relative crystallinity
versus time diagrams of nylon 5T, 5T/10T and 10T can be obtained, as shown in
Fig. 7. The time corresponding to the relative crystallinity of 50% can be obtained (
t1/2) and the crystallization rate constants
G = 1/
t1/2, which are listed in
Table 2. Generally, larger
G value means faster crystallization rate. It could be seen that the
G value of copolymer decreases first and then increases with increasing 10T units, indicating that the crystallization rate becomes slow first and then fast. Indeed, the crystallization rate of nylon 5T is lower than that of nylon 10T, which is because nylon 10T has longer molecular chain, better flexibility and stronger mobility. The crystallization rate of nylon 5T/10T is affected by two factors. On the one hand, due to the fact that the reaction belongs to random copolymerization and nylon 10T is not co-crystalline with nylon 5T, the addition of the 10T units disrupts the regularity of the molecular chain, and the 10T units exist as crystalline region defects. On the other hand, the addition of 10T units also increases the mobility of the molecular chain. When there is a small amount of 10T units in the copolymer, the former is the dominant factor, resulting in a downward trend in the crystallization rate of the copolymer. When the proportion of 10T units in the copolymer is more than 50%, the latter is the dominant factor, the molecular chain movement ability of the copolymer is enhanced, and the crystallization rate becomes faster. It also can be observed that the crystallization rate of nylon 5T/10T-0.5 is lower than that of nylon 5T/10T-0.3 in the presence of the cooling rate is not higher than 10 °C min
−1. However, nylon 5T/10T-0.5 has a faster crystallization rate when the cooling rate reaches 20 °C min
−1. This may be due to that the supercooling is small at low cooling rate, which indicate there is not enough energy to overcome the less regular molecular chains to form crystal nucleus in a short time, so the crystallization rate of nylon 5T/10T-0.5 is lower than that of nylon 5T/10T-0.3. Moreover, the supercooling is large at high cooling rate, which could overcome the crystal barriers and the molecular chain of nylon 5T/10T-0.5 has stronger mobility, thus the faster crystallization rate.
 |
| | Fig. 7 Relative crystallinity versus time curves of nylon 5T, 5T/10T and 10T. | |
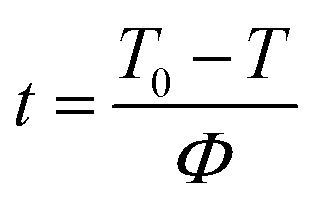
3.5.3 Jeziorny equation. Assuming the crystallization temperature is constant, the primary stage of non-isothermal crystallization can be described by Avrami equation:34| |
lg[−ln(1 − Xt)] = n![[thin space (1/6-em)]](https://www.rsc.org/images/entities/char_2009.gif) lgt + lgZt lgt + lgZt
| (4) |
where n, t and Zt denote Avrami index, the time corresponding to a relative crystallinity and the crystallization rate constant, respectively. Considering the non-isothermal characteristics of the crystallization process, in the Jeziorny method, ZT is modified as follows:19| |
 | (5) |
where Zc corresponds to the corrected crystallization rate constant and Φ is cooling rate.Plotting lg[−ln(1 − Xt)] versus lgt, the values of n and Zt were obtained as the slopes and intercepts of Fig. 8, respectively, and Zc could be calculated by eqn (5). The results of n, Zc, and correlation coefficient R2 were summarized in Table 3. As indicated in Table 3, the n for nylon 5T, 5T/10T and 10T was in the range of 2.38–2.93, 2.65–3.10, 2.35–3.47, 2.18–3.59 and 3.17–3.87, respectively, indicating that the crystal growth mode of nylon 5T is two-dimensional discoid growth pattern, and nylon 5T/10T is two-dimensional discoid or three-dimensional spherical growth pattern and nylon 10T is three-dimensional spherical growth pattern. Interestingly, it can be seen in Table 3 that Zc first decreases and then increases as a function of 10T units, indicating that crystallization rate becomes slow first and then fast with the increase of the 10T units, which is in accordance with the results of G (Chapter 3.5.2).35
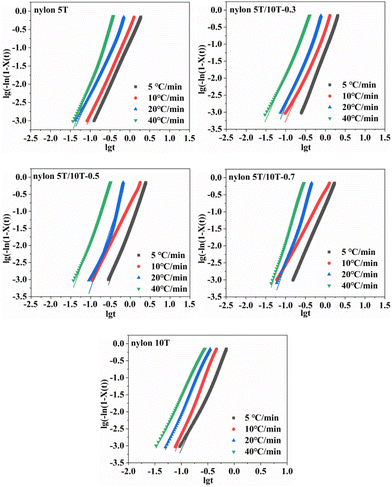 |
| | Fig. 8 Plots of log[−ln(1 − Xt)] versus lgt for nylon 5T, 5T/10T and 10T. | |
Table 3 Crystallization kinetics parameters determined by Jeziorny method
| Sample |
Φ/°C min−1 |
N |
Zc |
R2 |
| Nylon 5T |
5 |
2.41 |
0.68 |
1.00 |
| 10 |
2.45 |
0.90 |
1.00 |
| 20 |
2.38 |
1.01 |
0.99 |
| 40 |
2.93 |
1.06 |
0.99 |
| Nylon 5T/10T-0.3 |
5 |
3.10 |
0.58 |
1.00 |
| 10 |
2.65 |
0.87 |
0.99 |
| 20 |
2.84 |
1.00 |
0.99 |
| 40 |
2.68 |
1.05 |
0.99 |
| Nylon 5T/10T-0.5 |
5 |
3.11 |
0.52 |
1.00 |
| 10 |
2.35 |
0.84 |
1.00 |
| 20 |
3.47 |
1.03 |
0.98 |
| 40 |
3.20 |
1.08 |
1.00 |
| Nylon 5T/10T-0.7 |
5 |
2.69 |
0.69 |
1.00 |
| 10 |
2.18 |
0.92 |
1.00 |
| 20 |
3.36 |
1.10 |
0.99 |
| 40 |
3.59 |
1.10 |
1.00 |
| Nylon 10T |
5 |
3.35 |
1.11 |
0.99 |
| 10 |
3.87 |
1.30 |
1.00 |
| 20 |
3.56 |
1.19 |
1.00 |
| 40 |
3.17 |
1.10 |
1.00 |
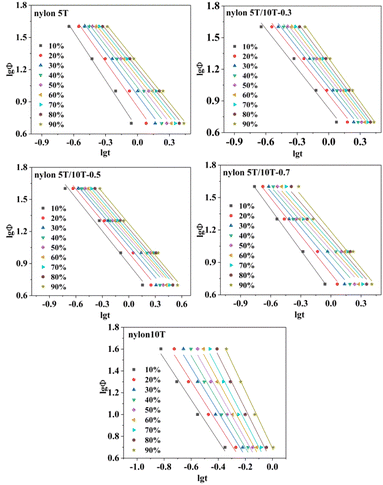
3.5.4 Mo equation. Jeziorny method is only suitable for describing the main crystallization stage in non-isothermal crystallization process.29 Regrettably, the Ozawa method cannot adequately describe the whole non-isothermal crystallization process due to the existence of spherulite collision and secondary collision is ignored.33,36 Mo combines Jeziorny and Ozawa equations to obtain the equation, which could more accurately describe the non-isothermal crystallization process.37| | |
lgZt + nlgt = lgK(T) − mlgΦ
| (6) |
where α = n/m (m is Ozawa index). F(T) represents the cooling rate required to reach a certain relative crystallinity in a certain time that can indirectly reflect the speed of crystallization: the smaller F(T) value means the faster crystallization rate.35,38 The plots of lgΦ versus lgt are displayed in Fig. 9, which shows a good linear relationship (the R2 is not less than 0.96, Table 4), demonstrating that Mo equation is suitable for analysing the non-isothermal crystallization process of nylon 5T, nylon 10T and nylon 5T/10T. In addition, the a and F(T) values could be obtained as the slopes and intercepts of Fig. 9, respectively, and the results were presented in Table 4. As expected, at the same relative crystallinity, the values of F(T) become large firstly, and then small, suggesting crystallization rate first becomes slow and then fast, which is consistent with the results of Jeziorny analyse.
 |
| | Fig. 9 Plots of lgΦ versus lgt for nylon 5T, 5T/10T and 10T. | |
Table 4 Crystallization kinetics parameters determined by Mo method
| Sample |
X(t)/% |
α |
F(t) |
R2 |
| Nylon 5T |
10 |
1.51 |
4.44 |
0.99 |
| 20 |
1.40 |
7.13 |
0.99 |
| 30 |
1.33 |
9.16 |
0.99 |
| 40 |
1.30 |
10.81 |
0.99 |
| 50 |
1.26 |
12.22 |
0.99 |
| 60 |
1.25 |
13.57 |
0.99 |
| 70 |
1.23 |
14.88 |
0.99 |
| 80 |
1.23 |
16.30 |
0.99 |
| 90 |
1.23 |
18.20 |
1.00 |
| Nylon 5T/10T-0.3 |
10 |
1.26 |
6.75 |
0.99 |
| 20 |
1.25 |
9.06 |
0.99 |
| 30 |
1.25 |
10.71 |
0.99 |
| 40 |
1.27 |
12.09 |
0.99 |
| 50 |
1.27 |
13.33 |
0.99 |
| 60 |
1.29 |
14.60 |
1.00 |
| 70 |
1.31 |
15.99 |
1.00 |
| 80 |
1.33 |
17.63 |
1.00 |
| 90 |
1.37 |
20.10 |
1.00 |
| Nylon 5T/10T-0.5 |
10 |
1.03 |
7.84 |
0.99 |
| 20 |
1.00 |
9.97 |
0.99 |
| 30 |
0.97 |
11.55 |
0.98 |
| 40 |
0.95 |
12.81 |
0.97 |
| 50 |
0.95 |
13.82 |
0.97 |
| 60 |
0.95 |
14.75 |
0.97 |
| 70 |
0.96 |
15.73 |
0.98 |
| 80 |
0.97 |
16.92 |
0.98 |
| 90 |
0.98 |
18.75 |
0.99 |
| Nylon 5T/10T-0.7 |
10 |
1.27 |
4.27 |
1.00 |
| 20 |
1.17 |
6.27 |
0.99 |
| 30 |
1.11 |
7.79 |
0.98 |
| 40 |
1.07 |
9.13 |
0.96 |
| 50 |
1.05 |
10.25 |
0.96 |
| 60 |
1.05 |
11.20 |
0.96 |
| 70 |
1.06 |
12.21 |
0.96 |
| 80 |
1.08 |
13.43 |
0.96 |
| 90 |
1.13 |
15.37 |
0.97 |
| Nylon 10T |
10 |
1.91 |
1.01 |
0.99 |
| 20 |
1.98 |
1.36 |
0.98 |
| 30 |
2.07 |
1.62 |
0.98 |
| 40 |
2.15 |
1.88 |
0.97 |
| 50 |
2.25 |
2.15 |
0.98 |
| 60 |
2.35 |
2.47 |
0.98 |
| 70 |
2.45 |
2.91 |
0.98 |
| 80 |
2.60 |
3.59 |
0.99 |
| 90 |
2.91 |
4.91 |
1.00 |
3.6 Crystallization activation energy
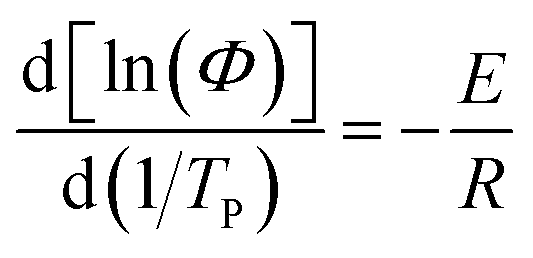
Activation energy is a very important parameter in the process of phase transition, which can reflect the potential barrier of phase transition.39 Generally, the non-isothermal crystallization activation energy of polymers can be obtained using Kissinger equation (eqn (8)).40,41 And Takhor equation (eqn (9)) is also utilized as a method for calculating crystallization activation energy.42| |
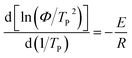 | (8) |
| |
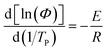 | (9) |
where E is the non-isothermal crystallization activation energy, and R is the ideal gas constant (R = 8.314).
The plots of ln(Φ/TP2) and ln(Φ) against 1/TP are presented in Fig. 10a and b, respectively. The E values calculated from the slope of the fitted straight lines and the correlation coefficient (R2) are listed in Table 5. It can be clearly seen that all samples have excellent correlation coefficients (≥0.96), demonstrating that both Kissinger and Takhor methods are suitable for calculating the crystallization activation energy of nylon 5T, 5T/10T and 10T. As depicted in Table 5, the crystallization activation energy gradually increases when the content of 10T units is not higher than 50%, while decreases when the content is higher than 50%. It suggests that the energy barriers that need to be overcome during polymer crystallization first become large and then small, which further confirms the above results of Jeziorny and Mo methods.
 |
| | Fig. 10 Plots of ln(Φ/TP2) and ln(Φ) against 1/TP. | |
Table 5 Activation energy calculated by Kissinger and Takhor
| Sample (nylon) |
5T |
5T/10T-0.3 |
5T/10T-0.5 |
5T/10T-0.7 |
10T |
| Kissinger (kJ mol−1) |
−277.93 |
−186.01 |
−180.98 |
−202.40 |
−313.99 |
| R2 |
1.00 |
0.99 |
0.99 |
0.96 |
0.96 |
| Takhor (kJ mol−1) |
−268.17 |
−177.10 |
−172.46 |
−193.71 |
−304.82 |
| R2 |
1.00 |
0.99 |
0.98 |
0.96 |
0.96 |
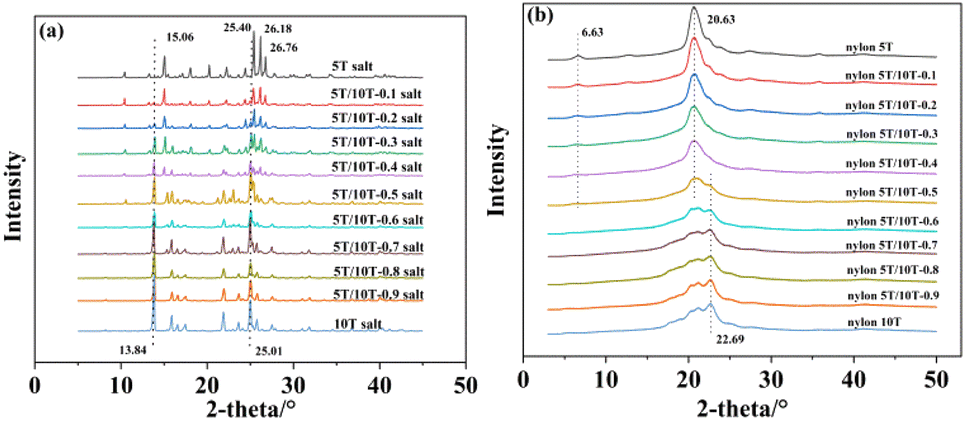
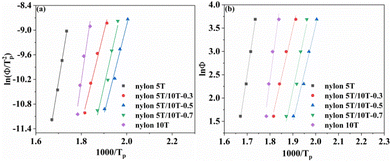
3.7 XRD analysis
The XRD patterns of nylon 5T, 5T/10T, 10T salts and nylon 5T, 5T/10T, 10T are shown in Fig. 11a and b, respectively. Nylon 5T salts showed diffraction peaks at 2θ = 15.06, 25.40, 26.18 and 26.76° (Fig. 11a), which are consistent with the existing report on monohydrate form salts.23 With an increase in 10T units, the diffraction peaks of 10T salt (13.84 and 25.01°) gradually appear, while the diffraction peak of 5T salts at 26.76° gradually disappears, indicating that the crystallization region of 5T salts gradually decreases, while the crystallization region of 10T salts gradually forms. As described in Fig. 11b, diffraction peaks of nylon 5T are located at 2θ of 6.63 and 20.63°. In the case of less 10T units (0–40%), the intensity of the diffraction peak at 6.63° gradually decreases, and the peak located at 20.63° slightly decreases in height and gradually increases in width. Meanwhile, no new peaks appear. The above phenomenon indicates that the addition of 10T units destroys the formation of nylon 5T crystalline region, and as the content of 10T units increases, the crystallinity gradually decreases, and there are no new types of crystals. Nevertheless, when there are more 10T units (50–100%), the peak at 6.63° of nylon 5T disappears, and as the content of 10T units gradually increases, the peaks at 22.69, 21.22, and 20.34° become sharper, demonstrating that nylon 10T crystalline region is gradually being formed.
 |
| | Fig. 11 XRD patterns of nylon 5T, 5T/10T, 10T salts (a) and nylon 5T, 5T/10T, 10T (b). | |
4. Conclusions
In this paper, we have synthesized bio-based nylon 5T, 5T/10T and 10T. Moreover, the effects of 10T units on the thermal properties, crystallization kinetic parameters, crystallization activation energy and crystal structures of polymers were investigated. The results show that nylon 5T/10T has a wider processing window as compared to nylon 5T and nylon 10T. And the crystal growth mode gradually changes from two-dimensional discoid growth pattern to three-dimensional spherical growth pattern with the increase of 10T units. Simultaneously, the melting temperature, crystallization temperature, and crystallization rate show a trend of first decreasing and then increasing, and the crystallization activation energy first increases and then decreases, indicating that the crystallization ability first decreases and then increases. All these results can be attributed to that the comprehensive effect of 10T units on the molecular chain flexibility and crystalline region integrity of polymer. This work provides a novel bio-based heat-resistant engineering plastic, which exhibits promising potential industrial application.
Author contributions
Bingxiao Liu: conceptualization, investigation, validation, formal analysis, writing – original draft, resources, writing – review & editing. Shuo Zhang: validation, editing, characterization, data analysis. Liqun Ma: characterization, data analysis. Yu Wu: characterization, data analysis. Chao Li: characterization, data analysis. Zhuo Wu: characterization, data analysis. Xiangcheng Bian: resources, conceptualization, formal analysis. Wen Yan: characterization.
Conflicts of interest
There are no conflicts to declare.
Acknowledgements
This work is sponsored by Shanxi Provincial University Science and Technology Innovation Project (2021L542), Taiyuan Institute of Technology Talent Introduction Research Funding Project (2022KJ044) and Key R&D Plan Projects in Shanxi Province (202102040201005).
Notes and references
- M. Kamran, M. G. Davidson, S. Vos, V. Tsanaktsis and B. Yeniad, Polym. Chem., 2022, 13, 3433–3443 RSC.
- W. Feng, G. Zou, Y. Ding, T. Ai, P. Wang, Z. Ren and J. Ji, Ind. Eng. Chem. Res., 2019, 58, 7217–7226 CrossRef CAS.
- J. Wang, J. Qiu, S. Xu, J. Li and L. Shen, RSC Adv., 2020, 10, 21481–21486 RSC.
- Z. Liu, Y. Deng, Y. Han, M. Chen, S. Sun, C. Cao, C. Zhou and H. Zhang, Ind. Eng. Chem. Res., 2012, 51, 9235–9240 CrossRef CAS.
- C. Zhang, e-Polymers, 2018, 18, 373–408 CrossRef CAS.
- G. Yan, G. Zhang, H. Ren, Y. Li and J. Yang, RSC Adv., 2016, 6, 76490–76497 RSC.
- T. Ai, W. Feng, G. Zou, Z. Ren, P. Wang, J. Ji and W. Zhang, J. Appl. Polym. Sci., 2021, 138, 50266 CrossRef CAS.
- G. Yan, H. Wang, D. Li, H. Lu, S. Liu, J. Yang and G. Zhang, Polymer, 2021, 216, 123427 CrossRef CAS.
- G. Zhang, G. Yan, T. Yu, J. Lu, X. Huang, X. Wang and J. Yang, Ind. Eng. Chem. Res., 2017, 56, 9275–9284 CrossRef CAS.
- S. Xie, J. Yang, X. Wang and J. Yang, Eur. Polym. J., 2022, 162, 110932 CrossRef CAS.
- T. Shen, B. Zhang, Y. Wang, P. Yang, M. Li, R. Hu, K. Guo, K. Chen, N. Zhu, L. Wang, C. Zhu and H. Ying, Chem. Eng. J., 2022, 437, 135361 CrossRef CAS.
- Z. Wang, T. Wei, X. Xue, M. He, J. Xue, M. Song, S. Wu, H. Kang, L. Zhang and Q. Jia, Polymer, 2014, 55, 4846–4856 CrossRef CAS.
- M. Cao, C. Zhang, B. He, M. Huang and S. Jiang, Macromol. Res., 2017, 25, 722–729 CrossRef CAS.
- R. Kloss, M. H. Limberg, U. Mackfeld, D. Hahn, A. Grunberger, V. D. Jager, U. Krauss, M. Oldiges and M. Pohl, Sci. Rep., 2018, 8, 5856 CrossRef PubMed.
- Y. K. Leong, C. H. Chen, S. F. Huang, H. Y. Lin, S. F. Li, I. S. Ng and J. S. Chang, Biochem. Eng. J., 2020, 157, 107547 CrossRef CAS.
- H. Kim, H. Y. Yoo, N. Park, H. Kim, J. Lee, Y. Baek, T. Lee, J. M. Oh, J. Cho and C. Park, Polymers, 2019, 11, 1372 CrossRef CAS.
- W. Feng, P. Wang, G. Zou, Z. Ren and J. Ji, Des. Monomers Polym., 2018, 21, 33–42 CrossRef CAS PubMed.
- G. Zou, P. Wang, W. Feng, Z. Ren and J. Ji, J. Appl. Polym. Sci., 2018, 135, 46531 CrossRef.
- B. Wang, H. R. Zhang, C. Huang, L. Xiong, J. Luo and X. Chen, RSC Adv., 2017, 7, 42113–42122 RSC.
- D. Chen, L. Lei, M. Zou and X. Li, Polymers, 2021, 13, 1156 CrossRef CAS PubMed.
- F. Yu and L. Xiao, Polym. Test., 2021, 97, 107150 CrossRef CAS.
- Y. Wang, H. L. Kang, R. Wang, R. G. Liu and X. M. Hao, J. Appl. Polym. Sci., 2018, 135, 46409 CrossRef.
- Z. H. Li, P. P. Yang, H. D. Liu, J. Liu, S. Zhu, X. J. Li, W. Zhuang, J. L. Wu and H. J. Ying, Acta Crystallogr., Sect. B: Struct. Sci., Cryst. Eng. Mater., 2020, 76, 524–533 CrossRef CAS PubMed.
- A. M. Aerdts, K. L. L. Eersels and G. Groeninckx, Macromolecules, 1996, 29, 1041–1045 CrossRef CAS.
- T. H. Ai, G. J. Zou, W. T. Feng, Z. L. Ren, F. Li, P. L. Wang, B. Lu and J. H. Ji, New J. Chem., 2021, 45, 14677–14686 RSC.
- J. R. Nykaza, R. Benjamin, K. M. Meek and Y. A. Elabd, Chem. Eng. Sci., 2016, 154, 119–127 CrossRef CAS.
- L. Qu, S. R. Long, M. L. Zhang, G. Zhang, X. J. Wang and J. Yang, J. Macromol. Sci., Part A: Pure Appl.Chem., 2012, 49, 67–72 CrossRef CAS.
- S. H. Yang, P. Fu, M. Y. Liu, Y. D. Wang, Y. C. Zhang and Q. X. Zhao, eXPRESS Polym. Lett., 2010, 4, 442–449 CrossRef CAS.
- Z. Sun, X. Wang, F. Guo, C. Jiang and Q. Pan, Chin. J. Chem. Eng., 2016, 24, 638–645 CrossRef CAS.
- M. Kodal, T. Kutluk, T. Yarici, N. Kapucu and G. Ozkoc, Acta Phys. Pol., A, 2019, 136, 974–982 CrossRef CAS.
- Y. Wang, W. Liu and H. Zhang, Polym. Test., 2009, 28, 402–411 CrossRef CAS.
- B. Liu, G. Hu, J. Zhang and W. Yan, RSC Adv., 2019, 9, 7057–7064 RSC.
- X. Jin, X. Chen, Q. Cheng, N. Zhang, S. Cai and J. Ren, RSC Adv., 2017, 7, 46014–46021 RSC.
- M. D. Green, J. H. Choi, K. I. Winey and T. E. Long, Macromolecules, 2012, 45, 4749–4757 CrossRef CAS.
- X. Tong, Z. Wang, M. L. Zhang, X. J. Wang, G. Zhang, S. R. Long and J. Yang, Polymers, 2020, 13, 72 CrossRef PubMed.
- S. Jain, H. Goossens, M. van Duin and P. Lemstra, Polymer, 2005, 46, 8805–8818 CrossRef CAS.
- C. Y. Hsu, T. C. Yang, T. L. Wu, K. C. Hung and J. H. Wu, Holzforschung, 2018, 72, 329–336 CrossRef CAS.
- C. Gao, X. Ren, J. Zhang, B. Wang, Y. Liu and Y. Wu, Thermochim. Acta, 2018, 663, 9–18 CrossRef CAS.
- K. P. Pramoda, N. T. T. Linh, C. Zhang and T. Liu, J. Appl. Polym. Sci., 2009, 111, 2938–2945 CrossRef CAS.
- J. Huang, J. Lan, S. Lin, G. Li and L. Gu, J. Appl. Polym. Sci., 2019, 136, 47388 Search PubMed.
- H. E. Kissinger, Nature, 1964, 201, 68 CrossRef.
- A. Barman, C. Chattopadhayay, S. Sangal and K. Mondal, Trans. Indian Inst. Met., 2012, 65, 565–570 CrossRef CAS.
|
| This journal is © The Royal Society of Chemistry 2023 |
Click here to see how this site uses Cookies. View our privacy policy here. 
 Open Access Article
 This Open Access Article is licensed under a Creative Commons Attribution-Non Commercial 3.0 Unported Licence
 *a,
Shuo Zhanga,
Liqun Maa,
Yu Wua,
Chao Lia,
Zhuo Wua,
Xiangcheng Biana and
Wen Yanb
*a,
Shuo Zhanga,
Liqun Maa,
Yu Wua,
Chao Lia,
Zhuo Wua,
Xiangcheng Biana and
Wen Yanb