DOI:
10.1039/D3RA02398B
(Paper)
RSC Adv., 2023,
13, 29675-29688
Pressure-dependent physical properties of cesium–niobium oxide: a comprehensive study†
Received
11th April 2023
, Accepted 22nd September 2023
First published on 10th October 2023
Abstract
Perovskites, an important class of materials, are mostly utilized in memory and spintronic devices. The thermoelectric response calculations for some perovskite oxides have been reported, but their attributes under pressure have rarely been explored. In this current study, the effects of high pressure on various properties of CsNbO3 perovskite oxides in the cubic phase were investigated using the pseudopotential approach and Boltzmann transport theory. Specifically, the structural electronic dispersion relations, density of states, phonon properties, elasto-mechanical properties, optical constants, and thermoelectric performance of the material were analyzed. CsNbO3 was reported to be dynamically stable through the optimization of energy against volume under ambient pressure conditions. The phonon dispersion curves of CsNbO3 were computed at pressures ranging from 60 to 100 GPa to demonstrate its stability under these pressures. At ambient pressure, CsNbO3 is a semiconductor with a wide direct band gap of 1.95 eV. With the increase in pressure, the band gap starts decreasing. An analysis of the imaginary part of the dielectric constant suggests that this material may be useful for sensors and optoelectronic devices. Various thermoelectric response parameters were tested for CsNbO3 at temperatures from 50 K to 800 K, with a step size of 50 K, and pressures of 60–100 GPa. Based on the calculated power factor values and optical parameters, CsNbO3 proved to be a potential candidate for energy harvesting applications.
1 Introduction
The energy crisis is worsening with each passing day on the planet and is a major point of concern. Researchers are continuously putting their efforts into counteracting this problem. Two principle sources of renewable energy that can counteract this problem are waste heat converted into electrical energy and solar energy.1 Fossil and fission fuels are used in electric power generation. Their negative impact pushed researchers to find alternative sources with low toxicity that have a facile synthesis, are cost effective, and most importantly have a high Seebeck coefficient.2,3 The wide range of applications and multifunctionality of perovskites,4 double perovskites and defected double perovskites5,6 have attracted researchers. Recently, Selmani and his co-workers have studied Cs-based fluoroperovskites for their optoelectronic and thermoelectric properties.7 Apart from magnetic-device applications, perovskites are equally useful in the fields of thermoelectric devices,8 topological insulators9 and piezoelectric semiconductors.10
The perovskite oxides having the general formula ABO3 can be synthesized easily. The A and B sites can partially be filled by cations. Perovskites are reported to have the best structural, elastic,11–15 dielectric16 and piezoelectric properties.17 Recently, the current progress in the material advances and stability of perovskite solar cells has been discussed comprehensively.18,19 The tuning of ABO3 by atomic concentration change20 is easy and a major reason for the interest of materials scientists.21,22 Solution-processed perovskite materials are regarded as one of the best candidates for atomic microscopy, ultrasound generators, fuel injectors, the piezoelectric17 motor industry and charge-storage applications.23 Perovskites materials have a very rich history of being investigated for thermoelectric applications, and several renowned research groups have recently attempted to study their thermoelectric responses.24–26 Cubic perovskites are of particular interest due to their unique electronic band structure near the Fermi level (EF), which is primarily composed of d orbitals of a transition metal (TM) and the 2p orbitals of oxygen. The combination of octahedral TM-d and O-2p orbitals causes the TM-d orbitals to split into two subsets: the doubly degenerate eg orbitals and the triply degenerate t2g orbitals. The position of EF relative to these orbitals is determined by the TM valence and the TM–O charge-transfer condition, which affect the d-electron population, as noted in previous research.27 The Fermi level resides across the t2g orbital for the best candidates of thermoelectric perovskite oxide materials. The spin degeneracy of La- and Co-based perovskites was found to improve the effective mass of a single charge carrier, leading to high Seebeck values due to an elevated charge carrier entropy.28,29 Similarly, other studies have predicted the potential of lead halide perovskites,30,31 La1−xSrxCoO3,32 dual-doped Ca3Co4O9,33 and hole-doped GeSe materials for thermoelectric energy devices, owing to their high thermoelectric performance. A study on ABO3 (A = Rb, Cs and B = Nb, Ta) compounds examined their optical, electronic, thermoelectric, and thermodynamic properties at different pressures.34 The thermoelectric properties of CsNbO3 (CNO) has been studied at ambient pressure35 but the effect of compressive strain on these properties is missing in the literature. The lack of high-pressure studies on this material motivates us to study CNO for thermoelectric applications by proving it stable.
2 Method and computational approach
The current research was completed in two major steps: the electronic band structures were computed, and then the computed band energies were used to find the solution of the semi-classical Boltzmann transport equations, which give the thermoelectric parameters. Perdew–Burke–Ernzerhof36-type generalized gradient functionals were used as an exchange and correlation functional. A plane-wave basis set and norm-conserving Martins–Troullier pseudopotentials implemented in the Quantum ESPRESSO37 code were used for these calculations. The kinetic cut-off energy for the wave function and charge density were set to 40 Ry and 320 Ry, respectively, for CNO at all pressures. The Monkhorst–Pack38 mesh was used for k-mesh sampling of the irreducible Brillouin zone (IBZ), with a 10 × 10 × 10 k-mesh for self-consistent field (SCF) calculations to get the converged charge density. Once we got the converged charge density, we doubled the k-grid to get the eigenvalues of CNO. To ensure convergence, a higher threshold was set with the first-order Methfessel–Paxton-type smearing parameter σ = 0.05 Ry for the convergence of phonon modes. It is important to clarify that by setting the convergence threshold, we are setting the energy changes to be less than the given value after each cycle of SCF calculations. It is set at 10−12 Ry for this study. Dynamical matrices were calculated on a 3 × 3 × 3 q-grid.
As mentioned above, the band energies are used to find the transport parameters with BoltzTraP39 code. The Power Factor (PF = S2σ/τ), is obtained from the conductivity, σ/τ, and the Seebeck coefficient, S. These two quantities depend on temperature, T, and chemical potential, μ, and are defined as:
| |
 | (1) |
| |
 | (2) |
where
Ω and
fo represent the volume of the cell and the Fermi Dirac distribution, respectively, and
| |
 | (3) |
Here,
e is the electronic charge,
K represents the
k-points, bands are indexed as
i, and
k represents the wave vector. To compute the group velocity,
vα, from the electronic dispersion, we use:
| |
 | (4) |
where ℏ,
τ, and
ε are the reduced Planck constant, relaxation time, and band energy, respectively.
3 Results and discussion
3.1 Structure analysis and phase stability
The crystal structure of a cubic perovskite is described by the Pm![[3 with combining macron]](https://www.rsc.org/images/entities/char_0033_0304.gif) m space group (No. 221).40 It is a simple cubic structure with parallel mirror planes and a three-fold inversion in rotational symmetry. An ideal perovskite unit cell consists of cesium occupying the corner (0, 0, 0), niobium occupying the body center (0.5, 0.5, 0.5), and oxygen sitting at the center of each face, i.e., (0.5, 0.5, 0), as previously reported by Sabir and Berri.34,35 The lattice structure and symmetries are shown in Fig. 1a. The pressure (P) is related to volume (V) and hence to the lattice constant of the CNO system by the Murnaghan equation41,42
m space group (No. 221).40 It is a simple cubic structure with parallel mirror planes and a three-fold inversion in rotational symmetry. An ideal perovskite unit cell consists of cesium occupying the corner (0, 0, 0), niobium occupying the body center (0.5, 0.5, 0.5), and oxygen sitting at the center of each face, i.e., (0.5, 0.5, 0), as previously reported by Sabir and Berri.34,35 The lattice structure and symmetries are shown in Fig. 1a. The pressure (P) is related to volume (V) and hence to the lattice constant of the CNO system by the Murnaghan equation41,42| |
 | (5) |
The bulk modulus, B, and pressure derivative of the bulk modulus,  , are involved in this equation and the lattice constants are changed under isotropic pressure according to eqn (5). The equation of state is obtained by linking the volume and pressure where the bulk modulus is kept constant. The changes that occurred in the lattice constant of CNO with variation of the applied pressure (60–100 GPa) are shown Fig. 1b.
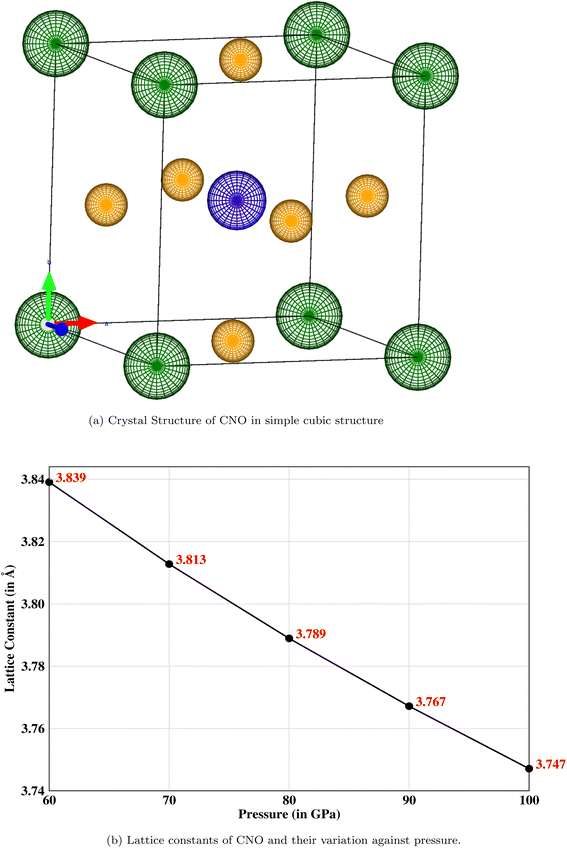 |
| | Fig. 1 (a) The simple cubic structure with parallel mirror planes and a three-fold inversion in rotational symmetry where the corner (green) atoms are cesium, a niobium (blue) atom is occupying the body-centered position, and oxygen (mustard) atoms are sitting at the center of each face. (b) Decreasing lattice constant when the pressure is increased from 60 to 100 GPa. | |
3.1.1 Elastic properties. Three elastic constants C11, C12 and C44 for the cubic system are computed using the Thomas Charpin method.43 The bulk modulus values are also obtained and listed in Table 1 along with their corresponding Born stability criteria, which state that C44 > 0, C12 < C11, and (C11 + 2C12) > 0.44 It is evident from Table 1 and Fig. 2a that CNO is stable at all applied pressures. The mechanical properties as well as the moduli at different pressures are shown in Fig. 2b and c.
Table 1 The computed elastic constants (in GPa), bulk modulus (in GPa), and Born stability conditions for CNO. The stability conditions are validated and CNO is stable against applied pressures
| Pressure |
C11 |
C12 |
C44 |
Bo |
(C11 − C12) > 0 |
(C11 + 2C12) > 0 |
| 60 GPa |
845.887 |
190.296 |
212.513 |
408.826 |
655.590 |
1226.478 |
| 70 GPa |
916.261 |
200.487 |
227.071 |
439.078 |
715.774 |
1317.234 |
| 80 GPa |
981.389 |
211.639 |
242.805 |
468.222 |
769.750 |
1404.666 |
| 90 GPa |
1041.655 |
233.930 |
249.545 |
496.504 |
817.724 |
1489.514 |
| 100 GPa |
1097.864 |
236.813 |
259.700 |
523.830 |
861.051 |
1571.490 |
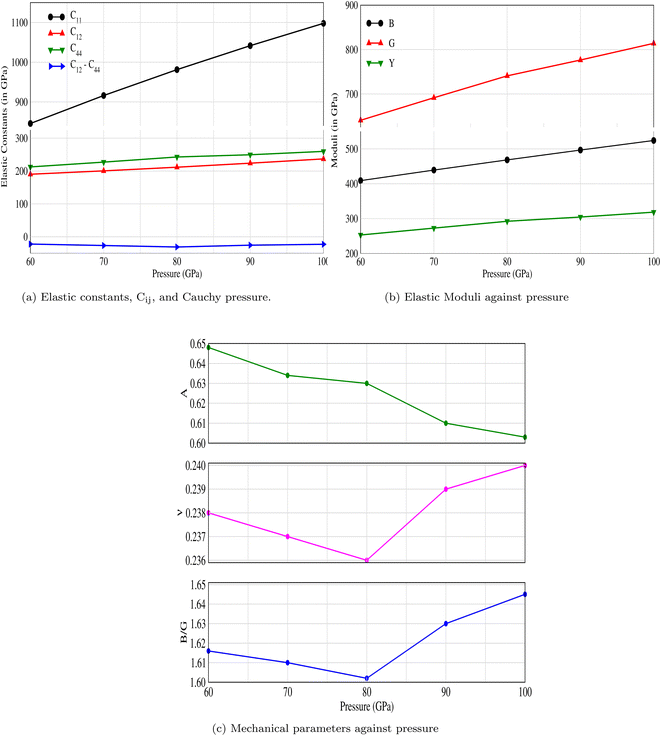 |
| | Fig. 2 The effect of pressure on (a) elastic constants, Cij, (b) bulk, shear and Young's moduli, and (c) mechanical properties: anisotropy factor, Poisson's ratio, and Pugh's ratio of CNO. | |
3.1.2 Phonon properties. The phonon spectra of CNO were calculated using density functional perturbation theory with emphasis on the plane-wave pseudopotential method.45 The optimized parameters were used as an input and the symmetry line was selected from (Γ–Γ). The results are displayed in Fig. 3. The absence of negative phonon modes in these curves indicate the stability of CNO in the pressure range from 60 to 100 GPa. Also, the upward shift of the lowest optical phonon modes with increasing pressure suggests that there is no sign of instability or phase transition, which often leads to softening of the lowest optical phonon.46 It is noteworthy that the dispersion curves exhibit different behaviors along different directions, and some modes degenerate along certain symmetry directions. In particular, the phonon curves show a distinct behavior around the X point at all applied pressures, with a strong dip in the X–R and M–Γ directions that becomes less pronounced with increasing pressure. Notably, the green mode shown in Fig. 3e shifts to higher frequencies at symmetry point M after 70 GPa, contrary to its behavior in Fig. 3a.
 |
| | Fig. 3 Phonon spectra of CNO against applied pressure (in GPa). CNO is dynamically stable as there is no negative phonon frequencies in the full Brillouin zone. The lowest optical phonons shift upwards when the pressure is increased suggesting that there is no sign of instability and phase transition. | |
3.2 Electronic attributes
The electronic band structure of CNO is illustrated in Fig. 4a–e. At ambient pressure, CsNbO3 is a wide band gap semiconductor with a band gap of 1.60 eV calculated with PBE and 1.95 eV using TB-mBJ.35,47 The symmetry line for the studied material is labeled from R–Γ in the first Brillouin Zone (BZ). Interestingly, the valence as well as the conduction states exhibit a slight shift towards lower energy as the pressure is increased (see Fig. 5). The band edges display an enhanced state population for all applied pressures, with a valence band up against the Fermi level at the center of the BZ. The electronic band structures exhibit the same trend, although there are some different gap energies at Γ in the X direction. The gap decreases to 1.248 eV as the applied pressure increases to 100 GPa. The band structures are matching with the non-magnetic semiconductors specifically at the Γ-point.48 The structural, electrical, and magnetic properties can be changed either by doping of magnetic ions, like in a dilute-magnetic semiconductor, or with pressure. CNO behaves similarly to its magnetic counterpart, a magnetic semiconductor in the absence of any external magnetic field. The pressure affects the band gap of CNO and this gap engineering makes it useful for various device applications. Additionally, the effect of the Hubbard parameter and spin–orbit coupling is also investigated for CNO under a pressure range of 60–100 GPa. The value for the Hubbard parameter (U = 0.37 Ry) is used for all pressures. The results from DFT+U calculations were found to be analogous to the results of PBE under the effect of pressure, i.e., the band gap increased but the trend was decreasing against pressure. A similar trend is observed in the case of DFT+SOC with an overall decreased band gap. All the details are presented in Fig. 4f.
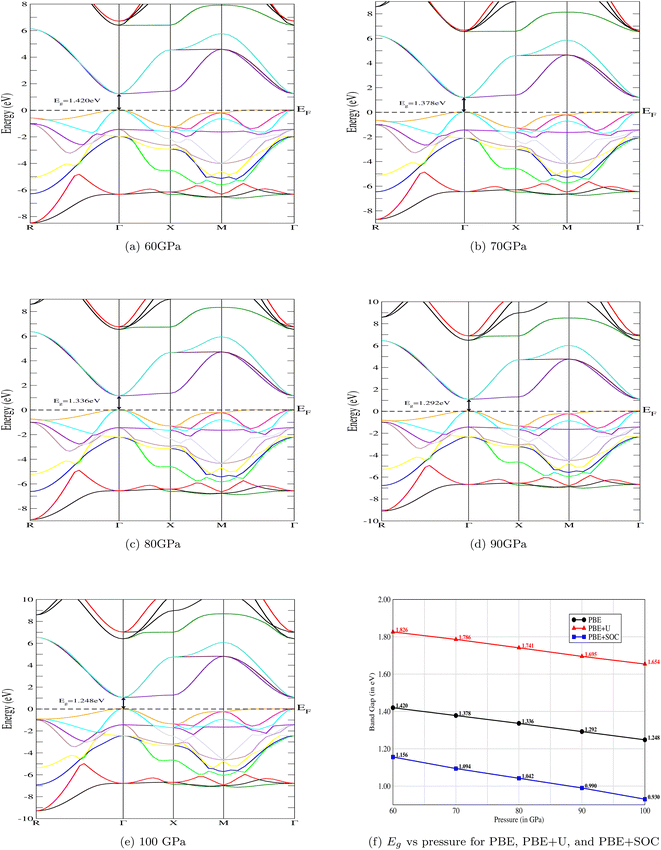 |
| | Fig. 4 The variation of electronic band structures against pressure. The band gap, Eg, of the CNO perovskite decreases with increasing pressure. The same trends of the band structures has been observed with Hubbard, U, and spin–orbit coupling, SOC. The gap values of PBE+U are higher, and lower for PBE+SOC, in comparison to PBE. | |
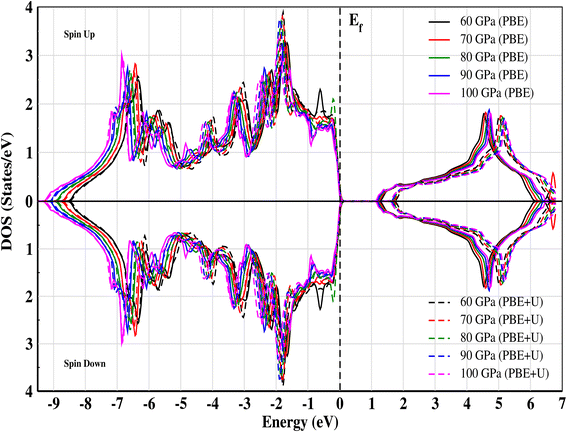 |
| | Fig. 5 Total electronic density of states (TDOS) for CNO against energy at different pressures calculated for both PBE and PBE+U. The effect of the Hubbard parameter shifts the conduction band toward higher energies. | |
3.3 Optical properties
The detailed discussion about the optical response parameters for the materials being studied under an applied field are provided in this section. The first and foremost response parameter is the dielectric function, which is obtained from eqn (6)| | |
ε(ω) = ε1(ω) + iε2(ω).
| (6) |
The complex dielectric constant is a quantity that comprises a real part, denoted as ε1(ω), representing the polarization of light, and an imaginary part, denoted as ε2(ω), which provides information about the absorbed light. Various optical constants like refractive index n(ω), absorption coefficient α(ω), extinction coefficient κ(ω) and optical conductivity σ(ω) are interconnected. The response of these optical parameters against energy is illustrated in Fig. 6a–d and 7a–d.
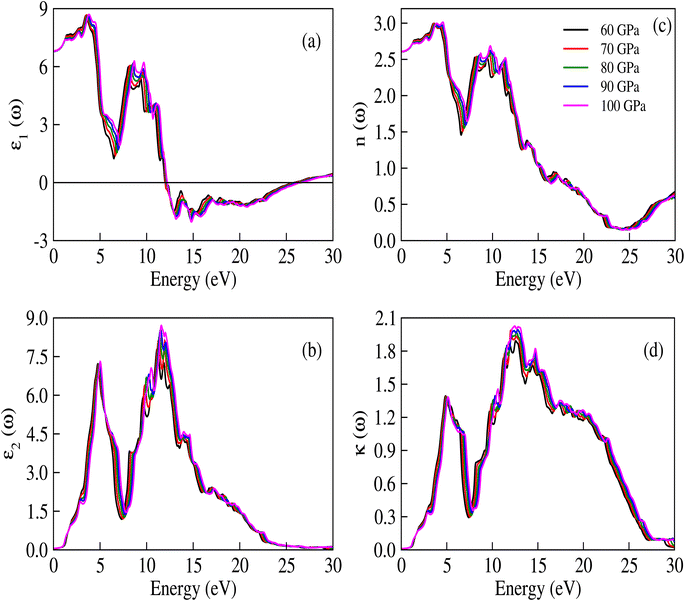 |
| | Fig. 6 (a) Real and (b) imaginary parts of ε(ω), (c) n(ω), and (d) κ(ω) for CNO at different applied pressures. The trends of the real and imaginary parts of the dielectric constant are similar to the refractive index and extinction coefficient, which is in accordance with the equations ε1(ω) = n2 − κ2 and ε2(ω) = 2nκ. | |
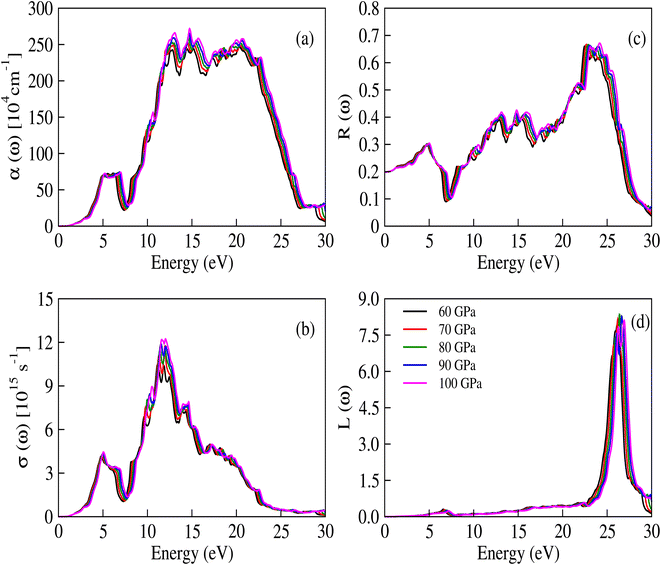 |
| | Fig. 7 (a) The absorption coefficient, (b) optical conductivity, (c) reflectivity and (d) energy loss functions for CNO at applied pressure values. | |
The real part of the dielectric constant, denoted by ε1(ω), shows a slight increase with pressure, taking values of 6.808, 6.808, 6.786, 6.790, and 6.800 for pressures ranging from 60 to 100 GPa (see ESI Fig. 1†) In previous studies,34,35 the static dielectric constant ε1(0) of CNO varied from 3.23 to 6.60, but those studies were conducted under ambient pressure conditions. In our study, we obtained the dielectric constant values for CNO under high pressures ranging from 60 to 100 GPa. The dielectric constant ε1(ω) varies with the energy of the photon, shifting towards higher energies with increasing pressure. The maximum values of ε1(ω) are 8.629, 8.676, 8.623, 8.624, and 8.702 at energies of 3.469 eV, 3.557 eV, 3.638 eV, 3.722 eV, and 3.811 eV, respectively, for pressures ranging from 60 to 100 GPa (see Table 2 & ESI Fig. 2†) As the energy increases, ε1(ω) eventually becomes negative, reaching values of −1.887 at 13.165 eV and −1.734 at 13.484 eV at 100 GPa. The reflection of light from the surface of a material indicates whether the material becomes metallic or not, depending on the value of ε1(ω). However, in the case of CNO, the negative value of ε1(ω) is not large enough. The maximum negative values for pressures ranging from 60 to 100 GPa are 15.226 eV, 15.376 eV, 14.628 eV, 14.733 eV, and 14.813 eV. Once the maximum negative values are reached, ε1(ω) has started to increase with energy at 60 to 100 GPa pressure values, eventually approaching zero at 25.877 eV, 26.073 eV, 26.305 eV, 26.372 eV, and 26.4300 eV. The effect of pressure on the transition rate is evident from the difference of energy values (shown in Fig. 6a). The link between the imaginary and real parts of the dielectric constant is given by the famous Kramers–Kronig relations.49,50
| |
 | (7) |
| |
 | (8) |
Table 2 The real part of dielectric constant, ε1(ω), of CNO at various applied pressures are given. The static dielectric constant, ε1(0), maximum value of dielectric constant, ε1(ω)max, and corresponding energies are reported
| P→ |
60 GPa |
70 GPa |
80 GPa |
90 GPa |
100 GPa |
| ε1(0) |
6.808 |
6.808 |
6.786 |
6.790 |
6.800 |
| ε1(ω)max |
8.629 |
8.676 |
8.623 |
8.624 |
8.702 |
| E (eV) |
3.469 |
3.557 |
3.638 |
3.722 |
3.811 |
| ε1(ω) |
0.000 |
0.000 |
0.000 |
0.000 |
0.000 |
| E (eV) |
25.877 |
26.073 |
26.305 |
26.372 |
26.430 |
The optical parameters of materials can be characterized by their absorption and transparency, which are quantified by κ(ω) and n(ω), respectively. The combination of these parameters gives rise to the complex refractive index term, which is given by eqn (9):
The measured transparency and absorption of light can expressed in terms of the extinction coefficient and refractive index, as shown in Fig. 6c and d. These measurements exhibit similar trends to those observed in Fig. 6a and b. The relationships between the refractive index, extinction coefficient, and the imaginary and real parts of the dielectric constant are given by ε2(ω) = 2nκ and ε1(ω) = n2 − κ2. The refractive index values obtained in this study range from 2.605 to 2.609, which are suitable for use in optoelectronic devices. Additionally, the static [ε1(0)] dielectric constant and static refractive index value n(0) are related through the equation no2 = ε1(0), implying that the extinction coefficient κ behaves similarly to ε2(ω).
The per unit length change in the intensity of light is described by the α(ω) parameter and illustrated in Fig. 7a. Initially, α(ω) is zero, but it begins to increase and reaches a maximum value at 14.448 eV, 14.525 eV, 14.577 eV, 14.677 eV, and 14.740 eV for pressures ranging from 60 to 100 GPa. These peaks are congruous with the behavior of ε2(ω) and κ(ω), while the relationship between the absorption and extinction coefficients can be described by the expression  .51 The adjacent peaks are observed in the energy range of 15.161 eV to 15.733 eV, with higher pressure resulting in peaks of greater intensity. When high-energy photons interact with material, they can cause the bond breakage of the material, and the information about this bond breakage is obtained by the optical conductivity σ(ω), as depicted in Fig. 7b. This process indicates the conversion of light energy into electrical energy and satisfies the well-known Maxwell equations. The energy loss function L(ω) provides details about energy loss through scattering, heating, or dispersion, and is depicted in Fig. 7d. The energy loss function shows a series of kinks in the 6.566 eV to 7.198 eV energy range, but it still has a minimum value that begins to increase after 22.365 eV. The maximum peak of the loss function is around 26.397 eV at 80 GPa pressure. The detailed optical analysis of CNO shows that it exhibits minimum loss but maximum absorption in the visible region, making it a potential candidate for optoelectronic applications.
3.4 Transport properties
The transport properties of CNO were studied using the Quantum ESPRESSO37 interfaced BoltzTrap code.39 Thermoelectric devices are considered a promising source of energy since useful electrical energy can be obtained from waste heat after proper conversion. The transport properties, including the Seebeck coefficient (S), the electronic part of thermal conductivity (κe/τ), the electrical conductivity (σ/τ), and the power factors (PF), were analyzed. A few more thermoelectric parameters, such as Cv, RH, χ, and the carrier charge densities, were also investigated. The density of states at the Fermi surface typically increases with the movement of the Fermi level to the edge of the band. A considerable value of the S just inside or touching the band edges is very important for better thermoelectric efficiency. The variation of S with applied pressure and temperature is shown in Fig. 8a, and the calculated values of Seebeck coefficient (S) at various pressures and temperatures are listed in Table 3. The results show that Seebeck coefficient changes as the pressure increases from 60–100 GPa, and at 60 GPa S ranges from −2.13 × 10⁻³ V K−1 to −6.59 × 10⁻⁴ V K−1 as the temperature changes from 200 K to 800 K. S approaches zero at 200 K as the pressure is increased to 90 GPa, suggesting that below room temperature, S does not significantly depend on applied pressure. The maximum value of S was observed at 800 K and 90–100 GPa pressure Fig. 8a. S is a function of the density of states and derived from the Boltzmann transport equation:39| |
 | (10) |
where ‘X’ is the heat of transport, and often used to evaluate the thermoelectric performance of materials.52–54 For organic and inorganic materials, S depends on the density of states. In our study of CNO, we found that the Seebeck coefficient changes with temperature, pressure, and applied potential. Specifically, as shown in Fig. 8a and Table 3, the Seebeck coefficient of CNO varies from negative to positive as the pressure increases from 60 GPa to 100 GPa, and reaches its maximum value at 800 K and 90–100 GPa pressure. This change in sign is characteristic of a transition from n to p-type semiconductivity.29
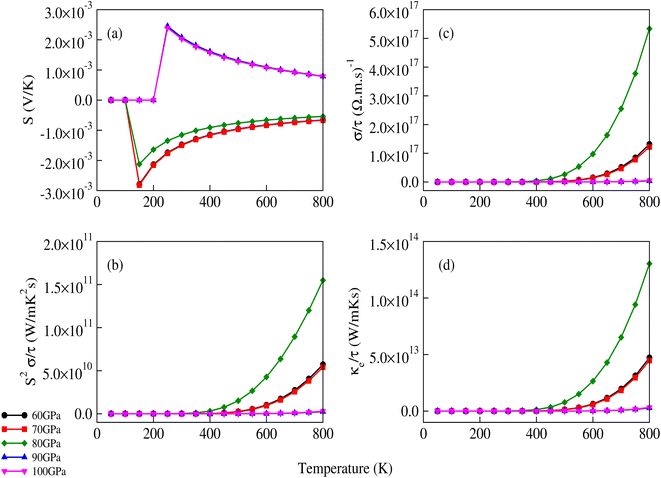 |
| | Fig. 8 Variation of (a) the Seebeck coefficient, (b) power factor, (c) electrical conductivity and (d) electronic part of thermal conductivity of CNO with temperature and applied pressure. The sign of the Seebeck coefficient changes from negative to positive after 80 GPa. | |
Table 3 S (in units of ×10−4 V K−1) for CNO at various temperature and applied pressure values. The Seebeck coefficient changes from negative to positive after 80 GPa
| P↓/T→ |
200 K |
400 K |
600 K |
800 K |
| 60 GPa |
−21.300 |
−11.500 |
−8.240 |
−6.590 |
| 70 GPa |
−21.600 |
−11.600 |
−8.330 |
−6.660 |
| 80 GPa |
−16.400 |
−9.080 |
−6.630 |
−5.390 |
| 90 GPa |
0.000 |
16.100 |
11.000 |
7.910 |
| 100 GPa |
0.000 |
15.700 |
10.800 |
7.860 |
The σ/τ results show only a small variation with all applied pressures up to a temperature of 500 K. Beyond 500 K, there is a slight increase in σ/τ, but changes due to varying pressure are minimal. The maximum change in σ/τ occurs at a pressure of 80 GPa, even at 800 K, with a value of 5.34 × 10¹⁷ (Ω m s)−1 (Fig. 8c). This trend is also observed in the graph of σ/τ versus μ (ESI Fig. 3†), which is qualitatively similar to a report by Berri et al.,34 although there are quantitative differences due to the effect of pressure. The computed values of electrical conductivity are listed in Table 4 (top half). The thermal conductivity of solid materials can be explained in terms of electronic and lattice thermal conductivity. Saini et al.55 have established a relation between thermoelectric parameters and relaxation time. Typically, the semi-classical Boltzmann transport theory within the constant relaxation (τ) time approximation39,56 is used to find the transport properties of a thermoelectric material. The obtained results for the thermal conductivity's electronic part (κe/τ) and electrical conductivity (σ/τ) within this approximation depends linearly on τ, while the temperature dependence of τ is often ignored when calculating the thermoelectric parameters.57–60 Since the temperature dependence of τ cancels out in the ratio of σ/κe, the electronic part of the thermal conductivity can be studied by examining its variation with temperature and potential, as shown in Fig. 8d and ESI Fig. 4.† The results for κe/τ (Table 4, bottom half) show an increasing trend with increasing temperature (200–800 K) and pressure (60 to 100 GPa). Interestingly, the maximum thermal conductivity is achieved at 800 K and 80 GPa pressure. Fig. 8b shows that the PF of CNO increases with increasing temperature and pressure. Notably, the PF shows an abrupt increase after 500 K at 80 GPa, indicating a significant increase in the PF of CNO as a thermoelectric material (Table 5). The thermoelectric parameters, Cv, RH, χ and carrier charge density (n) were analyzed and the results are presented in Fig. 9a–d. Cv of CNO increased linearly up to 600 K and exhibited an abrupt change at 80 GPa (Fig. 9a). The RH values showed a mixed trend with changing temperature and pressure, with a maximum value at room temperature and 90 GPa that decreased up to 100 GPa (Fig. 9c). The susceptibility (χ) was plotted against temperature at different pressure values (Fig. 9b), while the charge carrier concentration (n) for different pressures was shown in Fig. 9d. The thermodynamic and thermoelectric parameters indicated that CNO has a high specific heat capacity at higher temperature and pressure, as well as thermal efficiency, making it a promising candidate for high-pressure and high-temperature applications, including thermoelectric generators. These findings are consistent with previous studies.61–63 Thermoelectric materials generate electricity from temperature gradients. The dimensionless figure of merit64 is calculated from the Seebeck coefficient, electrical conductivity and thermal conductivity as
| |
 | (11) |
Table 4 Electrical conductivity, σ/τ, (top half) [in units of (Ω m s)−1] and the electronic part of the thermal conductivity, κe/τ (bottom half) [in units of W mK−1 s−1] for CNO against varying pressure and temperature values
| P↓/T→ |
200 K |
400 K |
600 K |
800 K |
| 60 GPa |
1.30 × 10⁹ |
2.26 × 10¹⁴ |
1.49 × 10¹⁶ |
1.31 × 10¹⁷ |
| 70 GPa |
9.67 × 10⁸ |
1.94 × 10¹⁴ |
1.35 × 10¹⁶ |
1.22 × 10¹⁷ |
| 80 GPa |
3.74 × 10¹¹ |
3.77 × 10¹⁵ |
9.73 × 10¹⁶ |
5.34 × 10¹⁷ |
| 90 GPa |
−2.60 × 10⁻¹⁶ |
3.89 × 10¹¹ |
1.63 × 10¹⁴ |
3.92 × 10¹⁵ |
| 100 GPa |
−5.59 × 10⁻¹⁶ |
5.62 × 10¹¹ |
2.05 × 10¹⁴ |
4.61 × 10¹⁵ |
| 60 GPa |
1.19 × 10⁶ |
1.21 × 10¹¹ |
6.21 × 10¹² |
4.72 × 10¹³ |
| 70 GPa |
9.03 × 10⁵ |
1.07 × 10¹¹ |
5.74 × 10¹² |
4.47 × 10¹³ |
| 80 GPa |
2.02 × 10⁸ |
1.27 × 10¹² |
2.65 × 10¹³ |
1.30 × 10¹⁴ |
| 90 GPa |
0.00 × 100 |
4.08 × 10⁸ |
1.33 × 10¹¹ |
2.80 × 10¹² |
| 100 GPa |
0.00 × 100 |
5.65 × 10⁸ |
1.61 × 10¹¹ |
3.18 × 10¹² |
Table 5 Power Factor (PF) in units of W mK−2 s−1 for CNO against different temperatures and pressures
| P↓/T→ |
200 K |
400 K |
600 K |
800 K |
| 60 GPa |
5.92 × 10³ |
3.00 × 10⁸ |
1.01 × 10¹⁰ |
5.71 × 10¹⁰ |
| 70 GPa |
4.50 × 10³ |
2.64 × 10⁸ |
9.36 × 10⁹ |
5.41 × 10¹⁰ |
| 80 GPa |
1.01 × 10⁶ |
3.11 × 10⁹ |
4.27 × 10¹⁰ |
1.55 × 10¹¹ |
| 90 GPa |
0.00 × 100 |
1.00 × 10⁶ |
1.95 × 10⁸ |
2.45 × 10⁹ |
| 100 GPa |
0.00 × 100 |
1.39 × 10⁶ |
2.39 × 10⁸ |
2.85 × 10⁹ |
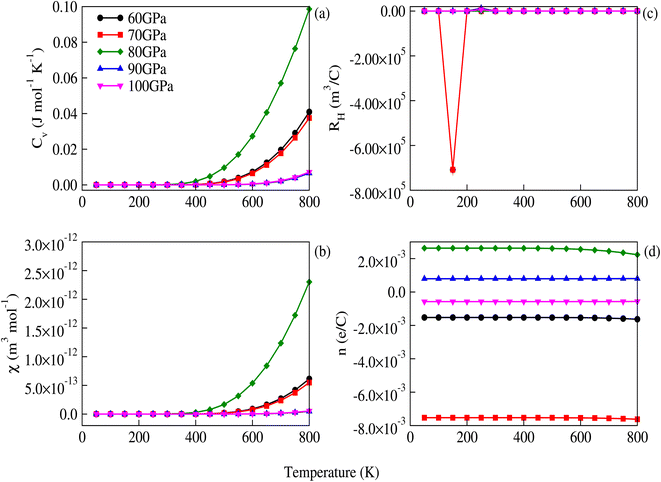 |
| | Fig. 9 Temperature and pressure dependence of (a) specific heat capacity at constant volume, (b) susceptibility, (c) the Hall coefficient, and (d) charge carrier densities in CNO. The abrupt dip in the Hall coefficient at 70 GPa is due to the most negative charge-carrier densities. The effect of the lowest optical phonons might also be the reason for this abrupt behavior as the phonon frequencies shift upward at 70 GPa. | |
The figure of merit, shown in Fig. 10, decreases with increasing pressure and temperature.
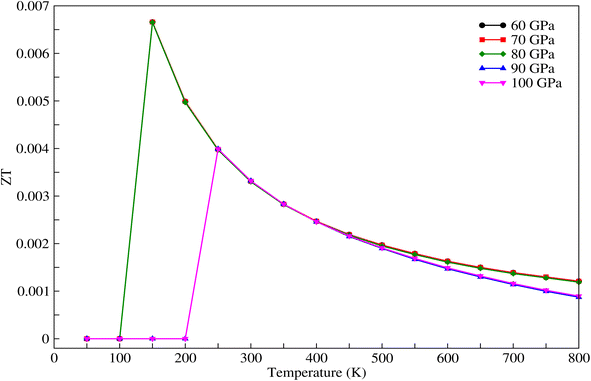 |
| | Fig. 10 Figure of merit for CNO versus temperature for different values of pressure. | |
4 Conclusions
The effect of pressure on the elasto-mechanical properties, phonon properties, electronic band structures, optical constants, and transport parameters of cubic perovskite, CNO, are investigated. The thermoelectric response calculations of perovskites are important, so we conducted this research to explore this topic. To begin, we calculated the elastic constants and checked the Born stability criteria to ensure the stability of CNO under different pressures. The stability was further supported by the absence of negative phonon modes in the phonon spectra in the full zone. We also computed the band structures at different applied pressure values and the Fermi level was found to be at the edge of the valence band for all the pressure values. This makes CNO even more important for thermoelectric calculations. We observed that CNO showed semiconductor behavior but with a decreasing band gap with increasing pressure. We used the Boltzmann transport theory with the pseudopotential technique to study the thermoelectric response. In the temperature and pressure ranges of 50–800 K and 60–100 GPa, the thermoelectric response was evaluated using parameters such as the Seebeck coefficient, electrical conductivity, electronic thermal conductivity, and power factor. Based on the values of the optical constants, power factors, and other thermoelectric properties, our findings suggest that CNO might have applications for thermoelectric generators, optoelectronics, and solar devices, even at high temperatures and pressures.
Conflicts of interest
The authors declare that they have no known competing financial interests or personal relationships that could have appeared to influence the work reported in this paper.
Acknowledgements
The research was supported by the Nazarbayev University, Kazakhstan through the Faculty Development Competitive Research Grant Program (FDCRGP) under Grant 1022021FD2914. The authors would like to thank Prof. Dr Afaq Ahmad, Centre of Excellence in Solid State Physics, University of the Punjab, Lahore, Pakistan for providing computational facilities.
References
- M. Sajjad, Q. Mahmood, N. Singh and J. A. Larsson, Ultralow lattice thermal conductivity in double perovskite Cs2PtI6: a promising thermoelectric material, ACS Appl. Energy Mater., 2020, 3, 11293–11299 CrossRef CAS.
- Y. W. Chai, T. Oniki and Y. Kimura, Microstructure and thermoelectric properties of a ZrNi1.1Sn half-Heusler alloy, Acta Mater., 2015, 85, 290–300 CrossRef CAS.
- S. W. Kim, Y. Kimura and Y. Mishima, High temperature thermoelectric properties of TiNiSn-based half-Heusler compounds, Intermetallics, 2007, 15, 349–356 CrossRef CAS.
- M. Nabi, T. M. Bhat and D. C. Gupta, Magneto-electronic, thermodynamic, and thermoelectric properties of 5f-electron system BaBkO3, J. Supercond. Novel Magn., 2019, 32, 1751–1759 CrossRef CAS.
- S. D. Priyanka, J. B. Sudharsan, M. Srinivasan, P. Ramasamy, M. K. Choudhary and P. Ravindran, First-principles calculations to investigate new ferromagnetic quaternary Heusler alloys FeZrTiZ(Z=Si, Sn, Pb): Compatible for spin polarized device and waste heat recovery applications, Solid State Sci., 2022, 132, 106964 CrossRef.
- G. M. Mustafa, M. Hassan, N. M. Aloufi, S. Saba, S. Al-Qaisi, Q. Mahmood, H. Albalawi, S. Bouzgarrouh, H. H. Somaily and A. Mera, Half metallic ferromagnetism, and transport properties of vacancy ordered double perovskites Rb2(Os/Ir)X6 (X = Cl, Br) for spintronic applications, Ceram. Int., 2022, 48(16), 23460–23467 CrossRef CAS.
- Y. Selmani, H. Labrim, M. Mouatassime and L. Bahmad, Mater. Sci. Semicond. Process., 2022, 152, 107053, DOI:10.1016/j.mssp.2022.107053.
- B. R. K. Nanda and I. Dasgupta, Electronic structure and magnetism in half-Heusler compounds, J. Phys.: Condens. Matter, 2003, 15, 7307–7323 CrossRef CAS.
- A. Roy, J. W. Bennett, K. M. Rabe and D. Vanderbilt, Half-Heusler semiconductors as piezoelectrics, Phys. Rev. Lett., 2012, 109, 037602 CrossRef PubMed.
- J. R. Sootsman, D. Y. Chung and M. G. Kanatzidis, New and old concepts in thermoelectric materials, Angew. Chem., Int. Ed., 2009, 48, 8616–8639 CrossRef CAS PubMed.
- N. Pandech, K. Sarasamak and S. Limpijumnong, Elastic properties of perovskite ATiO3 (A = Be, Mg, Ca, Sr, and Ba) and PbBO3 (B = Ti, Zr, and Hf): First principles calculations, J. Appl. Phys., 2015, 117, 174108, DOI:10.1063/1.4919837.
- D. Behera, A. Dixit, K. Kumari, A. Srivastava, R. Sharma, S. K. Mukherjee, R. Khenata, A. Boumaza and S. Bin-Omran, Structural, elastic, mechanical, and thermodynamic characteristic of NaReO3 and KReO3 perovskite oxides from first principles study, Eur. Phys. J. Plus, 2022, 137, 1345, DOI:10.1140/epjp/s13360-022-03554-1.
- M. Ardit, G. Cruciani, M. Dondi, M. Merlini and P. Bouvier, Elastic properties of perovskite YCrO3 up to 60 gpa, Phys. Rev. B: Condens. Matter Mater. Phys., 2010, 82, 064109, DOI:10.1103/PhysRevB.82.064109.
- W. Schranz, P. Sondergeld, A. V. Kityk and E. K. H. Salje, Elastic properties of SrTiO3 crystals at ultralow frequencies, Phase Transitions, 1999, 69, 61–76, DOI:10.1080/01411599908208008.
- E. Poindexter and A. A. Giardini, Elastic constants of strontium titanate (SrTiO3), Phys. Rev., 1958, 110(5), 1069, DOI:10.1103/PhysRev.110.1069.
- H. Zhang, W. Jo, K. Wang and K. G. Webber, Compositional dependence of dielectric and ferroelectric properties in BiFeO3–BaTiO3 solid solutions, Ceram. Int., 2014, 40(3), 4759–4765, DOI:10.1016/j.ceramint.2013.09.020.
- X. Meng, X. Wen and G. Qin, DFT study on elastic and piezoelectric properties of tetragonal BaTiO3, Comput. Mater. Sci., 2010, 49(4), S372–S377, DOI:10.1016/j.commatsci.2010.04.026.
- T. Ahmed Chowdhury, M. Arafat Bin Zafar, M. Sajjad-Ul Islam, M. Shahinuzzaman, M. Aminul Islam and M. Uddin Khandaker, Stability of perovskite solar cells: issues and prospects, RSC Adv., 2023, 13, 1787, 10.1039/d2ra05903g.
- R. Sharif, A. Khalid, S. Waqas Ahmad, A. Rehman, H. Ghulam Qutab, H. Hasnain Akhtar, K. Mahmood, S. Afzal and F. Saleem, A comprehensive review of the current progresses and material advances in perovskite solar cells, Nanoscale Adv., 2023, 5, 3803, 10.1039/d3na00319a.
- F. C. Valejo, J. I. Martinez, J. M. Garcia, M. Mogensen and A. J. Rossmeisl, Trends in stability of perovskite oxides, Angew. Chem., Int. Ed., 2010, 49, 7699–7701 CrossRef PubMed.
- I. Lebedev, Ab initio studies of dielectric, piezoelectric, and elastic properties of BaTiO3/SrTiO3 ferroelectric superlattices, Phys. Solid State, 2009, 51, 2324–2334 CrossRef.
- Y. Duan, G. Tang, T. Chen, Z. Lu and J. Wu, First-principles investigations of ferroelectricity and piezoelectricity in BaTiO3/PbTiO3 superlattices, Phys. Rev. B: Condens. Matter Mater. Phys., 2012, 85, 0541108 CrossRef.
- W. G. Cady, Piezoelectricity: An introduction to the theory and applications of electromechanical phenomena in crystals, McGraw-Hill Book Company, New York, 1st edn, 1946 Search PubMed.
- S. Dahbi, N. Tahiri, O. El Bounagui and H. Ez-Zahraouy, Electronic, optical, and thermoelectric properties of perovskite BaTiO3 compound under the effect of compressive strain, Chem. Phys., 2021, 544, 111105, DOI:10.1016/j.chemphys.2021.111105.
- S. Al Azar, I. Al-Zoubi, A. A. Mousa, R. S. Masharfe and E. K. Jaradat, Investigation of electronic, optical and thermoelectric properties of perovskite BaTMO3 (TM=Zr, Hf): First principles calculations, J. Alloys Compd., 2021, 887, 161361, DOI:10.1016/j.jallcom.2021.161361.
- D. Raj Jaishi and M. Prasad Ghimire, Elastic, electronic, optical and thermoelectric properties of perovskite: BaTbO3, Mater. Today Commun., 2021, 29, 102896, DOI:10.1016/j.mtcomm.2021.102896.
- K. Uchida, S. Tsuneyuki and T. Schimizu, Phys. Rev. B: Condens. Matter Mater. Phys., 2003, 68(17), 174107, DOI:10.1103/PhysRevB.68.174107.
- H. P. R. Frederikse, W. R. Thurber and W. R. Hosler, Phys. Rev., 1964, 134(2A), A442–A445, DOI:10.1103/PhysRev.134.A442.
- S. Hëbert, D. Flahaut, C. Martin, S. Lemonnier, J. Noudem, C. Goupil, A. Maignan and J. Hejtmanek, Thermoelectric properties of perovskites: Sign change of the Seebeck coefficient and high temperature properties, Prog. Solid State Chem., 2007, 35, 457–467 CrossRef.
- M. Faizan, S. H. Khan, H. Khachai, T. Sedik, S. B. Omran, R. Khenata, J. Xie and M. m. AL-Anazy, Electronic, optical, and thermoelectric properties of perovskite variants A2BX6: Insight and design via first-principles calculations, Int. J. Energy Res., 2021, 45, 4495–4507 CrossRef CAS.
- M. A. Boushla, M. Faizan, T. Sedik, S. B. Omran, H. Khachai, A. Laref, R. Khenata, S. Znaidia, I. Boukhris and S. H. Khan, DFT study on the crystal structure, optoelectronic, and thermoelectric properties of lead-free inorganic A2PdBr6(A = K, Rb, and Cs) perovskites, Mater. Today Commun., 2022, 30, 103061 CrossRef.
- A. J. Zhou, T. J. Zhu and X. B. Zhao, Thermoelectric properties of perovskite oxides La1−xSrxCoO3 prepared by polymerized complex method, J. Mater. Sci., 2008, 43, 1520–1528 CrossRef CAS.
- U. Hira, S. S. Ali, S. Latif, N. Pryds and F. Sher, Improved high-temperature thermoelectric properties of dual doped Ca3Co4O9, ACS Omega, 2022, 7, 6579–6590 CrossRef CAS PubMed.
- S. Berri and N. Bouarissa, First-principle calculations to investigate structural, electronic, optical, thermodynamic, and thermoelectric properties of ABO3 (A=Cs, Rb and B= Ta, Nb) compounds, Emergent Mater., 2022, 5, 1831–1847, DOI:10.1007/s42247-021-00324-0.
- B. Sabir, G. Murtaza, R. M. A. Khalil and Q. Mahmood, First principle study of electronic, mechanical, optical and thermoelectric properties of CsMO3 (M = Ta, Nb) compounds for optoelectronic devices, J. Mol. Graphics Modell., 2019, 86, 19–26 CrossRef CAS PubMed.
- J. P. Perdew, K. Burke and M. Ernzerhof, Generalized gradient approximation made simple, Phys. Rev. Lett., 1996, 77, 3865–3868 CrossRef CAS PubMed.
- P. Giannozzi, S. Baroni, N. Bonini, M. Calandra, R. Car, C. Cavazzoni, D. Ceresoli, G. L. Chiarotti, M. Cococcioni and I. Dabo, et al., QUANTUM ESPRESSO: a modular and open-source software project for quantum simulations of materials, J. Phys.: Condens. Matter, 2009, 21, 395502 CrossRef PubMed.
- H. J. Monkhorst and J. D. Pack, Special points for Brillouin-zone integrations, Phys. Rev. B: Solid State, 1976, 13, 5188–5192 CrossRef.
- G. K. H. Madsen and D. J. Singh, Boltztrap. a code for calculating band-structure dependent quantities, Comput. Phys. Commun., 2006, 175, 67–71 CrossRef CAS.
- C. J. Howard, B. J. Kennedy and B. C. Chakoumakos, Neutron powder diffraction study of rhombohedral rare-earth aluminates and the rhombohedral to cubic phase transition, J. Phys.: Condens. Matter, 2000, 12(04), 349–365, DOI:10.1088/0953-8984/12/4/301.
- F. D. Murnaghan, The compressibility of media under extreme pressures, Proc. Natl. Acad. Sci. U. S. A., 1944, 30(9), 244–247, DOI:10.1073/pnas.30.9.244.
- F. Birch, Finite elastic strain of cubic crystals, Phys. Rev., 1947, 71, 809, DOI:10.1103/PhysRev.71.809.
- T. Charpin, A package for calculating elastic tensors of cubic phases using wien, Geometrix F-75252, Paris, France, 2001 Search PubMed.
- G. V. Sin’ko and N. A. Smirnov, Ab initio calculations of elastic constants and thermodynamic properties of bcc, fcc, and hcp Al crystals under pressure, J. Phys.: Condens. Matter, 2002, 14, 6989–7005, DOI:10.1088/0953-8984/14/29/301.
- S. Baroni, S. d. Gironcoli, A. Dal Corso and P. Giannozzi, Phonons and related crystal properties from density-functional perturbation theory, Rev. Mod. Phys., 2001, 73, 515, DOI:10.1103/RevModPhys.73.515.
- S. D. Gupta, S. K. Gupta, P. K. Jha and N. N. Ovsyuk, A first principles lattice dynamics and Raman spectra of the ferroelastic rutile to CaCl2 phase transition in SnO2 at high pressure, J. Raman Spectrosc., 2013, 44, 926–933 CrossRef CAS.
- S. Rahmathulla S and M. Mohamed Sheik Sirajuddeen, Electronic and magnetic properties of nitrogen substituted cubic perovskites of RbNbO3 and CsNbO3 using PBE-GGA and TB-mBJ methods, Mater. Res. Innovations, 2023, 27(2), 118–129, DOI:10.1080/14328917.2022.2088920.
- J. R. Chelikowsky and M. L. Cohen, Nonlocal pseudopotential calculations for the electronic structure of eleven diamond and zinc-blende semiconductors, Phys. Rev. B: Solid State, 1976, 14, 556, DOI:10.1103/PhysRevB.14.556.
- K. Xiong, J. Robertson and S. J. Clark, Behavior of hydrogen in wide band gap oxides, J. Appl. Phys., 2007, 102, 083710, DOI:10.1063/1.2798910.
- D. W. Johnson, A Fourier series method for numerical Kramers-Kronig analysis, J. Phys. A: Math. Gen., 1975, 8(4), 490–495, DOI:10.1088/0305-4470/8/4/009.
- O. Rabina, L. Yu-Ming and M. S. Dreaaelhaus, Anomalously high thermoelectric figure of merit in Bi1−xSbx nanowires by carrier pocket alignment, Appl. Phys. Lett., 2001, 79, 81–83 CrossRef CAS.
- Organic Thermoelectric Composites Materials; Comprehensive Composite Materials II, ed. R. W. P. Beaumont and H. C. Zweben, Elsevier, 6th edn, 2018 Search PubMed.
- D. Beretta, P. Bruno, G. Lanzani and M. Caironi, Reliable measurement of the Seebeck coefficient of organic and inorganic materials between 260 K and 460 K, Rev. Sci. Instrum., 2015, 86, 075104, DOI:10.1063/1.4926885.
- J. T. Scheidemantel, A. C. Draxl, T. Thonhauser, V. J. Badding and O. J. Sofo, Transport coefficients from first-principles calculations, Phys. Rev. B: Condens. Matter Mater. Phys., 2003, 68, 125210, DOI:10.1103/PhysRevB.68.125210.
- A. Saini, R. Singh, A. A. AlShaikhi and R. Kumar, Effect of temperature dependent relaxation time of charge carriers on the thermoelectric properties of LiScX (X=C, Si, Ge) half-Heusler alloys, J. Alloys Compd., 2019, 806, 1536–1541, DOI:10.1016/j.jallcom.2019.07.306.
- D. J. Singh, Doping-dependent thermopower of PbTe from Boltzmann transport calculations, Phys. Rev. B: Condens. Matter Mater. Phys., 2010, 81, 195217, DOI:10.1103/PhysRevB.81.195217.
- D. Wang and D. Wang, Electronic structure and thermoelectric properties of pb-based half-Heusler compounds: ABPb (A = Hf, Zr; B = Ni, Pd), J. Alloys Compd., 2016, 682, 375–380, DOI:10.1016/j.jallcom.2016.05.013.
- S. D. Guo, Thermoelectric properties of half Heusler ZrNiPb by using first principles calculations, RSC Adv., 2016, 6(53), 47953–47958, 10.1039/C6RA08461C.
- K. Lai, W.-B. Zhang, F. Zhou, F. Zeng and B.-Y. Tang, Bending rigidity of transition metal dichalcogenide monolayers from first-principles, J. Phys. D: Appl. Phys., 2016, 49(18), 185301, DOI:10.1088/0022-3727/49/18/185301.
- K. P. Ong, D. J. Singh and P. Wu, Analysis of the thermoelectric properties of n-type ZnO, Phys. Rev. B: Condens. Matter Mater. Phys., 2011, 83, 115110, DOI:10.1103/PhysRevB.83.115110.
- Z. Ali, I. Ahmad, I. Khan and B. Amin, Electronic structure of cubic perovskite SnTaO3, Intermetallics, 2012, 31, 287–291 CrossRef CAS.
- C. Kim, G. Pilania and R. Ramprasad, Machine learning assisted predictions of intrinsic dielectric breakdown strength of ABX3 perovskites, J. Phys. Chem. C, 2016, 120, 14575–14580 CrossRef CAS.
- Managing Temperature Effects in Nanoscale Adaptive Systems, ed. D. Wolpert and P. Ampadu, Springer, New York, 3rd edn, 2012 Search PubMed.
- H. S. Kim, W. Liu, G. Chen, C.-W. Chua and Z. Ren, Relationship between thermoelectric figure of merit and energy conversion efficiency, Proc. Natl. Acad. Sci. U. S. A., 2015, 112(27), 8205–8210, DOI:10.1073/pnas.1510231112.
|
| This journal is © The Royal Society of Chemistry 2023 |
Click here to see how this site uses Cookies. View our privacy policy here.  Open Access Article
 *a,
Muhammad Salman Kianib,
Rab Nawazc and
Abdul Wahabd


![[3 with combining macron]](https://www.rsc.org/images/entities/char_0033_0304.gif) m space group (No. 221).40 It is a simple cubic structure with parallel mirror planes and a three-fold inversion in rotational symmetry. An ideal perovskite unit cell consists of cesium occupying the corner (0, 0, 0), niobium occupying the body center (0.5, 0.5, 0.5), and oxygen sitting at the center of each face, i.e., (0.5, 0.5, 0), as previously reported by Sabir and Berri.34,35 The lattice structure and symmetries are shown in Fig. 1a. The pressure (P) is related to volume (V) and hence to the lattice constant of the CNO system by the Murnaghan equation41,42
m space group (No. 221).40 It is a simple cubic structure with parallel mirror planes and a three-fold inversion in rotational symmetry. An ideal perovskite unit cell consists of cesium occupying the corner (0, 0, 0), niobium occupying the body center (0.5, 0.5, 0.5), and oxygen sitting at the center of each face, i.e., (0.5, 0.5, 0), as previously reported by Sabir and Berri.34,35 The lattice structure and symmetries are shown in Fig. 1a. The pressure (P) is related to volume (V) and hence to the lattice constant of the CNO system by the Murnaghan equation41,42
 , are involved in this equation and the lattice constants are changed under isotropic pressure according to eqn (5). The equation of state is obtained by linking the volume and pressure where the bulk modulus is kept constant. The changes that occurred in the lattice constant of CNO with variation of the applied pressure (60–100 GPa) are shown Fig. 1b.


 .51 The adjacent peaks are observed in the energy range of 15.161 eV to 15.733 eV, with higher pressure resulting in peaks of greater intensity. When high-energy photons interact with material, they can cause the bond breakage of the material, and the information about this bond breakage is obtained by the optical conductivity σ(ω), as depicted in Fig. 7b. This process indicates the conversion of light energy into electrical energy and satisfies the well-known Maxwell equations. The energy loss function L(ω) provides details about energy loss through scattering, heating, or dispersion, and is depicted in Fig. 7d. The energy loss function shows a series of kinks in the 6.566 eV to 7.198 eV energy range, but it still has a minimum value that begins to increase after 22.365 eV. The maximum peak of the loss function is around 26.397 eV at 80 GPa pressure. The detailed optical analysis of CNO shows that it exhibits minimum loss but maximum absorption in the visible region, making it a potential candidate for optoelectronic applications.


