 Open Access Article
Exploring the potential of a polyvinyl alcohol/chitosan-based nanofibrous matrix for erythromycin delivery: fabrication, in vitro and in vivo evaluation
Yuan Chenga,
Bahareh Farasati Far *b,
Mehdi Jahanbakhshi
 c,
Shima Bahramid,
Pegah Tamimie,
Meysam Sedaghatf and
Elham Ghazizadehagh
aSchool of Materials and Chemical Engineering, Chuzhou University, Chuzhou, 239000, China
bDepartment of Chemistry, Iran University of Science and Technology, Tehran, Iran. E-mail: Farasatifar_bahareh@cmps2.iust.ac.ir
cSchool of Chemical Engineering, College of Engineering, University of Tehran, Tehran, Iran
dNon-communicable Diseases Research Center, Shiraz University of Medical Sciences, Shiraz, Iran
eCenter for Research and Training in Skin Disease and Leprosy, Tehran University of Medical Sciences, Tehran, Iran
fAdvanced Materials Research Center, Materials Engineering Department, Islamic Azad University, Najafabad Branch, Najafabad 8514143131, Iran
gDepartment of Medical Biotechnology, School of Medicine, Mashhad University of Medical Sciences, Iran
hDepartment of Bioinspired Materials and Biosensor Technologies, Institute of Materials Science, Faculty of Engineering, Kiel University, Iran
First published on 19th June 2023
Abstract
This study aimed to investigate the potential of polyvinyl alcohol/chitosan nanofibers as a drug delivery system for erythromycin. Polyvinyl alcohol/chitosan nanofibers were fabricated using the electrospinning method and characterized using SEM, XRD, AFM, DSC, FTIR, swelling assessment and viscosity analysis. The in vitro drug release kinetics, biocompatibility, and cellular attachments of the nanofibers have been evaluated using in vitro release studies and cell culture assays. The results showed that the polyvinyl alcohol/chitosan nanofibers displayed improved in vitro drug release and biocompatibility compared to the free drug. The study provides important insights into the potential of polyvinyl alcohol/chitosan nanofibers as a drug delivery system for erythromycin and highlights the need for further investigation into the development of nanofibrous drug delivery systems based on polyvinyl alcohol/chitosan for improved therapeutic efficacy and reduced toxicity. The nanofibers prepared in this approach use less antibiotics, which may be beneficial to the environment. The resulting nanofibrous matrix can be used for external drug delivery applications, such as wound healing or topical antibiotic therapy.
1. Introduction
Drug delivery systems have been a topic of intense research over the past few decades, with the aim of improving the therapeutic efficacy of drugs while reducing their toxicity.1 One of the challenges in drug delivery is the ability to achieve controlled and sustained release of the drug to the target site.2–4 Nanofibrous drug delivery systems have been gaining significant attention in recent years due to their ability to address these challenges. In particular, polyvinyl alcohol/chitosan nanofibers have been widely investigated due to their excellent biocompatibility, biodegradability, and high drug loading capacity.5,6Erythromycin, a widely used macrolide antibiotic, has been shown to have potential applications in the treatment of a wide range of bacterial infections, including skin and soft tissue infections, respiratory tract infections, and Lyme disease. Inflammation is a natural response to tissue damage, but excessive inflammation can delay the healing process. Erythromycin has been shown to have anti-inflammatory effects, which may help to reduce inflammation and promote healing. Despite its therapeutic benefits, erythromycin has poor solubility, leading to reduced therapeutic efficacy and increased side effects when administered at higher dosages.7,8 To address these challenges, nanofibrous drug delivery systems based on polyvinyl alcohol/chitosan have been developed for the controlled and sustained release of erythromycin.
The fabrication of nanofibrous drug delivery systems is a critical step in determining the properties and performance of the system. In the past, various methods have been developed for the fabrication of polyvinyl alcohol/chitosan nanofibers, including electrospinning, solvent casting, and melt-blown techniques. The choice of fabrication method is dependent on the desired properties of the nanofibers and the intended application.9 In vitro assessment of nanofibrous drug delivery systems is essential for evaluating their potential for in vivo application. Techniques such as in vitro drug release studies and cell culture assays can be used to assess the drug release kinetics, biocompatibility, and cellular attachments of the nanofibers.10 In vitro release studies can be performed using a variety of methods, including dynamic dialysis, Franz diffusion cells, and micro dialysis.11 Also, cell culture assays can be used to evaluate the toxicity of the nanofibers to target cells and to determine their potential for in vivo application.12
Previous studies have investigated the use of polyvinyl alcohol/chitosan nanofibers for the delivery of various drugs, including antibiotics, chemotherapy drugs, and growth factors. In a study by Abasalta et al., N-carboxymethyl chitosan-polyvinyl alcohol/poly(ε-caprolactone) nanofibers were used to deliver doxorubicin, and the results showed improved therapeutic efficacy and reduced toxicity compared to the free drug.13 In another study by Madani et al., polyvinyl alcohol/chitosan nanofibers loaded with methotrexate showed improved in vitro drug release and cellular uptake, demonstrating the potential of this system for cancer therapy.14 Other studies have investigated the use of polyvinyl alcohol/chitosan nanofibers for the delivery of antibiotics. In a study by Kalalinia et al., polyvinyl alcohol/chitosan nanofibers loaded with vancomycin showed improved antibiotic efficacy against Staphylococcus aureus infections compared to the free drug.6 Similarly, in a study by Cui et al., polyvinyl alcohol/chitosan nanofibers loaded with ciprofloxacin showed improved in vitro drug release and antibacterial activity against Escherichia coli and Staphylococcus aureus compared to the free drug.15 These studies highlight the potential of polyvinyl alcohol/chitosan nanofibers for the controlled and sustained delivery of antibiotics. Despite the progress made in the development of polyvinyl alcohol/chitosan nanofibrous drug delivery systems for various drugs, there is limited research on the use of this system for the delivery of erythromycin. To the best of our knowledge, there have been no previous studies investigating the fabrication, characterization, and in vitro assessment of polyvinyl alcohol/chitosan nanofibers loaded with erythromycin. This study aims to fill this gap by investigating the potential of polyvinyl alcohol/chitosan nanofibers as a drug delivery system for erythromycin.
The gap of previous studies could be in terms of the limitations of the optimizing the fabrication methods used, and the lack of in-depth analysis of the in vitro performance of the nanofibrous drug delivery system. It could also be in terms of the lack of investigation of specific aspects of the system, such as the drug release kinetics or the toxicity of the system to target cells. These gaps could provide opportunities to conduct this study to make improvement in the field of nanofibrous drug delivery systems. In this study, polyvinyl alcohol/chitosan nanofibers have been fabricated using the electrospinning method, and their morphological and chemical properties will be characterized using SEM, XRD, AFM, DSC, FTIR, swelling assessment and viscosity analysis. The in vitro drug release kinetics, biocompatibility, and cellular attachments of the nanofibers have been evaluated using in vitro release studies and cell culture assays. The results of this study have provided important insights into the potential of polyvinyl alcohol/chitosan nanofibers as a drug delivery system for erythromycin and will contribute to the development of more effective and safe nanofibrous drug delivery systems.
This study presents an innovative approach to developing a nanofibrous matrix for erythromycin delivery using polyvinyl alcohol and chitosan, which is a topic of significant interest in the field of environmentally friendly materials. This manuscript provides valuable insights into the development of eco-friendly materials and addresses an important environmental issue by proposing a method to reduce antibiotic consumption. The use of antibiotics is a major contributor to the development of antibiotic resistance, which is a global public health concern. Our study focusses on developing a nanofibrous matrix for erythromycin delivery presents a potential solution to reduce antibiotic consumption, which is a significant environmental issue. The development of this environmentally friendly approach to antibiotic delivery can help reduce the impact of antibiotic use on the environment and contribute to the conservation of antibiotic effectiveness for future generations. Therefore, our study provides a valuable contribution to both the field of materials science and the environmental concerns.
In conclusion, the development of nanofibrous drug delivery systems based on polyvinyl alcohol/chitosan has the potential to improve the therapeutic efficacy of drugs while reducing their toxicity. This study aims to investigate the potential of polyvinyl alcohol/chitosan nanofibers as a drug delivery system for erythromycin, filling a gap in the existing literature. The results of this study will provide important insights into the fabrication, characterization, and in vitro performance of this nanofibrous drug delivery system and will contribute to the advancement of the field of nanofibrous drug delivery systems.
2. Material and method
2.1. Materials
Chitosan and PVA (average Mw 72![[thin space (1/6-em)]](https://www.rsc.org/images/entities/char_2009.gif) 000 g mol−1) with deacetylation degree of 98% determined by FT-IR were purchased from Sigma-Aldrich (USA). Electrospinning was performed with the addition of erythromycin to the polymer solution that was supplied from Sepidaj Company, Iran. Deionized water, used in the whole process, was obtained in house. Other chemicals were purchased from Merck and used without purification.
000 g mol−1) with deacetylation degree of 98% determined by FT-IR were purchased from Sigma-Aldrich (USA). Electrospinning was performed with the addition of erythromycin to the polymer solution that was supplied from Sepidaj Company, Iran. Deionized water, used in the whole process, was obtained in house. Other chemicals were purchased from Merck and used without purification.
2.2. Preparation of PVA/chitosan solution
0.3 grams of CS (3% W/V) were dissolved in 10 mL of acetic acid (1%, v/v) at ambient temperature for 3 hours. In 20 mL deionized water, 2 g of PVA was added while stirring the solution for 4 h with a magnetic heater-stirrer while the solution was heated to 50 °C. CS and PVA solutions were mixed together to obtain solutions of PVA/CS in a different weight ratio (W/W) of 0/100, 30/70, 50/50, 70/30, and 100/0. The solution was stirred at ambient temperature for one hour. To gain erythromycin loaded solution, different weights of drug (0.05, 0.10, 0.25, 0.50 and 1 mg corresponding to 1%, 2%, 5%, 10% and 20%, respectively) were added to the 70/30 (W/W) PVA/CS solutions.2.3. Rheology analyses
The properties of PVA/CS/erythromycin solutions were analyzed using a rheometer called Anton Paar (Physica TM) MCR300. The rheometer used cone and plate geometry with varying diameters and conical angles of 1° and 0.05° for different concentrated solutions. Shear viscosities were measured at 25 °C using a range of shear rates from 0.01 s−1 to 1000 s−1, and shear stresses were measured in the range of 10−3 to 103.2.4. Electrospinning process
After preparing the drug-containing solution, the electrospinning process was carried out. During electrospinning, the process was performed at ambient temperature and 32% humidity using the Electroris system (FNM Ltd, Iran). This device enables control of electrospinning parameters, such as high voltage ranging from 1 to 35 kV, injection rate ranging from 0.1 to 100 mL h−1, drum rotating speed ranging from 0 to 1000 rpm, nozzle to drum distance ranging from 2 to 30 cm, needle scanning rate ranging from 1 to 100 mm min−1, and temperature of media.The PVA/CS solution that was made was put into a plastic syringe with a capacity of 5 mL. The syringe was then equipped with needles that were 5 cm long and had an inner diameter of 0.8 mm. The syringes were placed on a holder which was moved by a programmable injection pump to control the solution flow rate. The collector was covered by an aluminum foil, and nanofibers were produced on this rotating basis mandrel. The injection rate, drum rotation speed, and the distance between the needle and electric field were all controlled through a digital screen. Afterward, a high voltage supply ranging from 5 to 20 kV was applied between the needle and collector in various electrospinning processes. The distance of the needle tip to the collector was operated in 10, 15, 18, and 20 cm. The process was performed at a flow rate of 0.5 mL h−1. In order to thoroughly remove residual solvent from the electrospun mat, it was dried in the desiccators over 24 hours at room temperature.
2.5. Structural analyses
The Shimadzu 8400s from Japan was used to record the Fourier transform infrared (FT-IR) spectra of the samples. A weight ratio of 1/100 of nanofiber and KBr were mixed and pressed to make a transparent disc. All FT-IR spectra were collected within the range of 400–4000 cm−1. Additionally, a Philips X'pert XL 30 diffractometer was used at room temperature to record the powder X-ray diffraction (XRD) spectrum.2.6. Thermal properties
The DSC analysis was carried out with NETZSCH Differential Scanning Calorimeters under nitrogen atmosphere. For each sample, at least 5 mg were weighed, placed in aluminum pans at 25.5 °C, and heated at 10 °C min−1 between 25.5 °C and 350 °C. An empty pan served as the reference material. Based on the software of the instrument, the melting peak area was calculated.2.7. Morphology characterization
To determine the surface morphology of the nanofibers, scanning electron microscopy (SEM) was used with the Seron technologies, AIS 2100 instrument. Prior to observation, the nanofibrous mats were sputter-coated with gold for 30 seconds. All SEM observations were done at an accelerating voltage of 10 kV. Additionally, surface analysis was conducted using atomic force microscopy (AFM) with the T-MDT Model TD150 device from Russia.2.8. Dissolution study
2.9. MIC and MBC evaluation
2.10. Scratch assay
Scratch assay was performed to investigate the effect of PVA/CS and PVA/CS/erythromycin nanofibers on cell migration. The assays were conducted on a monolayer of human fibroblast cells. The cells were seeded in a 6-well plate at a density of 2 × 10⁵ cells per well and allowed to grow to confluence. A scratch was made in the monolayer using a sterile pipette tip at T = 0, and the wells were washed with PBS to remove any detached cells. The cells were then incubated in DMEM supplemented with 10% FBS and 1% antibiotics (penicillin/streptomycin) at 37 °C and 5% CO2. Images of the scratch were captured at T = 0 and T = 48 using an inverted phase contrast microscope.2.11. Skin irritation study
A study was conducted to compare the skin irritation potential of PVA/CS/erythromycin nanofibers and a standard irritant (0.8%v/v formalin solution) on albino rats using the draize score test.16 The rats were divided into two groups – group I received PVA/CS/erythromycin nanofibers, and group II received formalin. Both samples were applied to the hair-free skin on the rats' backs, and the animals were examined for irritation by scoring erythema and edema using a visual scoring scale (Table 3). An adjacent area of untreated skin was used as a control. The score for primary irritation (SPI) was calculated for the control sites in the same manner as the test formulation. The difference between the summation of SPI scores for each group from the treated site and control site was calculated and used to determine the Primary Irritation Index (PII).3. Results and discussion
3.1. Preparation of PVA/CS/erythromycin
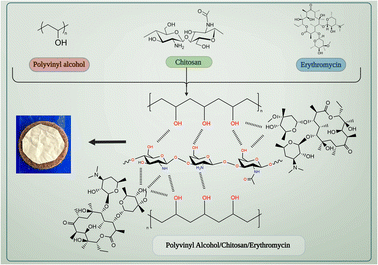
PVA/CS nanofibrous matrix can be used to create a drug delivery system for erythromycin. Chitosan has a positive charge due to the presence of amino groups, while erythromycin has a negative charge due to the carboxyl groups present in its structure. This electrostatic interaction can lead to the binding of erythromycin to the chitosan-based nanofibrous matrix. Both PVA and chitosan have hydroxyl groups (–OH) in their structure, which can form hydrogen bonds with the hydroxyl and amine groups present in erythromycin. This can facilitate the attachment of erythromycin to the nanofibrous matrix (Fig. 1). Also, the nanofibrous matrix can physically entrap erythromycin within its structure, allowing for sustained release of the drug over time. Therefore, the interaction between PVA/CS nanofibrous matrix and erythromycin can be attributed to a combination of electrostatic interaction, hydrogen bonding, and physical entrapment, which can enhance the drug delivery efficiency of the system.3.2. Morphology
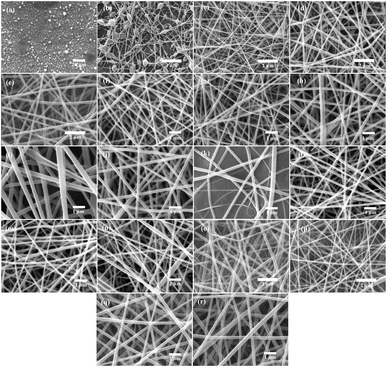
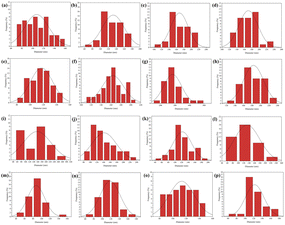
It is well known that a variety of factors play an important role in the electrospinning process: solution properties, processing parameters, and environmental variables. There are a number of factors which determine the properties of a solution, including polymer molecular weight, viscosity, surface tension, concentration, morphology and a tendency to form gels. Voltage, distance between nozzle and collector, and injection rate are all parameters of the process. Important environmental factors are temperature, pressure, humidity, and air velocity.17 In order to produce the best morphological PVA/CS/erythromycin nanofibers, various variables including PVA/CS weight ratio, drug percentage, voltage, and distance from the nozzle to the collector have been investigated. First, the weight ratios of PVA/CS were changed, and another variant such as drug percentage, voltage, and distance were fixed in 2%, 15 kV and 15 cm, respectively. The SEM image and size distribution of PVA/CS/erythromycin nanofiber composites with different ratio of PVA/CS are shown in Fig. 2 and 3. As shown in Fig. 1e, 100% PVA-based electrospun mats produced bead-free and uniform nanofibrous mats. By adding 30% CS to the PVA polymer solution (70/30 PVA/CS weight ratio) led to decrease the average diameter of pure PVA fibers from 168 nm to 132 nm (Fig. 2d) (Fig. 3b). The SEM images results indicated that the addition of CS to the PVA solution led to fiber's diameter reduction due to an increase in charge density on the droplets. Polymer solution conductivity is affected by cationic and anionic polyelectrolytes, which results in thinner fibers.5 As CS dissolves in acidic medium, it will act as a polyelectrolyte, increasing the charge density on the surface of the droplets and reducing the diameter of the fibers. Fig. 2c, with a 50/50 ratio, shows the formation of some bead-like structure. CS can be used as a thinner for PVA solution electrospinning, deformity and the bead-like structure will be increased by rising the CS percentage. Similar results have been obtained by Hang et al. and Koosha et al. who reported different weight ratios of PVA/CS blend solutions and demonstrated that the reduction of PVA/CS nanofiber diameters are under the influence of CS amount.18,19 In a study by Mahdian-Dehkordi et al., diameter of PVA/CS nanofibers decreased to 105 nm by mixing 50% V/V CS with 50% V/V PVA.20 In another study, electrospun PVA/CS nanofibers loaded with ampicillin in a 50![[thin space (1/6-em)]](https://www.rsc.org/images/entities/char_2009.gif) :
:![[thin space (1/6-em)]](https://www.rsc.org/images/entities/char_2009.gif) 50 CS/PVA volume ratio demonstrated the most significant improvement in nanofibrous structure (i.e., the closest to natural tissue) in comparison to other volumetric ratios.15 The 30/70 ratio of PVA/CS is full of beads and knots (Fig. 2b); in 100% CS solution, electrospinning was not successful, and drops of polymer were formed (Fig. 2a). CS solubility in many acids, leads its protonation and also makes it a polyelectrolyte in acidic solutions. After applying high voltage electric field during electrospinning, the repulsive forces between ionic groups in polymer will be increased which severely restrict the formation of chitosan nanofibers. It is observed that the electrospinning process of CS is difficult unless it is blended with another polymer as a co-solution. Furthermore, CS nanofibers without blending with a synthetic polymer can be physically fragile and subject to swelling. Mulchandani et al. achieved best amoxicillin loaded CS/PVA films at volumetric ratio 25/75.21 Another study found that electrospun CS/PVA blend solutions in acetic acid 70% were prepared using a variety of volume ratios (30
50 CS/PVA volume ratio demonstrated the most significant improvement in nanofibrous structure (i.e., the closest to natural tissue) in comparison to other volumetric ratios.15 The 30/70 ratio of PVA/CS is full of beads and knots (Fig. 2b); in 100% CS solution, electrospinning was not successful, and drops of polymer were formed (Fig. 2a). CS solubility in many acids, leads its protonation and also makes it a polyelectrolyte in acidic solutions. After applying high voltage electric field during electrospinning, the repulsive forces between ionic groups in polymer will be increased which severely restrict the formation of chitosan nanofibers. It is observed that the electrospinning process of CS is difficult unless it is blended with another polymer as a co-solution. Furthermore, CS nanofibers without blending with a synthetic polymer can be physically fragile and subject to swelling. Mulchandani et al. achieved best amoxicillin loaded CS/PVA films at volumetric ratio 25/75.21 Another study found that electrospun CS/PVA blend solutions in acetic acid 70% were prepared using a variety of volume ratios (30![[thin space (1/6-em)]](https://www.rsc.org/images/entities/char_2009.gif) :
:![[thin space (1/6-em)]](https://www.rsc.org/images/entities/char_2009.gif) 70, 50
70, 50![[thin space (1/6-em)]](https://www.rsc.org/images/entities/char_2009.gif) :
:![[thin space (1/6-em)]](https://www.rsc.org/images/entities/char_2009.gif) 50, and 70
50, and 70![[thin space (1/6-em)]](https://www.rsc.org/images/entities/char_2009.gif) :
:![[thin space (1/6-em)]](https://www.rsc.org/images/entities/char_2009.gif) 30). A nanofibrous matrix with the best properties was obtained at the volumetric ratio 30
30). A nanofibrous matrix with the best properties was obtained at the volumetric ratio 30![[thin space (1/6-em)]](https://www.rsc.org/images/entities/char_2009.gif) :
:![[thin space (1/6-em)]](https://www.rsc.org/images/entities/char_2009.gif) 70, that allowed dermal fibroblasts to attach and proliferate.5 As a result, the 70/30 PVA/CS weight ratio was the best one with the thinnest diameter as well as a smooth and bead-free morphology. Fathollahipour et al. fabricated complete bead-free and uniform structure of PVA/CS nanofibers with 216 nm of diameter while blending 96/4 (PVA/CS) to drug delivery of lidocaine and erythromycin. It had been found that decreasing the chitosan content of the nanofibrous mats to 98/2 had increased the average fiber diameter to 241.57.22 However, the amount of CS in that study is very low and we need more amount of CS to control the hydrophobicity of mat and release profile.
70, that allowed dermal fibroblasts to attach and proliferate.5 As a result, the 70/30 PVA/CS weight ratio was the best one with the thinnest diameter as well as a smooth and bead-free morphology. Fathollahipour et al. fabricated complete bead-free and uniform structure of PVA/CS nanofibers with 216 nm of diameter while blending 96/4 (PVA/CS) to drug delivery of lidocaine and erythromycin. It had been found that decreasing the chitosan content of the nanofibrous mats to 98/2 had increased the average fiber diameter to 241.57.22 However, the amount of CS in that study is very low and we need more amount of CS to control the hydrophobicity of mat and release profile.
In the next step, different percentages of erythromycin (1%, 2%, 5%, 10% and 20%) were added to the 70/30 weight ratio of PVA/CS solution and have been electrospun in 15 kV voltage and 15 cm distance. The effects of drug amounts on the diameter and morphology of nanofibers are illustrated in Fig. 2f–j and d–h. As can be seen, all figures were free of the bead and in uniform morphology. There was an increase in nanofiber diameter with an increase in the erythromycin percentage. The thinnest nanofibers were formed in 2% of erythromycin with an average diameter of 170 nm (Fig. 2g). It was anticipated that the addition of drugs would have an impact on the morphology and electrospinnability of the nanofibers, resulting in a variable average diameter due to changes in the solution's polarity and viscosity, as well as alterations in the chain entanglement of polymers. Igbal et al. reported that the average diameter of PVA/CS nanofibers loaded with Cefadroxil was roughly twice that of blank nanofibers.23 In this study, all of the figures with different content of drug (Fig. 2f–j) showed uniform morphology without any bead. Moreover, by comparing Fig. 2f–j, it is concluded that the loading of higher erythromycin content led to significantly increased nanofiber diameters.
In Fig. 2k–n, the effect of a high-voltage increase represents the morphology and size of the diameter distribution of the prepared composite nanofibers. High voltages 5, 10, 15, and 20 kV were applied in different experiments when 70/30 PVA/CS was loaded with 2% of the drug. The nozzle-to-drum distance was fixed in 15 cm again during the electrospinning process. Fig. 2n shows some adhesion and bead in 20 kV. Due to the decrease in the diameter of the jet. Furthermore, the drum rotating speed affects the alignment of the nanofibers. High-speed rotation of the collector drum can align nanofibers in the direction of rotation, while low-speed rotation can produce randomly oriented nanofibers. The distance between the needle and collector also affects the morphology of nanofibers, where a shorter distance leads to thinner and more uniform fibers. The injection rate can also affect the diameter of nanofibers, where a higher injection rate leads to thicker fibers due to the insufficient time for solvent evaporation. Finally, the temperature of the solution can affect the viscosity of the polymer solution, which can impact the morphology and diameter of the nanofibers. As can be seen in Fig. 3i and j, the diameter of PVA/CS/erythromycin nanofibers decrease with increasing of voltage. The thinnest PVA/CS/erythromycin nanofibers were fabricated at 20 kV with average diameter of 69 nm but some nodes can be seen at 20 kV. So, the best voltage for fabrication of thinnest PVA/CS/erythromycin nanofibers was estimated 15 kV.
In addition, the effect of distance between nozzle and collector on the fiber's diameters, indicated the direct correlation. It means that the diameter decreases as the distance decreases and vice versa. Similarly, the distances between nozzles and collectors were changed. Fig. 2k–n indicates that homogenous nanofibers were produced in the whole experiment. The average diameters decreased as the distance decreased. The lowest diameter (87 nm) can be seen in Fig. 3m. As a result, the best condition for the fabrication of PVA/CS/erythromycin composite nanofibers was as follows: 70/30 weight ratio of PVA/CS, 2% of erythromycin percentage, 15 kV high voltage and 10 cm nozzle-to-drum distance with 0.5 mL h−1 flow rate at room temperature. In this condition, the homogenous bead-free nanofibers with an average diameter of 87 nm were fabricated.
Fig. 4 illustrates the AFM image of PVA/CS nanofibers which contain erythromycin. As observed, nanofibers have a smooth and continuous surface topography, as hard materials. It is in good agreement with SEM results that the mats contain uniform fibers with high density. The roughness of the prepared PVA/CS nanofibers containing erythromycin has been investigated by AFM study (Fig. 4b). The result of AFM image indicates uniform and continuous fibers which is on approval of the SEM results. Nadem et al. investigated the surface topography of cross-linked PVA nanofibers with clindamycin. AFM image confirms the smooth and continuous structure of the nanofibers, while also showing some connectivity and adhesion due to the cross-linking process.24 Mehrali et al. reported that the Kefiran/poly(vinyl alcohol)/poly(vinyl pyrrolidone) nanofibers had a continuous and smooth surface topography without adhesion or beads, confirming the high-density fibrous nature of the mats. Their findings were consistent with the SEM results, which showed that the mats had uniform fibers.25
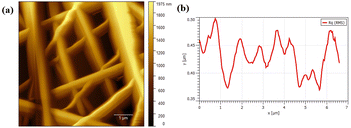 | ||
| Fig. 4 (a) AFM image of PVA/CS/erythromycin nanofibers showing plan topography of the surface and (b) size distribution graph of nanofibers AFM representation. | ||
3.3. Structural analyses
The FT-IR spectra of CS, PVA, erythromycin and PVA/CS/erythromycin nanofibers are depicted in Fig. 5a. For erythromycin loaded PVA/CS nanofibers, the peak at 1055 cm−1 is attributed to C–C stretching in the cyclic group. The absorption peak at 1080 cm−1 and 1151 cm−1 is related to C–O–C of cyclic ether stretching of CS. Also, the presence of absorption peak at 1452 cm−1 is related to the C–H bending of PVA, CS and erythromycin. The amide-type II of CS appeared at 1558 cm−1.26 In addition, the absorption peaks around 1643 cm−1, 1687 cm−1 and 1735 cm−1 are attributed to C![[double bond, length as m-dash]](https://www.rsc.org/images/entities/char_e001.gif) O amid type I, esteric group of CS and residual vinyl acetate of PVA.5,27 The characteristic peaks at 2928 and 2956 cm−1 were related to CH2 symmetric and asymmetric starching vibration. The presence of broad peaks at 3261, 3421 and 3443 cm−1 are due to stretching vibration of –OH and –NH2 that involved in the inter and intramolecular hydrogen bonding in PVA and CS.28–30 The shifting of absorption band at 3500 cm−1 in infrared spectra showed good hydrogen bonding between PVA, CS and erythromycin. The peaks in the table presented that the nanofibers peaks were very similar to the CS/erythromycin blend peaks with a remarkable shift for all the peaks to a higher wavenumber because of blending with PVA. A decrease in the intensity of C
O amid type I, esteric group of CS and residual vinyl acetate of PVA.5,27 The characteristic peaks at 2928 and 2956 cm−1 were related to CH2 symmetric and asymmetric starching vibration. The presence of broad peaks at 3261, 3421 and 3443 cm−1 are due to stretching vibration of –OH and –NH2 that involved in the inter and intramolecular hydrogen bonding in PVA and CS.28–30 The shifting of absorption band at 3500 cm−1 in infrared spectra showed good hydrogen bonding between PVA, CS and erythromycin. The peaks in the table presented that the nanofibers peaks were very similar to the CS/erythromycin blend peaks with a remarkable shift for all the peaks to a higher wavenumber because of blending with PVA. A decrease in the intensity of C![[double bond, length as m-dash]](https://www.rsc.org/images/entities/char_e001.gif) O of erythromycin caused as a result of the hydrogen bonding of the drug with PVA and CS. The shifting of wavelength of the hydroxyl group of nanofibers, in contract to PVA, to the higher number indicated the presence of the hydroxyl group, as well as the intensity of this peak, showed the presence of free hydroxyl group and incomplete hydrogen bonding that provided sufficient drug release. Also, an increase in the intensity of the CH group at around 2928 cm−1 was observed.
O of erythromycin caused as a result of the hydrogen bonding of the drug with PVA and CS. The shifting of wavelength of the hydroxyl group of nanofibers, in contract to PVA, to the higher number indicated the presence of the hydroxyl group, as well as the intensity of this peak, showed the presence of free hydroxyl group and incomplete hydrogen bonding that provided sufficient drug release. Also, an increase in the intensity of the CH group at around 2928 cm−1 was observed.
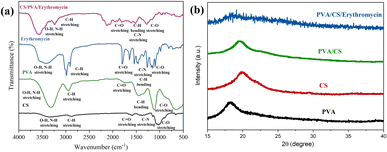 | ||
| Fig. 5 (a) FT-IR spectrum of CS, PVA, erythromycin, and PVA/CS/erythromycin composite nanofiber, and (b) X-ray diffraction pattern of PVA/CS/erythromycin. | ||
There is a peak at 2-theta = 19.5° in the diffractogram of the PVA/CS, corresponding to the amorphous phase (Fig. 5b). The broad and diminished peaks in the X-ray diffraction analysis of PVA/CS/erythromycin suggest that PVA and CS powders have become amorphous during solution preparation and electrospinning and their crystallites diminished. There were numerous distinct peaks on the X-ray pattern of pure erythromycin between the angles 5° and 30° according to previous studies.31 The broad peaks of the nanofibers XRD pattern confirmed the absence of the crystalline peaks of the drug due to the solvation of drugs in water and blending with polymer, suggesting that the drug was successfully dispersed on the PVA nanofiber mats with amorphous structure and chelated to PVA successfully.32 FT-IR and XRD analysis exhibited the presence of relevant functional groups of PVA, chitosan and erythromycin.
3.4. Rheology
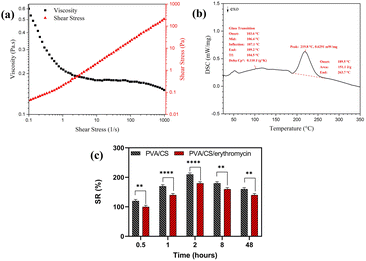
The viscosity of the electrospinning solution has a significant effect on nanofiber morphology. The flow curves for viscosity for a 70/30 weight ratio of PVA/CS solution with 2% of erythromycin are depicted in Fig. 6a. It is observed that the viscosity decreased as the shear rate went up. Hence, the solution had shear thinning behavior in the shear rate of 0.01–1000 s−1 that shows the good viscosity of solution for successful electrospinning.3.5. Thermal analysis
DSC thermograms of electrospun PVA/CS/erythromycin composite nanofibers are shown in Fig. 6b. The thermogram of prepared nanofibers did not show an apparent melting endothermic peak (Tm). The destruction of the crystal structure of PVA, CS and erythromycin during the dissolving process in the solvent and the high elongation rate and the rapid solidification process during the electrospinning resulted in a low degree of crystallinity. This led to a non-clear melting endothermic peak in the thermogram of nanofibers. Additionally, a strong hydrogen bonding between CS's macromolecules led to the degradation process of CS before the melting.33 The glass-transition temperature (Tg) of PVA/CS/erythromycin composite nanofibers can be seen at 106 °C. It is generally believed that the endothermic melting peak (Tm) of PVA appears around 205 °C.34 Thus, the melting and the degradation temperature of PVA/CS/erythromycin composite nanofibers were measured at 219 °C, ranging from 189 °C to 263 °C which is well known the transformation of erythromycin. From an unstable crystalline form to its stable cause to the disappearance of the characteristic Tm, Tg and Td peak of the drug.28 DSC analysis of PVA/CS/erythromycin nanofibers follows this subject too, and no peak from erythromycin can be seen due to homogenous dissolving in the polymer solution.3.6. Swelling study
Swelling percentage was determined using wound simulation fluid (PBS) in order to determine swelling percentage for PVA/CS and PVA/CS/erythromycin nanofiber mats (Fig. 6c). The swelling ratio in the equilibrium state of PVA/CS was around 179.6%. The equilibrium swelling condition of the PVA/CS nanofbrous demonstrates that a significant amount of fluid was absorbed within the two hours and then reduced after eight hours. However, when compared with the PVA/CS nanofibers, the swelling ratio was lower in the PVA/CS/erythromycin nanofibers. The reduction in the hydroxyl group of PVA/CS/erythromycin during the blending may be the reason of the decrease in swelling percentage.3.7. Contact angle
The water contact angle of PVA, CS, and PVA/CS/erythromycin nanofibrous mats are shown in Fig. 7, which reflects their hydrophilicity. Both PVA and CS are hydrophilic and can dissolve in water. PVA has numerous hydrophilic OH groups, while CS has NH2 and COOH groups, resulting in a high affinity with water molecules and providing the nanofibers with greater moisture absorption capacity. The water contact angle for PVA, CS, and PVA/CS/erythromycin nanofibrous mats are 20.16°, 21.02° and 30.56°, respectively. The addition of CS to the PVA/CS nanofiber mats increases the water contact angle, as it helps to uniformly disperse the conductive filler in the spinning solution. CS's molecular chains have hydrophilic amino and hydroxyl groups, making it highly hydrophilic. The presence of erythromycin can lead to a decreased contact angle of PVA/CS/erythromycin nanofibrous mat. Li et al. reported that PVA/CS/Gr nanofibrous membranes had contact angles ranging from 22–56°.35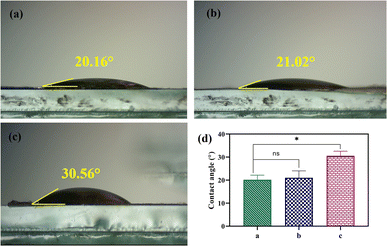 | ||
| Fig. 7 Photographs of contact angle of (a) PVA, (b) CS, (c) PVA/CS/erythromycin nanofibrous mat, and (d) their contact angle. | ||
3.8. In vitro drug release study
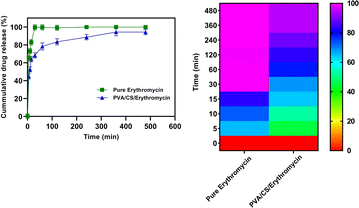
The dissolution properties of PVA/CS/erythromycin nanofibers were evaluated in vitro using a dissolution device and HPLC analysis was used to measure the erythromycin concentrations in samples. The release profile of the electrospun mats containing drugs is shown in Fig. 8. It can be seen that the total release time has ranging from 0 to 480 min (about 8 h) with the maximum release rate of 98.34% for PVA/CS/erythromycin at 360 min. Whilst drug release pattern may be divided into two stages: fast and constant, as in case with pure erythromycin, approximately 99.51% of the drug is released during the first 30 minutes. Only about 68.4% of the drug was released from PVA/CS/erythromycin nanofibers in the medium within first 30 min, which was significantly lower compared to pure erythromycin. The study of the dissolution profile of clindamycin from PVA/clindamycin nanofibers demonstrated rapid dissolution rates for PVA nanofibers in the previous studies. The PVA/clindamycin nanofibers had shown a complete release of drug within 60 minutes. The reason for this might be due to the fact that PVA has a polar structure that allows the solvent to be absorbed by the polymer rapidly and the drug molecules to be released. One of the most influential things on drug release rate is controlling the penetration of water into the system or swelling.24 In this research, PVA/CS nanofibers demonstrated the total drug release within 480 minutes. Also, it can be claimed that by addition of chitosan to the solution the hydrophobicity of nanofibers increased and the swelling rate decreased. In addition, Agrawal et al. study has confirmed the low swelling rate observed by increasing CS content and it could be attributed to the more rigid network formed by inter and intra polymer interactions.36 To minimize the risk of exposure of the wound to bacteria, an ideal wound dressing would have the ability to release drug sustainably. Herein addition of CS in the nanofibrous structure of PVA led to sustained release of the drug, which seems to be able to satisfy this demand. Our study findings were consistent with those of Iqbal et al., as they also observed a rapid release of cefadroxil from cefadroxil/PVA/CS during the first 20 minutes, followed by a sustained drug release over the next 13 hours.37 The drug release profiles from PVA/CS nanofibers into PBS medium were analyzed using first order models, and the fitting curves revealed two distinct stages (Table 1). The initial burst release occurred due to the rapid diffusion of the drug from the nanofibers, followed by a gradual increase in the amount of drug released, eventually reaching a saturation point.| Nanofibers | Zero-order | First-order | Higuchi | Korsmeyer-Peppas | |
|---|---|---|---|---|---|
| R2 | R2 | n | |||
| PVA/CS/erythromycin | 0.6938 | 0.907 | 0.8481 | 0.9419 | 0.1553 |
3.9. MTT assay
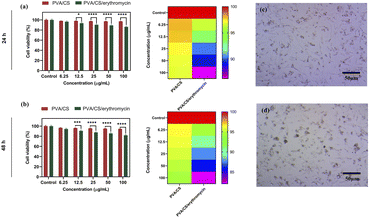
It is important that wound dressings do not negatively affect human tissue.38 NIH-3T3 fibroblasts were seeded on the nanofibres mats for evaluating their cytotoxicity. Results of cell viability are shown in Fig. 9. There was no significant difference in the viability of NIH-3T3 fibroblasts for one day between two of the samples. As compared to the control sample, nanofibre mats have lower absorbance values than the control condition after 48 h. Cell viability was decreased at higher concentration in PVA/CS/erythromycin nanofibres mat, suggesting that the loading of drug impacts the biocompatibility of nanofibres mats. Compared with the control mat, the absorbance values of PVA/CS and PVA/CS/erythromycin nanofibrous mats are above 82%. Based on the results of the study, PVA/CS and PVA/CS/erythromycin nanofibrous mats are not evidently toxic to NIH-3T3 fibroblasts.3.10. Antibacterial activity
MIC and MBC values for PVA/Cs and PVA/CS/erythromycin nanofibers were determined against S. aureus and E. coli. The MIC values for PVA/CS nanofibers were found to be >128 μg mL−1 for both bacteria (Table 2). In contrast, the PVA/CS/erythromycin nanofibers showed a significant decrease in the MIC values, with values of 1 and 4 μg mL−1 for S. aureus and E. coli, respectively. The MIC values for erythromycin alone were found to be 2 μg mL−1 for S. aureus and 8 μg mL−1 for S. aureus and E. coli. Similarly, the MBC values were determined for each nanofiber and bacteria combination. The MBC values for PVA/CS nanofibers were found to be >128 μg mL−1 for both bacteria. However, the addition of erythromycin to the PVA/CS nanofibers significantly reduced the MBC values to 4 and 16 μg mL−1 for S. aureus and E. coli, respectively. The MBC values for erythromycin alone were found to be 8 and 32 μg mL−1 for S. aureus and E. coli. These results indicate that the incorporation of erythromycin into the PVA/CS nanofibers resulted in a significant improvement in the antimicrobial properties of the nanofibers (Fig. 10), with lower MIC and MBC values against both S. aureus and E. coli. This suggests that PVA/CS/erythromycin nanofibers may have potential applications in biomedical devices and wound dressings where antibacterial activity is required.| MIC (μg mL−1) | MBC (μg mL−1) | |||
|---|---|---|---|---|
| S. aureus | E. coli | S. aureus | E. coli | |
| PVA/CS nanofibers | >128 | >128 | >128 | >128 |
| PVA/CS/erythromycin | 1 | 4 | 4 | 16 |
| Erythromycin | 2 | 8 | 8 | 32 |
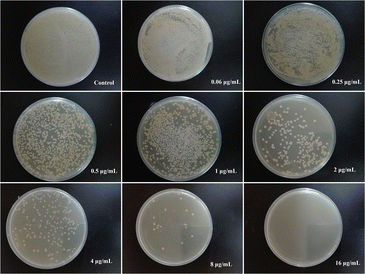 | ||
| Fig. 10 Evaluation of MBC values of PVA/CS/erythromycin nanofibers in different concentrations against E. coli. | ||
3.11. Scratch assay
The results showed that the PVA/Cs and PVA/CS/erythromycin nanofibers had a significant effect on cell migration (Fig. 11). At T = 0, the scratch width was similar in all wells, indicating that the cells were equally distributed in the monolayer. However, after 48 hours, the scratch width in the wells containing PVA/CS and PVA/CS/erythromycin nanofibers was significantly smaller than in the control wells. This suggests that the nanofibers promoted cell migration and proliferation, leading to faster wound closure. Overall, these results suggest that PVA/CS and PVA/CS/erythromycin nanofibers have potential applications in wound healing and tissue regeneration, where promoting cell migration and proliferation is critical for successful tissue repair. Nanofibers prepared in this approach use less antibiotics, which may be beneficial to the environment.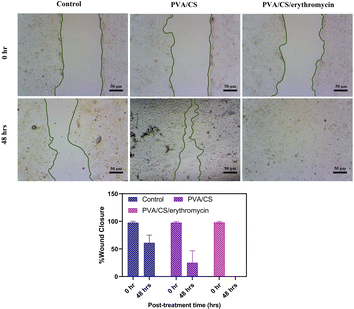 | ||
| Fig. 11 Would healings and wound closure (%) at 48 h after the treatment with PVA/CS and PVA/CS/erythromycin. | ||
3.12. Hemolysis studies
Hemolysis occurs when the osmotic pressure of red blood cells (RBCs) increases, leading to the rupture of RBCs and release of hemoglobin. The degree of hemolysis can be quantified by the hemolysis percentage (HP), which indicates the proportion of broken RBCs in contact with a sample of whole blood. Higher HP values indicate greater RBC damage. Fig. 12 illustrates a schematic of the hemolysis assay. In addition to the coagulation assay, the hemolysis test is another parameter used to evaluate hemocompatibility. Fig. 12 displays the hemolysis values of PVA/CS/erythromycin nanofibrous mat, with Triton ×100 and PBS serving as positive and negative controls, respectively. According to ASTM F756-00, materials are classified into three categories based on their hemolytic index. Materials with hemolysis percentages over 5% are considered hemolytic, those with percentages between 5% and 2% are classified as slightly hemolytic, and materials with percentages below 2% are non-hemolytic. The hemolysis rates of PVA/CS/erythromycin nanofibrous mat membranes were less than 2% which could be deemed safe for contact with a blood environment.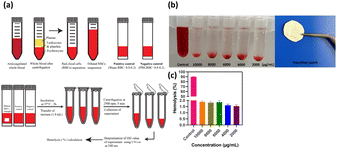 | ||
| Fig. 12 (a) Schematic of the hemolysis assay,39 (b) hemolysis percentage of PVA/CS/erythromycin nanofibrous mat with a positive control at different concentrations, (c) statistical histogram of hemolysis percentage in different concentrations. | ||
3.13. In vivo study
Table 3 summarizes the results of our study using albino mouses to evaluate skin irritation caused by patches incorporated with PVA/CS/erythromycin nanofibrous mat. Skin irritation is a localized inflammatory response that results from stimulation and is characterized by erythema (redness), edema (swelling), itching, and discomfort. We used erythema and edema grading scales to assess the severity of skin irritation, with scores ranging from 0 (none) to 4 (serious erythema/dark redness and swelling beyond the patch area). Our results showed no evidence of erythema or edema after applying medium-dose patches to the skin of the mouses (Table 3). All results indicated a favorable reaction with no harmful effects on skin cells, demonstrating that the patches were biocompatible according to our animal model experiments.| Skin responses | Animal | Score | ||
|---|---|---|---|---|
| Control | PVA/CS/erythromycin nanofibrous mat | Formalin (0.8%) | ||
| a Data of mean ± SD of 3 independent experiments. | ||||
| Erythema | 1 | 0 | 1 | 2 |
| 2 | 0 | 1 | 1 | |
| 3 | 0 | 0 | 4 | |
| 4 | 0 | 0 | 3 | |
| Oedema | 1 | 0 | 1 | 3 |
| 2 | 0 | 0 | 3 | |
| 3 | 0 | 0 | 4 | |
| 4 | 0 | 0 | 4 | |
| Primary irritation index (PII) | PII = 3/8 = 0.38 | PII = 24/8 = 3 | ||
4. Conclusions
In this study, we focused on the production of PVA/CS/erythromycin composite nanofibers by electrospinning method. A study of the effects of several factors, including PVA/CS weight ratio, the percentage of erythromycin, voltage, and nozzle-to-collector distance on morphology and an average diameter of nanofibers were investigated. According to the results, the most important factor was the PVA/CS weight ratio that significantly changed the morphology of nanofibers. The SEM image also showed that an increase in erythromycin enlarged the average diameter. On the contrary, an increase in the voltage and a decrease in the distance reduced the average diameter. The thinnest nanofibers were fabricated at a 70/30 weight ratio of PVA/CS with 2% loaded drug that electrospinning on 15 kV high voltage and 10 cm nozzle-to-collector distance with 0.5 mL h−1 flow rate at room temperature. In this condition, the homogenous bead-free nanofibers with an average diameter of 87 nm were produced. The fabricated nanofibers were characterized by SEM, AFM, DSC, and FT-IR analyses. In vitro drug release study of PVA/CS/erythromycin nanofibers indicated the sustain release profile within 600 min. The nanofiber matrix that is produced has the capability of being employed for drug delivery purposes externally, including wound healing or administering topical antibiotics.Author contributions
Conceptualization: BFF; data curation: MJ and YC; formal analysis: EG, PT and SB; investigation: BFF and MJ; methodology: EG, BFF and YC; project administration: BFF; reviewing the final draft: EG; resources: MS; software: MS and MJ; supervision: BFF; validation: YC; visualization: MJ and BFF; writing – original draft: MJ and BFF.Conflicts of interest
There are no conflicts to declare.Acknowledgements
We gratefully acknowledge Chuzhou University and Iran University of Science and Technology for providing access to their equipment, which was instrumental in conducting this research. We also extend our appreciation to the Scientific Research Startup Funding of Chuzhou University (2022qd47) for partially supporting this study.References
- S. Bazzazan, K. Moeinabadi-Bidgoli, Z. A. Lalami, S. Bazzazan, M. Mehrarya, F. E. Yeganeh, F. Hejabi, I. Akbarzadeh, H. Noorbazargan, M. Jahanbakhshi, N. Hossein-khannazer and E. Mostafavi, J. Drug Delivery Sci. Technol., 2023, 79, 104009 CrossRef CAS.
- M. Jahanbakhshi and M. Shahrousvand, in Modeling and Control of Drug Delivery Systems, ed. A. T. Azar, Academic Press, 2021, pp. 67–77, DOI:10.1016/B978-0-12-821185-4.00015-4.
- E. Karooby and G. Nosrat, Opt. Eng., 2019, 58, 065102 CAS.
- V. Eskandari, H. Sahbafar, E. Karooby, M. H. Heris, S. Mehmandoust, D. Razmjoue and A. Hadi, Spectrochim. Acta, Part A, 2023, 298, 122762 CrossRef CAS PubMed.
- E. Yan, S. Fan, X. Li, C. Wang, Z. Sun, L. Ni and D. Zhang, Mater. Sci. Eng., C, 2013, 33, 461–465 CrossRef CAS PubMed.
- F. Kalalinia, Z. Taherzadeh, N. Jirofti, N. Amiri, N. Foroghinia, M. Beheshti, B. S. F. Bazzaz, M. Hashemi, A. Shahroodi, E. Pishavar, S. A. S. Tabassi and J. Movaffagh, Int. J. Biol. Macromol., 2021, 177, 100–110 CrossRef CAS PubMed.
- M. Doostan, H. Maleki, M. Doostan, K. Khoshnevisan, R. Faridi-Majidi and E. Arkan, Int. J. Biol. Macromol., 2021, 168, 464–473 CrossRef CAS PubMed.
- A. Valizadeh, M. H. Darvishi, A. Amani and A. A. Karimi Zarchi, J. Drug Delivery Sci. Technol., 2022, 74, 103519 CrossRef CAS.
- M. Mehrarya, B. Gharehchelou, S. Haghighi Poodeh, E. Jamshidifar, S. Karimifard, B. Farasati Far, I. Akbarzadeh and A. Seifalian, J. Drug Targeting, 2022, 30, 476–493 CrossRef CAS PubMed.
- H. Sahrayi, E. Hosseini, A. Ramazani Saadatabadi, S. M. Atyabi, H. Bakhshandeh, M. Mohamadali, A. Aidun and B. Farasati Far, Artif. Organs, 2022, 46, 1504–1521 CrossRef CAS PubMed.
- F. E. Yeganeh, A. E. Yeganeh, M. Yousefi, B. Farasati Far, I. Akbarzadeh, D. O. Bokov, K. Raahemifar and M. Soltani, Cancers, 2022, 14, 1797 CrossRef CAS PubMed.
- T. Sangnim, S. Limmatvapirat, J. Nunthanid, P. Sriamornsak, W. Sittikijyothin, S. Wannachaiyasit and K. Huanbutta, Asian J. Pharm. Sci., 2018, 13, 450–458 CrossRef PubMed.
- M. Abasalta, A. Asefnejad, M. T. Khorasani, A. R. Saadatabadi and M. Irani, J. Drug Delivery Sci. Technol., 2022, 67, 102937 CrossRef CAS.
- F. Madani, B. Mujokoro, S. Mohammadi, M. Khosravani and M. Adabi, Nanomed. Res. J., 2022, 7, 150–155 CAS.
- Z. Cui, Z. Zheng, L. Lin, J. Si, Q. Wang, X. Peng and W. Chen, Adv. Polym. Tech., 2018, 37, 1917–1928 CrossRef CAS.
- J. H. Draize, J. Pharmacol. Exp. Ther., 1944, 82, 377–390 CAS.
- B. Farasati Far, M. R. Naimi-Jamal, M. Jahanbakhshi, H. T. Mohammed, U. S. Altimari and J. Ansari, J. Dispersion Sci. Technol., 2022, 1–11, DOI:10.1080/01932691.2022.2124169.
- A. T. Hang, B. Tae and J. S. Park, Carbohydr. Polym., 2010, 82, 472–479 CrossRef CAS.
- M. Koosha, H. Mirzadeh, M. A. Shokrgozar and M. Farokhi, RSC Adv., 2015, 5, 10479–10487 RSC.
- M. Mahdian-Dehkordi, F. Sarrafzadeh-Rezaei, M. Razi and M. Mahmoudian, Vet. Res. Forum, 2021, 12, 25–32 Search PubMed.
- N. Mulchandani, N. Shah and T. Mehta, Polym. Polym. Compos., 2017, 25, 241–246 CAS.
- S. Fathollahipour, M. Koosha, J. Tavakoli, S. Maziarfar and J. Fallah Mehrabadi, Iran. J. Pharm. Res., 2020, 19, 448–464 CAS.
- H. Iqbal, B. A. Khan, Z. U. Khan, A. Razzaq, N. U. Khan, B. Menaa and F. Menaa, Int. J. Biol. Macromol., 2020, 144, 921–931 CrossRef CAS PubMed.
- S. Nadem, H. Ziyadi, M. Hekmati and M. Baghali, Polym. Bull., 2020, 77, 5615–5629 CrossRef CAS.
- F. Mehrali, H. Ziyadi, M. Hekmati, R. Faridi-Majidi and M. Qomi, SN Appl. Sci., 2020, 2, 895 CrossRef CAS.
- D. Archana, J. Dutta and P. K. Dutta, Int. J. Biol. Macromol., 2013, 57, 193–203 CrossRef CAS PubMed.
- M. Jahanbakhshi and M. Shahrousvand, Int. J. Polym. Mater., 2022, 1–16, DOI:10.1080/00914037.2022.2155158.
- C. Bharathi, P. Jayaram, J. Sunder Raj, M. Saravana Kumar, V. Bhargavi, V. K. Handa, R. Dandala and A. Naidu, J. Pharm. Biomed. Anal., 2008, 48, 1211–1218 CrossRef CAS PubMed.
- M. Kačuráková, P. Capek, V. Sasinková, N. Wellner and A. Ebringerová, Carbohydr. Polym., 2000, 43, 195–203 CrossRef.
- V. Bergo, S. Mamaev, J. Olejnik and K. J. Rothschild, Biophys. J., 2003, 84, 960–966 CrossRef CAS PubMed.
- N. Sarisuta, M. Kumpugdee, B. W. Müller and S. Puttipipatkhachorn, Int. J. Pharm., 1999, 186, 109–118 CrossRef CAS PubMed.
- Y. Zhou, H. Yang, X. Liu, J. Mao, S. Gu and W. Xu, Int. J. Biol. Macromol., 2013, 53, 88–92 CrossRef CAS PubMed.
- C. Mahoney, M. B. McCullough, J. Sankar and N. Bhattarai, J. Nanomed. Biother. Discovery, 2012, 2, 1000102 Search PubMed.
- M. Doostan, M. Doostan, P. Mohammadi, K. Khoshnevisan and H. Maleki, Int. J. Biol. Macromol., 2023, 228, 506–516 CrossRef CAS PubMed.
- T.-T. Li, M. Yan, Y. Zhong, H.-T. Ren, C.-W. Lou, S.-Y. Huang and J.-H. Lin, J. Mater. Res. Technol., 2019, 8, 5124–5132 CrossRef CAS.
- P. Agrawal and K. Pramanik, Tissue Eng. Regener. Med., 2016, 13, 485–497 CrossRef CAS PubMed.
- H. Iqbal, F. K. Mahar, A. Razzaq, R. Kamal, N. U. Khan, K. Ullah and S. Iqbal, Mater. Res. Express, 2019, 6, 125094 CrossRef CAS.
- A. Dastneshan, S. Rahiminezhad, M. Naderi Mezajin, H. Nouri Jevinani, I. Akbarzadeh, M. Abdihaji, R. Qahremani, M. Jahanbakhshi, Z. Asghari Lalami, H. Heydari, H. Noorbazargan and E. Mostafavi, Chem. Eng. J., 2023, 455, 140544 CrossRef CAS.
- M. F. Elahi, G. Guan and L. Wang, Rev. Adv. Mater. Sci., 2014, 38, 148–159 CAS.
| This journal is © The Royal Society of Chemistry 2023 |

