 Open Access Article
Antibacterial activity and DNA interaction of triazine iron and ruthenium complexes: spectroscopic, voltammetric and theoretical studies
Faisal F. Albaqamia,
Ameer S. Sahibb,
Khalid M. Alharthya,
Ali Altharawic,
Mohammad Y. Alshahranid,
Mohammed Abed Jawade,
Muath Suliman *d and
Irfan Ahmadd
aPharmacology and Toxicology Department, College of Pharmacy, Prince Sattam Bin Abdulaziz University, AlKharj 11942, Saudi Arabia
bDepartment of Pharmacy, Al-Mustaqbal University College, 51001 Hilla, Iraq
cDepartment of Pharmaceutical Chemistry, College of Pharmacy, Prince Sattam Bin Abdulaziz University, Al-Kharj 11942, Saudi Arabia
dDepartment of Clinical Laboratory Sciences, College of Applied Medical Sciences, King Khalid University, Abha, Saudi Arabia. E-mail: dr.muathsuliman@gmail.com
eDepartment of Medical Laboratories Technology, Al-Nisour University College, Iraq
First published on 10th October 2023
Abstract
The 2,4,6-tris(2-pyridyl)-1,3,5-triazine (tptz), [Ru(μ-tptz)2]Cl2 and [Fe(μ-tptz)2]Cl2, complexes containing Ru (1) and Fe (2) are created. Using electronic absorption spectroscopy, fluorescence spectroscopy, circular dichroism spectroscopy, viscosity measurement and electrochemistry, as well as two complexes with Fish Salmon DNA (FS-DNA), the binding interactions of these complexes were investigated. According to binding assays, complexes bind to DNA through a mild intercalation mechanism, most likely via the DNA helix's base pairs being intercalated by the tptz ligand. Additionally, complex (2) is more capable of binding than complex (1). The electrochemical method offers a quick and easy way to determine the binding constant (Kb). The antibacterial performance of these complexes versus Gram-positive and Gram-negative bacteria was examined using the zone of inhibition test, MIC, and MBC method, and the results revealed that complex (2) exhibits strong antibacterial activity against these bacteria. The outcomes of this investigation will help in understanding DNA interaction mechanisms as well as the creation of a prospective one. Additionally, the density functional theory (DFT) computation included probes of DNA structure and conformation as well as potential pharmacological regulators for particular disorders to fully explain the experimental results.
1. Introduction
With its specific challenges and problems, medicinal inorganic chemistry has been the latest achievement in bioinorganic chemistry. Inorganic chemistry can be used in various medical areas and the detailed dimensions of the metal-containing compounds in the body for diagnostic or treatment impacts have led to several unique principles.1–4 Allegorically, it also resulted in the clinical uses of chemotherapeutic agents, such as cisplatin, to treat cancer. However, cytotoxic properties and acquired/inherent resistance have been considered another issue that is generally linked to platinum-based drugs that restrict their clinical success. Hence, new metal drugs must be developed, and the cellular response to them must be elucidated to address the aforementioned challenges.5,6Some studies have referred to antitumor activities for several complexes, particularly against metastatic cancers.7–14 In addition, the biological properties of NO and O2− can be moderated by such compounds; therefore, possible medicinal uses of the metal-based chemotherapeutic compounds have been investigated by scholars.15,16 A considerable property in the design of inorganic medicine is the effectiveness of the ligands on bioavailability. Bioavailability has been defined as the level of a dose that could be practically applied by an organism.17,18 Research has shown the high ability of ligands to change biological properties by enhancing substitution inertness or reactivity.19–21 Experts in the field have utilized multi-dentate ligands as ligands owing to their simple binding to the metal ions caused by forming largely stable coordination complexes. Because metal complexes of 1,10-phenanthroline and 2,4,6-tri(2-pyridyl)-1,3,5-triazin have shown great nucleolytic efficiencies for breaking the DNA strands, scholars have remarkably investigated them.22–24
The density functional theory (DFT) is an efficient quantum chemical computing approach for determining the molecule geometry and spectroscopic properties.25,26 Many functions were used in the DFT calculation method. The B3LYP function, together with Becke's three parametric hybrid exchange functions and the Lee–Yang–Parr correlation function, is a popular function used to theoretically calculate the molecular properties of organic molecules and metal complexes.27–29 Important information about the molecular structures and coordination geometries of metal complexes can be obtained by analyzing theoretical quantum chemical calculation results together with experimental spectra.30
Moreover, molecules that can bind and cleave the double-stranded DNA in physiological conditions have been considered agents that could be examined for medicinal uses and genomic studies.31–36
Studies have confirmed both covalent and noncovalent binding of drugs to DNA. Covalent binding in DNA is known to be immutable, which usually results in the full inhibition of the DNA processes as well as the death of cells, but noncovalent binding of the drugs is generally categorized into 3 groups:
(1) Intercalation is observed in the case of the fitting of the planar heterocyclic groups of a proper size and chemical nature between neighboring DNA-based pairs.
(2) Groove binders are drugs with the ability to form hydrogen bonds with bases, that is, thymine and adenine. Actually, a main groove is observed in cases where backbones are far apart, whereas the observed groove is found in cases of closeness. However, experts in the field have developed synthetic polyamides, such as imidazole–pyrrole and lexitropsin, with specificity for G–C areas in grooves.
(3) Electro-static binding: this kind of external binding is established through the electro-static coupling of the drugs with the positive charges but with the phosphate groups with the negative charge of the backbone of DNA.37,38
In this step, the binding interactions of [Ru(μ-tptz)2]Cl2 and [Fe(μ-tptz)2]Cl2 complexes containing 2,4,6-tris(2-pyridyl)-1,3,5-triazine (tptz) (Scheme 1) with FS-DNA under the physiological conditions are illustrated. As mentioned earlier, fluorescence and electronic absorption spectroscopy, circular dichroism spectroscopy, and viscosity measurement were employed to examine the interactions of the binding Ho-complex with FS-DNA. Finally, we assessed the anti-bacterial activities of the two complexes.
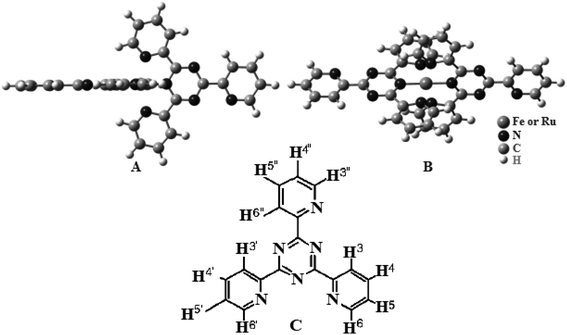 | ||
| Scheme 1 Chemical structure of the complexes (A) (side view) and (B) (top view). (C) Chemical structure of tptz. | ||
2. Experimental
2.1. Materials
All chemical reagents were utilized exactly as received. Sigma provided the Fish Salmon DNA (FS-DNA), which was purchased. 5 mM-doped Tris(trishydroxymethyl-aminomethane)–HCl buffer solution was prepared. All DNA-binding stock solutions were prepared in double-distilled water with a pH of 7.2 Tris–HCl/50 mM NaCl.2.2. Complex preparations
The [Ru(tptz)2]Cl2 (1) and [Fe(tptz)2]Cl2 (2) mononuclear complexes were made in accordance with published instructions.39 Scheme 1 depicts the potential arrangements for the complexes. Two tptz are present in the suggested structures; each with a center made up of a Ru(II) or Fe(II) ion. Each metal ion was coordinated to three nitrogen atoms, two of which came from the triazine ring and one from the pyridyl ring. Yield: 83.0% and 79% for complexes (1) and (2), respectively. Anal. calc. for C36H24N12RuCl2 and C36H24N12FeCl2: C, 57.53% and 54.26%; H, 3.19% and 3.01%; N, 22.37% and 21.10%. Found: C, 56.99% and 54.12%, H, 3.16% and 2.99%; N, 22.31% and 20.98%.2.3. Computational methods
In the beginning, utilizing the resolution of the identity, the geometry of complexes in their ground state (S0) is entirely optimized in aqueous solution and vacuo. Three-parameter hybrid functional by Becke LYP correlation uses the B3LYP level of density functional theory method in combination with effective core potential LanL2DZ basis set for Fe and Ru atom, and a standard all-electron basis set 6-311++G (d,p) for C, H, N and O atoms is adopted to obtain the lowest energy geometry of the studied ligand and complexes.40–43 The Gaussian 09 software suite was used to perform all calculations.3. Methods
3.1. Absorption spectra
Data were gathered at room temperature using 1 cm quartz cuvettes, and the Analytik Jena SPECORD S100 UV-Vis spectrophotometer was used to capture the electronic spectra. The 1.8–1.9 ratio obtained from UV absorbance in a range of 260–280 nm of FS-DNA solution in buffer (pH = 7.2) shows that DNA is adequately protein-free. The amount of FS-DNA is calculated based on the intensity of its absorption at ε(260 nm) = 6600 M−1 cm−1. By increasing the concentration of FS-DNA in the range of 0–5.5 μM while maintaining the concentration of the metal complexes in the buffer solution constant at 30 μM, absorbance titration measurements were performed to compare the binding strengths of complexes (1) and (2) with FS-DNA quantitatively. To remove DNA absorbance from the measurement of absorption spectra, both the reference solution and the complex solution received equal amounts of FS-DNA.Eqn (1) is utilized to calculate the binding constant (Kb) for the interactions of complexes with FS-DNA while maintaining track of how the absorbance of the π–π* bands changed as FS-DNA concentration increased. A plot of [DNA]/(εa − εf) versus [DNA] was given Kb as the ratio of slope to the intercept (slope 1/(εb − εf) and intercept 1/Kb(εb − εf)).
| [DNA]/(εa − εf) = [DNA]/(εb − εf) + 1/Kb(εb − εf), | (1) |
3.2. Emission spectra
Using quartz cuvettes with a 1 cm path length and a PerkinElmer, LS-3 spectrofluorophotometer, fluorescence measurements were performed. In the Tris buffer (pH = 7.2), emission spectra were captured in the range of 315–440 nm, along with excitation wavelengths of 285 and 287, matching the λmax of complexes (1) and (2), respectively. FS-DNA was introduced directly into the cell containing the complex solution (3 × 10⁻⁵ M). For FS-DNA, the concentration varied from 0 to 11 μM. Before each scan, the solution in the cuvettes was carefully mixed. At room temperature, all measurements were performed.Eqn (2) uses alterations in fluorescence intensity to calculate the binding constant (Kb) and binding site size (n) for complexes that bind to FS-DNA:
log((F0 − F)/F) = log![[thin space (1/6-em)]](https://www.rsc.org/images/entities/char_2009.gif) Kb + n Kb + n![[thin space (1/6-em)]](https://www.rsc.org/images/entities/char_2009.gif) log[DNA], log[DNA],
| (2) |
3.3. Voltammetric studies
On an SAMA500 Electroanalyser (SAMA Research Center, Iran), measurements were performed using cyclic voltammetry (CV) and differential pulse voltammetry (DPV). All potentials have been recorded vs. an Ag/AgCl reference electrode by utilizing a three-electrode cell with a platinum-disk working electrode, a platinum-wire auxiliary electrode, and Tris buffer.Peak potential separations of the anodic and cathodic waves of complexes were recorded at various scan rates with a pH of 7.2 and a concentration of 1.0 × 10⁻⁵ M. When the increasing concentrations (from 0 to 6.6 μM) of FS-DNA are absent and present, two complexes were present at a constant concentration, and variations in the DPV were observed.
A description of the binding constant (Kb) of the interaction of the complex with the DNA is presented as follows:
| log(1/[DNA]) = log(Kb) + log(IFree/IFree − IBond), | (3) |
3.4. Viscosity titration measurements
An Ubbelohde viscometer is submerged in thermostated water maintained at a constant temperature of 26.0 ± 0.2 °C for viscosity studies. A digital stopwatch is utilized to measure flow time, and the average values of three replicated measurements are calculated. To determine the viscosity values of FS-DNA when complexes are present and absent, the following equation was used:| η = (t − t0)/t0, | (4) |
3.5. Circular dichroism measurements
At room temperature (25 °C) and using a quartz cell with a 0.1 cm path length, the CD spectra of the DNA were captured when the two complexes were absent and present. Data were taken every 0.2 nm ranging from 200 to 320 nm during four scans at a scan rate of 200 nm min−1, as well as every CD spectra were produced following the averaging ratios of [complex]/[DNA] (1/R = 0–0.1).3.6. Test of antibacterial properties
The antibacterial effectiveness of P. aeruginosa (ATCC 27853), E. coli (ATCC 25922), K. pneumoniae (ATCC 10031), S. typhi (ATCC 1609), E. faecalis (ATCC 29212), MRSA, Acinetobacter, E. faecium, and VRE, which were isolated from nosocomial infections, was valuated by utilizing the broth dilution method. The bacterial growth medium employed was Mueller–Hinton broth with a 2% glucose addition. The zone of inhibition test was used to assess the antibacterial spectra of complexes (1) and (2). A Mueller–Hinton agar plate was coated with a standard inoculum of the test organism that contained 107 colony-forming units (CFU) mL−1, and antibacterial filter paper discs (6 mg mL−1) were then placed on the agar. The clear zones surrounding the disc on the plates were measured after being incubated at 37 °C overnight.The minimum inhibitory concentration (MIC) and minimum bactericidal concentration (MBC) of complexes were identified by utilizing the broth dilution method to evaluate the antibacterial activity quantitatively. In tubes holding 5 mL of Mueller–Hinton broth, a solution of bacteria comprising 107 CFU mL−1 was introduced along with 10-fold dilutions of two complexes in a range of 0.003–36 mg L−1. The plates underwent a 24 hour aerobic incubation at 37 °C. Following the incubation, the tubes were checked for turbidity without shaking. The MIC is the smallest quantity of the compound where no bacterial growth is observed. The studies were conducted three times, and the strain's MIC (μg mL−1) was determined based on findings that were consistent on two or more occasions. Following the determination of the MIC, 0.1 mL of inoculum from each tube's broth that had no discernible turbidity was subcultured on a plate of nutrient agar and incubated for 24 h at 37 °C. Owing to incubation time, the number of growing colonies in this subculture was counted, and the CFU mL−1 in the original inoculum was compared. Less than 0.1% of the original inoculum was reported to have survived because of the MBC's lowest complex concentration.
4. Results and discussion
4.1. Characterization of complexes (1) and (2) with 1H NMR
The 1H NMR resonances for ligands and complexes (1) and (2) are listed in Table 1, and the numbering scheme is given in Scheme 1. There is a pronounced shift in the 1H NMR resonances of the ligand protons owing to several factors that affect their chemical shifts on metal complexation. In the case of complexes (1) and (2), the H3,3′ protons are forced into the plane of the central triazine ring, which causes significant deshielding. Second, the coordinated metal ion shifts the ligand proton resonances adjacent to the N atom upfield owing to the magnetic anisotropy of the bound metal ion. The H6,6′ protons of complexes (1) and (2) clearly follow this trend although the H5,5′ protons show only a very slight shielding effect because of metal complexation.| Compound | 3,3′ | 4,4′ | 5,5′ | 6,6′ | 3′′ | 4′′ | 5′′ | 6′′ |
|---|---|---|---|---|---|---|---|---|
| tptz | 8.77 | 7.88 | 7.46 | 8.90 | 8.77 | 7.88 | 7.46 | 8.90 |
| Complex (1) | 9.06 | 8.13 | 7.39 | 7.73 | 9.06 | 8.25 | 7.79 | 9.15 |
| Complex (2) | 9.09 | 8.19 | 7.37 | 7.71 | 9.09 | 8.27 | 7.83 | 9.17 |
4.2. Electronic absorption titration
The absorption band is typically bathochromized (the π* orbital of the intercalated ligand could couple with the orbital of base pairs, lowering the π–π* transition energy) and hypochromized (the electrons in the coupling π* orbital are partly filled, resulting in decreasing transition probabilities) when complex binding with DNA via intercalation.44Eqn (5) was used to determine how much the hypochromism of the spectra was at λmax:
| H% = (AFree − ABonded/AFree) × 100, | (5) |
The electronic absorption spectra of the complexes (8 × 10⁻⁵ M) in the presence and absence of FS-DNA are depicted in Fig. 1. The spectra of the two complexes displayed intense π–π* or n–π* transition absorption of the aromatic chromophore in the UV region. Complex (1) had an extreme absorption band in the UV area at λmax = 272, whereas complex (2) displayed an intense absorption band at λmax = 276. The absorption bands of complexes (1) and (2) demonstrate hypochromisms of 24% and 27%, respectively, when the concentration of FS-DNA increases. Complex (2) showed a stronger hyperchromic effect, indicating a greater tendency for DNA binding in the complex. Two complexes were clearly identified by their spectral properties as having a high affinity for DNA and interacting with it most likely via an intercalation mechanism, including stacking interactions among the aromatic planar ligand and the DNA base pairs. There was evidence of intercalative binding in other tptz complexes.45
 | ||
| Fig. 1 Electronic spectra of (A) complex (1) and (B) complex (2) in the absence (1) and presence (2) of FS-DNA. [Complexes] = 8 × 10⁻⁵ M, and [DNA] = 0–5.5 μM. | ||
According to eqn (1), the binding constants Kb of complexes (1) and (2) were measured to be 1.95 ± 0.02 × 10⁵ and 5.34 ± 0.01 × 10⁵ M−1, respectively. The findings indicate a close relationship between the compounds and the FS-DNA and show that the binding strengths of complexes follow the order (2) > (1). Additionally, because the binding constant of the complexes is clearly lower than that of the classical intercalator (for ethidium bromide, Kb = 1.4 × 10⁶ M−1, and [Ru(phen)DPPZ]2+, with binding constants of 106 to 107 M−1) through moderate intercalation, it can be concluded that the complexes consistently bind to FS-DNA.46,47
4.3. Fluorescence titration
One of the methods with the greatest potential for analyzing drug–DNA interactions is luminescence spectroscopy. Additionally, we investigate the fluorescence spectroscopy of DNA–complex interaction. The distinctive alterations in the fluorescence emission spectra occur during the titration of complexes with FS-DNA, as shown in Fig. 2. This graph demonstrates how FS-DNA's concentration causes the fluorescence intensity of the complexes to decrease. Eqn (2) is utilized to measure the binding constant (Kb) and binding site size (n). The measured DNA binding constants for complexes (1) and (2) are 1.50 ± 0.03 × 10⁵ and 4.75 ± 0.02 × 10⁵, respectively. Because complexes with small binding site sizes (intercalators) require proportionally greater concentrations to saturate the sites, the binding site's size (n) also allows for differentiating non-intercalative binding agents from intercalating agents. When compared to many polypyridyl complexes that bind to DNA in an intercalative binding manner, the Kb and n values of the complexes indicate moderate binding.21 This conclusion is in line with the outcomes of the tests with electronic absorption titration.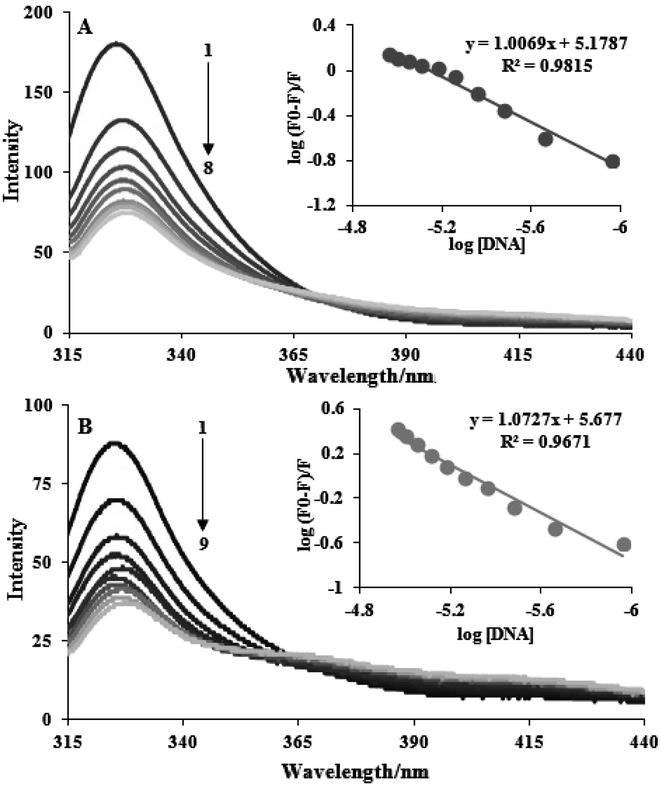 | ||
| Fig. 2 Fluorescence emission spectra during the titration of complexes (3 × 10⁻⁵ M) with FS-DNA (0–11 μM). Plot of log((F0 − F)/F) vs. log[DNA], (A) complex (1) and (B) complex (2). | ||
4.4. Competitive binding
Ethidium bromide (a common indication of intercalation) competitive binding was used to determine whether the complexes may bind to FS-DNA in the intercalation mode. When DNA is present, the fluorescence of EB rises because of strong intercalation (λex = 525 nm, λem = 550–650 nm). However, it is extremely faint when DNA is absent. Owing to EB's displacement by EB-DNA, a DNA binding agent used in increasing concentrations causes a substantial decrease in EB's fluorescence. According to EB-DNA quenching data, if the complex is attached to DNA through the intercalation mode, the emission intensity of the EB-DNA system decreases by more than 50%.31 Fig. 3 displays plots of F/F0 vs. [complex]/[DNA] for the complexes. When complexes (1) and (2) were added to the EB-DNA complex, the emission intensity was noticeably reduced by 51.4% and 58.3%, respectively. Therefore, it is acceptable that intercalations exist between DNA and these complexes under study.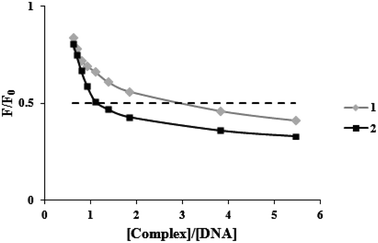 | ||
| Fig. 3 Plots of the fluorescence titration data of the DNA-EB system (F/F0 versus [complex]/[DNA]) for two complexes. | ||
4.5. Electrochemical studies
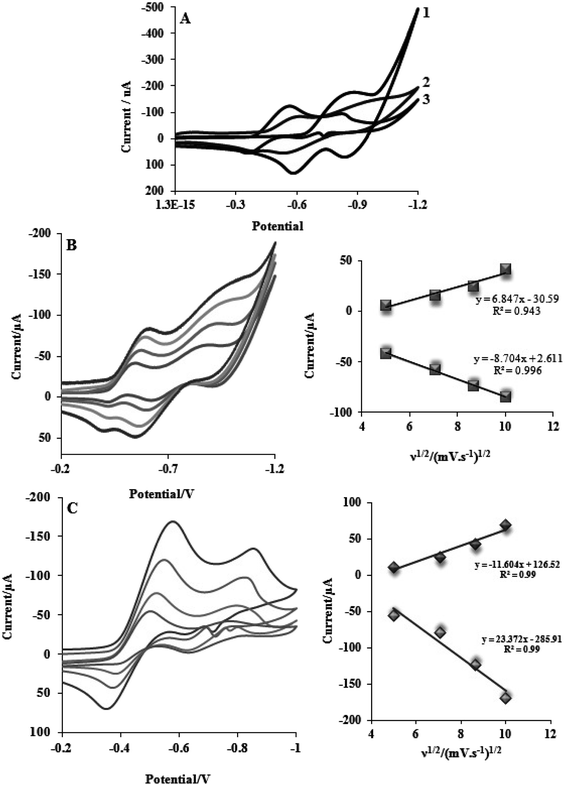
This section describes electrochemical investigations of the electrostatic or intercalative interactions of compounds with FS-DNA. The use of electrochemical methods to analyze DNA complexes supports earlier research methods, such as fluorescence emission spectroscopy and electronic absorption.The electrochemical behaviors of tptz and complexes (1) and (2) at the Pt electrode are shown in Fig. 4A. Notably, tptz had a reduction and oxidation peak at potentials of −0.816 and −0.611 V versus SCE, respectively, as depicted in Fig. 4A1. Complex (1) had two reduction/oxidation peaks at −0.570/−0.550 V and −0.935/−0.911 V under identical conditions (see Fig. 4A2). Complex (2) further displayed two peaks for reduction/oxidation at −0.537/−0.370 V and −0.808/−0.595 (see Fig. 4A3). The reduction/oxidation of Fe(II)/Fe(I) and Ru(II)/Ru(I) was attributed to the initial redox peaks for complexes (1) and (2), respectively. Additionally, the reduction/oxidation of tptz in complexes (1) and (2) was attributed to the second peaks. The cyclic voltammograms for the reduction/oxidation of complexes (1) and (2) are shown in Fig. 4B and C at different scan rates, respectively. For the first reduction/oxidation peaks, as shown in the inset of Fig. 4B and C, the peak increased linearly with the scan rate between 10 and 100 mV s−1, demonstrating that the mass transport of complexes (1) and (2) from the bulk solution to the electrode surface controls the overall kinetics of the process. A quasi-reversible redox mechanism was suggested by the separation of the cathodic and anodic peak potentials and the ratio of Ipa/Ipc (ratio 0.40) for both complexes (1) and (2). Fig. 5 depicts the typical CV behavior of complexes (1) and (2) when FS-DNA is present and absent. Table 2 summarizes the voltammetric findings. When FS-DNA is added to the complexes, cathodic and anodic peak currents are significantly reduced because a combination of free and DNA-bound complexes diffuses slowly to the electrode surface. Additionally, the larger change in the E1/2 value for complex (2) compared to complex (1) after the addition of FS-DNA might suggest that the former's binding affinity for DNA is greater than the latter. Consequently, the clear change in the E1/2 value in the CV behavior of complexes upon the addition of DNA (see Fig. 5C and D) confirms our earlier hypothesis that the complexes bind to DNA intercalatively.48,49 According to Fig. 5C, as FS-DNA increases, both the peak potential (Ep) and peak current for complex (2) move to positive potential. The peak current for complex (1) decreases with increased FS-DNA under the same conditions.
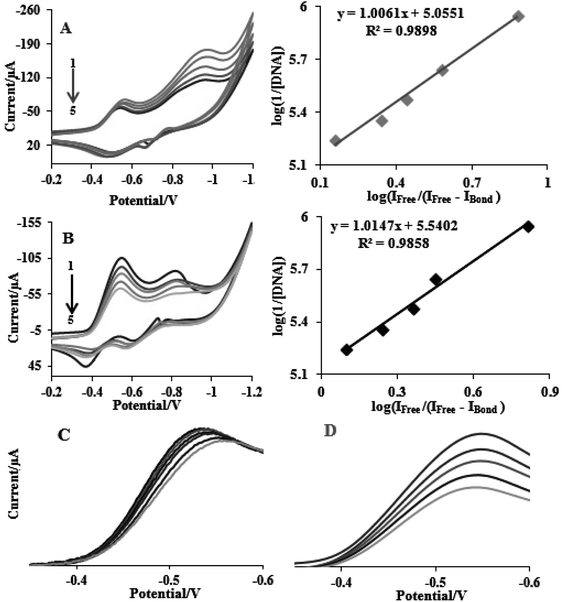 | ||
| Fig. 5 CV of (A) complex (1) and (B) complex (2) complexes (10−5 M) in the absence and presence of FS-DNA (0–6.6 μM), and (C) and (D) the E1/2 value in the CV behavior for complexes (1) and (2). | ||
| Complex no. | Epc | Epa | ΔE (mV) | E1/2 |
|---|---|---|---|---|
| 1 | −0.51, −0.91 | −0.58, −0.93 | 70, 20 | −0.54, −0.92 |
| 2 | −0.57, −0.84 | −0.36, −0.62 | 210, 220 | −0.46, −0.73 |
Eqn (3) states that Kb (the slope of log(1/[DNA]) vs. log(IFree/(IFree − IBond))) of complexes (1) and (2) was determined from the reduction of the CVs and results in values of 1.13 ± 0.03 × 10⁵ and 3.46 ± 0.01 × 10⁵ M−1, respectively. Intercalation interactions are often stronger than analogous purely groove or electrostatic binding interactions according to the relative values of the binding constants for identical structural complexes.
4.6. Viscometric studies
To further understand the nature of the interaction among two complexes and DNA, viscosity measurements were performed. Consequently, in the lack of crystallographic structural information, hydrodynamic measures, which are sensitive to length variation (such as sedimentation and viscosity), are considered as tests of a binding model in solution that are the least confusing and most significant. The DNA helix lengthens in the standard intercalation model as base pairs are moved to make room for the bound complexes, increasing DNA viscosity and mimicking the actions of the known DNA intercalator. Contrarily, the groove binding or electrostatic mode of the complexes often results in no changes in the DNA solution's viscosity.31 Fig. 6 displays how two complexes affect the viscosity of FS-DNA. With higher complex concentrations, DNA becomes increasingly viscous. However, the degree of the increase is lower for complex (1) than for complex (2). A spread in the DNA helix can be produced by two complexes intercalating between neighboring DNA base pairs, thereby increasing the DNA's viscosity. Complex (2) could intercalate more vigorously and profoundly compared to complex (1). The findings of the viscosity experiments confirm those of the spectroscopic and electrochemical investigations.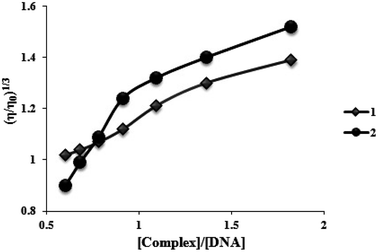 | ||
| Fig. 6 Effects of increasing amounts of complexes (1) and (2) on the relative viscosity of FS-DNA at 26.0 ± 0.2 °C. | ||
4.7. CD spectroscopic studies
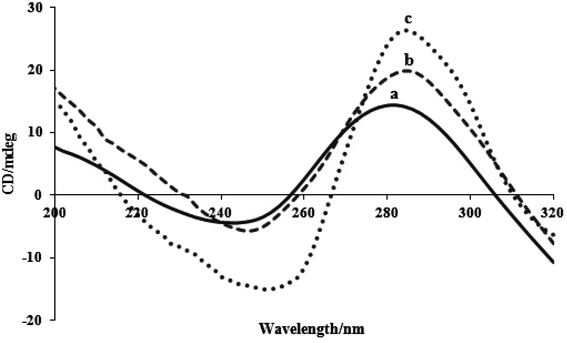
When tiny compounds interact with DNA in solution, conformational changes in the DNA may be observed using the CD spectroscopy method. The right-handed helicity and base stacking in the FS-DNA's B-form conformation result in a positive band at 280 nm and a negative band at 245 nm, respectively. The helicity bands and base stacking are less or not perturbed by the electrostatic interaction and groove binding of complexes, whereas intercalation mode can cause the intensities of both bands to fluctuate, preserving DNA's right-handed B conformation.21 Fig. 7 displays the FS-DNA's CD spectra titrated with two complexes. With an increase in the concentration of two complexes and a red shift, the intensities of the negative and positive bands increase but with scarcely altered shapes. This phenomenon demonstrated the intercalative effect of the two complexes on DNA base stacking. The complex was stacked into the duplex DNA's base pairs and prevented the surrounding base pairs from closely stacking, leading to an improvement in both bands. Additionally, a red shift in two bands indicates the presence of two complexes that affect the FS-DNA's helicity.50 Additionally, complex (2) has a greater impact on CD spectral alterations than complex (1). Strong perturbation on the base stacking along with the helicity band of DNA could be observed in the CD spectra of complex (2). The results of the CD spectral tests confirm the assessments of viscosity, electrochemistry, and spectroscopy.4.8. Antibacterial effects
Zones of inhibition tests, MIC tests, and the MBC method were used to evaluate the antibacterial effectiveness of the complexes against the bacteria. Zones of inhibition of the complexes against bacteria after 24 hours of incubation ranged from 10.0 to 36.0 mm (Table 3). The complexes showed notable effectiveness against bacteria, particularly S. typhi, E. coli, and A. baumannii. The outcomes in Table 3 demonstrate that the complexes are effective in combating these bacteria. The MIC and MBC values of the complexes for bacteria were 14–210 μg mL−1 and 0.45–4.0 mg mL−1, respectively. Regardless of the gram class, the complexes show potent antibacterial action, even against bacteria, such as MRSA and E. coli, which are harder to eradicate.51,52| Bacteria | Zones of inhibition (mm) | MIC (μg mL−1) | MBC (mg mL−1) | ||||
|---|---|---|---|---|---|---|---|
| Ru (1) | Fe (2) | Ru (1) | Fe (2) | Ru (1) | Fe (2) | ||
| Gram-positive | E. faecium | 18.0 | 19.0 | 210.0 | 175.0 | 4.0 | 3.64 |
| E. faecalis | 10.0 | 12.0 | 190.0 | 163.0 | 4.0 | 3.64 | |
| MRSA | 24.0 | 26.0 | 135.0 | 80.0 | 3.64 | 1.82 | |
| VRE | 12.0 | 13.0 | 90.0 | 65.0 | 0.91 | 0.91 | |
| Gram-negative | E. coli | 27.0 | 30.0 | 42.0 | 31.0 | 1.82 | 0.91 |
| P. aeruginosa | 19.0 | 22.0 | 175.0 | 114.0 | 3.64 | 1.82 | |
| K. pneumoniae | 20.0 | 26.0 | 165.0 | 114.0 | 1.82 | 0.91 | |
| A. baumannii | 26.0 | 28.0 | 57.0 | 44.0 | 1.82 | 0.91 | |
| S. typhi | 31.0 | 36.0 | 14.0 | 14.0 | 0.91 | 0.45 | |
By raising the levels of complexes, the antibacterial efficacy would be dramatically enhanced because the size of the bacterial colonies formed on plates with more than 0.91 mg of complex (1) and 0.45 mg of complex (2) was significantly reduced. Additionally, based on the findings, it was determined that complex (2) had greater antibacterial activity than complex (1).
4.9. Theoretical studies
Geometry-optimized and IR spectral simulations for both complexes were performed within the domain of the DFT. Two complexes adopt a distorted octahedral geometry with C1 symmetry (Scheme 1). Some MO pictures of complexes (1) and (2) are shown in Fig. 8.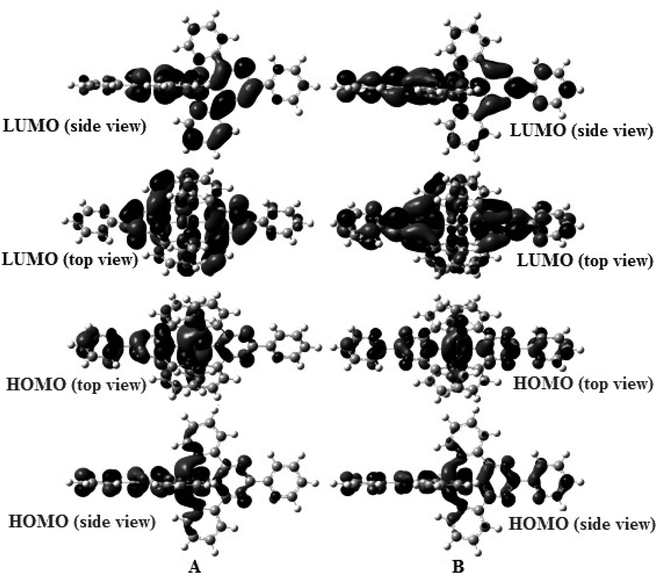 | ||
| Fig. 8 Some MO pictures (HOMO, LUMO) of (A) complex (1) and (B) complex (2) using the DFT method at the B3LYP/LanL2DZ level. | ||
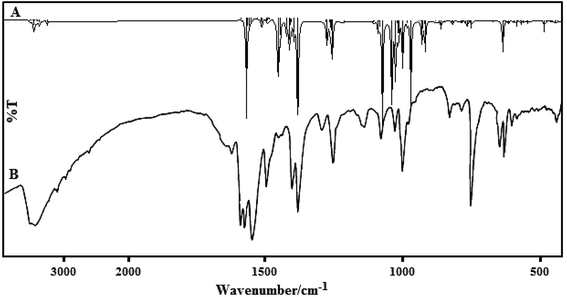
A comparison of the vibrational frequencies calculated at B3LYP/LanL2DZ with the experimental values (Fig. 9) demonstrated that the B3LYP/LanL2DZ basis set provides sensible deflection from the experimental values for the two complexes. Any difference noted between our calculated and experimental vibrational frequencies may be because the calculations were exactly accomplished on a single molecule in the gaseous state, whereas the experimental values were obtained from both powder and thin film states in the presence of intermolecular interactions.
The TDDFT method was successfully used to compute the properties of transition metal complexes, including the electronic spectra and chemical reaction processes. To explore the different spectral properties of the two complexes, the absorption spectra of complexes (1) and (2) were computed and simulated using the TDDFT method at the B3LYP/LanL2DZ level in an aqueous solution. In this study, only the charge-transfer transitions were analyzed because the charge-transfer transitions directly reflect electronic communications qualitatively. The computed excitation energies (ΔE/eV), oscillator strengths (f ≥ 0.001), and the simulated absorption spectra in aqueous solution are illustrated in Fig. 10.
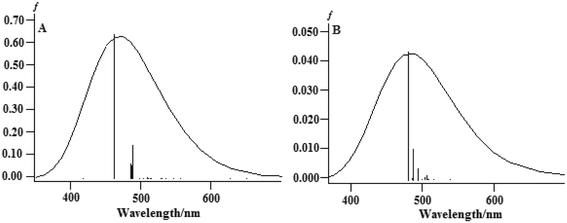 | ||
| Fig. 10 The calculated absorption spectra of (A) complex (1) and (B) complex (2) in an aqueous solution. | ||
From Fig. 11, we can observe the following:
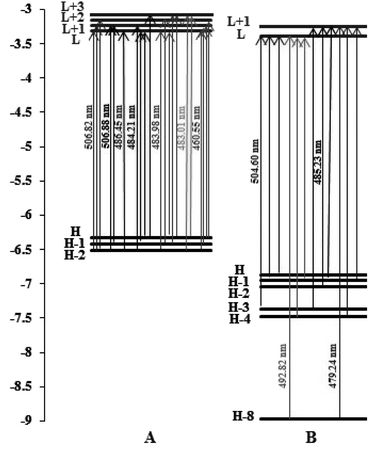 | ||
| Fig. 11 Orbital energy level diagrams of the molecular orbitals involved in the spin-allowed transitions with the largest CT coefficients for (A) complex (1) and (B) complex (2) in water solvent. | ||
For complex (1), the strongest band of the 24 excited states at 460.55 nm is mainly attributed to the transitions of HOMO−2 → LUMO, HOMO−1 → LUMO+1, HOMO → LUMO+1 and HOMO → LUMO+2.
For complex (2), the strong band of the 24 excited states at 479.24 nm mainly involves the transition of HOMO−8 → LUMO+1, HOMO−4 → LUMO+1 and HOMO−1 → LUMO+1.
The energies of the frontier molecular orbitals, namely the highest occupied molecular orbital (HOMO) and lowest unoccupied molecular orbital (LUMO), are crucial for determining the pattern of the DNA binding of complexes and their spectrum characteristics. It is well known that the DNA binding of Ru(II) and Fe(II) polypyridyl-type complexes occurs in an intercalative (or moderately intercalative) manner and involves stacking interactions. For a straightforward model of stacked DNA-base pairs with backbones, Kurita and Kobayashi further published calculated findings using the DFT method, which might be beneficial for the DNA-binding investigation of complexes.53 Their findings demonstrate that the HOMO energy is rather high, as are the energies of several occupied orbitals close to the HOMO, and that the components of the HOMO and HOMO−1 were mostly distributed on the base pairs. This evidence supports the idea that bases and base pairs are effective electron donors. Fig. 11, which depicts the orbital energy level diagrams of selected frontier molecular orbitals associated with the spin-allowed transitions in aqueous solution with the highest CT coefficients, is a spin-allowed transition. Two complexes were found to have low LUMO and LUMO+x (x: 0–3) energies by applying the DFT method in aqueous solution, indicating that they are excellent electron acceptors and should interact strongly with the base pairs of DNA. This shows that the manner of binding these complexes to DNA is intercalative. Table 4 shows that the two complexes' LUMO along with LUMO+x energies are arranged in the order (1) > (2), showing that the connection between complex (1) and the DNA weakens in aqueous solution. These theoretical hypotheses are well supported by experimental data, which demonstrates that the DNA bonding constants of complex (2) are larger than those of complex (1).
| Complex no. | HOMO−1 | HOMO | LUMO | LUMO+1 |
|---|---|---|---|---|
| 1 | −6.52 | −6.49 | −3.24 | −3.20 |
| 2 | −6.89 | −6.84 | −3.33 | −3.30 |
5. Conclusion
The synthesis of two water soluble complexes of Ru and Fe with tptz ligand was done. The binding interaction of complexes with FS-DNA was examined from the perspective of bioinorganic chemistry using UV absorption, fluorescence spectroscopy, viscosity measurements, and electrochemical analysis, as well as circular dichroism spectroscopy. The three methods were each used to calculate the binding constant of the complexes. The binding constants of complexes (1) and (2) that form UV absorption are 1.95 ± 0.02 × 10⁵ and 5.34 ± 0.01 × 10⁵ M−1, respectively. Among the three methods for the calculation of Kb, the electrochemical method is faster than the UV absorption and fluorescence spectroscopy methods. These observed results demonstrated the effective interactions of complexes (1) and (2) with FS-DNA via intercalation due to the presence of aromatic rings in the ligand architecture. Viscosity measurement studies also support the formation of partial intercalation. Circular dichroic studies have shown an increase in stacking due to partial intercalation. The only limitation to their application as drugs could stem from the lower thermodynamic and/or kinetic stability of these complexes compared with analogous platinum complexes; however, this may depend strongly on the nature of the coordinating ligands. In perspective, the above considerations reinforce the role that computational chemistry may play as a valuable diagnostic tool to interpret spectroscopic measurements and to unveil the ensuing metal complex–DNA binding. In this way, it should be possible to reliably account for both covalent and non-covalent binding between a metal complex and a DNA model.Conflicts of interest
There are no conflicts to declare.Acknowledgements
The authors express their gratitude to the Deanship of Scientific Research at King Khalid University for funding this work through the Large Research Group Project under grant number RGP.02/316/44.References
- N. Kumar, R. Kaushal and P. Awasthi, J. Mol. Struct., 2023, 1288, 135751 CrossRef CAS.
- H. Zhang, Q. Zou, Y. Ju, C. Song and D. Chen, Curr. Bioinf., 2022, 17, 473 CrossRef CAS.
- T. Saha, S. Sappati and S. Das, Int. J. Biol. Macromol., 2023, 125305, DOI:10.1016/j.ijbiomac.2023.125305.
- F. Tang, H. Wang, L. Zhang, N. Xu and A. M. Ahmad, Commun. Nonlinear Sci. Numer. Simul., 2023, 126, 107446 CrossRef.
- Z. Shabaninejad, M. Nikkhah and S. M. Nabavizadeh, J. Inorg. Biochem., 2023, 243, 112194 CrossRef CAS PubMed.
- L. Zhang, S. Deng, Y. Zhang, Q. Peng, H. Li, P. Wang, X. Fu, X. Lei, A. Qin and X. Y. Yu, Adv. Healthcare Mater., 2020, 9, e1900772 CrossRef PubMed.
- M. P. Kumar and D. A. Shivaraj, Results Chem., 2023, 5, 100845 CrossRef.
- X. P. Lei, Z. Li, Y. H. Zhong, S. P. Li, J. C. Chen, Y. Y. Ke, A. Lv, L. J. Huang, Q. R. Pan, L. X. Zhao, X. Y. Yang, Z. S. Chen, Q. D. Deng and X. Y. Yu, Acta Pharm. Sin. B, 2022, 12, 3877 CrossRef CAS PubMed.
- P. Jyothi, V. Sumalatha and D. Rajitha, Inorg. Chem. Commun., 2022, 145, 110029 CrossRef CAS.
- J. Wang, X. Jiang, L. Zhao, S. Zuo, X. Chen, L. Zhang, Z. Lin, X. Zhao, Y. Qin, X. Zhou and X. Y. Yu, Acta Pharm. Sin. B, 2020, 10, 313 CrossRef PubMed.
- P. Mamta and A. Chaudhary, J. Mol. Struct., 2023, 1279, 134936 CrossRef.
- W. Wu, N. Xu, B. Niu, X. Zhao and A. M. Ahmad, Electronics, 2023, 12, 2771 CrossRef.
- R. P. Paitandi, R. S. Singh, S. Mukhopadhyay, G. Sharma, B. Koch, P. Vishnoi and D. S. Pandey, Inorg. Chim. Acta, 2017, 454, 117 CrossRef CAS.
- S. Guo, X. Zhao, H. Wang and N. Xu, Appl. Math. Comput., 2023, 456, 128127 CrossRef.
- A. K. Asatkar, M. Tripathi and S. Panda, Spectrochim. Acta, Part A, 2017, 171, 18 CrossRef CAS PubMed.
- X. Feng, L. Sun, W. Wang, Y. Zhao and J. Shi, Sep. Purif. Technol., 2023, 324, 124520 CrossRef CAS.
- B. Archana and S. Sreedaran, Polyhedron, 2023, 231, 116269 CrossRef CAS.
- Z. Liu, B. Fan, J. Zhao, B. Yang and X. Zheng, Corros. Sci., 2023, 212, 110957 CrossRef CAS.
- N. Shahabadi and S. Hadidi, Inorg. Chim. Acta, 2022, 543, 121192 CrossRef CAS.
- Y. Liu, B. Fan, B. Xu and B. Yang, Mater. Lett., 2023, 337, 133979 CrossRef CAS.
- S. Niroomand, A. Jahanara, Sh. Jahani, G. Sargazi, B. O. Patrick and M. Noroozifar, J. Photochem. Photobiol., A, 2023, 441, 114711 CrossRef CAS.
- Z. Wang, C. Chen, H. Liu, D. Hrynshpan, T. Savitskaya, J. Chen and J. Chen, Sci. Total Environ., 2020, 708, 135063 CrossRef CAS PubMed.
- J. D. Lin, M. Z. Lin, C. C. Jia, Z. H. Li and S. W. Du, Inorg. Chem. Commun., 2009, 12, 487 CrossRef CAS.
- D. Chen, Q. Wang, Y. Li, Y. Li, H. Zhou and Y. Fan, Chemosphere, 2020, 247, 125869 CrossRef CAS PubMed.
- A. E. Owen, H. Louis, E. C. Agwamba, A. D. Udoikono and A. L. E. Manicum, J. Mol. Struct., 2023, 1273, 134233 CrossRef CAS.
- P. S. Idante, G. C. Apebende, H. Louis, I. Benjamin, U. J. Undiandeye and I. J. Ikot, J. Indian Chem. Soc., 2023, 100, 100806 CrossRef CAS.
- B. Kharpan, S. Paul, A. Shyam, P. C. Paul, S. Choudhury and P. Mondal, J. Mol. Struct., 2023, 1291, 135968 CrossRef CAS.
- H. Louis, G. J. Ogunwale, E. C. Agwamba, T. O. Unimuke, E. F. Ahuekwe and A. S. Adeyinka, J. Mol. Struct., 2023, 1279, 134978 CrossRef CAS.
- A. D. Udoikono, E. C. Agwamba, H. Louis, I. Benjamin, I. Ahmad, E. U. Ejiofor, E. F. Ahuekwe, K. Chukwuemeka, A. S. Adeyinka, H. M. Patel, A. L. Manicum and M. Edim, J. Biomol. Struct. Dyn., 2022 DOI:10.1080/07391102.2022.2153414.
- W. Emori, G. J. Ogunwale, H. Louis, E. C. Agwamba, K. Wei, T. O. Unimuke, C. R. Cheng, E. U. Ejiofor, F. C. Asogwa and A. S. Adeyinka, J. Mol. Struct., 2022, 1265, 133318 CrossRef CAS.
- Sh. Jahani, Z. Aramesh-Boroujeni and M. Noroozifar, J. Trace Elem. Med. Biol., 2021, 68, 126821 CrossRef CAS PubMed.
- W. Huang, J. Xia, X. Wang, Q. Zhao, M. Zhang and X. Zhang, Food Control, 2023, 153, 109963 CrossRef CAS.
- D. Krishnan and A. Sheela, Results Chem., 2023, 5, 100732 CrossRef CAS.
- Y. Wang, L. Yang, J. Xu, F. Xin and L. Jiang, Curr. Opin. Food Sci., 2023, 53, 101074 CrossRef CAS.
- F. Tuncel Elmali, J. Mol. Struct., 2022, 1261, 132900 CrossRef.
- Y. Wang, C. Li, B. Shen, L. Zhu, Y. Zhang and L. Jiang, Chem. Eng. J., 2023, 466, 143292 CrossRef CAS.
- H. Unver, B. Boyacioglu, C. T. Zeyrek, M. Yildiz, N. Demir, N. Yildirim, O. Karaosmanoglu, H. Sivas and A. Elmali, J. Mol. Struct., 2016, 1125, 162 CrossRef CAS.
- X. Wang, P. Zhang, Q. Xu, C. Guo, D. Zhang, C. Lu and R. Liu, J. Am. Chem. Soc., 2021, 143, 15005 CrossRef CAS.
- A. Singh, N. Singh and D. S. Pandey, J. Organomet. Chem., 2002, 642, 48–57 CrossRef CAS.
- P. J. Hay and W. R. Wadt, J. Chem. Phys., 1985, 82, 270–283 CrossRef CAS.
- U. D. Izuchukwu, F. C. Asogwa, H. Louis, E. F. Uchenna, T. E. Gber, U. M. Chinasa, N. J. Chinedum, B. O. Eze, A. S. Adeyinka and O. U. Chris, J. Mol. Struct., 2022, 1269, 133796 CrossRef CAS.
- W. R. Wadt and P. J. Hay, J. Chem. Phys., 1985, 82, 284–298 CrossRef CAS.
- F. S. Patrick-Inezi, W. Emori, H. Louis, C. G. Apebende, E. C. Agwamba, T. O. Unimuke, K. Wei, C. R. Cheng, V. M. Bassey, T. G. C. Egemonye, P. S. Idante, E. I. Ekeng-ita and J. A. Agwupuye, Health Care Anal., 2022, 2, 100030 Search PubMed.
- J. K. Barton, A. T. Danishefsky and J. M. Goldberg, J. Am. Chem. Soc., 1984, 106, 2172 CrossRef CAS.
- M. Chandra, A. N. Sahay, D. S. Pandey, R. P. Tripathi, J. K. Saxena, V. J. M. Reddy, M. C. Puerta and P. Valerga, J. Organomet. Chem., 2004, 689, 2256–2267 CrossRef CAS.
- H. A. Hussain and K. Iftikhar, Spectrochim. Acta, Part A, 2003, 59, 1061–1074 CrossRef CAS PubMed.
- S. Kashanian, M. B. Gholivand, F. Ahmadia, A. Taravati and A. H. Colagar, Spectrochim. Acta, Part A, 2007, 67, 472–478 CrossRef CAS PubMed.
- M. T. Carter and A. J. Bard, J. Am. Chem. Soc., 1987, 109, 7528 CrossRef CAS.
- X. Chu, G. L. Shen and J. H. Jiang, Anal. Chim. Acta, 1988, 373, 29 CrossRef.
- Z. Li, H. Yan, G. Chang, M. Hong, J. Dou and M. Niu, J. Photochem. Photobiol., B, 2016, 163, 403 CrossRef CAS PubMed.
- D. Jacquemin, E. A. Perpete, G. E. Scuseria, I. Ciofini and C. Adamo, J. Chem. Theory Comput., 2008, 4, 123 CrossRef CAS PubMed.
- X. M. Liu, J. Li and H. Li, J. Inorg. Biochem., 2005, 99, 2372 CrossRef CAS PubMed.
- N. Kurita and K. Kobayashi, Comput. Chem., 2000, 24, 351 CrossRef CAS PubMed.
| This journal is © The Royal Society of Chemistry 2023 |

