DOI:
10.1039/D3RA04202B
(Paper)
RSC Adv., 2023,
13, 26102-26110
Ni3V2O8 nanoflower mimetic enzyme constructs a dual-signal system for ascorbic acid detection
Received
22nd June 2023
, Accepted 24th August 2023
First published on 1st September 2023
Abstract
Ascorbic acid is a nutritional small molecule essential to human life activities and health, playing a vital role in many physiological processes. Fresh fruits and beverages can provide abundant AA to maintain human metabolic balance. Therefore, it is of great significance to develop a nanomaterial with superior nanozyme activity for rapid and convenient detection of ascorbic acid (AA) in fruits and beverages. Herein, a dual-signal sensing platform based on UV-vis absorption and test strip chromaticity for the quantitative determination of AA is presented. The sensing platform is based on the horseradish peroxidase-like activity of Ni3V2O8 nanoflowers, which catalyzes the oxidation of 3,3′,5,5′-tetramethylbenzidine (TMB) by hydrogen peroxide to the blue oxide TMB (ox TMB). The ox TMB produced by the oxidation has a characteristic absorption peak at 650 nm. In the presence of AA, the blue ox TMB is reduced to colorless TMB, and the quantitative detection of AA can be achieved by detecting the decrease in intensity of the absorption peak by UV-Vis spectrophotometry. Under the optimal experimental conditions, the sensing platform exhibited excellent sensitivity and selectivity. A wide linear range of 0.1 μM to 40 μM with a detection limit of 0.032 μM was obtained. The linear equation is ΔA = 0.02513c + 0.1164 with a correlation coefficient of 0.9979. It showed excellent properties in the detection of real samples of fruit juices and beverages, meanwhile, a method for the rapid detection of AA based on chromaticity change of test strips was constructed with high sensitivity and convenience. The linearity range for the ascorbic acid was 1–50 μM with LOD of 0.42 μM. The developed sensing platform has the capability to quickly and accurately detect ascorbic acid (AA) in fresh fruits and beverages. This proposed method offers a new and promising approach for the rapid and cost-effective detection of ascorbic acid, which has a wide range of potential applications.
Introduction
Ascorbic acid (AA), also known as vitamin C, is found in a wide variety of fruits and vegetables1 and is one of the most abundant biological small molecules in the human body. In addition to its antioxidant properties, it is an important neuromodulator. It is an essential small molecule nutrient for human life and body health, and plays a crucial role in many physiological processes.2 The World Health Organization recommends 45 mg of ascorbic acid per day or 300 mg per week. Normal levels of ascorbic acid in human blood and urine are approximately 2–14 mg L−1. The human body cannot synthesize ascorbic acid so it must be supplemented by regular intake to help.3,4 Therefore, the analysis of ascorbic acid levels in foods is of great significance. Currently, the detection and analysis methods for AA mainly include: titrimetric analysis,5 spectrophotometric methods,6,7 high performance liquid chromatography (HPLC)8,9 and ultra performance liquid chromatography (UPLC)10 and electrochemical methods.11,12 Although these methods are highly sensitive and reliable for the accurate determination of AA, the expensive instruments, specialized operators, and complicated pre-treatment processes have severely limited the widespread development of instrumental methods in practical applications. To overcome these limitations, it is essential to develop a simple, rapid and in situ technique for the sensitive and selective detection of AA.13 The colorimetric method has clear advantages in practical applications as it allows for an intuitive and rapid indication of the target analyte concentration through color reactions.14 The paper strip analysis method based on the colorimetric method has the advantages of lower test dose, convenient portability and simple operation, and can realize the rapid and efficient detection of target objects.15
Enzymes are substances that lower the activation energy of a reaction, thereby influencing the reaction rate. They play a crucial role in the functioning of living organisms. Natural enzymes are highly efficient and specific. However, they are susceptible to external factors that can lead to denature. In recent years, some nanomaterials with similar activity to natural enzymes have attracted attention. These nanomaterials exhibit greater stability than natural enzymes across a wide range of temperature and pH conditions. Nanomaterials that possess similar activity to natural enzymes are referred to as mimetic enzymes. These advantages such as lower cost, good stability, good catalytic effect, reproducibility, availability for further modification, larger surface area and better reaction rate make mimetic enzymes an emerging hot material in environmental chemistry and biomedicine, etc. Horseradish peroxidase (HRP) is capable of oxidizing a variety of reaction substrates in the presence of H2O2. HRP is generally immobilized on the dielectric material to provide effective electron transfer between HRP and the substrate, which greatly increases the sensitivity of the biosensor while also reducing the detection limit. Researchers are now focusing their attention on mimicking horseradish peroxidase-mimicking enzymes, and a variety of HRP-mimicking materials have been synthesized for the detection of glucose,16 cysteine,17 alkaline phosphatase,18 and others. However, the activity of existing catalysts needs to be further improved, so the development of novel nanomimetic enzymes is crucial. Various metal oxides have been developed for the detection of organics.19 Current research focus on the development of new materials. Recently, various mixed metal oxides have been explored to synergistically enhance the peroxidase-like activity.20,21 Three-dimensional (3D) nanoflowers catalytic materials have been shown to be rich in active sites on a large surface area for radical adsorption, which greatly enhances the catalytic capacity.22,23 Yang developed a simple one-step hydrothermal method to synthesize Ni3V2O8 nanoflowers, which exhibited excellent electrochemical performance as an anode material for Li-ion batteries (LIBs).24 These results provide an impetus to develop a rapid and low-cost sensing platform by using the Ni3V2O8 nanoflowers with excellent catalytic activity as the sensing probe. However, the preparation of 3D nanomimetic enzymes to serve as nanozyme for AA detection has not been reported much.
In this study, three-dimensional Ni3V2O8 nanoflowers were synthesized. The materials possess horseradish peroxidase activity and can oxidize TMB in the presence of H2O2. While ascorbic acid can reduce the blue oxidized TMB (ox TMB) to colorless TMB. Thus, quantitative detection of ascorbic acid can be achieved. Based on the peroxidase-like nature of the material, a UV-Vis spectrophotometer and a dual-channel colorimetric test trip-smartphone method were constructed for the detection of AA. This study provides a new strategy for the rapid and efficient detection of AA. The preparation process of Ni3V2O8 and the principle of ascorbic acid detection are shown in Scheme 1.
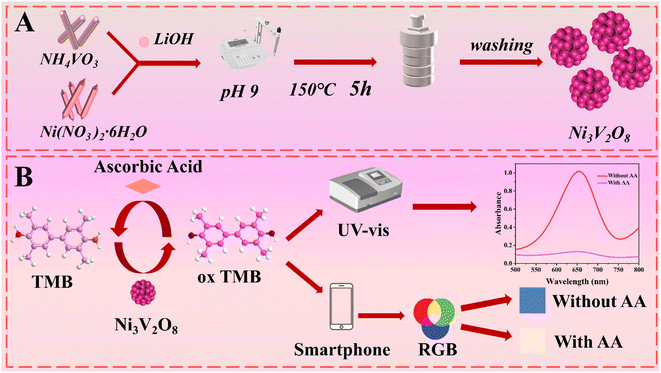 |
| | Scheme 1 (A) Schematic diagram of the preparation process of Ni3V2O8 and (B) principle of ascorbic acid detection. | |
Experimental section
Reagents and apparatus
Chemical reagents and drugs were used directly without purification. Nickel(II) nitrate hexahydrate (Ni(NO)3·6H2O), orthoboric acid (H3BO3), calcium chloride (CaCl2), cupric chloride (CuCl2), magnesium chloride (MgCl2), sodium chloride (NaCl), sodium citrate (C6H5Na3O7) and ethanol (C2H5OH)were purchased from Tianjin Fengchuan Chemical Reagent Co., Ltd (Tianjin, China). Chitosan was purchased from Sigma-Aldrich (USA). Diammonium 2,2′-azino-bis(3-ethylbenzothiazoline-6-sulfonate) (ABTS), o-phenylenediamine (OPD), 3,3′,5,5′-tetramethylbenzidine (TMB), ascorbic acid (C6H8O6), lithium hydroxide (LiOH), ammonium metavanadate (NH4VO3) and poly(vinyl alcohol) (PVA) were obtained from Ron Reagent Ltd (Shanghai, China). Sodium phosphate, dibasic (Na2HPO4), zinc chloride (ZnCl2), ferric chloride (FeCl3) and sucrose (C12H22O11) were bought from Xilong Scientific Co., Ltd (Guangdong, China). L(+)-Tartaric acid (C4H6O6) was purchased from Shanghai Yuanye Bio-Technology Co., Ltd (Shanghai, China). 2-Amino-2-phenylacetic acid (C8H9NO2) was bought from Shanghai Adamas Reagent Co., Ltd (Shanghai, China). L-Phenylalanine (C9H11NO2), L-isoleucine (C9H13NO2), glycine (C2H5NO2), L-threonine (C4H9NO2) and N-[(tert-butoxy) carbonyl]-D-tryptophan (C12H12N2O2) were obtained from Shanghai Aladdin Biochemical Technology Co., Ltd (Shanghai, China). The ascorbic acid ELISA kit was purchased from Jiangsu Feiya Biotechnology Co., Ltd (Yancheng, China).
Scanning electron microscopy (SEM) images were obtained using an FEI emission scanning electron microscope (SU8020, Hitachi, Japan). UV-vis absorption spectra were recorded using an UV 2700 spectrometer (Shimadzu, Japan). X-ray photoelectron spectroscopy (XPS) measurements were performed using a EscaLab 250Xi diffractometer (Thermo Fisher Scientific, America). The diffraction of X-ray diffraction (XRD) spectra were collected on a D/MAX-TTRIII (Rigaku, Japan).
Synthesis of Ni3V2O8 nanoflowers
Ni3V2O8 was synthesized following the previous literature.22 As shown in Scheme 1 A, 5.25 mmol of NH4VO3 was dissolved in 80 mL of deionized water and heat the water was heated to 80 °C. Then, 1.05 mmol of Ni (NO3)2·6H2O was added and stirred to the above solution. Next, the pH of the solution was adjusted to about 9 with LiOH and stirred for 10 min. This mixture was transferred to a stainless-steel autoclave with 100 mL-capacity Teflon liner. The autoclave was then sealed and kept in an oven at 150 °C for 5 h. Then, centrifugation was performed to collect the precipitates, following by washing three times with distilled water and absolute ethanol and then vacuum drying in an oven overnight to obtain Ni3V2O8 nanoflowers.
Preparation of test strip
This kind of test strip was prepared by infiltrating the filter paper strips into the mixed solution containing Ni3V2O8. Specifically, 1% polyvinyl alcohol (PVA) and 2% chitosan (CHI) were dissolved in 5 mL sodium acetate buffer solution and heated at 100 °C for 1 h. The solution was then slowly cooled to room temperature. Then, 1 mg mL−1 Ni3V2O8, 500 μL sodium acetate buffer and 500 μL TMB solution were added to the above solution. The model 102 filter paper was immersed in the solution for 2 hours. Next, filter paper was token out and dried for 12 hours. The dried test paper was cut into 1 × 1 cm squares and stored in a cool, dark place.
The detection method of AA
As shown in Scheme 1B, based on the excellent horseradish peroxidase-like performance of Ni3V2O8, AA was detected by UV-Vis absorbance spectra and test strip.
For the UV-Vis spectra detection method, ascorbic acid was detected under the optimized conditions. Briefly, 5 μL of 1 mg mL−1 Ni3V2O8, 10 μL of 10 mM TMB and 5 μL of 5 mM H2O2 were added to 160 μL of Na2HPO4–C6H8O7 buffer solution (pH 4.0) to react in dark for 10 min. The color of TMB changed to blue. Then, after adding various amounts of AA to the system, the absorbance was measured at 652 nm.
For the test strip detection method, prior to the ascorbic acid measurements, the obtained Ni3V2O8 paper strips were cut into 1 × 1 cm squares and placed in the white PVC background plate. Different concentrations of AA solution were then dropped onto the small squares. The rapid color change of the small squares can be observed with the naked eye under ambient conditions, and the color photos were scanned by a smartphone equipped with a Fawn eyedropper APP. In this way, the sum of R + G + B (RGB color model) for each specific color can be quickly calculated, and the concentration of AA can be quickly obtained by using the calculator in the smartphone.
Results and discussion
X-ray diffraction (XRD) characterization of Ni3V2O8
In this experiment, Ni3V2O8 nanomaterial was characterized by XRD. As shown in Fig. 1, the peaks in the standing state for the 2 θ values of 15.5, 35.4, 43.4, 57.5, 62.1 and 64.9 were recorded as the (020), (132), (133), (260), (262) and (420) planes, respectively, which were in good agreement with the card PDF #70-1394 (red vertical line) and ref. 24 confirming the formation of Ni3V2O8. Further, according to ref. 25 and 26, the average crystallite size could be calculated using the Debye–Scherrer formula (eqn (1)) from the obtained crystallographic planes, and the calculated average crystalline size from eqn (1) was found to be 3.7 nm. In eqn (1), D corresponds to the crystallite size, the X-ray wavelength (λ = 1.5406 Å), β is the full width at half maximum half (FWHM) of the more intense peak, and the Bragg diffraction angle is represented by θ.| |
D = 0.9λ(β![[thin space (1/6-em)]](https://www.rsc.org/images/entities/char_2009.gif) cos cos![[thin space (1/6-em)]](https://www.rsc.org/images/entities/char_2009.gif) θ) θ)
| (1) |
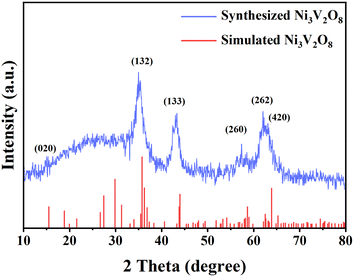 |
| | Fig. 1 XRD pattern of Ni3V2O8 (red: simulated,24 blue: synthesized in this experiment). | |
Microstructure characterization of Ni3V2O8
The morphology of Ni3V2O8 was characterized by scanning electron microscopy (Fig. 2). The SEM images showed that Ni3V2O8 forms a large number of nanoflowers structures. The nanoflower structure of Ni3V2O8 with about 100 nm diameter were shown on Fig. 2. The large surface area of the 3D nanoflowers has abundant free radical adsorption active sites, which provides the structural basis for the high catalytic capacity of the materials.
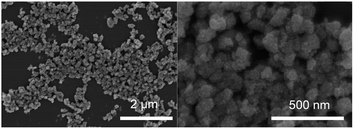 |
| | Fig. 2 Scanning electron microscope (SEM) images of Ni3V2O8 with different magnifications. | |
X-ray photoelectron spectroscopy (XPS) of Ni3V2O8
In this experiment, the XPS of Ni3V2O8 was further determined. As shown in Fig. 3A, the presence of Ni, V, and O elements in Ni3V2O8 is evident. The peaks of nickel ions Ni 2p1/2 and Ni 2p3/2 were observed in the XPS spectrum of Ni 2p (Fig. 3B). The partial peak fitting of the Ni 2p1/2 and Ni 2p3/2 regions revealed that they contain Ni2+ (855.7 eV and 873.4 eV) and Ni3+(857.1 eV and 875.1 eV). For the V 2p spectrum (Fig. 3C), it is also possible to fit to two chemical states of element V, V4+ (515.7 eV and 523.2 eV) and V5+ (516.8 eV and 524.3 eV), respectively. The mixed valence state of Ni and V may promote more redox reactions in the process. In addition, the C 1s spectrum (Fig. 3D) was split into four peaks, C![[double bond, length as m-dash]](https://www.rsc.org/images/entities/char_e001.gif) C (284.8 eV), C–O (285.8 eV), C
C (284.8 eV), C–O (285.8 eV), C![[double bond, length as m-dash]](https://www.rsc.org/images/entities/char_e001.gif) O (288.1 eV) and O
O (288.1 eV) and O![[double bond, length as m-dash]](https://www.rsc.org/images/entities/char_e001.gif) C–O (289.1 eV), respectively.
C–O (289.1 eV), respectively.
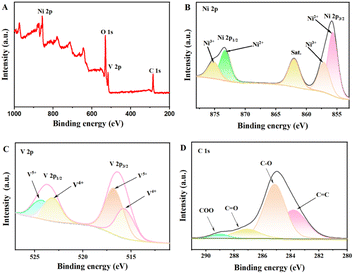 |
| | Fig. 3 XPS spectrum of Ni3V2O8: (A) full spectrum; high resolution spectrum of Ni 2p (B), V 2p (C) and C 1s (D). | |
Steady-state kinetics evaluation and peroxidase-like activity analysis of Ni3V2O8
The peroxidase-like activity of Ni3V2O8 has been investigated. In the presence of H2O2, common peroxidase chromogenic substrates, such as ABTS, OPD, and TMB, can be catalytically oxidized by Ni3V2O8 to form blue-green, orange, and blue products, respectively. The products had characteristic absorption peaks at 420, 450, and 652 nm in the UV-Vis spectrum (Fig. 4), indicating that Ni3V2O8 has peroxidase-like catalytic activity. In addition, TMB and OPD can produce more perfect absorption peaks. However, OPD is highly toxic, which is not conducive to laboratory safety, while TMB has higher sensitivity, better color product purity, reasonable stability and lower carcinogenicity. Therefore, TMB was chosen as the chromogenic substrate for mimetic enzyme Ni3V2O8 in this work.
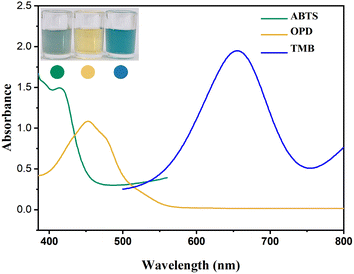 |
| | Fig. 4 Absorption curves of Ni3V2O8 mimetic enzyme for different chromogenic substrates. | |
For the steady-state dynamics of TMB, the concentration of H2O2 is fixed (0.25 mM) and the concentration of TMB is varied from 0.015 mM to 0.3 mM. Similarly, for the steady-state dynamics of H2O2, the concentration of TMB is fixed (0.5 mM) and the concentration of H2O2 is varied from 0.01 mM to 0.25 mM. The UV-vis absorption curves of various concentrations of TMB and H2O2 are shown in Fig. 5A and D. Fig. 5B and E shows the standard Michaelis–Menten curves for TMB and H2O2, which were obtained by plotting a graph between the initial reaction rate versus concentration. For greater accuracy, the Lineweaver–Burk plot (Fig. 5C and F) can be used to calculate the Michaelis–Menten constant (Km) and the maximal reaction velocity (Vmax), and the results are presented in Table 1. Km is often used as a measure of affinity of an enzyme to its substrate. The higher the affinity between the catalysts and the substrate, the lower the Km. Table 1 illustrates that Ni3V2O8 has a substantially lower Km value with TMB and H2O2 than other mimetic enzymes and the natural enzyme HRP, indicating that Ni3V2O8 has a much better affinity for two substrates than other mimetic enzymes and HRP.
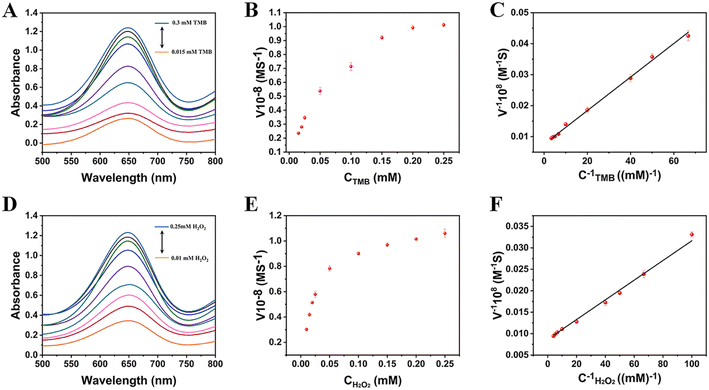 |
| | Fig. 5 Steady-state kinetic analysis of Ni3V2O8 (the concentrations of TMB varied from 0.015 to 0.3 mM with a fixed amount of H2O2 (0.25 mM) (A–C) and the concentrations of H2O2 varied from 0.01 to 0.25 mM with a fixed amount of TMB (0.5 mM) (D–F). (C) and (F) is corresponding double reciprocal curves for TMB and H2O2. Error bars represent the standard deviation for three measurements). | |
Table 1 Comparison of kinetic parameters of different nanozymes
| Catalyst |
Km (TMB), mM |
Vmax (TMB) (10−8 M s−1) |
Km (H2O2), mM |
Vmax (H2O2) (10−8 M s−1) |
Reference |
| Fe3O4@C/Ni NW |
0.10 |
3.90 |
0.059 |
3.62 |
27 |
| Pd nanostructures |
0.16 |
201 |
1064 |
443 |
28 |
| α-Fe2O3/Fe3O4 |
0.23 |
5.52 |
2.85 |
3.87 |
29 |
| Co9S8 |
1.64 |
99.0 |
7.39 |
35.0 |
30 |
| Por-NiCo2S4 |
0.3 |
34.86 |
4.5 |
4.32 |
31 |
| HRP |
0.434 |
10.0 |
3.7 |
8.71 |
32 |
| Ni3V2O8 |
0.0714 |
131.91 |
0.0263 |
115.00 |
This work |
Experimental feasibility analysis
To verify the feasibility of the experimental design, the catalytic oxidation capacity to TMB of Ni3V2O8 in the presence of H2O2 was investigated (Fig. 6). When only TMB and H2O2 were added, the absorbance of the system at 652 nm was 0.048, which can be ignored. When only TMB and Ni3V2O8 were added, the absorbance of the system at 652 nm was 0.366. When TMB, Ni3V2O8 and H2O2 were added, the absorbance of the system at 652 nm was 1.280, indicating that Ni3V2O8 material has good properties of horseradish peroxide simulating enzyme. After adding TMB and Ni3V2O8 materials for color reaction with H2O2 for 10 min, the absorbance of the sensing platform at 652 nm with AA is only 0.80, indicating that AA can reduce ox TMB. The higher the concentration of AA, the more TMB has been reduced, the lower the absorbance of the system. Therefore, the concentration of AA can be measured indirectly. This analysis shows that the proposed scheme is reasonable and feasible.
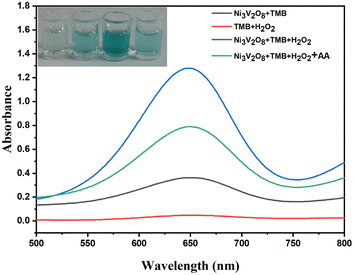 |
| | Fig. 6 Experimental feasibility analysis. | |
Optimization of the experimental conditions
The effect of the concentration of Ni3V2O8, buffer type, pH and the reaction time on the catalytic activity of Ni3V2O8 were investigated. The influence of different concentrations of Ni3V2O8 on the difference of absorbance values is shown in Fig. 7A, with the increase of Ni3V2O8 concentration, the difference of absorbance ΔA (ΔA = AX − A0, where AX and A0 are the absorbance of the system at 652 nm in the presence and absence of AA respectively) increases. When the mass concentration of Ni3V2O8 reached 25 μg mL−1, the activity of the peroxidase-like enzyme reached the highest level. This finding could be mainly due to the limitation of dissolved oxygen and hydrogen peroxide concentration in the system. The catalytic activity of Ni3V2O8 in C2H5NO2–HCl, C6H5Na3O7–C6H8O5, NaAc–HAc, Na2HPO4–C6H8O7, C8H6O4–HCl buffer solution were also investigated (Fig. 7B). Among the five buffers, the value of ΔA was the highest in the Na2HPO4–C6H8O7 buffer. Therefore, in this experiment, disodium phosphate citrate buffer was selected as the best buffer for the sensing platform. Catalytic studies in buffer solutions were studied in the pH range of 3.0–8.0 to find the optimum pH. As shown in Fig. 7C, the catalytic activity increased initially as the pH rises from 3.0 to 4.0, but then decreased as the pH increased further. This can be attributed to the decomposition of H2O2 at a high Ph,33 resulting in a reduction in its oxidation activity towards TMB. Therefore, pH 4.0 was chosen as the optimal pH of the buffer solution. The effect of reaction times on the difference of absorbance values was shown in Fig. 7D. It can be seen that with the increase of the color development reaction time, the difference of the absorbance values showed a trend of first increasing and then slowly decreasing, and the difference of the absorbance values reached the maximum at 5 min. Therefore, 5 min was selected as the optimal color development reaction time. It can be concluded that Ni3V2O8 had high catalytic activity under the optimum conditions of Ni3V2O8 25 μg mL−1, Na2HPO4–C6H8O7 buffer pH 4.0, and 5 min of reaction time.
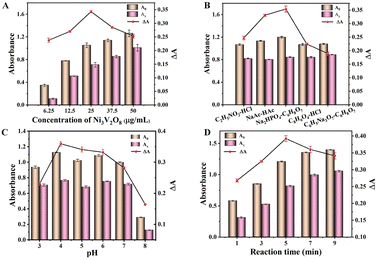 |
| | Fig. 7 Influences of (A) concentration of Ni3V2O8 (6.25–50 μg mL−1), (B) buffer of the reaction system, (C) pH of the reaction system (3–8), and (D) time (1–9 min) for absorbance values. | |
Calibration curve of the UV-vis sensing platform for AA
The absorbance of the system was determined under optimum conditions with AA in the concentrations range of 0.0–40 μM. As shown in Fig. 8A, the absorbance intensity reduced at 652 nm decreased with increasing AA. A linear relationship was established between the absorbance difference and the concentration of AA in the range of 0.1–40 μM, with the linear equation of Y = 0.02513X + 0.1164, with a linear correlation coefficient of 0.9979, as shown in Fig. 8B. The LOD of AA was calculated to be 0.032 μM at 3σ.
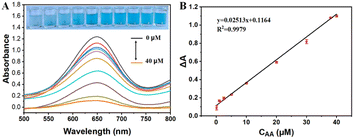 |
| | Fig. 8 The UV-vis absorption curves of different concentrations of AA (A) and calibration curve (B). | |
Calibration curve of test strip for AA
As shown in Fig. 9A, the Ni3V2O8 test strips were sensitive response to the solutions containing different concentrations of AA. The R + G + B value of each color was then calculated and correlated with the concentrations of AA (Fig. 9B). As a result, a calibration curve of R + G + B was obtained in the range of AA concentrations from 1 to 50 μM, with the linear equation of Y = 3.872X + 397.3 with a linear correlation coefficient of 0.9908. The LOD for AA was calculated to be 0.42 μM at 3σ. Thus, in combination with a smartphone, portable, economical, and visual test strips have been developed for the detection of AA in situ.
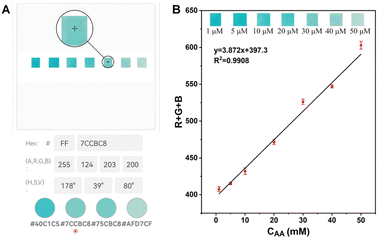 |
| | Fig. 9 (A) Schematic diagram of recognition RGB by Fawn eyedropper; (B) RGB calibration curve of the test strip. | |
Furthermore, as shown in Table 2, compared to other reported AA detection systems, the constructed sensing platform has a wide linear range and a lower detection limit. This may be attributed to the good catalytic effect of the Ni3V2O8 material. Therefore, the established colorimetric sensor has the potential for practical sample analysis.
Table 2 Comparison of the different AA detection methods
| Analytical method |
Material |
Linear range |
LOD |
Reference |
| Electrochemistry |
CaCO3 |
12–500 μM |
10.8 μM |
34 |
| Electrochemistry |
PPYNTs/Co3O4 |
5–80 μM |
0.23 μM |
35 |
| Fluorometry |
LDH-GQD |
5–300 μM |
1.73 μM |
36 |
| Fluorometry |
SGQDs-MnO2 |
0.5–20 μM |
0.16 μM |
37 |
| Colorimetry |
Fe–Mn |
8–56 μM |
0.88 μM |
38 |
| Colorimetry |
MIL-88 |
2.57–10.10 μM |
1.03 μM |
39 |
| Colorimetry |
Mn@Co3O4NSs |
1–8 μM |
0.4 μM |
40 |
| Colorimetry |
Ni3V2O8 |
0.1–40 μM |
0.03182 μM |
This work |
| RGB |
Ni3V2O8 |
1–50 μM |
0.42 μM |
This work |
The selectivity of the sensing platform
A range of biologically disruptive chemicals including a variety of amino acid molecules (L-glycine, L-threonine, tryptophan, glutamate, L-phenylalanine, L-phenylglycine, L-isoleucine, glutathione (GSH), and L-Cys), small molecules (tartaric acid, boric acid, sucrose and glucose) and cations (Na+, K+, Ca2+, Cu2+, Zn2+, Al3+, Ba2+, NH4+, Mg2+) were added to the AA detection system to evaluate the anti-interference ability of the established method in real samples. The concentration of AA was 30 μM, and the concentration of the other substances was 10 times that of AA (300 μM) under the same conditions. After comparison, it was found that the signals of GSH and L-cysteine had a large interference to the experiment, so the scavenger NEM was chosen to remove GSH and L-cysteine (Fig. 10). In subsequent detection experiments, the scavenger was used to eliminate the interference and then the AA content was detected. As shown in Fig. 11, the sensing platform showed good selectivity for AA.
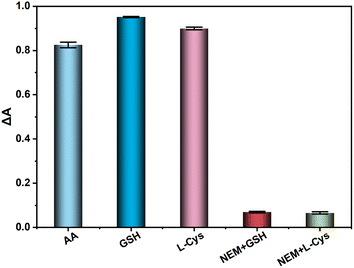 |
| | Fig. 10 Effect of NEM on absorbance of sensing platform. | |
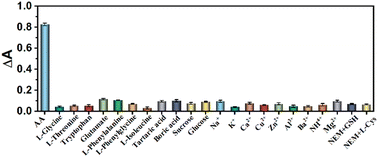 |
| | Fig. 11 The selectivity of the sensing platform (with the addition of the scavenger NEM). | |
Comparison of Ni3V2O8 sensing platform with standard detection method (ELISA)
The results of commercial enzyme immunoassay kits and Ni3V2O8 sensing platform for the determination of AA in tablets and human serum were compared. For the kit, the UV-vis absorbance increased gradually increased of the target AA concentration, and showed a good linear relationship in the range of 2.5–40 μM with the linear equation of Y = 0.04332X + 0.4552 with a linear correlation coefficient of 0.9902, as shown in Fig. 12B. Subsequently, the sensing platform constructed by this work and ELISA kit were used to detect the absorbance of different concentrations of tablets respectively. Each group was tested three times in parallel, and the AA concentration was calculated according to the calibration linearity curve of the system. The results are shown in Table 3. These results indicated that the proposed method for the determination of AA is accurate and can be applied to the assay of real samples.
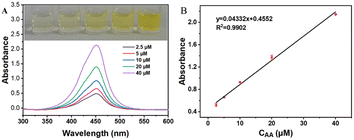 |
| | Fig. 12 (A) UV-vis absorption curves of different concentrations of AA; (B) calibration curve of ELISA. | |
Table 3 Comparison of different detection methods for actual samples (n = 3)a
| Real sample |
VC tablet |
Human serum |
| Relative error (%) = (X − Y)/Y, X is the experimental measurement value, Y is the ELISA measurement value. |
| AA ELISA KITS |
Found (μM) |
18.35 |
18.39 |
18.42 |
7.38 |
7.29 |
7.25 |
| Average (μM) |
18.39 |
7.31 |
| RSD (%) |
0.19 |
0.97 |
| U-V |
Found (μM) |
18.86 |
18.95 |
18.91 |
7.27 |
7.35 |
7.23 |
| Average (μM) |
18.91 |
7.28 |
| RSD (%) |
0.22 |
0.86 |
| Relative error (%) |
2.83 |
−0.41 |
| RGB |
Found (μM) |
19.03 |
18.78 |
18.26 |
7.67 |
8.19 |
7.41 |
| Average (μM) |
18.69 |
7.76 |
| RSD (%) |
2.11 |
5.08 |
| Relative error (%) |
1.63 |
6.12 |
Determination of the actual samples
Practical application is one of the important standards for investigating the application value of sensors. To confirm the feasibility of the sensing platform for practical applications, the sensor was used to detect the AA content in fresh fruit juices and drinks. Five kinds of juice and four kinds of drinks were selected for the experiment: cherry tomatoes, strawberry, orange, longan, kiwi, vita lemonade, green tea, kumquat and yiquan lemonade. In the experiment, all fruit juices and drinks were diluted 10 times for testing. As shown in Fig. 13, the highest AA content in the fruit was kiwi, while in the drinks was vita lemonade. The results show that the sensing platform can be used to detect real samples and has good practical application value.
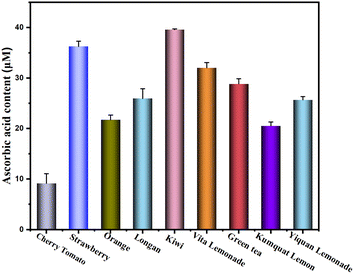 |
| | Fig. 13 Determination of the actual samples. | |
Conclusions
In this work, Ni3V2O8 nanoflowers mimetic enzyme was synthesized, and a sensing platform was constructed for the detection of ascorbic acid (AA) based on the dual signal of UV-vis absorption and chromaticity change of test strips. For the UV-vis spectra detection method, in the range of 0.1–40 μM, the absorbance difference (ΔA) shows a good linear relationship with the AA concentration, and the detection limit is 0.03182 μM. And the constructed test strip assay has the advantage of easy detection of real samples with a lower detection limit of detection of 0.42 μM. In addition, the Ni3V2O8 nanoflowers show an excellent selectivity for 22 different interferents including ions, small molecules, and amino acids commonly found in real samples. Furthermore, the sensing platform was successfully applied to determine of AA content in five fruit juices and four commercial beverages. The proposed detection method has good selectivity and high sensitivity, which can be used for the rapid and low-cost detection of AA in the field. Further, from the results of this study, the sensing platforms especial test strip can be a prominent tool for determining the AA levels in fruit juices and beverages. The work reported in this paper represents only preliminary information, and we are continuing to work on these models in order to bring our sensor based on Ni3V2O8 for real-time detection of AA into commercial use. We are currently working on further optimizing this sensing platforms to make it cost-effective, robust and more accurate.
Conflicts of interest
The authors declare there are no conflicts of interest regarding the publication of this paper.
Acknowledgements
This work was supported by the National Natural Science Foundation of China (Grant No. 21765026).
References
- M. I. Halawa, W. Y. Gao, M. Saqib, S. A. Kitte, F. X. Wu and G. B. Xu, Biosens. Bioelectron., 2017, 95, 8–14 CrossRef CAS PubMed.
- G. N. Y. van Gorkom, E. L. Lookermans, C. Van Elssen and G. M. J. Bos, Nutrients, 2019, 11(5), 977 CrossRef CAS.
- Z. Fatariah, T. Y. T. Zulkhairuazha and W. I. W. Rosli, Int. Food Res. J., 2015, 22(1), 208–212 CAS.
- S. Englard and S. Seifter, Annu. Rev. Nutr., 1986, 6, 365–406 CrossRef CAS.
- C. C. Gras, N. Nemetz, R. Carle and R. M. Schweiggert, Food Chem., 2017, 235, 265–274 CrossRef CAS PubMed.
- Q. J. Lu, X. G. Chen, D. Liu, C. Y. Wu, M. L. Liu, H. T. Li, Y. Y. Zhang and S. Z. Yao, Microchim. Acta, 2019, 186(2), 72 CrossRef PubMed.
- K. H. Xu, H. C. Chen, J. W. Tian, B. Y. Ding, Y. X. Xie, M. M. Qiang and B. Tang, Chem. Commun., 2011, 47(33), 9468–9470 RSC.
- W. A. Behrens and R. Madere, Anal. Biochem., 1987, 165(1), 102–107 CrossRef CAS PubMed.
- M. Bassi, G. Lubes, F. Bianchi, S. Agnolet, F. Ciesa, K. Brunner, W. Guerra, P. Robatscher and M. Oberhuber, Int. J. Food Prop., 2018, 20, S2626–S2634 CrossRef.
- J. S. Pizzo, V. H. M. Cruz, C. A. Rodrigues, L. P. Manin, L. Visentainer, O. O. Santos, L. Maldaner and J. V. Visentainer, Int. J. Cosmet. Sci., 2022, 44(1), 131–141 CrossRef CAS PubMed.
- A. A. Franke, L. J. Custer, C. Arakaki and S. P. Murphy, J. Food Compos. Anal., 2004, 17(1), 1–35 CrossRef CAS.
- P. Singh, K. R. Singh, J. Singh, P. Prasad and R. P. Singh, RSC Adv., 2021, 11, 25752–25763 RSC.
- Z. F. Yin and H. L. Zou, J. Electr. Eng., 2018, 69(1), 72–78 Search PubMed.
- Y. Q. Ding, J. F. Zhao, B. Li, X. Zhao, C. Wang, M. H. Guo and Y. Q. Lin, Microchim. Acta, 2018, 185(2), 131 CrossRef PubMed.
- Z. H. Li, Y. Wang, J. Wang, Z. W. Tang, J. G. Pounds and Y. H. Lin, Anal. Chem., 2010, 82(16), 7008–7014 CrossRef CAS PubMed.
- A. H. Liang, Y. X. Zhao, X. F. Huang and Z. L. Jiang, Spectrochim. Acta, Part A, 2022, 265, 120376 CrossRef CAS PubMed.
- D. P. Xu, S. Y. Qi, Y. L. Li, X. X. Wei, S. H. Gong, F. K. Wang, Y. W. Zhu, Y. Liu and J. X. Qiu, J. Mol. Struct., 2022, 1267, 133593 CrossRef CAS.
- H. Y. Chen, Z. L. Zhou, Q. J. Lu, C. Y. Wu, M. L. Liu, Y. Y. Zhang and S. Z. Yao, Anal. Chim. Acta, 2019, 1051, 160–168 CrossRef CAS PubMed.
- P. Singh, K. R. B. Singh, R. Verma, P. Prasad, R. Verma, S. N. Das, J. Singh and R. P. Singh, New J. Chem., 2022, 46(18), 8805–8816 RSC.
- C. Chen, Y. Wang, D. Zhang and J. Wang, J. Ind. Eng. Chem., 2022, 105, 291–302 CrossRef CAS.
- Y. Wang, Y. Ding, Y. Tan, X. Liu, L. Fu and W. Qing, J. Environ. Chem. Eng., 2023, 11(1), 109150 CrossRef CAS.
- N. K. Dega, A. B. Ganganboina, H. L. Tran, E. P. Kuncoro and R. A. Doong, Talanta, 2022, 237, 122957 CrossRef CAS PubMed.
- H. F. Wang, W. X. Chen, Q. Y. Chen, N. Liu, H. J. Cheng and T. Li, J. Electroanal. Chem., 2021, 897, 115603 CrossRef CAS.
- Y. Li, L. B. Kong, M. C. Liu, W. B. Zhang and L. Kang, Mater. Lett., 2017, 186, 289–292 CrossRef CAS.
- J. Singh, K. R. B. Singh, M. Kumar, R. Verma, R. Verma, P. Malik, S. Srivastava, R. P. Singh and D. Kumar, Mater. Adv., 2021, 2(20), 6665–6675 RSC.
- P. Singh, K. R. B. Singh, R. Verma, J. Singh and R. P. Singh, Mater. Lett., 2022, 307, 131053 CrossRef CAS.
- H. Peng, J. Zhang, C. Zeng, C. Zhou, Q. Li, N. Lu and L. Wang, ACS Appl. Bio Mater., 2020, 3(8), 5111–5119 CrossRef CAS PubMed.
- Y. Li, S. J. Li, M. Bao, L. Q. Zhang, C. Carraro, R. Maboudian, A. R. Liu, W. Wei, Y. J. Zhang and S. Q. Liu, ACS Appl. Nano Mater., 2021, 4(9), 9132–9142 CrossRef CAS.
- Y. N. Zheng, D. P. Xu, L. X. Sun, J. R. Ji, J. H. Sun, Z. F. Tong, L. Y. Qin, Y. Q. Zhang, J. X. Luo and D. K. Liao, Colloids Surf., A, 2022, 648, 129046 CrossRef CAS.
- Q. Y. Liu, P. P. Chen, Z. Xu, M. M. Chen, Y. A. Ding, K. Yue and J. Xu, Sens. Actuators, B, 2017, 251, 339–348 CrossRef CAS.
- Y. L. He, N. Li, W. K. Li, X. X. Zhang, X. Zhang, Z. X. Liu and Q. Y. Liu, Sens. Actuators, B, 2021, 326, 128850 CrossRef CAS.
- L. Gao, J. Zhuang, L. Nie, J. Zhang, Y. Zhang, N. Gu, T. Wang, J. Feng, D. Yang, S. Perrett and X. Yan, Nat. Nanotechnol., 2007, 2(9), 577–583 CrossRef CAS PubMed.
- J. Y. Chen, Y. Shu, H. L. Li, Q. Xu and X. Y. Hu, Talanta, 2018, 189, 254–261 CrossRef CAS PubMed.
- G. Deffo, M. Basumatary, N. Hussain, R. Hazarika, S. Kalita, E. Njanja and P. Puzari, Mater. Today Commun., 2022, 33, 104357 CrossRef CAS.
- H. Ganesha, S. Veeresh, Y. S. Nagaraju, D. S. Suresh and H. Devendrappa, Inorg. Chem. Commun., 2022, 145, 109975 CrossRef CAS.
- H. Shi, L. Chen and N. Niu, Sens. Actuators, B, 2021, 345, 130353 CrossRef CAS.
- W. D. Na, N. Li and X. G. Su, Sens. Actuators, B, 2018, 274, 172–179 CrossRef CAS.
- Y. Han, L. Luo, L. Zhang, Y. Kang, H. Sun, J. Dan, J. Sun, W. Zhang, T. Yue and J. Wang, Lebensm.-Wiss. Technol., 2022, 154, 112821 CrossRef CAS.
- C. Gao, H. Zhu, J. Chen and H. Qiu, Chin. Chem. Lett., 2017, 28(5), 1006–1012 CrossRef CAS.
- R. D. Isho, N. M. Sher Mohammad and K. M. Omer, Anal. Biochem., 2022, 654, 114818 CrossRef CAS PubMed.
Footnote |
| † These authors contributed equally. |
|
| This journal is © The Royal Society of Chemistry 2023 |
Click here to see how this site uses Cookies. View our privacy policy here.  Open Access Article
 *
*

![[thin space (1/6-em)]](https://www.rsc.org/images/entities/char_2009.gif) cos
cos![[thin space (1/6-em)]](https://www.rsc.org/images/entities/char_2009.gif) θ)
θ)

![[double bond, length as m-dash]](https://www.rsc.org/images/entities/char_e001.gif) C (284.8 eV), C–O (285.8 eV), C
C (284.8 eV), C–O (285.8 eV), C![[double bond, length as m-dash]](https://www.rsc.org/images/entities/char_e001.gif) O (288.1 eV) and O
O (288.1 eV) and O![[double bond, length as m-dash]](https://www.rsc.org/images/entities/char_e001.gif) C–O (289.1 eV), respectively.
C–O (289.1 eV), respectively.


