 Open Access Article
New insights into the electrochemical performance of precursor derived Si(Nb)OC composites as anode materials for batteries†
S. S. Lokesh Vendraab,
Gurpreet Singh *b and
Ravi Kumar
 *ac
*ac
aLaboratory for High Performance Ceramics, Department of Metallurgical and Materials Engineering, Indian Institute of Technology-Madras (IIT Madras), Chennai 600036, India. E-mail: nvrk@iitm.ac.in
bDepartment of Mechanical and Nuclear Engineering, Kansas State University Manhattan, KS 66502, USA
cCentre of Excellence on Ceramic Technologies for Futuristic Mobility, Indian Institute of Technology, Madras (IIT Madras), Chennai 600036, India
First published on 19th September 2023
Abstract
This work represents a first attempt to synthesize Si(Nb)OC ceramic composites through the polymer pyrolysis or the precursor-derived ceramics (PDC) route for use as a hybrid anode material for lithium-ion batteries (LIB). Electron microscopy, X-ray diffraction, and various spectroscopy techniques were used to examine the micro/nano structural features and phase evolution during cross-linking, pyrolysis, and annealing stages. During the polymer-to-ceramic transformation process, in situ formation of carbon (so-called “free carbon”), and crystallization of t-NbO2, NbC phases in the amorphous Si(Nb)OC ceramic matrix are identified. The first-cycle reversible capacities of 431 mA h g−1 and 256 mA h g−1 for the as-pyrolyzed and annealed Si(Nb)OC electrodes, respectively, exceeded the theoretical Li capacity of niobium pentaoxide or m-Nb2O5 (at approximately 220 mA h g−1). With an average reversible capacity of 200 mA h g−1 and close to 100% cycling efficiency, as-pyrolyzed Si(Nb)OC demonstrates good rate capability. X-ray amorphous SiOC with uniformly distributed nanosized Nb2O5 and graphitic carbon structure likely provides stability during repeated Li+ cycling and the formation of a stable secondary electrolyte interphase (SEI) layer, leading to high efficiency.
1. Introduction
LIBs have been utilized in various technological applications since 1991. One major contributor to the commercial success of LIBs has been the development of the graphite anode, which replaced soft carbons and permits stable cycling of Li+ at low redox potentials.1,2 However, increasing demand for fast-charging LIBs in the transportation industry and high-powered devices such as power electronics has necessitated the next-generation batteries with superior charge capacity and excellent rate capability, performance characteristics that are not possible in a traditional Li/graphite cell due to thermal/chemical degradation of graphite at high currents.3 Semiconducting materials such as niobium pentoxide (Nb2O5)-based materials and their composites have garnered interest as alternate anode materials for LIBs because they demonstrate high chemical stability and minimal volumetric expansion during the lithiation and de-lithiation of Li+ ions.4 In addition, the potential window (1–2 V) of Nb2O5-based materials is higher than the potentials (<0.8 V) at which a SEI forms and resulting in increased safety for the electrochemical energy storage devices.5Despite the relatively high operating potential, however, Nb2O5-based materials demonstrate sluggish electronic conductivity that can lead to low reversible capacity if cycled at high currents, and low values of specific charge capacities.4 Previous researchers have improved electronic conductivity and Li ion diffusivity in Nb2O5 by adding conductive agents such as carbon-graphene or carbon nanotubes6,7 or by building nanostructures via synthesis processes such as hydrothermal process or electrospinning process.8,9 Moreover, specific charge capacities of Nb2O5 compounds primarily depend on their unique crystal structures, such as pseudohexagonal (TT-Nb2O5), orthorhombic (T-Nb2O5), monoclinic (M-Nb2O5), and amorphous (a-Nb2O5).8–12 Research has shown that these polymorphic structures can be produced by altering the heat-treatment temperatures during the production process through precursor route.13
Silicon (Si) and Si-based materials have become promising alternative anode materials for LIBs with high charge capacities (∼2×).14–17 Silicon also has the advantages of being environmentally friendly, abundant, and inexpensive, while having less toxicity14,18 Nevertheless, inherent disadvantages of Si-based anodes include poor electrical conductivity, large volume expansion upon alloying/dealloying, low coulombic efficiency (CE), unstable SEI, and electrode swelling, all of which prevent its widespread commercialization.14 Other research has reported that Nb2O5 coating of silicon particle leads to high reversible capacity (2256 mA h g−1 after 80 cycles) and excellent rate capability of 754 mA h g−1 after 80 cycles even at a high current density of 1500 mA h g−1.19 It also reported that pseudo-capacitance contributions arising from the niobium oxide nanoparticles and the silicon–niobium oxide interface enhance the electrochemical reaction kinetics and improve the fast charge storage.20 Further a core shell structured Si nanoparticles@TiO2/C mesoporous micro-fiber composite as an anode for LIBs have been reported high reversible capacity (1260 mA h g−1), and excellent rate capability (939 mA h g−1, after 25 cycles).21
Polymer derived ceramics (PDC) such as silicon oxycarbides (SiOC), silicon carbonitrides (SiCN) have been well recognized for their characteristic amorphous structure that depends on the chemistry of the initial precursors and pyrolysis conditions.22,23 Recent research has shown that amorphous PDCs can store Li+ ions and these materials demonstrate higher useable capacity and increased rate performance than conventional graphite materials.24,25 PDC-based composites with nanostructured materials such as graphene and carbon nanotubes have also been investigated for their use in LIBs.17 The current literature shows that transition metal modified PDCs via precursor route improves their mechanical, functional, and electrical properties.26–32
In an earlier study, titanium-modified SiOC (or Si(Ti)OC) was synthesized through pyrolysis of titanium butoxide-modified polymethylhydrosiloxane (PMHS) single source precursor and investigated as potential anode material for LIBs.33 The as-pyrolyzed Si(Ti)OC electrode demonstrates good rate capability due to its unique structure of amorphous SiOC matrix with graphene-like free carbon phase and uniformly distributed transition metal oxide crystals. Additionally, upon annealing the Si(Ti)OC electrode showed improved first-cycle reversible capacity because of the presence of conductive TiC and carbon phases, addressing the key shortcoming with the SiOC anode material. Also, the precursor route provides an advantage of greater control over precursor chemistry and crystallization of desired phases in the pyrolyzed ceramic. Further research is required to ensure safety for practical applications because the electrochemical performance improvement was mainly in the voltage below 0.5 V for SiOC/metal-modified SiOC materials. Herein, the SiOC has been modified with niobium oxide (via pyrolysis of niobium ethoxide (NE) modified PMHS), owing to Nb2O5's working potentials in the range of 1–2 V. Such working potentials avoid Li dendrite formation and ensures safety for battery at high power densities. To our knowledge, this is the first report involving use of Si(Nb)OC ceramic (prepared via pyrolysis of niobium ethoxide modified PMHS precursor) as electrode material in LiBs.
2. Experimental details
2.1 Synthesis of Si(Nb)OC composites
PMHS and NE from Sigma-Aldrich (India) were used as initial precursors to synthesize niobium-modified silicon oxycarbides (Si(Nb)OC) composites. The PMHS modification was done by adding 50 vol% of NE and stirring for 2 h to form a homogenous solution that was then crosslinked in an oven for 3 h at 250 °C and a heating rate of 5 °C min−1 under ambient atmosphere. The crosslinked product was pyrolyzed for 1 h at 900 °C and a heating rate of 5 °C min−1 under an argon atmosphere. The pyrolyzed product was then annealed for 3 h at 1200 °C and a heating rate of 5 °C min−1 under an argon atmosphere. For comparison, pure NE was heat-treated at 900 °C and 1200 °C at a heating rate of 5 °C min−1 under an ambient atmosphere.2.2 Electrode preparation and electrochemical characterization
As-pyrolyzed and annealed Si(Nb)OC composite powders as active materials (∼160 mg) were mixed with polyvinylidene difluoride (PVDF) (∼20 mg) as a binding agent and carbon black (CB) (∼20 mg) as a conducting agent in a weight ratio of 8![[thin space (1/6-em)]](https://www.rsc.org/images/entities/char_2009.gif) :
:![[thin space (1/6-em)]](https://www.rsc.org/images/entities/char_2009.gif) 1
1![[thin space (1/6-em)]](https://www.rsc.org/images/entities/char_2009.gif) :
:![[thin space (1/6-em)]](https://www.rsc.org/images/entities/char_2009.gif) 1. One or two drops of 1-NMP (1-methyl-2-pyrrolidone) (∼2 ml) was added for fluidity. A doctor blading process was used to coat on the copper foil with the fluid mixture, and the coated copper foil was dried in an oven at 80 °C for approximately 12 h. The dried copper foil was punched into required diameter of 14.28 mm circles, and its weight was measured. Copper-coated electrodes and lithium foil (reference electrode) were used to make the CR2032 half cells in a glove box under an inert atmosphere. The electrodes were separated with a monolayer membrane (polypropylene) wetted with 1 M lithium hexafluorophosphate (LiPF6) (∼2 ml) in 50% dimethyl carbonate (DMC) and a 50% ethylene carbonate electrolyte solution (Sigma-Aldrich, USA). The coin cells were tested in a multichannel battery testing system (BT200 Arbin test system, Texas, USA) with a given voltage range (10 mV–2.5 V) and constant current density (50, 100, 200, 400, 600, and 800 m Ag−1).
1. One or two drops of 1-NMP (1-methyl-2-pyrrolidone) (∼2 ml) was added for fluidity. A doctor blading process was used to coat on the copper foil with the fluid mixture, and the coated copper foil was dried in an oven at 80 °C for approximately 12 h. The dried copper foil was punched into required diameter of 14.28 mm circles, and its weight was measured. Copper-coated electrodes and lithium foil (reference electrode) were used to make the CR2032 half cells in a glove box under an inert atmosphere. The electrodes were separated with a monolayer membrane (polypropylene) wetted with 1 M lithium hexafluorophosphate (LiPF6) (∼2 ml) in 50% dimethyl carbonate (DMC) and a 50% ethylene carbonate electrolyte solution (Sigma-Aldrich, USA). The coin cells were tested in a multichannel battery testing system (BT200 Arbin test system, Texas, USA) with a given voltage range (10 mV–2.5 V) and constant current density (50, 100, 200, 400, 600, and 800 m Ag−1).
2.3 Materials characterization
Functional groups of the precursor and cross-linked powders were analyzed via Fourier transform infrared spectroscopy (FTIR, PerkinElmer Spectrum 400, USA). Thermogravimetry analysis (TGA, SDT-Q600 TA Instruments, USA) was carried under an argon atmosphere at a heating rate of 10 °C min−1 on cross linked powders. X-ray diffraction (XRD) (Cu Kα radiation) (∼0.1546 nm, 40 kV, and 40 mA, Bruker AXSD8 Discover X-ray diffractometer, USA) was used to characterize the heat-treated powders. Free carbon in the heat-treated powders was analyzed via Raman spectroscopy (LabRamaramis, USA) with a HeNe laser wavelength of 632.8 nm, and X-ray photoelectron spectroscopy (Thermo Scientific Al Kα + XPS/UPS system, USA) with a beam energy of 148.6 eV was used to determine the elemental composition and bonding nature of the heat-treated samples and post-cycling battery-tested samples. The Ar+ was sputtered for 120 s at 3.0 keV to remove surface contamination. Morphological information for the powder samples and post-cycling samples of the Si(Nb)OC composites were obtained from the scanning electron microscope (SEM) (Carl Zeiss EVO MA10, 5–30 kV, USA). Before transferring to the SEM chamber, the post-cycling coin cells were dismantled in an argon-filled glove box and repeatedly rinsed with DMC to remove surface impurities of the anode. Nanostructural features and elemental mapping were imaged with a transmission electron microscope (TEM) (JOEL JEM2100 plus, 80–200 keV, USA) and energy dispersive spectroscopy (EDS) (Oxford Instruments, USA).3. Results and discussion
3.1 Crosslinking reactions, morphological features and thermal analysis
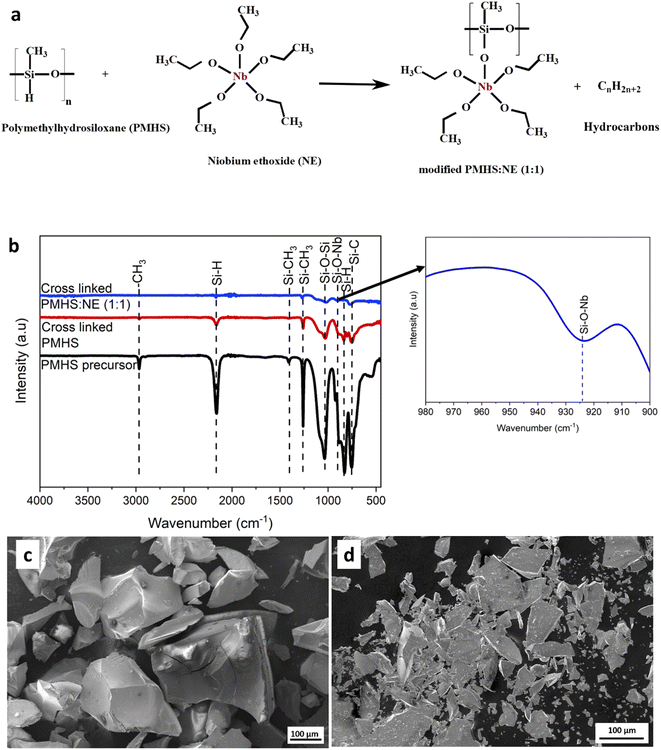
The possible reaction process during crosslinking is predicted in Fig. 1a, here-in Si–H groups of PMHS react with Nb–O–CH3 groups of NE to give off hydrocarbons (CnH2n+2) which resulted in Si–O–Nb linkage. The presence of Si–O–Nb linkages indicates that the Si(Nb)OC was successfully synthesized through single precursor route from PMHS and NE liquid precursors, in which Nb–O units were incorporated into the siloxane network. By preventing the loss of low molecular weight precursor components as well as their breakdown during ceramization, crosslinking increases the yield of ceramics. The absorption bands at 754 cm−1, 830 cm−1, 1030 cm−1, 1260 cm−1, 1408 cm−1, 2161 cm−1, and 2968 cm−1 could be attributed to Si–C, Si–H, Si–O–Si, Si–CH3, Si–CH3, Si–H, and CH3 characteristic bands, respectively.27 However, the extra absorption band for the modified PMHS at 924 cm−1 may be attributed to Si–O–Nb linkage with the release of hydrocarbons.28,34 Fig. 1c and d exemplify the SEM microstructures of as-pyrolyzed and annealed powder samples of Si(Nb)OC composites respectively. The powder particles exhibited irregular morphology and a typical brittle feature of glassy SiOC ceramics.In ESI Fig. S1† exemplifies thermogravimetric analysis on crosslinked SiOC and crosslinked Si(Nb)OC under an argon atmosphere, exhibiting that the initial polymeric mixture showed a mass loss in three stages. The first stage (25–300 °C) corresponds to the evaporation of moisture present in crosslinked powders of SiOC and Si(Nb)OC, whereas the second stage (300–500 °C) in SiOC and Si(Nb)OC. It could be attributed to the decomposition of the polymer and the release of the methane and hydrogen gases, respectively. The decreased ceramic yield is caused by siloxane evaporation as a result of its lower molecular weight and inadequate degree of cross-linking. Here, Si(Nb)OC showed increasing thermal stability and ceramic yield, possibly due to suppressed decomposition of Si–O–C bonds. There was no evident mass loss beyond 600 °C. NE and PMHS undergo chemical reaction that produces highly cross-linked preceramic polymer.
To begin with, binary SiC and Si3N4 are unable to dissolve either nitrogen or carbon to form compositions that contain SiCN. The production of SiOC ceramics is also impossible using SiO2 and SiC. This molecular method is the sole way to create the ternary SiOC and SiCN variants.23,35,36 Preceramic polymers called poly(organosiloxanes) can be employed to produce silicon oxycarbide-based ceramics by thermal breakdown in an inert gas environment. Through the application of an appropriate thermal curing procedure, polymer precursors, which are inorganic systems, provide ceramic materials a specific chemical composition and an ordered nanostructure.24 The content, quantity, and distribution of phases, as well as the microstructure of the finished ceramic, are all influenced by the kind and molecular structure of the preceramic polymer. As a result, it is possible to control the macroscopic chemical and physical characteristics of PDCs by changing the molecular precursor. The first step a preceramic polymer goes through after shaping is cross-linking. Thermal cross-linking is frequently taken into account when the elemental and phase composition of finished ceramics needs to be governed.35 Further, by reacting them with transition metal alkoxides, polysiloxanes with relevant functional groups (such hydroxyl or alkoxy) may be chemically modified.35 During crosslinking, in supplementary Fig. S2† the hydroxyl group of PMHS reacting with methyl groups of NE resulting in modified Si(Nb)OC cross linked preceramic polymer product. Depending on the type of polymer, the crosslinked preceramic polymers must be pyrolyzed at temperatures between 400 and 1400 °C in inert or reactive environment.36 When cross-linked polysiloxanes are pyrolyzed, silicon oxycarbide (SiOC) glasses are produced During the pyrolysis process, the crosslinked precursors' organic groups undergo thermolysis and escape as hydrocarbons/hydrogen at temperatures, between 600 and 1000 °C.24 Ceramization takes place as a result of the escape of hydrogen and hydrocarbons, primarily CH4. Si–O, Si–C, and Si–H bonds can also undergo a variety of redistribution processes.24,35,36 Amorphous Si(Nb)OC and residual free carbon are produced in ceramic materials as a result of substantial C–H, Si–C, and Si–O bond breakage that takes place at temperatures between 600 and 1000 °C.
3.2 Phase evolution studies
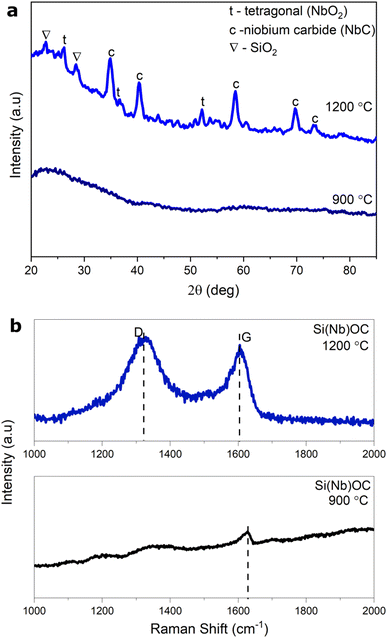
X-ray diffractograms of as-pyrolyzed and annealed Si(Nb)OC composites are presented in Fig. 2a. As shown in the figure, the as-pyrolyzed sample exhibits a completely amorphous nature. However, crystalline peaks at 25.8°, 34.8°, and 52.1° are present in the annealed Si(Nb)OC sample, that represents the metastable t-NbO2 phase (ICSD-34425). The annealed sample also shows 2θ peaks at 34.84°(111), 40.35° (002), and 58.4° (022) that could be attributed to the most intense peaks of niobium carbide (NbC), (ICSD-44496). Previous research has reported that chemically modified Si(Nb)OC, when heat-treated above 1000 °C, forms NbO2 or NbC, depending on the availability of carbon per the following equations:28| Nb2O5 + C → 2NbO2 + CO | (1) |
| Nb2O5 + 7C → 2NbC + 5CO | (2) |
The average crystallite size for the t-NbO2 and NbC calculated using Scherrer's equation is 11 nm and 12 nm, respectively. Further, peaks at 22.3° (011) and 32.28° (012) corresponds to the first most intense peaks of SiO2 (ICSD-44268). The Rietveld refinement of the Si(Nb)OC composites using MAUD software (ESI Fig. S3†) contains 8.93 wt% of NbC, 4.38 wt% of t-NbO2, 6.84 wt% of SiO2 and 79.83% of SiOC.
Fig. 2b shows the Raman spectroscopy data of as-pyrolyzed and annealed Si(Nb)OC samples, including the existence of bands around 1340 cm−1 and 1610 cm−1, which confirms the carbon was in the form of D (disordered) and G (graphitic). The D and G peak intensities were very low in the as-pyrolyzed samples, potentially due to fluorescence caused by C–H bonds.37 Deconvolution of the D and G peaks (ESI Fig. S4†) revealed T and D′′ bands, likely due to the existence of disordered sp2–sp3 bonds, graphene edges, and pores.38,39 The disorder-induced “D” band in graphitic materials corresponds to the T band in free carbon, a low-frequency Raman characteristic. It originates as a result of phonon scattering with disorder- and defect-induced modes. Vacancies, grain boundaries, edge dislocations, and nonplanar graphitic structures are only a few examples of the structural imperfections and disorder in carbon that are linked to the T band. The density and character of these defects can be derived from the T band's intensity and position.40
The D and G peaks intensity ratio is calculated for the sp2 carbon clustering, and the tendency of graphite pile up, which plays an important role in the mechanical and electrical properties of the material.41 To compute the cluster diameter (La), the following equation was used:42
 | (3) |
| C(λ) = C0 + λLC1 | (4) |
Hence, the average La for the annealed Si(Nb)OC (6 ± 0.2 nm) indicating the graphitic carbon transition to disordered carbon or tetrahedral amorphous carbon.44
3.3 Nanostructural features
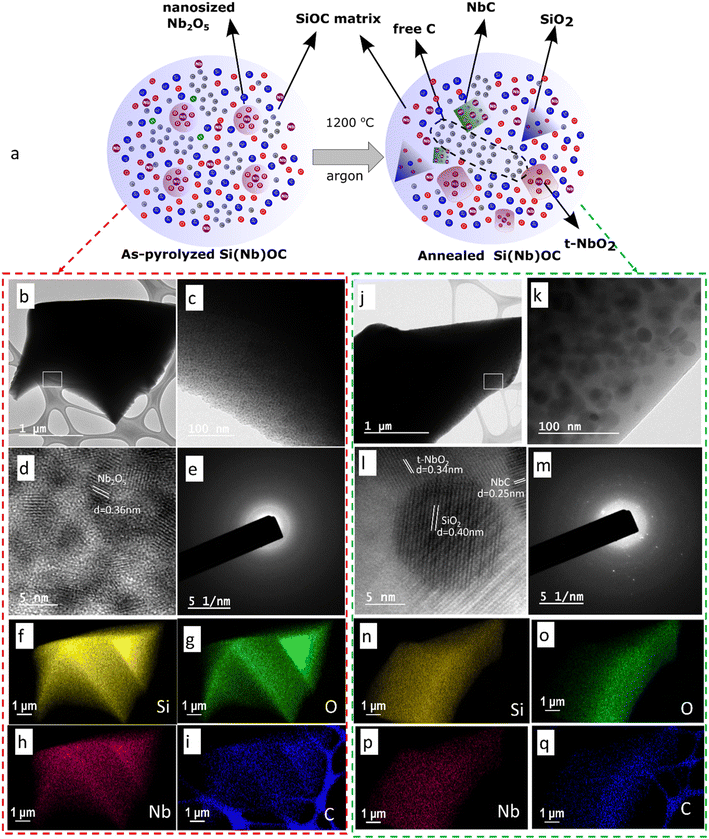
The schematic representation of fabrication process of Si(Nb)OC composites presented in Fig. 3a. Fig. 3b and c show the TEM microstructures of as-pyrolyzed Si(Nb)OC composites. In Fig. 3d, high resolution images of the as-pyrolyzed composites revealed lattice fringes of inter-planar distance (d) of 0.39 nm, which potentially corresponds to the nanosized orthorhombic Nb2O5.45 Nanda et al. previously observed that the heat treatment of a liquid Nb precursor source at 700 °C initiated crystallization of the orthorhombic structure and finished crystallization at 900 °C under ambient atmosphere.13 Therefore, this process method confined the crystallization of nanosized orthorhombic Nb2O5 crystals in the amorphous SiOC matrix, which prevented complete growth of the crystals. The resulting selected area electron diffraction (SAED) pattern (Fig. 3e) showed the amorphous nature of these composites, which agreed with the X-ray diffractogram. Elemental mapping (Fig. 3f–i) revealed uniform distribution of all the elements Si, C, O, and Nb, in as-pyrolyzed Si(Nb)OC composite. Fig. 3j and k show the TEM microstructures of the annealed composite, further high-resolution microstructure (Fig. 3l) revealed lattice fringes of crystals SiO2 (d = 0.40 nm), NbC (0.25 nm), and t-NbO2 (d = 0.34 nm), which agreed with XRD results of the first most intense peak d spacing values. The respective SAED pattern (Fig. 3m) also showed the diffraction spots, thereby confirming the polycrystalline nature, and the elemental mapping (Fig. 3n–q) of the annealed composites revealed annealing results in the segregation of carbon.3.4 Bonding characteristics and chemical composition
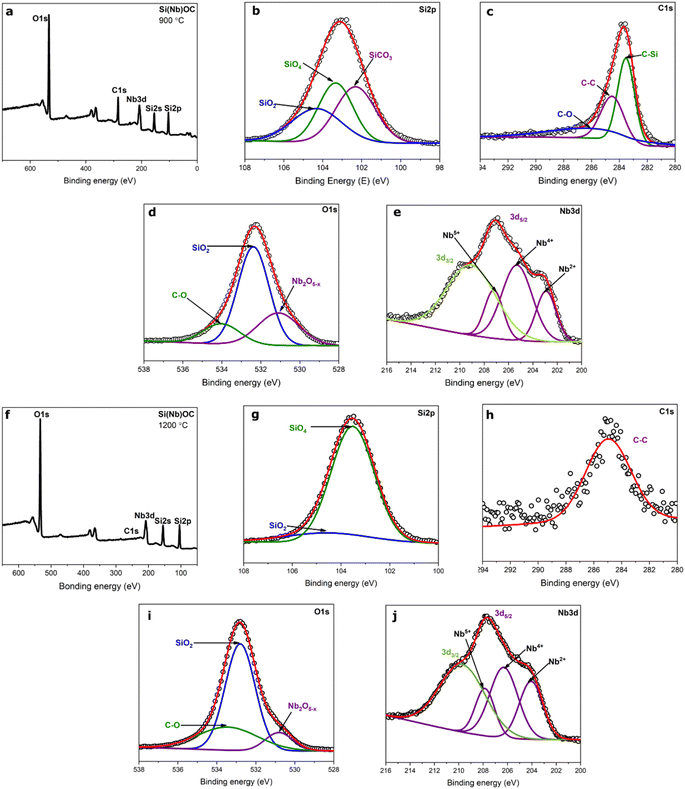
As-pyrolyzed and annealed Si(Nb)OC composites XPS spectra are shown in Fig. 4. High resolution XPS spectra of deconvoluted peaks of Si 2p, C 1s, O 1s, and Nb 3d were observed after curve fitting. The deconvoluted peaks of Si 2p indicated the presence of SiO2,33,46,47 SiO4 (ref. 33 and 47), and SiCO3 (ref. 33 and 47) in the as-pyrolyzed composite (Fig. 4b), whereas high intensity SiO4 bonds and very low intensity SiO2 bonds occurred in the annealed composite (Fig. 4g). Although the deconvoluted C 1s peak showed C–C,31,39 C–Si,31,38 and C–O38 bonds in as-pyrolyzed composite (Fig. 4c), however, only C–C bonds were observed in the annealed composite (Fig. 4h). In addition, during the carbothermal reaction process of the annealed sample, the available free carbon in SiOC utilized to produce the t-NbO2 and NbC, thereby increasing the intensity of SiO4 bonds and decreasing the intensity of C–C bonds.28 The curve under O 1s in Fig. 4d and i indicate the existence of SiO2 (ref. 33 and 47), C–O33,47, and Nb2O5−x48 bonds. However, formation of NbC in the annealed sample resulted in decreased intensity of Nb2O5−x compared to the as-pyrolyzed composite. In Fig. 4e and j, the peaks of Nb 3d showed 3d3/2 and 3d5/2 deconvoluted peaks in both the composites, further the deconvoluted peaks under 3d5/2 represent different oxidation states of Nb5+, Nb4+, and Nb2+.48–50 Increased intensity of the Nb2+ peak in the annealed composite could be due to the NbC phase. Detailed composition is presented in Table 1, and bonding energy (eV) values of the as-pyrolyzed and annealed composites are presented in Table 2.| Si(Nb)OC composites | Elemental composition (at%) | |||
|---|---|---|---|---|
| Si | O | C | Nb | |
| As-pyrolyzed | 21.0 | 44.8 | 28.7 | 4.5 |
| Annealed | 29.4 | 62.1 | 3.1 | 5.4 |
| Si(Nb)OC composites | Deconvoluted peaks (binding energy, eV) | |||
|---|---|---|---|---|
| Si 2p | O 1s | C 1s | Nb 3d | |
| As-pyrolyzed | SiO2 (104.5) | SiO2 (532.8) | C–Si (283.5) | Nb5+(207.6) |
| SiO4 (103.5) | C–O (533.4) | C–O (286) | Nb4+(206.3) | |
| SiCO3 (102.5) | Nb2O5−x (530.8) | C–C (284.6) | Nb2+(204.0) | |
| Annealed | SiO2 (104.5) | SiO2 (532.8) | C–C (284.7) | Nb5+(207.8) |
| SiO4 (103.5) | C–O (533.3) | Nb4+(206.3) | ||
| SiCO3 (102.5) | Nb2O5−x (530.9) | Nb2+(204.1) | ||
3.5 Electrochemical performance
Fig. 5a–d represent the electrochemical evaluation of the as-pyrolyzed and annealed samples of the Si(Nb)OC composites. The charge–discharge profiles (Fig. 5a) of the as-pyrolyzed sample at a current density of 50 mA g−1 showed first-cycle reversible and irreversible capacities of ∼431 mA h g−1 and ∼943 mA h g−1, respectively, with 46% CE. The reversible and irreversible capacities of the second cycle were ∼390 mA h g−1 and 453 mA h g−1, respectively, with 86% CE. Similarly, for the annealed sample in Fig. 5c, the first-cycle reversible and irreversible capacities were ∼256 mA h g−1 and 685 mA h g−1 with 37% CE, while the second-cycle reversible and irreversible capacities of the annealed sample were 253 mA h g−1 and 330 mA h g−1 with 76% CE. Pure Nb2O5 charge–discharge curves presented in ESI Fig. S2† show the first-cycle reversible and irreversible capacities of orthorhombic (ESI Fig. S5a†) and monoclinic (ESI Fig. S5c†) Nb2O5 to be ∼134 mA h g−1 with 40% CE and 220 mA h g−1 with 63% CE, respectively. The as-pyrolyzed composites performed improved reversible charge capacity in the first and second cycles among the tested samples, whereas the annealed sample and pure Nb2O5 had comparatively low reversible capacity values and efficiency. Due to the presence of more active sites for Li+ ion intercalation in as-pyrolyzed sample, such as free carbon and mixed Si–O–C units, demonstrated by prevalent C–C bonds and SiCO3 bonds from XPS analysis51 and uniformly distributed carbon from TEM analysis. The dominated SiO4 bonds in the annealed sample reacted with the Li+ ions to form an irreversible Li4SiO4 phase, resulting in high values of irreversible capacity.52 Furthermore, crystallization of insulating phases (SiO2 and t-NbO2) in the annealed Si(Nb)OC composite created obstacles for the Li ion conduction path, and the formation of conductive NbC resulted in decreased carbon content and segregated graphitic carbon that potentially led to the low reversible capacity values. Fig. 5b and d represents Si(Nb)OC composites differential capacity curves with broad peaks around ∼0.26–0.21 V and ∼0.01–0.16 V, clear indications of Li insertion into the Si–O–C phase and graphitic carbon.1,38,53 The first-cycle redox sharp peaks at 1.63 V and 1.71 V (ESI Fig. S5b†) were due to the reduction of Nb5+/Nb4+ to Nb4+/Nb3+ for orthorhombic Nb2O5.54 Although sharp redox peaks were evident at 1.64 V and 1.72 V for the monoclinic Nb2O5 (ESI Fig. S5d†),54 no such peaks were observed in the Si(Nb)OC composites. The reduction peak was observed around ∼0.65 V in all tested samples due to formation of the SEI layer.55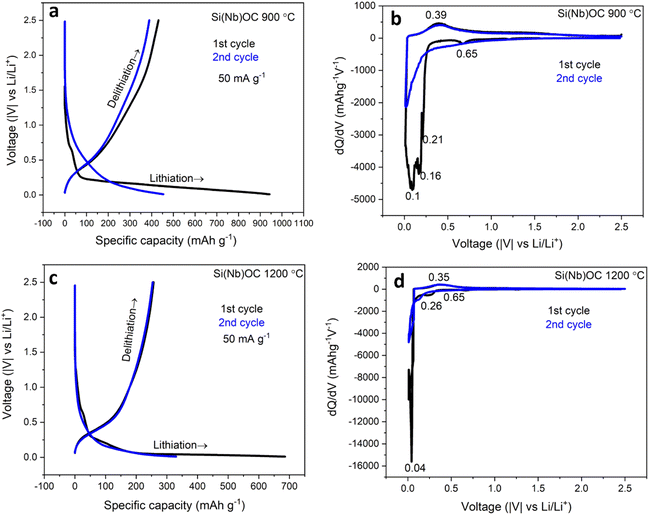 | ||
| Fig. 5 Charge–discharge curves and respective differentiated capacity curves of Si(Nb)OC composites (a and b) as-pyrolyzed composite and (c and d) annealed composite. | ||
The dominated mechanism is Li+ ions storing in free carbon in both as-pyrolyzed and annealed Si(Nb)OC composites. However, the insulating phases (SiO2/NbO2) in annealed sample likely traps the Li+ ions resulting in decreased capacity values. The schematic illustration of Li storing mechanism is depicted in Fig. 6a. Fig. 6b compares the rate capabilities of the as-pyrolyzed Si(Nb)OC composites with pure SiOC33 at various current densities (50 mA g−1,100 mA g−1, 200 mA g−1, 400 mA g−1, 600 mA g−1, 800 mA g−1, and 50 mA g−1). In Fig. 6b present the microstructure of the post-cycling samples of the as-pyrolyzed Si(Nb)OC composites exhibited a stable SEI layer. The as-pyrolyzed Si(Nb)OC exhibited improved rate capability with an average reversible capacity of 200 mA h g−1 and 99% CE, after 100 cycles, potentially due to the unique structure of the well-distributed amorphous SiOC/graphitic carbon/ordered Nb2O5 of the as-pyrolyzed Si(Nb)OC composites, which maintained the structure stability during cycling, and stable SEI formation, resulted in high efficiency. Similar results were reported in our recent work on single-source precursor-derived SiOC/TiOxCy anodes for LIBs.33 Results of the current study showed that Si(Nb)OC composite materials produced through precursor route and heat-treated at pyrolysis temperature improved rate capability compared to pure SiOC and precursor derived Nb2O5 materials (supplementary Fig. S6†). Therefore, this work explored the possibilities for the future anode material for LIBs especially for “high powered devices”.
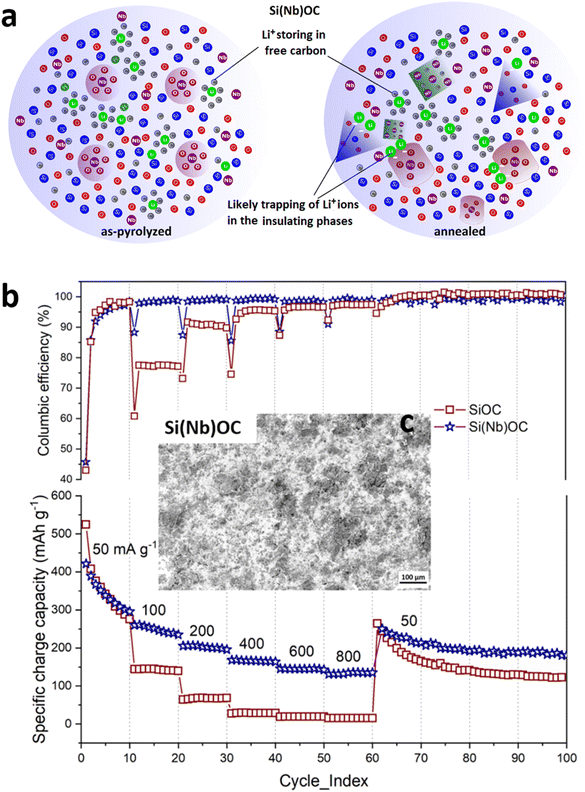 | ||
| Fig. 6 (a) Schematic illustration of Li ion storing mechanism in as-pyrolyzed and annealed Si(Nb)OC composites, (b) the cyclic stability of pure SiOC (our recent work33) and as-pyrolyzed Si(Nb)OC composite anodes when cycled symmetrically at increasing current densities and their respective coulombic efficiency and (c) post-cycling SEM microstructure of as-pyrolyzed Si(Nb)OC composite revealing stable SEI layer. | ||
4. Conclusions
This study utilized a polymer precursor process to synthesize Si(Nb)OC composites as hybrid anode materials for LIBs. Electron microscopy and XRD techniques were used to analyze the micro/nanostructural features and phase evolution, and X-ray photoelectron and Raman spectroscopy were used to investigate the bonding nature, elemental composition, and the disordered and graphitic carbon in the Si(Nb)OC composites respectively. As-pyrolyzed and annealed composites demonstrated first-cycle reversible capacities of 431 mA h g−1 and 256 mA h g−1, respectively, which exceeded the reversible capacity of pure m-Nb2O5 (220 mA h g−1). The as-pyrolyzed Si(Nb)OC composite displayed improved rate capability than pure SiOC, with an average reversible capacity of 200 mA h g−1 and ∼99% CE. The amorphous SiOC structure and uniform distribution of nano-sized Nb2O5 crystals and graphitic carbon allowed the composite to form stable SEI layers and remain stable during cycling.Conflicts of interest
There are no conflicts to declare.Acknowledgements
The financial supports from National Science Foundation (NSF) Partnerships for International Research and Education (PIRE) grant # 1743701 and Institute of Eminence Research Initiative Project on Materials and Manufacturing for Futuristic Mobility (project no. SB20210850MMMHRD008275) are gratefully acknowledged. The authors thank Dr Shakir Bin-Mujib (Kansas State University) and Dr Charles Ye (University of Kansas) for providing assistance on battery testing and FTIR training, respectively. XPS work was conducted at the Nebraska Nanoscale Facility, which is supported by NSF grant # 2025298. The authors also thank the Office of Global Engagement, Indian Institute of Technology Madras, for the travel grant.References
- N. Nitta, F. Wu, J. T. Lee and G. Yushin, Mater. Today, 2015, 18, 252–264 CrossRef CAS.
- J. Lu, Z. Chen, F. Pan, Y. Cui and K. Amine, Electrochem. Energy Rev., 2018, 1, 35–53 CrossRef CAS.
- G. G. Eshetu, H. Zhang, X. Judez, H. Adenusi, M. Armand, S. Passerini and E. Figgemeier, Nat. Commun., 2021, 12, 1–14 CrossRef PubMed.
- T. F. Yi, H. M. K. Sari, X. Li, F. Wang, Y. R. Zhu, J. Hu, J. Zhang and X. Li, Nano Energy, 2021, 85, 105955 CrossRef CAS.
- H. Yu, J. Zhang, M. Xia, C. Deng, X. Zhang, R. Zheng, S. Chen, J. Shu and Z. B. Wang, J. Mater., 2020, 6, 781–787 Search PubMed.
- J. Lin, Y. Yuan, Q. Su, A. Pan, S. Dinesh, C. Peng, G. Cao and S. Liang, Electrochim. Acta, 2018, 292, 63–71 CrossRef CAS.
- P. Jing, K. Liu, L. Soule, J. Wang, T. Li, B. Zhao and M. Liu, Nano Energy, 2021, 89, 106398 CrossRef CAS.
- M. Wei, K. Wei, M. Ichihara and H. Zhou, Electrochem. Commun., 2008, 10, 980–983 CrossRef CAS.
- S. Ramakrishna, A. Le Viet, M. V. Reddy, R. Jose and B. V. R. Chowdari, J. Phys. Chem. C, 2010, 114, 664–671 CrossRef.
- M. Lübke, A. Sumboja, I. D. Johnson, D. J. L. Brett, P. R. Shearing, Z. Liu and J. A. Darr, Electrochim. Acta, 2016, 192, 363–369 CrossRef.
- S. Li, Q. Xu, E. Uchaker, X. Cao and G. Cao, CrystEngComm, 2016, 18, 2532–2540 RSC.
- H. Park, D. Lee and T. Song, J. Power Sources, 2019, 414, 377–382 CrossRef CAS.
- G. Nanda, E. W. Awin, T. Gasyak, E. Koroleva, A. Filimonov, S. Vakhrushev, R. Sujith and R. Kumar, Ceram. Int., 2020, 46(7), 9512–9518 CrossRef CAS.
- G. G. Eshetu and E. Figgemeier, ChemSusChem, 2019, 12, 2515–2539 CrossRef CAS PubMed.
- M. R. Babaa, A. Moldabayeva, M. Karim, A. Zhexembekova, Y. Zhang, Z. Bakenov, A. Molkenova and I. Taniguchi, Mater. Today: Proc., 2017, 4, 4542–4547 CrossRef.
- T. Hussain, A. H. Farokh Niaei, D. J. Searles and M. Hankel, J. Phys. Chem. C, 2019, 123, 27295–27304 CrossRef CAS.
- S. Mukherjee, Z. Ren and G. Singh, J. Phys. D Appl. Phys., 2018, 51(46), 463001 CrossRef.
- M. N. Obrovac and L. Christensen, Electrochem. Solid-State Lett., 2004, 7(5) DOI:10.1149/1.1652421.
- G. Wang, Z. Wen, L. Du, S. Li, S. Ji and J. Sun, RSC Adv., 2016, 6, 39728–39733 RSC.
- G. Wang, J. Zhang, Q. Zhang, X. Tan, Q. Li and K. Xie, J. Electroanal. Chem., 2022, 904, 115945 CrossRef CAS.
- N. Tio, À. Carbon, G. Jeong, J. Kim, M. Park, M. Seo, S. M. Hwang and Y. Kim, ACS Nano, 2014, 8(3), 2977–2985 CrossRef PubMed.
- R. Sujith, S. Jothi, A. Zimmermann, F. Aldinger and R. Kumar, Int. Mater. Rev., 2020, 1–24 Search PubMed.
- P. Colombo, G. Mera, R. Riedel and G.D. Sorarù, J. Am. Ceram., 2010, 93, 1805–1837 CAS.
- C. Stabler, E. Ionescu, M. Graczyk-Zajac, I. Gonzalo-Juan and R. Riedel, J. Am. Ceram. Soc., 2018, 101, 4817–4856 CrossRef CAS.
- M. Wilamowska-Zawlocka, P. Puczkarski, Z. Grabowska, J. Kaspar, M. Graczyk-Zajac, R. Riedel and G. D. Sorarù, RSC Adv., 2016, 6, 104597–104607 RSC.
- E. W. Awin, S. Sridar, A. B. Kousaalya, S. S. L. Vendra, E. Koroleva, A. Filimonov, S. Vakhrushev and R. Kumar, Mater. Chem. Phys., 2021, 260, 124122 CrossRef CAS.
- G. B. Thiyagarajan, E. Koroleva, A. Filimonov, S. Vakhrushev and R. Kumar, Mater. Chem. Phys., 2022, 277, 125495 CrossRef CAS.
- G. B. Thiyagarajan, E. Koroleva, A. Filimonov, S. Vakhrushev and R. Kumar, Phys. Status Solidi A, 2020, 217, 1–9 CrossRef.
- E. W. Awin, A. Lale, K. C. Hari Kumar, S. Bernard and R. Kumar, Appl. Surf. Sci., 2020, 508, 144953 CrossRef CAS.
- E. W. Awin, K. C. H. Kumar, S. Bernard and R. Kumar, Materwiss. Werksttech., 2022, 53, 235–243 CrossRef CAS.
- W. A. Eranezhuth, S. Keshari Sahoo and R. Kumar, Mater. Lett., 2019, 251, 230–233 CrossRef CAS.
- E. Wasan, A. Lale, K. C. H. Kumar, U. B. Demirci, S. Bernard and R. Kumar, Mater. Des., 2018, 157, 87–96 CrossRef.
- S. L. Vendra, G. Singh and R. Kumar, Int. J. Appl. Ceram. Technol., 2022, 1–14 Search PubMed.
- M. Fukushima, E. Yasuda, Y. Nakamura and Y. Tanabe, J. Ceram. Soc. Jpn., 2003, 111, 857–859 CrossRef CAS.
- E. Ionescu, H. J. Kleebe and R. Riedel, Chem. Soc. Rev., 2012, 41, 5032–5052 RSC.
- Q. Wen, Z. Yu and R. Riedel, Prog. Mater. Sci., 2020, 109, 100623 CrossRef CAS.
- M. Wilamowska, V. S. Pradeep, M. Graczyk-Zajac, R. Riedel and G. D. Sorarù, Solid State Ionics, 2014, 260, 94–100 CrossRef CAS.
- S. Bin Mujib, F. Ribot, C. Gervais and G. Singh, RSC Adv., 2021, 11, 35440–35454 RSC.
- K. Papakollu, N. Moharana, K. C. Hari Kumar, S. Lauterbach, H.-J. Kleebe, E. Ionescu and R. Kumar, J. Eur. Ceram. Soc., 2022, 42, 4825–4834 CrossRef CAS.
- T. Livneh, T. L. Haslett and M. Moskovits, Phys. Rev. B: Condens. Matter Mater. Phys., 2002, 66, 1–11 CrossRef.
- T. Jiang, Y. Wang, Y. Wang, N. Orlovskaya and L. An, J. Am. Ceram. Soc., 2009, 92, 2455–2458 CrossRef CAS.
- F. TUINSTRA and J. L. KOENIG, J. Chem. Phys., 1970, 53, 1126–1130 CrossRef CAS.
- M. J. Matthews, M. A. Pimenta, G. Dresselhaus, M. S. Dresselhaus and M. Endo, Phys. Rev. B, 1999, 59, R6585–R6588 CrossRef CAS.
- A. B. Kousaalya, X. Zeng, M. Karakaya, T. Tritt, S. Pilla and A. M. Rao, ACS Appl. Mater. Interfaces, 2018, 10, 2236–2241 CrossRef CAS PubMed.
- K. Skrodczky, M. M. Antunes, X. Han, S. Santangelo, G. Scholz, A. A. Valente, N. Pinna and P. A. Russo, Commun. Chem., 2019, 2, 1–11 CrossRef.
- S. R. Darmakkolla, H. Tran, A. Gupta and S. B. Rananavare, RSC Adv., 2016, 6, 93219–93230 RSC.
- Z. Ren, C. Gervais and G. Singh, RSC Adv., 2020, 10, 38446–38455 RSC.
- N. Özer, M. D. Rubin and C. M. Lampert, Sol. Energy Mater. Sol. Cells, 1996, 40, 285–296 CrossRef.
- W. Kong, Z. Liu, J. Han, L. Xia, Y. Wang, Q. Liu, X. Shi, Y. Wu, Y. Xu and X. Sun, Inorg. Chem. Front., 2019, 6, 423–427 RSC.
- H. Park, D. Lee and T. Song, J. Power Sources, 2019, 414, 377–382 CrossRef CAS.
- K. Xia, Z. Wu, C. Xuan, W. Xiao, J. Wang and D. Wang, Electrochim. Acta, 2017, 245, 287–295 CrossRef CAS.
- H. Shi, A. Yuan and J. Xu, J. Power Sources, 2017, 364, 288–298 CrossRef CAS.
- X. Liu, M. C. Zheng and K. Xie, J. Power Sources, 2011, 196, 10667–10672 CrossRef CAS.
- M. Yang, S. Li and J. Huang, ACS Appl. Mater. Interfaces, 2021, 13, 39501–39512 CrossRef CAS PubMed.
- V. S. Pradeep, M. Graczyk-Zajac, R. Riedel and G. D. Soraru, Electrochim. Acta, 2014, 119, 78–85 CrossRef CAS.
Footnote |
| † Electronic supplementary information (ESI) available. See DOI: https://doi.org/10.1039/d3ra04825j |
| This journal is © The Royal Society of Chemistry 2023 |

