DOI:
10.1039/D3RA04829B
(Paper)
RSC Adv., 2023,
13, 27262-27273
Synthesis and investigation of the morphological, optical, electrical and dielectric characteristics of a disodium cobalt orthogermanate
Received
18th July 2023
, Accepted 29th August 2023
First published on 12th September 2023
Abstract
A sodium cobalt germanate material (Na2CoGeO4) was synthesized and studied. The X-ray powder diffraction pattern revealed a monoclinic crystal system with the Pn space group. The calculated value of the direct bandgap (Eg) was (3.89 ± 0.02) eV. Electrical measurements were undertaken in a frequency range from 40 Hz to 1 MHz and a temperature range from 403 K to 573 K. Nyquist plots revealed only a semicircle in the whole impedance spectra due to the effect of interior grains. The AC conductivity of Na2CoGeO4 was associated with the correlated barrier hopping (CBH) model. Studies of the complex electric modulus M*(ω) confirmed that the relaxation process was thermally activated.
1 Introduction
Orthogermanate materials with the chemical formula A2BGeO4 (A = K, Li, Na, Cs, Rb, and B = Zn, Co, Mg, Mn) have garnered growing attention, principally due to their interesting physical applications, such as supercapacitors,1 solid electrolytic properties for batteries2,3 and dielectrics.4,5 Miscellaneous sodium-ion batteries and lithium-ion batteries have been widely used due to their high performance (e.g., high specific capacity).6,7 Ionic conductivity has been the object of attention in the last few years due to the use of ionic conductors and/or semi-conductors in rechargeable batteries. Many studies have focused on the metal orthogermanate Na2MGeO4 (M = Co, Mn, Fe) as a potential cathode material due to its high ionic diffusion and good conductivity.8 Ionic conductivity is considered to be strongly related to structural rearrangement. However, the uppermost possible energy storage and ionic conductivity for Li-ion batteries are inadequate for the long-term needs of society.9 Sodium-based orthogermanate compounds as cathode materials are a challenge. Recently, much attention has been focused on materials with ionic conductivity due to the mobility of sodium, which is dependent on cavities which, in turn, are dependent on temperature changes.10 Since 1965, the conductivity of Na2BGeO4 (with B = Zn, Co) has been studied with various sodium environments, and orthogermanate compounds have been shown to have excellent conductivity. Recently, many studies have shown the effect of Co2+ on structural stability as well as electronic and electrical properties. In this context, Na2CoGeO4 (NCG) seems to be an almost ideal candidate. Herein, we studied the structure, and optical, electrical and dielectric properties in order to determine the characteristics and conduction mechanism of NCG.
2 Experimental section
2.1 Preparation of a powder sample of NCG
NCG was synthesized by a traditional high-temperature solid-state reaction. The raw materials used were: Na2CO3, Co3O4 and GeO2, all of which had a purity of 99% and were purchased from MilliporeSigma. The synthesis of NCG was carried out according to the following equation:| |
 | (1) |
The starting materials were ground in an agate mortar for 15 min. The mixed suspension was transferred to an alumina crucible and placed in an oven at a calcination temperature at 673 K for 15 h to eliminate CO2. The obtained powder was ground again for 16 h and pressed into pellets of diameter 8 mm and thickness 1 mm using a 3 ton per cm2 uniaxial pressure and, finally, sintered at 1123 K for 15 h.
2.2 Preparation of a thin film
First, glass substrates were carefully purified in a commercial surfactant by ultrasound and washed several times in deionized water. Cleaning was completed by annealing in an oven at 100 °C for 3 h. Second, NCG powder was dissolved in 1 mL of dimethyl sulfoxide. A thin film was prepared by depositing one drop on the substrate using a centrifuge at a rotation speed of 2000 rpm for 60 s. The final step was annealing of the film in an oven at 110 °C for 5 h.
2.3 Apparatus
Initially the structure and crystallinity of the prepared ceramic compound were described by X-ray powder diffraction (XRD) analysis using monochromatic Cu Kα radiation (λKα = 1.5406 A) in a wide range of Bragg angles from 10° to 70°. The morphology was studied by scanning electron microscopy (SEM) using an EVO LS10 system (Zeiss) equipped with an energy-dispersion system (INCA-X; Oxford Instruments). Optical measurements were accomplished using a scanning spectrophotometer (UV-3101PC; Shimadzu) in a broad range of wavelengths from 200 nm to 800 nm. The ellipsometric measurements of this material were made using a spectroscopic phase modulated ellipsometer (UV-vis-NIR; Horiba Jobin-Yvon) at an angle of incidence of 70° with intervals of 10 nm in a spectral range from 300 nm to 800 nm. Impedance spectroscopy and AC conductivity were done and the dielectric characteristics of the compound investigated over a frequency range of 40 Hz to 1 MHz. We undertook a complex impedance analysis during the heating cycle at temperatures from 403 K to 573 K. The capacitance (Cp), resistance (R), real part (Z′) and imaginary part (Z′′) of the complex impedance were measured as a function of frequency (ω). During the experiment, the electric potential was kept constant at ≈1 V and the frequency changed continuously.
3 Results and discussion
3.1 Phase identification and crystal structure
To ascertain the phase purity of the synthesized sample, XRD analysis was done. Fig. 1(a) displays the X-ray diffractogram of NCG recorded at room temperature. The Rietveld refinement of NCG was done to determine the crystal structure. The absence of a secondary phase and peaks of impurities confirmed preparation of a pure and good-quality compound. All reflection peaks corresponded to 2θ values indexed in the monoclinic system to the space group Pn. The quality factor confirmed good agreement between the calculated (black solid line) and observed (red points) profiles, and χ2 = 3.90. The profile parameters were a = 7.154(2) Å, b = 5.583(2) Å, c = 5.272(1) Å, V (Å3) = 184.930(2) and β (°) = 90.034(2). These data are in good agreement with the results stated by Duderov and colleagues.11 The refined crystallographic parameters and reliability factors are shown in Table 1. Using the Williamson–Hall method, one can calculate the average crystallite size and strain using the following equation:| |
 | (2) |
where λ = X-ray wavelength, DW–H = crystallite size, ε = strain, K = constant = 0.9 and β = full-width half-maximum of high-intensity diffraction peaks. The intercept on the Y-axis and a slope of a linear fitted plot drawn between β![[thin space (1/6-em)]](https://www.rsc.org/images/entities/char_2009.gif) cos(θ) and sin(θ), as shown in Fig. 1(b), for different high-intensity peaks provided the crystallite size and strain, respectively. The average crystallite size and strain was found to be L = 68 nm and h = 0.00456, respectively. Furthermore, the low value of a micro-strain indicates a strain-free and narrow size of nanoclusters.12
cos(θ) and sin(θ), as shown in Fig. 1(b), for different high-intensity peaks provided the crystallite size and strain, respectively. The average crystallite size and strain was found to be L = 68 nm and h = 0.00456, respectively. Furthermore, the low value of a micro-strain indicates a strain-free and narrow size of nanoclusters.12
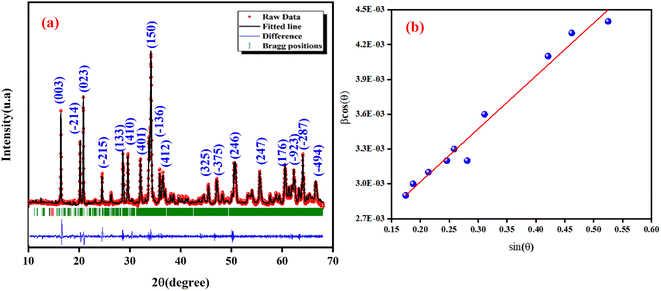 |
| | Fig. 1 X-ray diffraction (XRD) analysis of NCG at room temperature: calculated data (black solid line), observed data (red points) and Bragg positions are shown by a vertical bar (a) and Williamson–Hall plot (b). | |
Table 1 Lattice parameters of the NCG matrix
| Formula |
Na2CoGeO4 |
| Crystal system |
Monoclinic |
| Space group |
Pn |
| Unit lattice parameters (Å) |
a = 7.154(2) |
| b = 5.583(2) |
| c = 5.272(1) |
| β (°) = 90.034(2) |
| Unit cell volume (Å3) |
V = 184.930(2) |
| Rp (%) |
17.6 |
| Rwp (%) |
14.1 |
| Rexp (%) |
7.14 |
| RB (%) |
1.93 |
| RF (%) |
1.69 |
| χ2 |
3.90 |
The crystal structure of NCG is shown in Fig. 2. The oxygen atoms occupy four positions, designated by O (1), O (2), O (3) and O (4). The sodium atoms occupy two positions, designated by Na (1) and Na (2). The framework structure of the NCG matrix is a Wurtzite structure with corner-sharing alternating between the corners of the ZnO4 and GeO4 tetrahedra. Na+ ions were introduced into the tunnel formed by the tetrahedral network. The orthogermanate NCG was isostructural to Li2ZnGeO4.13
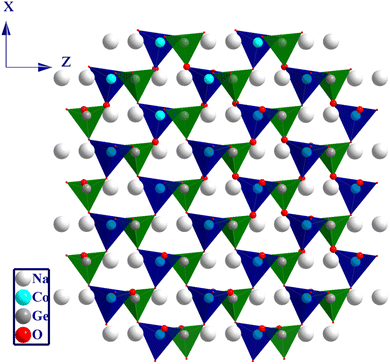 |
| | Fig. 2 Graphic illustrations of a Wurtzite-like crystal structure. | |
3.2 Morphological representation and particle-size distribution calculated by SEM and transmission electron microscopy (TEM)
SEM and energy-dispersive X-ray spectroscopy (EDX) were employed to study the composition and morphology of NCG. These additional studies make it possible to differentiate the elements present in the sample by detecting backscattered electrons. Micrographs exhibited a collection of large and small-sized grains homogeneously distributed throughout into the sample (Fig. 3(a)). EDX of NCG revealed the existence of sodium, oxygen, cobalt and germanium (Fig. 3(b)). To estimate the particle-size distribution further, TEM was done (Fig. 3(c)). Using Fiji software, a manual count of grain size was done on TEM images. The results are shown as histograms in Fig. 3(d) as counts (grain number) against particle size. The particle size was estimated to be 450 nm.
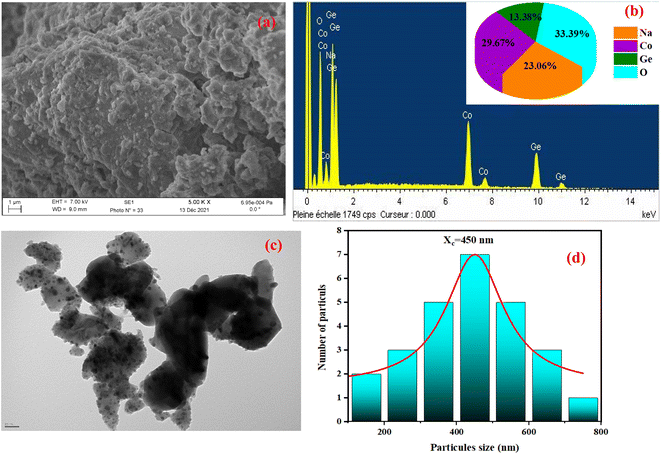 |
| | Fig. 3 SEM image (a), elemental analysis by EDX (b), TEM image (c) and particle-size distribution (d) of NCG. | |
3.3 Optical characteristics
3.3.1 Absorbance spectra. Study of the optical properties of orthogermanate materials aids understanding of the optoelectronic physical characteristics of these materials. Moreover, to understand the effect of the tetrahedron (CoO4) on the electronic structure, a study of optical characteristics becomes useful. Fig. 4(a) shows the ultraviolet-visible (UV-vis) absorption spectrum of NCG in a wavelength range from 200 nm to 800 nm. An energy absorption peak in the UV domain at 275 nm was documented. The compound contained another absorption band at 674 nm. Based on the literature,14 this peak was linked to the d–d transition of Co2+. This absorption band could be assigned to 4A2 (F) – 2E (G) field transitions. Consequently, we concluded that NCG contained Co2+ in a tetrahedral coordination.
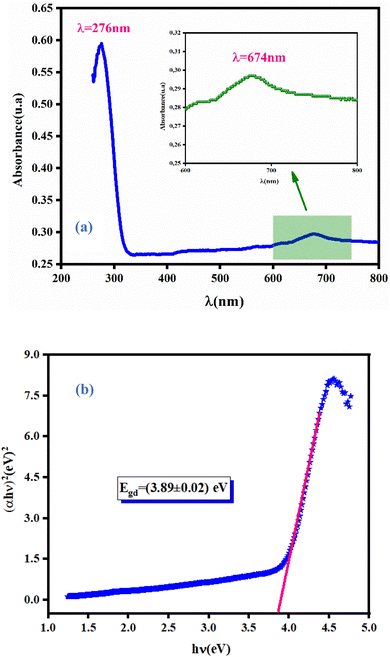 |
| | Fig. 4 Absorbance spectra of NCG measured at room temperature (a) and determination of the bandgap energy for NCG (b). | |
3.3.2 Determination of the optical bandgap energy (Eg). The optical bandgap is a fundamental factor in different fields of science, but particularly in lasers, photovoltaics, photoluminescence, and solar cells.15,16 Usually, the optical measurements of the UV-vis absorption spectra are taken using reflectance data according to the Kubelka–Munk formula:17| |
 | (3) |
The optical bandgap for NCG was determined using the Tauc equation:18
| |
 | (4) |
The dependence of (αhν)1/p on the photon energy for NCG is displayed in Fig. 4(b). The straight-line extrapolation of these plots to the zero-absorption spectrum gives the bandgap energy Eg = (3.89 ± 0.02). Consequently, orthogermanate materials can be classified as semi-conductors. To ascertain if the optical-band transition of a studied compound is indirect or direct, the relationship (4) can be elaborated as follows:
| |
ln(αhν) = ln(A) + n![[thin space (1/6-em)]](https://www.rsc.org/images/entities/char_2009.gif) ln(hν − Eg) ln(hν − Eg)
| (5) |
Fig. 5(a) shows the variation of ln(αhν) as a function as ln(hν − Eg). Test values for Eg, obtained from the study shown in (Fig. 4(b)) were used. Straight lines whose slopes gave the power factor (n) were plotted. For Eg = (3.89 ± 0.02) eV, n was close to 0.5 confirming the direct transition behavior of the studied material, as shown in Fig. 4(b).
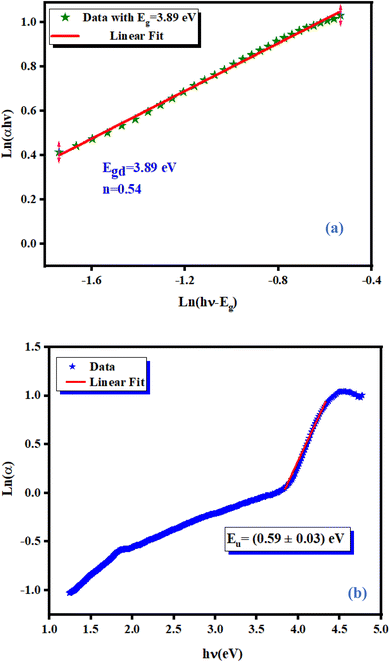 |
| | Fig. 5 Variation of ln(αhν) against ln(hν − Eg) for NCG (a) and determination of the Urbach energy relative to NCG (b). | |
3.3.3 Urbach energy. The disorder of a material can be characterized by the Urbach energy, which corresponds to the transitions among the extended states of the valence band and the localized states of the conduction band. It is an empirical parameter that denotes the degree of defects of a material.19 According to Urbach's law, it is possible to deduce the disorder in a sample by the empirical relationship between the energy (hν) and absorption coefficient (α), which is provided by the following formula:20| |
 | (6) |
where Eu is energy, α0 is a constant, h is Planck's constant and ν is the frequency of radiation. Fig. 5(b) displays the evolution of the absorption coefficient as a function of the photon energy. The width of the localized states was estimated from the slope of the ln(α) versus energy (hν) curve, Eu was determined to be (0.59 ± 0.03) eV. This value showed the existence of disorder in the synthesized material.
3.3.4 Ellipsometric investigation of NCG. To determine the refractive index of the NCG sample, ellipsometric spectroscopy was done. Fig. 6(a) shows evolution of the refractive index (n) as a function of the wavelength. The refractive index of NCG decreased with increasing wavelength from the UV domain to the visible region. The dependence of the refractive index (n) as a function of the wavelength mostly obeys the law of dispersion: “Cauchy's absorbent dispersion”. Based on this model, the equation of the refractive index n(λ) is given by the following formula:21| |
 | (7) |
where n0, A and B are the Cauchy variables. According to the Cauchy distribution, the refractive index depends first on the wavelength and second on the material. Considering the adjustment of the n(λ) curve, the Cauchy parameters are shown in Table 2.
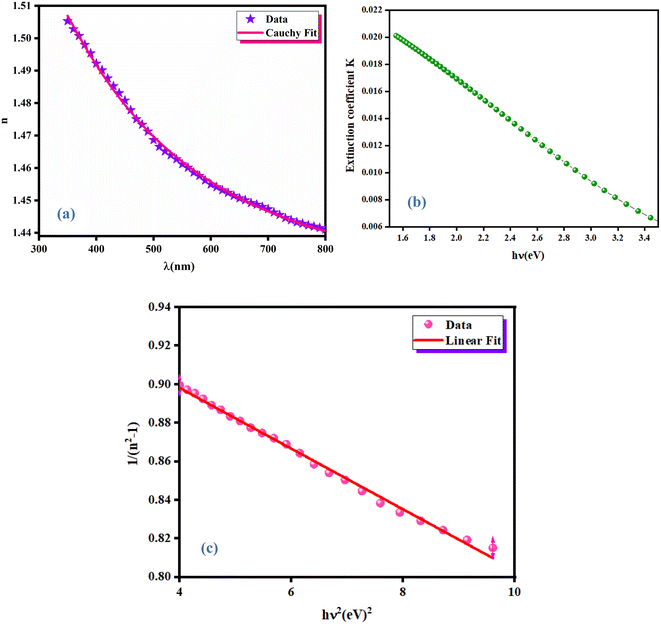 |
| | Fig. 6 Variation of the refractive index as a function of wavelength λ (a), extinction coefficient (b) and Wemple–Di-Domenico model plot (c) of NCG. | |
Table 2 Parameters used for the adjustment of the Cauchy model and calculated values of Ed and E0
| Compound |
n0 |
A (μm2) |
B (μm4) |
E0 (eV) |
Ed (eV) |
| Na2CoGeO4 |
1.41 |
0.1455 |
−0.046 |
5.40 |
5.80 |
The extinction coefficient is the fraction of light lost due to scattering and absorption per unit distance from the participating intermediate. The extinction coefficient (K) of a growing crystal is shown using the following relationship:
| |
 | (8) |
Fig. 6(b) displays the variation of the extinction coefficient as a function of photon energy for NCG. The extinction coefficient of this compound decreased as the photon energy increased, signifying that the fractional loss of radiation incident on the crystal decreased and, at higher photon energy, it increased slightly. This phenomenon may have been due to the nature of the scattering centers, and to the scattering and absorption behavior as a function of photon energy.18
The dispersion of the refractive index of a material plays an important part in optical communications and in the design of optical devices. Thus, it is important to determine the dispersion parameters for a material. Fig. 6(c) shows the variation of refractive index with photons: the oscillator model was valid. Therefore, we used the Wemple and Di-Domenico model to determine the dispersion parameters for the thin film as follows:18
| |
 | (9) |
where
E0 represents the single-oscillator energy,
E is the photon energy and
Ed represents the dispersion energy (which is a measure of the intensity of inter-band optical transitions).
Ed and
E0 were obtained by the fit of the linear part of the curve (
n2 − 1)
−1 versus (
hν)
2 (
Fig. 6(c)).
Ed and
E0 were determined from the intercept (
E0/
Ed) and slope (
E0 Ed)
−1 on the vertical axis. The values of
E0 and
Ed are shown in
Table 2.
E0 and
Ed have a significant association with the crystalline structure and ionicity of ionic or covalent oxide materials.
22
3.4 Complex impedance spectroscopy
The electrical characteristics of NCG were studied using complex impedance spectroscopy based on [Z(f) = Z′(f) − jZ′′(f)], where Z′ and Z′′ are the real and imaginary parts of Z, respectively. Complex impedance spectroscopy is suitable for determining the electrical characteristics of a sample (e.g., conductivity and carrier-relaxation characteristics).
3.4.1 Nyquist plots. The impedance data of a material include a resistive (real) part and reactive (imaginary) part. The result can be presented in a complex plane (Nyquist) plot. Fig. 7 displays the imaginary part of complex (Z′′) as function as the real part of the impedance (Z′) at different temperatures (described by semicircles).
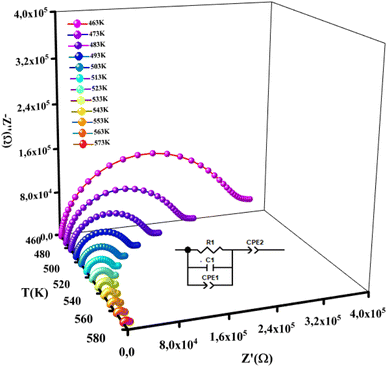 |
| | Fig. 7 Plots of experimental and theoretical impedance complex values of NCG. | |
The centers of these semicircles were localized below the Z′ axis, which demonstrated that the conduction of this material was not dependent upon Debye formalism but instead obeyed the Cole–Cole model. The radius of these semicircles decreased with increasing temperature, indicating decreased resistance. As a result, the conduction mechanism was thermally activated. The existence of one semicircle suggested that the electrical processes in our compound were mainly due to the contribution of inner grains. This result was expected from this sample because grain boundaries were produced due to the powder being ground for 9 h.14 These graphs were adjusted using Z-view software, and the best fit was obtained with an equivalent circuit. These spectra were best modeled by an equivalent circuit containing a parallel combination of resistance (R), capacitance (C) and fractal capacitance (CPE1). The electrical components were linked in series to a constant phase element (CPE2) and are presented in the inset of Fig. 7.
Fig. 8(a) displays the frequency dependence of the real part (Z′) of the complex impedance at various temperatures. The altitude of Z′ decreased with an increase of the angular frequency as well temperature, which confirmed the existence of semiconductor behavior in this compound. This behavior is consistent with the results from the literature.23 Moreover, all values of Z′ merged at higher frequencies. This behavior may have been due to the release of space charges as well as a reduction in barrier properties which, therefore, improved the conductivity of alternating current.24 Moreover, Fig. 8(b) shows the frequency dependence of the imaginary part of the impedance complex (Z′′) at different temperatures.  decreased with increasing temperature, which confirmed an increase in the loss of the resistive property of the material as the loss factor linked to 1/Z′′.25 If the frequency of jump electrons corresponds to the frequency of the external field, then relaxation peaks appear.26 The shift of the peak towards a higher frequency as the temperature increases indicates the temperature dependence of the relaxation time. The observed relaxation peaks were larger than the ideal Debye curve, so NCG represented a non-Debye type of relaxation. Displacement of the peaks to higher frequencies as the temperature increased indicated the temperature dependence of the relaxation time. There was good agreement between experimental curves (scatter) and theoretical data (line) (Fig. 7 and 8(a), (b)). This result confirmed that the proposed equivalent circuit described the electrical properties of the material.
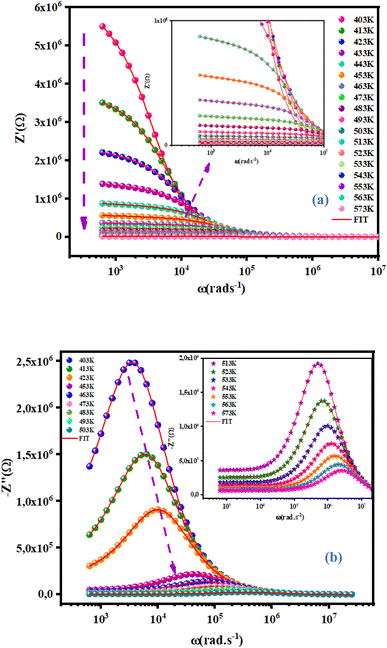 |
| | Fig. 8 Frequency dependence at various temperatures of the real part Z′ (a) and imaginary part Z′′ (b) at various temperatures of NCG. | |
3.4.2 Temperature-dependent resistance and activation energy. The increase in material resistance as a function of the temperature and the corresponding activation energy are presented in Fig. 9. The material exhibited a high resistance (7 × 10⁶ Ω at 400 K) that diminished progressively. The value of activation energy for was (0.78 ± 0.02) eV as determined by the following equation:| |
 | (10) |
where Ea is the activation energy and T is the temperature in kelvin.
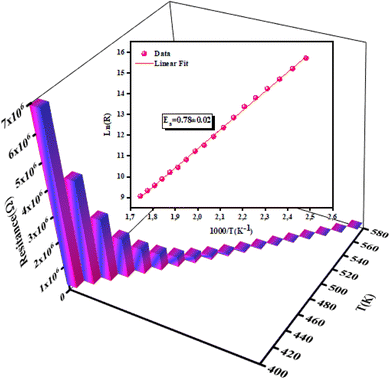 |
| | Fig. 9 Evolution of resistance with temperatures and the corresponding activation energy of NCG. | |
3.4.3 Capacitance behavior of NCG. Capacitance (Cp) is described as the variation of the charge ratio and potential difference among two conductors. The variation of capacitance of NCG as a function of frequency in a temperature range of 403 K to 573 K is shown in Fig. 10(a). Capacitance decreased exponentially with increasing frequency in the range of 10 kHz to 1 MHz at each temperature. A high capacitance value at low frequency can be due to the formation of interfacial space charges.27 Fig. 10(b) displays the capacitance of NCG as a function of temperature at different frequencies. Capacitance at different frequencies increased significantly as the temperature increased, and this was caused by enhanced thermally activated free carriers.28
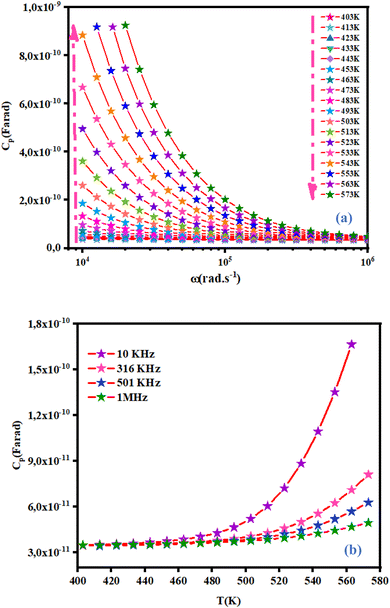 |
| | Fig. 10 Variation of capacitance as a function of frequency at different temperatures (a) and as a function of temperature at different frequencies (b). | |
3.4.4 Frequency-dependent conductivity and the correlated barrier hopping (CBH) model. Conductivity is the most powerful expression attributed to macroscopic evaluation of the microscopic displacements of electrons. Moreover, AC conductivity was studied extensively to investigate the conduction mechanism in our material. Changes in AC conductivity as a function of frequency at different temperatures is shown in Fig. 11(a). Conductivity is specified by Jonscher's universal power law:29where σdc is the continuous conductivity (which is related to the band-to-band conduction by non-contained charges with an energy larger than the mobility edge), ω is the angular frequency, A is a pre-factor determining the strength of polarizability30 and S denotes the degree of interaction between mobile ions. Plots of AC conductivity as a function of frequency tended to converge and stay almost constant in the low-frequency part. At low frequencies, the random scattering of hopping charges produced frequency-independent conductivity. At high frequencies, electrical transport was due to charge-carrier jumps between trap levels located in the bandgap of the semiconductor, which led to a very rapid increase in conductivity. For the ceramic compound NCG, all frequency- and temperature-dependent AC conductivity curves were in two isolated parts: DC region (which was frequency-independent) and AC region (which was highly temperature-dependent).
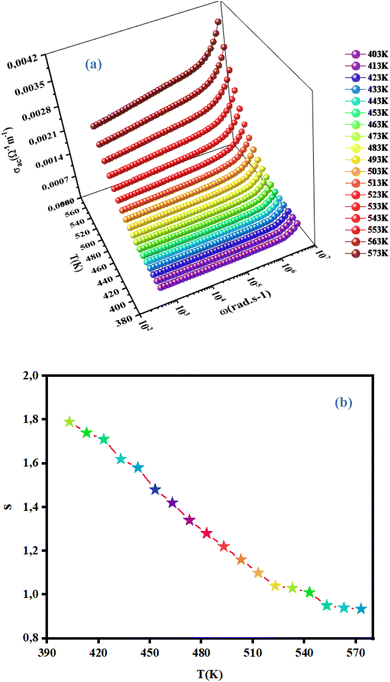 |
| | Fig. 11 Variation in AC conductivity as a function of frequency as well as the temperature (a) and temperature dependence of the exponent S. | |
We wished to study the conduction mechanism in our compound. Various theoretical models have been postulated in the literature. These include the: small non-overlapping polaron tunnel (NSPT), where the exponent S increases with increasing temperature;31 correlated barrier jump (CBH) model, in which S decreases with increasing temperature;32,33 overlapping large polaron tunneling (OLPT) model proposed by Long.34 The exponent S is dependent upon temperature and frequency, and decreases with an increase in temperature to a lowest value, then increases with increasing temperature. The quantum mechanical tunneling model (QMT) is designated by an exponent S that increases very slightly with temperature, almost equal to a value of 0.8.35 The exponent S was plotted as a function of the temperature (Fig. 11(b)). The CBH model seemed to be the most appropriate model to describe the electrical conduction mechanism in our compound. This model was first presented by Pike for the single polaron jump and was afterwards developed by Eliott for the bi-polaron jump.36 According to the CBH formalism, the following equation gives the exponent S:37
| |
 | (12) |
where
T is the absolute temperature,
kB is the Boltzmann constant,
Wm is the binding energy,
τ is the characteristic moment of relaxation and
ω is the angular frequency. For primary estimation of this equation, the exponent (
S) becomes:
| |
 | (13) |
In this model, AC conductivity is determined by:36
| |
 | (14) |
where
n is the number of polarons assigned in the hopping process,
ε′ the dielectric constant of the material and
Rω is the hopping distance, which is given by:
| |
 | (15) |
Moreover, NNp can be described by: NNP = N(EF)2(bipolaron-hoping), NNp = N(EF)2  (single-polaron hopping).
Fig. 12 displays the evolution of AC conductivity as a function of (1000/T) in the NCG sample. At different frequencies, the experimental values (scatter) are in good agreement with the theoretical values (line) of the adjustment. The AC conductivity of this sample can be described in a suitable way by considering a single conduction mechanism (single polaron). The estimated values of N(EF), Ueff and Wm are summarized in Table 3.
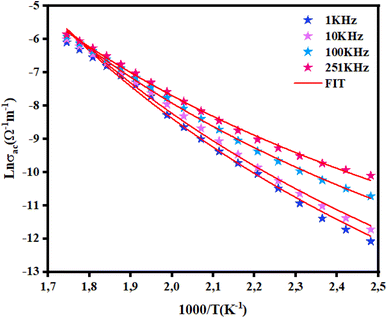 |
| | Fig. 12 Variation in ln(σac T) versus 1000/T for NCG. | |
Table 3 Parameters used for adjustment of the CBH model
| Frequency (kHz) |
Ueff (eV) |
N(EF) (eV−1 m−3) |
Wm (eV) |
| 1 |
−0.0063 |
6.42.1 × 1017 |
0.23 |
| 10 |
−0.0060 |
1.06.1 × 1018 |
|
| 100 |
−0.0050 |
4.63.1 × 1018 |
|
| 251 |
−0.0045 |
1.16.1 × 1019 |
|
Fig. 13(a) describes the evolution of the hopping distance Rω as a function of temperature. For the CBH conduction mechanism, the hopping distance increases with increasing temperature. As the temperature increases, the polarons receive increasing thermal energy, so the interchain interaction (electric charge jump) increases. The decrease in jump distance with applied angular frequency is consistent with the increase in conductivity with frequency.38 Fig. 13(b) displays the variation of the Fermi level density of state [N(EF)] as a function of the angular frequency of NCG. [N(EF)] increased with increasing frequency. This occurred because as the state density near the Fermi level increased with frequency, the conductivity also increased. This action led to a reduction in height of the barrier for the charge-carrier jumping around different localized states. Hence, the charge carriers could jump readily among these localized states.39
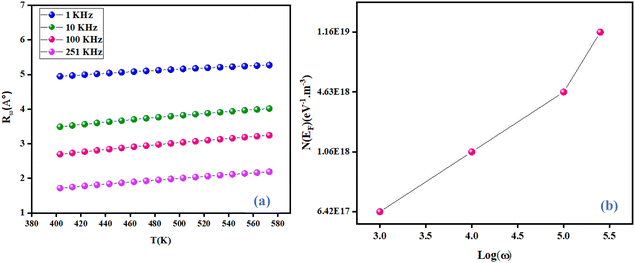 |
| | Fig. 13 Variation in the hopping tunneling distance Rω as a function as temperature at different frequencies (a) and variation of N(EF) as a function of frequency (b). | |
3.5 Complex electrical modulus
The electrical modulus is important for the study of electrical-transport mechanisms in terms of ion/carrier-charge jumping, dielectric relaxation or conductivity. The electrical modulus helps in the discrimination of individual relaxation processes due to boundary of grains, grains, and the ceramic effect of the electrode. The electrical modulus contains two parts, the real modulus (M′) and imaginary modulus (M′′), and is given by the following equation:
Evolution of the real part (M′) and imaginary part (M′′) of the complex modulus with frequencies at different temperatures is represented in Fig. 14(a) and (b). Both parts of the modulus (M′ and M′′) had zero values in the low-frequency region. This result may have been due to the effect of electrode polarization40 as well as the displacement of long-distance charge carriers in the conduction mechanism. Moreover, a dispersion and increase in the frequency (approaching probably M∞) were noted. This result could have been due to conduction because of the increase in temperature. For short distances, the observed peaks moved towards high frequencies. This behavior suggested that a dielectric relaxation was thermally active in the compound when the hopping mechanism of a charge carrier dominated. The asymmetric character of the peaks can be observed in Fig. 14(b), which indicated the non-Debye response of the material.41 The decrease in intensity of M′′ and temperature increase could have been related to the increase in capacitance with temperature (Fig. 10(b)). Adjustment of the spectra of the imaginary modulus was carried out based on the equation proposed by Bergman:
| |
 | (17) |
where

is the maximum value of
M′′, which is due to the relaxation of the grains. At various frequencies, the experimental values (scatter) were in good agreement with the theoretical values (line). This result confirmed that the proposed equation described the dielectric relaxation of the material.
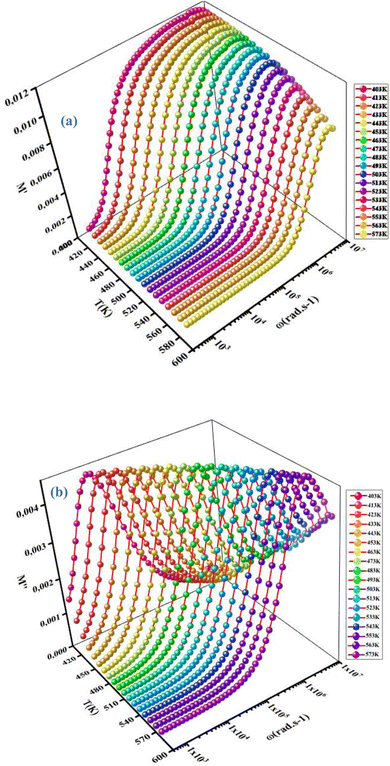 |
| | Fig. 14 Variation in the real part (M′) (a) and imaginary part (M′′) (b) of the electrical modulus as a function of the frequency at different temperatures. | |
3.6 Dielectric relaxation behavior
We wished to reveal more important information about the physical behavior of the electrical and dielectric properties. Hence, a study of the complex permittivity was carried out in a frequency range of 0.1 Hz to 1 MHz at representative temperatures of 403 K to 573 K. The complex permittivity contains two parts, a real dielectric constant (ε′) and an imaginary dielectric loss (ε′′), and is given by the following expression:| | |
ε*(ω) = ε′(ω) − jε′′(ω)
| (18) |
The real and imaginary parts of the complex permittivity are given by the equations:
| |
 | (19) |
and
| |
 | (20) |
The dependence of angular frequency of the real (ε′) and imaginary (ε′′) parts of the complex dielectric permittivity at various temperatures is shown in Fig. 15(a) and (b). According to Fig. 15(a), a relaxation peak was not detected in the frequency region used in this work. In the low-frequency region, with increasing temperature, ε′ displayed dispersive behavior. Moreover, an increasing value of ε′ with increasing temperature could be attributed to the increase of the space-charge polarization process.42 On the other hand, in the high-frequency range, ε′ tended to reach a constant value  . This phenomenon could be the consequence of rapid polarization without the contribution of ionic movement because the frequency was too high and ions could only oscillate without reaching the material-electrode interface.43 According to Fig. 15(b), the dielectric constant increased with an increase in temperature due to the global polarization that appeared from the trapped charge carriers and dipole orientation. The dielectric dispersion increased markedly in the low-frequency region and decreased in the high-frequency region. The plot of the dielectric profile was higher in the low-frequency region and may have been due to the various types of polarization effects. These impacts could be justified by the contribution of one or more of polarization coefficients (e.g., atomic, electronic, interfacial, ionic). The high dielectric constants in the low-frequency region were dependent upon the Na+ orientation, ionic vibrations/movement or space-charge effects. Hence, the higher value of ε′′ in the low-frequency range was possibly due to space-charge effects and electrode polarization, which confirmed non-Debye dependence.44,45
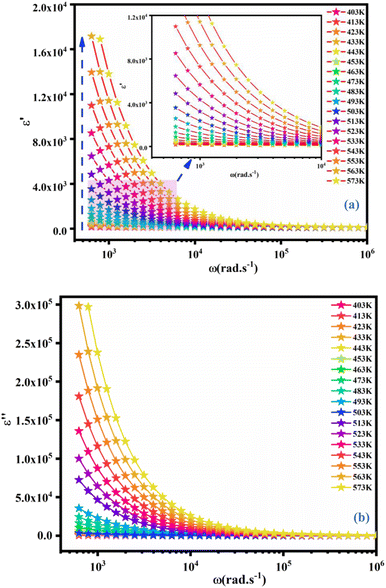 |
| | Fig. 15 Frequency dependence of the real part (ε′) (a) and imaginary (ε′′) part of the complex dielectric permittivity (ε*) at different temperatures for NCG. | |
4 Conclusions
Ceramic NCG was synthesized by a solid-state method and sintered at 1123 K. Characterization by XRD analysis confirmed that the synthesized compound was in a pure single phase without impurities and belonged to the monoclinic Pn space group. The optical properties of the this compound (obtained by UV-vis spectroscopy) revealed the bandgap energy and Urbach energy. Ellipsometric spectroscopy was carried out to determine the refractive index. Electrical properties were studied in detail. The contribution of our material was modeled by an equivalent circuit with a parallel combination of resistance (R), capacitance (C) and capacitance (CPE) in series with another fractal capacitance (CPE). AC conductivity was studied in detail and designated on the basis of the CBH conduction mechanism. Frequency-dependent plots of M′, M′′, (ε′) and the imaginary part (ε′′) of the complex dielectric permittivity (ε*) at different temperatures showed a single relaxation region in NCG.
Conflicts of interest
There are no conflicts of interest.
References
- J. Yan, S. Li, B. Lan, Y. Wu and P. S. Lee, Adv. Funct. Mater., 2020, 30, 1902564 CrossRef CAS.
- S. Chakraborty, A. Banerjee, T. Watcharatharapong, R. B. Araujo and R. Ahuja, J. Phys.: Condens. Matter, 2018, 30, 283003 CrossRef PubMed.
- V. Palomares, P. Serras, I. Villaluenga, K. B. Hueso, J. Carretero-González and T. Rojo, Energy Environ. Sci., 2012, 5, 5884 RSC.
- M. Panda, V. Srinivas and A. K. Thakur, Results Phys., 2015, 5, 136–141 CrossRef.
- M. Panda, V. Srinivas and A. K. Thakur, Appl. Phys. Lett., 2008, 92, 132905 CrossRef.
- L.-L. Zheng, Y. Xue, B.-S. Liu, Y.-X. Zhou, S.-E. Hao and Z. Wang, Ceram. Int., 2017, 43, 4950–4956 CrossRef CAS.
- P. Singh, K. Shiva, H. Celio and J. B. Goodenough, Energy Environ. Sci., 2015, 8, 3000–3005 RSC.
- K. J. McDonald, R. Zhang, C. Ling, L. Q. Zhou, R. Zhang, M. S. Whittingham and H. Jia, J. Mater. Chem. A, 2014, 2, 18428–18434 RSC.
- P. G. Bruce, S. A. Freunberger, L. J. Hardwick and J.-M. Tarascon, Nat. Mater., 2012, 11, 19–29 CrossRef CAS PubMed.
- S. Frostäng, J. Grîns and M. Nygren, J. Solid State Chem., 1988, 72, 92–99 CrossRef.
- N. G. Duderov, L. N. Demianets, A. N. Lobachev, Y. V. Pisarevsky and I. M. Sil'vestrova, J. Cryst. Growth, 1978, 44, 483–491 CrossRef CAS.
- J. H. Joshi, D. K. Kanchan, M. J. Joshi, H. O. Jethva and K. D. Parikh, Mater. Res. Bull., 2017, 93, 63–73 CrossRef CAS.
- J. I. Viegas, R. L. Moreira and A. Dias, Vib. Spectrosc., 2020, 110, 103130 CrossRef CAS.
- S. Ben Yahya, R. Barillé and B. Louati, RSC Adv., 2022, 12, 6602–6614 RSC.
- J. Lv, M. Xu, S. Lin, X. Shao, X. Zhang, Y. Liu, Y. Wang, Z. Chen and Y. Ma, Nano Energy, 2018, 51, 489–495 CrossRef CAS.
- V. Sarritzu, N. Sestu, D. Marongiu, X. Chang, Q. Wang, S. Masi, S. Colella, A. Rizzo, A. Gocalinska, E. Pelucchi, M. L. Mercuri, F. Quochi, M. Saba, A. Mura and G. Bongiovanni, Adv. Opt. Mater., 2018, 6, 1701254 CrossRef.
- P. Kubelka and F. Munk, Leaf Optical Properties, 2019, pp. 455–461 Search PubMed.
- J. H. Joshi, S. Kalainathan, D. K. Kanchan, M. J. Joshi and K. D. Parikh, Arabian J. Chem., 2020, 13, 1532–1550 CrossRef CAS.
- A. Moyez, A. Dhar, P. Sarkar, H. S. Jung and S. Roy, Rev. Adv. Mater. Sci., 2016, 5, 51–64 Search PubMed.
- F. Urbach, Phys. Rev., 1953, 92, 1324 CrossRef CAS.
- A. Jellibi, I. Chaabane and K. Guidara, Phys. E, 2016, 79, 167–172 CrossRef CAS.
- S. H. Wemple and M. DiDomenico, Phys. Rev. Lett., 1969, 23, 1156–1160 CrossRef CAS.
- H. Mahamoud, B. Louati, F. Hlel and K. Guidara, J. Alloys Compd., 2011, 509, 6083–6089 CrossRef CAS.
- A. Ray, A. Roy, S. Bhattacharjee, S. Jana, C. K. Ghosh, C. Sinha and S. Das, Electrochim. Acta, 2018, 266, 404–413 CrossRef CAS.
- P. Ganguly, A. K. Jha and K. L. Deori, Solid State Commun., 2008, 146, 472–477 CrossRef CAS.
- S. Kumari, N. Ortega, A. Kumar, S. P. Pavunny, J. W. Hubbard, C. Rinaldi, G. Srinivasan, J. F. Scott and R. S. Katiyar, J. Appl. Phys., 2015, 117, 114102 CrossRef.
- A. Tataroğlu, İ. Yücedağ and Ş. Altindal, Microelectron. Eng., 2008, 85, 1518–1523 CrossRef.
- D. Das and S. Samanta, ACS Appl. Electron. Mater., 2021, 3, 1634–1647 CrossRef CAS.
- A. K. Jonscher, J. Mater. Sci., 1978, 13, 553–562 CrossRef CAS.
- B. Louati, F. Hlel and K. Guidara, J. Alloys Compd., 2009, 486, 299–303 CrossRef CAS.
- R. H. Chen, R. Y. Chang and S. C. Shern, J. Phys. Chem. Solids, 2002, 63, 2069–2077 CrossRef CAS.
- S. R. Elliott, Adv. Phys., 1987, 36, 135–217 CrossRef CAS.
- R. Punia, R. S. Kundu, M. Dult, S. Murugavel and N. Kishore, J. Appl. Phys., 2012, 112, 083701 CrossRef.
- A. R. Long, Adv. Phys., 1982, 31, 553–637 CrossRef CAS.
- A. A. Dakhel, Solid-State Electron., 2005, 49, 1996–2001 CrossRef CAS.
- A. Zolanvari, N. Goyal and S. K. Tripathi, Pramana, 2004, 63, 617–625 CrossRef CAS.
- C. A. Hogarth, M. H. Islam and A. S. M. S. Rahman, J. Mater. Sci., 1993, 28, 518–528 CrossRef CAS.
- J. H. Joshi, D. K. Kanchan, H. O. Jethva, M. J. Joshi and K. D. Parikh, Ionics, 2018, 24, 1995–2016 CrossRef CAS.
- J. H. Joshi, S. A. M. B. Dhas, D. K. Kanchan, M. J. Joshi and K. D. Parikh, J. Mater. Sci.: Mater. Electron., 2020, 31, 14859–14878 CrossRef CAS.
- F. S. Howell, R. A. Bose, P. B. Macedo and C. T. Moynihan, J. Phys. Chem., 1974, 78, 639–648 CrossRef CAS.
- C. Ang, Z. Yu and L. E. Cross, Phys. Rev. B: Condens. Matter Mater. Phys., 2000, 62, 228–236 CrossRef.
- M. Hema, S. Selvasekerapandian, A. Sakunthala, D. Arunkumar and H. Nithya, Phys. Rev. B: Condens. Matter Mater. Phys., 2008, 403, 2740–2747 CrossRef CAS.
- R. Hajji, A. Oueslati, N. Errien and F. Hlel, Polyhedron, 2014, 79, 97–103 CrossRef CAS.
- I. M. Hodge and C. A. Angell, J. Chem. Phys., 1977, 67, 1647–1658 CrossRef CAS.
- K. K. Srivastava, A. Kumar, O. S. Panwar and K. N. Lakshminarayan, J. Non-Cryst. Solids, 1979, 33, 205–224 CrossRef CAS.
|
| This journal is © The Royal Society of Chemistry 2023 |
Click here to see how this site uses Cookies. View our privacy policy here.  Open Access Article
 *a,
Regis Barilléb and
Bassem Louatia


![[thin space (1/6-em)]](https://www.rsc.org/images/entities/char_2009.gif) cos(θ) and sin(θ), as shown in Fig. 1(b), for different high-intensity peaks provided the crystallite size and strain, respectively. The average crystallite size and strain was found to be L = 68 nm and h = 0.00456, respectively. Furthermore, the low value of a micro-strain indicates a strain-free and narrow size of nanoclusters.12
cos(θ) and sin(θ), as shown in Fig. 1(b), for different high-intensity peaks provided the crystallite size and strain, respectively. The average crystallite size and strain was found to be L = 68 nm and h = 0.00456, respectively. Furthermore, the low value of a micro-strain indicates a strain-free and narrow size of nanoclusters.12


![[thin space (1/6-em)]](https://www.rsc.org/images/entities/char_2009.gif) ln(hν − Eg)
ln(hν − Eg)


 decreased with increasing temperature, which confirmed an increase in the loss of the resistive property of the material as the loss factor linked to 1/Z′′.25 If the frequency of jump electrons corresponds to the frequency of the external field, then relaxation peaks appear.26 The shift of the peak towards a higher frequency as the temperature increases indicates the temperature dependence of the relaxation time. The observed relaxation peaks were larger than the ideal Debye curve, so NCG represented a non-Debye type of relaxation. Displacement of the peaks to higher frequencies as the temperature increased indicated the temperature dependence of the relaxation time. There was good agreement between experimental curves (scatter) and theoretical data (line) (Fig. 7 and 8(a), (b)). This result confirmed that the proposed equivalent circuit described the electrical properties of the material.


 (single-polaron hopping).
 is the maximum value of M′′, which is due to the relaxation of the grains. At various frequencies, the experimental values (scatter) were in good agreement with the theoretical values (line). This result confirmed that the proposed equation described the dielectric relaxation of the material.


 . This phenomenon could be the consequence of rapid polarization without the contribution of ionic movement because the frequency was too high and ions could only oscillate without reaching the material-electrode interface.43 According to Fig. 15(b), the dielectric constant increased with an increase in temperature due to the global polarization that appeared from the trapped charge carriers and dipole orientation. The dielectric dispersion increased markedly in the low-frequency region and decreased in the high-frequency region. The plot of the dielectric profile was higher in the low-frequency region and may have been due to the various types of polarization effects. These impacts could be justified by the contribution of one or more of polarization coefficients (e.g., atomic, electronic, interfacial, ionic). The high dielectric constants in the low-frequency region were dependent upon the Na+ orientation, ionic vibrations/movement or space-charge effects. Hence, the higher value of ε′′ in the low-frequency range was possibly due to space-charge effects and electrode polarization, which confirmed non-Debye dependence.44,45


