 Open Access Article
Study of the electronic effect and quantitative spectra predictions of o-methoxyaniline-terminated monoazonaphthols: a combined experimental and DFT study†
Guoxun Zhu a,
Yan Linb,
Wenxian Zhouc,
Huacan Songa and
Zhengquan Li*a
aGuangdong Provincial Key Laboratory of Chemical Measurement and Emergency Test Technology, Institute of Analysis, Guangdong Academy of Sciences, China National Analytical Centre, Guangzhou, 510070, P. R. China. E-mail: 1539888623@qq.com; lzq@fenxi.com.cn
bFSPG Hi-Tech Co., Ltd, Foshan, 528000, P. R. China
cWINDA OPTO-Electronics Co., Ltd, Foshan, 528136, P. R. China
First published on 17th November 2023
Abstract
A combined experimental and density functional theory (DFT) study on the UV-Vis spectra of o-methoxyaniline-terminated mono azo dyes was conducted. By applying time-dependent-DFT calculations, details of excitation processes were determined and visualization by hole–electron analysis was undertaken. Fragment-divided analysis revealed the contributions of different parts of the structures for the UV-Vis spectra, that richer/poorer electron density on aromatic rings lead to greater/less maximum absorption wavelengths (λmax) and larger/smaller half peak width (W1/2). Combining theoretical prediction with experimental verification, we answered the question of how the electronegativities of substituents affected the electron densities and how it affected the spectra. In addition, a linear model connecting the λmax and W1/2 to the chemical shifts obtained by NMR spectroscopy was constructed, which laid the foundation for construction of a spectral library.
Introduction
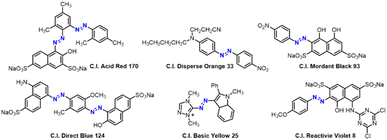
Experimental studies and industrial applications of azo compounds can be dated back to 1863, when Martius and Lightfoot coupled diazonium ions with amines.1 Since then, azo compounds have been prepared in large varieties and huge amounts owing to the ready availability of raw starting materials, simplicities of experimental control, and varieties of synthetic products. Nowadays, azo dyes are the most applied materials among all types of dyestuffs. They account for >50% of known commercial dyes,2 including acid dyes, direct dyes, disperse dye, and reactive dyes (Fig. 1).The hue, saturation, and value of colours are important parameters for controlling the dyeing result, and are closely related to the corresponded UV-absorption spectra. Hence, studies on spectra and designing of dyes have long been the focus of researchers.3a–c
The colours of azo dyes are controlled mainly by the numbers of azo bonds, and fine-tuned by the coupled skeleton and substituted groups. Embedding electron-donating groups (EDGs) on the skeleton can red-shift λmax to larger values, whereas electron-withdrawing groups (EWGs) provide the opposite effect. For instance, transforming nitro functional groups to amino functional groups by reduction reactions can red-shift the λmax by ∼20 nm.4a Wu and coworkers found the λmax of 2,5-dimethyl-4-((4-nitrophenyl)diazenyl)phenol red-shifted from 390 nm to 399 nm after alkylation at the hydroxyl group.4b However, a deeper mechanistic study to provide quantitative predictions was hindered by the diversities of azo skeletal structures, and quantitative analysis has rarely been reported.
With the prosperities of delicate applications of dyes such as dye-sensitized solar cells,5a,b dye-based OLEDs,5c dye-based polarizers,5d and dye-doped liquid crystals,5e,f meticulous theoretical guidance for the prediction of optical properties, such as λmax, peak width, and absorption intensity, is urgently needed. Conversely, the innovation of time-dependent density-functional theory (TD-DFT)6a–c and developments of analytical methods for excited states7a–d have supplied possibilities to establish quantitative relationships between the structure and optical properties of dyes.
In this work, 20 types of mono azo compounds with various substituents embedded on terminated o-methoxyaniline were prepared. Spectra were collected qualitatively and quantitatively, alongside theoretical elaborations of the spectra and excited-state analyses. Through a combined experimental–DFT study, details of spectral constitution were confirmed, and a relatively accurate relationship between substituent and spectral parameters was established. This work showed the good combination of a DFT study and experimental research for spectroscopic analyses. Also, qualitative/quantitative conclusions provided accurate guidance for further structural renovations in more complicated applications.
Experimental section
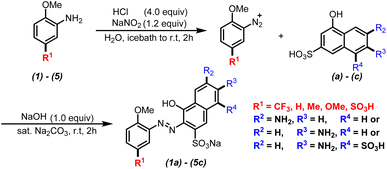
A series of monoazonaphthols were prepared carefully through a diazotization-coupling protocol. Different o-methoxyanilines embedded with functional groups of different electronegativity (2,5-dimethoxyaniline (1), 2-methoxy-5-methylaniline (2), 2-methoxyaniline (3), 2-anisidine-4-sulfonic acid (4), and 2-methoxy-5-(trifluoromethyl)aniline (5)) were diazotized by a reported method8a,b with few modifications. The coupling of the diazonium salt with naphthols such as 6-amino-1-hydroxynaphthalene-3-sulfonic acid (a), 7-amino-1-hydroxynaphthalene-3-sulfonic acid (b), and 2-amino-5-hydroxynaphthalene-1,7-disulfonic acid (c) was done in saturated Na2CO3 solution with stirring for 2 h. Salted-out treatments were applied in the work-up, and mono azo dyes were obtained by centrifugation. All reactions gave products in moderate-to-good yield with good purities (characteristic data are summarized in ESI†) (Scheme 1).Next, the prepared azo compounds were dissolved in buffer (pH = 6.86) made with deionized water to obtain dye solutions at 25 ppm. Notably, samples applied in the quantitative test were purified further by dialysis using a semipermeable membrane (100D) to remove salt completely. UV-Vis spectra were collected in quartz cuvettes (path length = a 10 mm) taking buffer as the reference. Experimental UV-Vis spectra were obtained after normalization to keep the maximum absorption equal to 1 (unless specified otherwise) (Fig. S1 and S2†).
Computational details
DFT and TD-DFT calculations were carried out using the ORCA 5.0 computational suite9a–d applying resolution of identity (RI) approximation (29–30) and tight SCF criteria. Structures were constructed by the Open Babel Program.9e Constructed structures were pre-optimized by the MMFF94 force field.10 Pre-optimized structures were optimized further by the B3LYP functional11a–c using the Ahlrichs double-zeta basis set def2-SVP (standard) and def2-SVP/J (auxiliary),11d combined with the D3 version of Grimme's dispersion.11e,f Frequency analyses were undertaken for optimized structures at the same level and a virtual frequency was not found, which ensured optimization of the structures to a minimum point (more details in ESI†). A CPCM model11g was applied to reproduce the solvent environment. Extractions of energies, thermal-correction values, and coordinates were realized by the Shermo program.9f Wavefunction analyses, including hole–electron analysis and charge-population analysis, were undertaken by the Multiwfn program.9g Analyses of natural bond orbitals were undertaken by the NBO 7.0 program.9h,iOptimized structures were applied for ES study. Excited energies are highly correlated with the Hartree–Fock ratio (HF%) of DFT methods.12 Therefore, a screening of DFT functionals was done. The pure functional TPSS (HF% = 0)11h matched the experimental spectra best (Fig. S5†). Consequently, later analyses of theoretical spectra and ES were all calculated at the TD-TPSS/def2-SVP CPCM (water) level with the def2/J auxiliary basis set and RI approximation. Results calculated at the TD-TPSS/def2-SVP level were applied for wavefunction analyses of excited states.
Results and discussion
Analyses of UV-Vis spectra
With the prepared azo compounds in hand, UV-Vis spectra were collected. The results of λmax are summarized in Table 1. Consistent with literature reports, λmax decreased with the increasing electronegativity of the substituent embedded on o-methoxyanilines. Specifically, λmax varied from 509/541/509 nm to 489/526/488 nm for the coupled product of a/b/c (see each row in Table 1). That is, the electron-donating/-withdrawing effect red-shifted/blue-shifted the λmax by 20 nm for monoazonaphthols. Comparison of the λmax of the coupled product of a, b, and c (see each column in Table 1) revealed that the λmax of 1b–5b was ∼30 nm greater than that of 1a–5a and 1c–5c. Usually, different λmax values suggest discrepancies in structural conjugates or differences in the excitation mechanism. Considering the similarity of structures of these mono azo compounds, we believed that differences in spectral absorption were caused mainly by excitation characteristics.To understand the differences in excitation mechanisms, 3a–c were selected for case study. As shown in Fig. 2a and c, the peaks of 3a and 3c in experimental UV-Vis spectra showed a similar shape. An almost symmetrical peak appeared at 500/499 nm (λmax, Abs. = 1.0) and another weaker absorption signal (Abs. = 0.5) was observed at 304/313 nm. However, 3b featured different absorption properties, with λmax (Abs. = 0.72) settled at 534 nm with a broad band expanded to over 400 nm, and a peak with similar/greater absorption strength appearing at 303/256 nm (Fig. 1b). The broad absorption band and asymmetrical absorption peak indicated that two or more excitation processes may be involved in formation of the maximum absorption peak of 3b. Short waves (<400 nm) corresponded to the generation of high-energy ES, suggesting that 3b preferred to be excited to higher ES.
Theoretical UV-Vis spectra were drawn to test the hypothesis stated above. As shown in Fig. 2b, d, and f, the calculated UV-Vis spectra were generated by overlaying Gaussian-broadening13 curves of oscillatory strength (OS), which reproduced peak shapes and absorption wavelengths qualitatively (more details in ESI†). By referring to these theoretical spectra, three main conclusions could be drawn, as shown below.
(a) The λmax of 3a consisted of the formation of first singlet ES (S1) and second singlet ES (S2) from the ground state (S0), whose corresponding absorption wavelengths were 529 nm and 461 nm, respectively. The theoretical λmax was shifted to 493 nm after a Gaussian-broadening operation of these two signals by overlaying. The absorption occurring at 304 nm in Fig. 1a was mainly attributed to the formation of high-level ES (S0 → S8).
(b) The excitation process changed distinctly in 3b. The OS of S0 → S1 was very low, so the λmax of 3b was mainly supported by S0 → S2. The broad band appearing in the experimental spectra consisted of the formation of numerous and evenly spaced ES which had similar OS. That is, the absorption curve of 3b relied on more ES, and the strong absorption at short wavelengths (303 and 256 nm in Fig. 1c) was contributed by the overlaying of high-level ES.
(c) For 3c, the excitation mechanism was similar to that for 3a. That is, the λmax could be attributed to the excitations of S0 → S1 and S0 → S3, whereas the signal appearing at 313 nm was caused by S0 → S10.
Studies on structural–spectral features
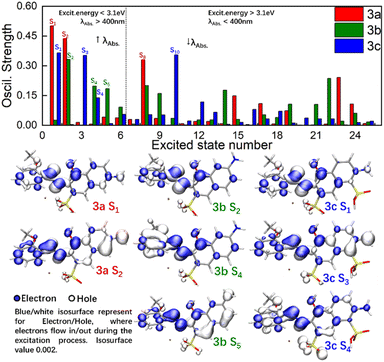
To obtain basic understanding of UV-Vis spectra, more in-depth analyses of the relationships between structures and excitation behaviours were carried out. As shown at the top of Fig. 3, the OS of the lowest 25 excited singlet states of 3a–c were visualized by histograms. Consistent with previous inferences, the OS in 3b was distributed over a wider scope at moderate strength (0.15< OS < 0.30), which gave the Gaussian-broadening curve of 3b a broad shape. Relatively, the OS in 3a/3c was concentrated and at high strength (OS > 0.35), which resulted in narrow and symmetrical absorption signals.Excitation energy is inversely proportional to the absorption wavelength. As a result, the absorption of λmax was determined by ES being lower than S6. Hole–electron analysis was applied to reveal the details of charge transfer among 3a–c during these excitation procedures. Specifically, a hole (Hole) defined the real area where electrons “flow out” whereas an electron (Ele) defined where electrons “flow in”. As shown at the bottom of Fig. 3, Hole and Ele mostly located around the azo nitrogen atoms for 3a S1, 3b S2, and 3c S1, and the shapes of Hole/Ele indicated those ES were mainly excited by a local π–π* transition. However, high-level ES made the absorption of 3b different from that of 3a and 3c. For 3a S2 and 3c S3, Hole was distributed on the naphthol ring and amino functional group, whereas the Ele appeared on the methoxyaniline. This process could be recognized as a charge transfer (CT) process in which electrons were excited from naphthol and transferred to parts of methoxyaniline. The 2,6-substituted (para-) positions of azo and amino groups kept the Hole and Ele far away to the greatest extent in 3a/3c, which increased the dipole moment of CT and made the corresponding OS strong. The 2,7-substituted (meta-) positions of azo and amino groups in 3b reduced the dipole moment of CT and made the excitation process of forming S5 inefficient. A lot of low-efficiency high-energy ES were unneglectable and superimposed together, which elicited complexity to the excitation procedure and resulted in a broad absorption band in 3b.
A fragment-divided study14 was undertaken to investigate the contributions of naphthol (Naph), azo (Azo), and methoxyaniline (Ph) in the excitation process. As shown in Fig. 4, heatmaps using a white-to-black gradient ranging from 0% to 100% were applied to express the contributions of the fragments to Hole and Ele. Through this fragment-divided study, three detailed mechanisms could be postulated, as shown below.
(d) In most cases, Naph was the main contributor for Hole (e.g., S2, S3, S4 in 3a, S1, S3, S5, S6 in 3b, and S3, S4, S5, S6 in 3c). HOMO–LUMO gap is equal to the energy level of HOMO minus the energy level of LUMO. And Hole is the region where electrons flow out, which can be treated approximately as LUMO. As a result, the increase of electronic density in Hole would narrowed energy gap by improving the energies of occupied orbitals, which may redshift λmax. Besides, richer electronic density in Hole would prolong transition dipole moment and lead to the strengthening of corresponded OS, which facilitated the excitation process directly. To summarize, embedding EDG/EWG on Naph would shift λmax to higher/lower value and strengthen/weaken the molar absorbance.
(e) Azo played the role as Ele in most cases, such as S2, S3, S4, S5, S6 in 3a, S3, S4, S5, S6 in 3b, and S3, S4, S5, S6 in 3c. However, in the cases of S1 in 3a, S2 in 3b, and S1 in 3c (which were the key ES contributing for λmax), Azo acted as a Hole. As a result, increasing the electron density of Azo red-shifted the λmax but blue-shifted other absorption bands, leading to broadening of the peak width. Azo was terminated by Naph and Ph at both ends, implying that the electron density of Azo was controlled by Naph and Ph. That is, the richer/poorer electron density on Ph or Naph, the richer/poorer electron density in Azo, resulting in greater/less λmax and larger/smaller peak width.
(f) There was no significant tendency for Ph on the contribution of Hole or Ele during the excitation process. Ph acted as weak Ele where electrons flow into. However, in the cases of S5 in 3a, S4 in 3b, and S6 in 3c, Ph acted as strong donors for Hole. Consequently, the influence of functional groups with different electronegativities embedded on the benzene ring remained uncertain if inspection was done only on Ph.
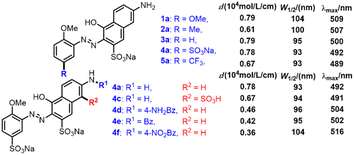
Some additional experiments were carried out to verify the rationality of the inferences we made. Three azo products coupled with amidated J acids were prepared (Scheme 2, 4d–f), and we conducted quantitative UV-Vis spectroscopy of 1–5a and 4c. The results for the molar absorption coefficient (ε), W1/2, and λmax are summarized in Scheme 2. As the electronegativity of the substituents embedded on Ph became stronger from 1a to 5a, the electron density in Ph decreased gradually, leading to the electron density declining in Azo. The descending of W1/2 (1a, 104; 2a, 100; 3a, 95; 4a, 93; 5a, 93 nm) and λmax (1a, 509; 2a, 507; 3a, 500; 4a, 492; 5a, 489 nm) from 1a to 5a verified the correctness of inference (e). Conversely, in the series of 4a and 4d–f, with the decoration of benzoyl functional groups on amino groups, the electron density of Naph fell gradually. The change in ε provided direct evidence of the decrease in OS (4a, 0.78; 4d, 0.46; 4e, 0.42; 4f, 0.36), which was consistent with inference (d) that EWG embedded on Naph led to OS weakening. The slight drop in ε, and the high consistency of W1/2 and λmax of 4a and 4c revealed the poor electron-withdrawing effect of the sulfonic-acid group connected to Naph, which had little influence on the electron density and spectral properties of Naph. All these supplementary experiments supported the conclusions made by hole–electron analysis overall, and verified the key roles of electronegativity in spectral features.
Quantitative predictions of UV-Vis spectra
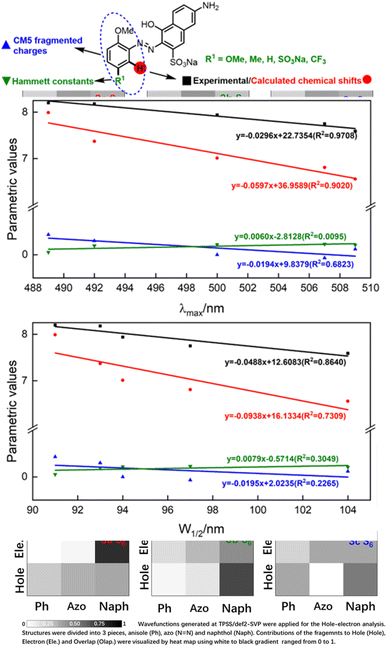
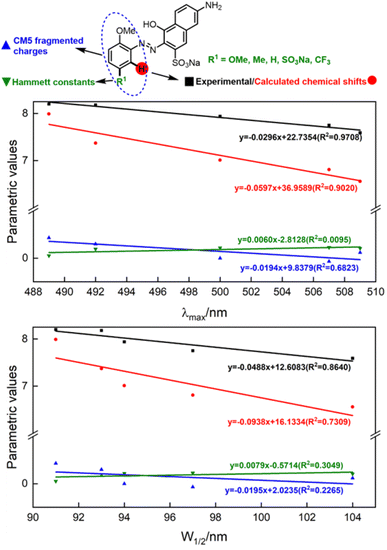
Having qualitatively established the relationship of structure and spectral features, some further works focusing on quantitative predictions of UV-Vis spectra were conducted. As described in inferences (e) and (f), a functional group with different electronegativity embedded on the benzene ring would tune the electron density of azo groups, and influence the UV-Vis spectra. However, quantitative predictions of UV-Vis spectra relied on a robust parametric method to depict the electronegativity of functional groups, which was beyond the scope of the hole–electron analysis.The electron density was the key point of quantitative predictions of UV-Vis spectra, so long-tested Hammett constants15 and CM5 charge populations of the fragments16 were selected as parametric methods. In addition, the NMR shift had been widely applied for characterizing functional-group electronegativity so that EWG shifted the signals to a high field and EDG shifted the signals to a low field. Hence, experimental chemical shifts and calculated chemical shifts17 were also taken into consideration (more details in Fig. S3, S4, and Scheme S3†).
As shown in Fig. 5, λmax and W1/2 were set as x-axes and parametric values were set as y-axes. Comparison of R2 values revealed that the experimental chemical shifts had the best linearity to λmax and W1/2 (R2 = 0.9708 and 0.8640), and the calculated chemical shifts (R2 = 0.9020 and 0.7390) were slightly inferior to the experimental ones. However, Hammett constants and CM5 fragmented charges performed far worse than NMR spectroscopy did. We believe the poor performances of Hammett constants and CM5 fragmented charges were due to the nonlinear relationship between functional-group electronegativity and electron densities of Ph. Also, the chemical shifts obtained by NMR spectroscopy were more closely associated with the electron densities of Ph. As a result, the chemical shifts obtained by NMR spectroscopy performed better in describing the electron densities of aromatic rings and reproducing the influences of the electron effect on UV spectra more precisely.
To conclude, λmax and W1/2 could be described by the experimental chemical shifts (ECS)/calculated chemical shifts (CCS) using the following formula:
| ECS = −0.0296λmax + 22.7354 (R2 = 0.9708) | (a) |
| CCS = −0.0597λmax + 36.9589 (R2 = 0.9020) | (b) |
| ECS = −0.0488W1/2 + 12.6083 (R2 = 0.8640) | (c) |
| CCS = −0.0938W1/2 + 16.1334 (R2 = 0.7309) | (d) |
Regardless of the inferior accuracies, the easy acquisitions of CCS with no need for synthetic operations or expensive equipment would greatly promote construction of a library of spectral parameters. We believe the accuracy would lead to further improvements with the development of better methods for theoretical NMR calculation, which would be of great benefit to the systematic study of azo compounds.
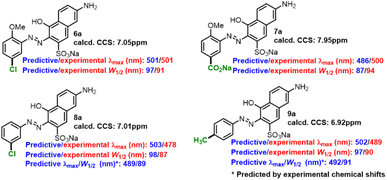
Some compounds (6a–9a) were prepared to verify the applicability of the fitted formulas. The experimental/predictive λmax and W1/2 of some extra-prepared monoazonaphthols were summarized (Scheme 3). The predictions for 6a and 7a had relative high accuracy; the predicted λmax/W1/2 matched with the experimental one with an error of less than 3%/7%. However, the prediction of 8a and 9a had poor precision; λmax and W1/2 were overestimated. Referring to experimental NMR spectra, we found the experimental chemical shifts of 8a and 9a to be 7.79 ppm and 7.59 ppm, respectively, and deviated from the calculated ones (7.01 ppm and 6.92 ppm, respectively). Replacing the calculated chemical shifts with the experimental ones revealed that the errors of the predicted λmax and W1/2 of 8a and 9a decreased obviously. Therefore, we believe that the constructed linear prediction model could act in more general situations if a precise method of NMR calculation was developed. Predicted λmax and W1/2 of other o-methoxyaniline-terminated azo dyes were calculated (more details in ESI†), which laid the foundation for the construction of spectral libraries.
Conclusions
Twenty-two new types of monoazonaphthols were synthesized, and UV-Vis absorption spectra collected. Detailed DFT/TD-DFT calculations were also conducted to elicit in-depth understanding of excitation mechanism. The combined experimental and DFT study revealed excitation details and excitation mechanisms about the formation of UV-Vis spectra, and rationally explained how chemical structures influenced transition dipole moments, excitation behaviours, and spectra features. Fragmented-divided hole–electron analyses revealed the contributions of different fragments to the excitations process, and that naphthol parts provided electrons to transfer into azo N![[double bond, length as m-dash]](https://www.rsc.org/images/entities/char_e001.gif) N double bonds. These findings qualitatively revealed why EDG/EWG decorated naphthol shifted absorption wavelengths to higher/lower values and strengthened/weakened molar absorbance, whereas azo N
N double bonds. These findings qualitatively revealed why EDG/EWG decorated naphthol shifted absorption wavelengths to higher/lower values and strengthened/weakened molar absorbance, whereas azo N![[double bond, length as m-dash]](https://www.rsc.org/images/entities/char_e001.gif) N double bonds with embedded EDG/EWG resulted in greater/less λmax and larger/smaller peak widths. Moreover, a linear model connecting the λmax and W1/2 to NMR chemical shifts was constructed, which showed good accuracies (error < 7%) in the prediction of λmax and W1/2 of o-methoxyaniline-terminated monoazonaphthol. This linear model could be expanded to the prediction of UV-Vis spectra of other aniline-terminated monoazonaphthols with little loss in accuracy. A library of larger compounds and more theoretical NMR calculation methods are under study. We believe this work could pave the way for deeper understanding of the UV-Vis spectra of azo compounds, and bring new insights for parametric description of UV-Vis libraries.
N double bonds with embedded EDG/EWG resulted in greater/less λmax and larger/smaller peak widths. Moreover, a linear model connecting the λmax and W1/2 to NMR chemical shifts was constructed, which showed good accuracies (error < 7%) in the prediction of λmax and W1/2 of o-methoxyaniline-terminated monoazonaphthol. This linear model could be expanded to the prediction of UV-Vis spectra of other aniline-terminated monoazonaphthols with little loss in accuracy. A library of larger compounds and more theoretical NMR calculation methods are under study. We believe this work could pave the way for deeper understanding of the UV-Vis spectra of azo compounds, and bring new insights for parametric description of UV-Vis libraries.
Conflicts of interest
There are no conflicts of interest to declare.Acknowledgements
This work was supported by the Special Fund Projects of Guangdong Academy of Sciences for the Construction of Domestic First-class Research Institutions (2021GDASYL-20210103035).Notes and references
- A. Bafana, S. S. Devi and T. Chakrabarti, Environ. Rev., 2011, 19, 350–370 CrossRef CAS.
- R. B. Chavan, Handbook of Textile and Industrial Dyeing (in Woodhead Publishing Series in Textiles). Principles, Processes and Types of Dyes, 2011, vol. 1, pp. 515–561 Search PubMed.
- For selected papers on spectra studies and dyes designing, see: (a) S. Benkhaya, S. M' rabet and A. El Harfi, Inorg. Chem. Commun., 2020, 115, 107891 CrossRef CAS; (b) H. A. Shindy, Dyes Pigm., 2017, 145, 505–513 CrossRef CAS; (c) S. Shahab, F. H. Hajikolaee, L. Filippovich, M. Darroudi, V. A. Loiko, R. Kumar and M. Y. Borzehandani, Dyes Pigm., 2016, 129, 9–17 CrossRef CAS.
- For selected patents or papers on redshift or blueshift control of dyes, see: (a) G. Zhu, J. Jiang, Z. Li, H. Song and Y. Zeng, 2022, CN114539803A; (b) B. Chen, S. Ni, L. Sun, X. Luo, Q. Zhang, Y. Song, Q. Zhong, Y. Fang, C. Huang, S. Chen and W. Wu, Dyes Pigm., 2018, 158, 474–481 CrossRef CAS.
- For selected papers on recent applications of dyes, see: (a) J. Gong, K. Sumathy, Q. Qiao and Z. Zhou, Renewable Sustainable Energy Rev., 2017, 68, 234–246 CrossRef CAS; (b) G. Richhariya, A. Kumar, P. Tekasakul and B. Gupta, Renewable Sustainable Energy Rev., 2017, 69, 705–718 CrossRef CAS; (c) K.-H. Kim, S. Lee, C.-K. Moon, S.-Y. Kim, Y.-S. Park, J.-H. Lee, J. W. Lee, J. Huh, Y. You and J.-J. Kim, Nat. Comm., 2014, 5, 4769 CrossRef CAS PubMed; (d) J. B. Chang, J. H. Hwang, J. S. Park and J. P. Kim, Dyes Pigm., 2011, 88(3), 366–371 CrossRef CAS; (e) N. Mochizuki, T. Ishinabe, D. Fujiwara, D. Nakamura, N. Koma and H. Fujikake, ITE Trans. Media Technol. Appl., 2018, 6(4), 262–268 Search PubMed; (f) K. Nobuhiro and F. Keita, Chem. Lett., 2005, 34, 558–559 CrossRef.
- Reviews on the developments of TD-DFT studies, see: (a) A. D. Laurent, C. Adamo and D. Jacquemin, Phys. Chem. Chem. Phys., 2014, 15, 14334–14356 RSC; (b) A. D. Laurent and D. J. Jacquemin, J. Quantum Chem., 2013, 113(17), 2019–2039 CrossRef CAS; (c) A. Drzewiecka-Matuszek and D. Rutkowska-Zbik, Molecules, 2021, 26(23), 7176 CrossRef CAS PubMed.
- For selected papers on recent developments of analytical methods for TD-DFT calculations, see: (a) M. Nakano, H. Fukui, T. Minami, K. Yoneda, Y. Shigeta, R. Kishi, B. Champagne, E. Botek, T. Kubo, K. Ohta and K. Kamada, Theor. Chem. Acc., 2011, 130, 711–724 Search PubMed; (b) M. Campetella, F. Maschietto, M. J. Frisch, G. Scalmani, I. Ciofini and C. Adamo, J. Comput. Chem., 2017, 38, 2151–2156 CrossRef CAS PubMed; (c) T. L. Bahers, C. Adamo and I. Ciofini, J. Chem. Theory Comput., 2011, 7, 2498–2506 CrossRef PubMed; (d) Z. Liu, T. Lu and Q. Chen, Carbon, 2020, 165, 461–467 CrossRef CAS.
- Reported methods about diazotization control, see: (a) W. Chen, P. Gao, H. Jiang and Z. Cui, Dyes Pigm., 2019, 168, 300–310 CrossRef CAS; (b) Q. Guo, W. Chen, P. Gao, J. Zheng, H. Jiang and Z. Cui, Dyes Pigm., 2022, 204, 110469 CrossRef CAS.
- Software and program involved in this paper, see: (a) F. Neese, Wiley Interdiscip. Rev.: Comput. Mol. Sci., 2012, 2, 73–78 CAS; (b) F. Neese, Wiley Interdiscip. Rev.: Comput. Mol. Sci., 2018, 8, e1372 Search PubMed; (c) F. Neese, F. Wennmohs, U. Becker and C. Riplinger, J. Chem. Phys., 2020, 152, 224108 CrossRef CAS PubMed; (d) F. Neese, Wiley Interdiscip. Rev.: Comput. Mol. Sci., 2022, 12(5), e1606 Search PubMed; (e) N. M. O'Boyle, M. Banck, C. A. James, C. Morley, T. Vandermeersch and G. R. Hutchison, J. Cheminf., 2011, 3, 33 CrossRef; (f) T. Lu and Q. Chen, Comput. Theor. Chem., 2021, 1200, 113249 CrossRef CAS; (g) T. Lu and F. Chen, J. Comput. Chem., 2012, 33, 580–592 CrossRef CAS; (h) E. D. Glendening, C. R. Landis and F. Weinhold, J. Comput. Chem., 2019, 40, 2234–2241 CrossRef CAS PubMed; (i) E. R. Alan and W. J. Frank, Chem. Phys., 1983, 78, 4066–4073 Search PubMed.
- T. A. Halgren, J. Comput. Chem., 1996, 17, 490–519 CrossRef CAS.
- Methods applied in DFT calculations, see: (a) A. D. Becke, J. Chem. Phys., 1993, 98, 5648–5652 CrossRef CAS; (b) C. Lee, W. Yang and R. G. Parr, Phys. Rev. B: Condens. Matter Mater. Phys., 1988, 37, 785–789 CrossRef CAS PubMed; (c) B. Miehlich, A. Savin, H. Stoll and H. Preuss, Chem. Phys. Lett., 1989, 157, 200–206 CrossRef CAS; (d) F. Weigend and R. Ahlrichs, Phys. Chem. Chem. Phys., 2005, 7, 3297–3305 RSC; (e) S. Grimme, J. Antony, S. Ehrlich and H. Krieg, J. Chem. Phys., 2010, 132, 154104 CrossRef PubMed; (f) S. Grimme, S. S. Ehrlich and L. Goerigk, J. Comput. Chem., 2011, 32, 1456–1465 CrossRef CAS PubMed; (g) V. Barone and M. Cossi, J. Phys. Chem. A, 1998, 102, 1995 CrossRef CAS; (h) J. Tao, J. P. Perdew, V. N. Staroverov and G. E. Scuseria, Phys. Rev. Lett., 2003, 91, 146401 CrossRef PubMed.
- G. Zhu, Z. Chen, H. Song, A. You and Z. Li, RSC Adv., 2022, 12, 18238 RSC.
- M. J. Hollas, Modern Spectroscopy, Wiley, 3rd edn, 1996, pp. 30–34 Search PubMed.
- Recent papers applying Hole-Electron analysis disclosing excitation features, see: (a) S. Chen, N. Ullah and R. Zhang, J. Phys. Chem. Lett., 2018, 9, 4857 CrossRef CAS PubMed; (b) X. Tang, L.-S. Cui, H.-C. Li, A. J. Gillett, F. Auras, Y.-K. Qu, C. Zhong, S. Jones, Z.-Q. Jiang, R. H. Friend and L.-S. Liao, Nat. Mater., 2020, 19, 1332 CrossRef CAS PubMed; (c) X. Wang, Z. Liu, X. Yan, T. Lu, H. Wang, W. Xiong and M. Zhao, Phys. Chem. Chem. Phys., 2022, 24, 7466 RSC.
- C. Hansch, A. Leo and R. W. Taft, Chem. Rev., 1991, 91(2), 165–195 CrossRef CAS.
- A. V. Marenich, S. V. Jerome, C. J. Cramer and D. G. Truhlar, J. Chem. Theory Comput., 2012, 8(2), 527–541 CrossRef CAS PubMed.
- M. T. Oliveira, J. M. A. Alves, A. A. C. Braga, D. J. D. Wilson and C. A. Barboza, J. Chem. Theory Comput., 2021, 17(11), 6876–6885 CrossRef PubMed.
Footnote |
| † Electronic supplementary information (ESI) available: Detailed results and coordinates of the optimized species. See DOI: https://doi.org/10.1039/d3ra05518c |
| This journal is © The Royal Society of Chemistry 2023 |

