 Open Access Article
Function of Brønsted and Lewis acid sites in xylose conversion into furfural
Denis A. Cabrera-Munguiaa,
Aída Gutiérrrez-Alejandre b,
Adolfo Romero-Galarza
 *a,
Thelma K. Morales-Martíneza,
Leopoldo J. Ríos-Gonzáleza and
Jesús Sifuentes-Lópezc
aFacultad de Ciencias Químicas, Universidad Autónoma de Coahuila, Ing. J. Cárdenas s/n, Saltillo, Coahuila 25280, Mexico. E-mail: a_romero@uadec.edu.mx; Tel: +52 8441894706
bUNICAT, Depto. de Ingeniería Química, Facultad de Química, UNAM, Ciudad de México 04510, Mexico
cFacultad de Ingeniería Mecánica y Eléctrica, Universidad Autónoma de Coahuila, Carretera Torreón-Matamoros km 7.5 CU, Torreón, Coahuila 27087, Mexico
First published on 18th October 2023
Abstract
In this work, the xylose conversion and the selectivity to furfural were assessed over mesoporous sulfonic silica SBA-15-(X)SO3H catalysts doped with metal ions (X = Al(III), Ti(IV) or Zr(IV)). The type and amount of acid sites were analyzed by adsorption of pivalonitrile. The SBA-15-(X)SO3H materials show Lewis acid sites (LAS) and two types of Brønsted acid sites (BAS) with different strengths. Type I (BAS I) belongs to terminal silanol groups, type II (BAS II) is ascribed to hydroxyl groups bonded to sulfur or transition metal, and the LAS is related to M–O bonds. Optimal reaction conditions for the most active catalyst (SBA-15-(Zr)SO3H) were 120 minutes of reaction at 160 °C, 20 wt% of catalyst, and 2.5% of xylose/solvent. Additionally, a kinetic study was carried out to calculate the rate constants, the activation energy, and the pre-exponential factor for the xylose dehydration reaction. It was found that the selectivity to furfural in sulfonic silica SBA-15-(X)SO3H catalysts was directly related to the BAS II fraction. While LAS negatively impacts the selectivity to furfural leading to the undesired reaction between furfural and xylose obtaining humins as secondary products.
Introduction
The development of sustainable and economic processes to produce fuels and high-value chemical products has attracted attention in recent years to mitigate the current environmental problem of global warming due to the excessive use of fossil fuels and products.1 An attractive strategy to lessen dependence on fossil resources is the use of lignocellulosic biomass as a raw material for the substitution of petroleum-derived precursors for chemical products generated from ecological processes.2 Lignocellulosic biomass consists of three main components: cellulose, hemicellulose, and lignin.2 Furfural is produced by the dehydration of xylose, which is obtained from the depolymerization of hemicellulose through a sequence of cascade reactions3,4 Furfural is a valuable molecule, which could be used for the synthesis of high value-added compounds capable of substituting chemical products derived from petroleum5–9 such as 2-methyl furan, furfuryl alcohol, levulinic acid, tetrahydrofuran, and γ-valerolactone.Furfural is usually obtained industrially by using HCl or H2SO4 as a monofunctional acid catalyst.7,8,10 A high furfural yield (greater than 61 mol%) can be obtained when these mineral acids are used as catalysts.11,12 However, there are some drawbacks, the mineral acids are harmful to the environment, are highly corrosive towards the reaction equipment,13 and lead to undesired side reactions. On the other hand, monofunctional catalysts are not efficient when the process involves multiple-step reactions.14 The conversion of xylose to furfural could proceed in two steps the isomerization of xylose to xylulose, which is catalyzed by the Lewis acid sites, followed by xylulose dehydration to furfural that is promoted by the Brønsted acid sites.15 Hence, one of the goals is to achieve economically viable furfural production through a one-pot reactor using a heterogeneous catalyst system that is environmentally friendly while controlling unwanted secondary reactions. Within this context, bifunctional solid acid catalysts emerge as an attractive alternative for performing sequential-type reactions in a single pot, due to their low corrosion, excellent selectivity, and easy recovery,16,17 their catalytic activity needs to be improved to meet the requirements of furfural production at industrial scale.
One of the main factors to improve yields in the production of furfural from xylose has been the implementation of new reaction systems, employing bifunctional solid catalysts which are designed to increase the selectivity towards desired product, simplifying the process.14 Among Brønsted and Lewis acid bifunctional catalysts, we have heterogeneous acid catalysts such as resins, zeolites, sulfonated metals, and heteropoly acids, among others.18–22 As well as the use of reaction media with organic solvents from biomass1,23 such as γ-valerolactone, which has shown efficiency in the production of furfural when used as reaction medium in combination with water8 reporting an optimal mm ratio of 9![[thin space (1/6-em)]](https://www.rsc.org/images/entities/char_2009.gif) :
:![[thin space (1/6-em)]](https://www.rsc.org/images/entities/char_2009.gif) 1 respectively, obtaining 80 mol% yield of furfural from xylose.23 Bhaumik et al.24 reached 61 mol% yields of furfural from xylan with WO3/SiO2 as a catalyst in a biphasic water/toluene solvent system at 170 °C for 8 h.
1 respectively, obtaining 80 mol% yield of furfural from xylose.23 Bhaumik et al.24 reached 61 mol% yields of furfural from xylan with WO3/SiO2 as a catalyst in a biphasic water/toluene solvent system at 170 °C for 8 h.
Furfural production is based on acid-catalyzed dehydration of xylose. So, efforts have recently focused on optimizing the balance between Lewis and Brønsted acid sites.18 Researchers have reported modifications to SBA-15 to be used as a catalyst in xylose dehydration reactions for furan production25 since SBA-15 is a material that exhibits high hydrothermal stability, large surface area, adjustable pore size, and ordered mesoporous structures.26,27 It is well known that Brønsted acid sites on SBA-15 are crucial to produce furfural from xylose23 and some previous studies have shown that the incorporation of functional organic groups such as sulfones and phosphates, as well as the incorporation of metal ions to SBA-15, increases the catalytic behavior due to its acid properties.28,29 Otherwise, the incorporation of Al3+ leads to the formation of Brønsted and Lewis acidity,30–32 whereas the addition of Ti4+ into the SBA-15 by the condensation method mainly favors Lewis acid sites.33,34
Although it is known that the incorporation of transition metals such as Al(III) or Ti(IV), as well as the incorporation of sulfonic groups, enhances the surface acidity of SBA-15, it is still unknown the role of Brønsted and Lewis of these catalysts over the reaction pathway of xylose conversion to furfural. Thus, the aim of this work is a systematic study of physicochemical properties of the SBA-15-(X)SO3H doped with Al(III), Ti(IV), and Zr(IV) with emphasis on the bifunctionality of the catalysts on their surface acidity (Brønsted and Lewis) studied by adsorption of pivalonitrile, which is adsorbed on strong and weak acid sites, to correlate the effect of the metal ion on their acid properties and also, with the xylose conversion and furfural selectivity to select the best catalyst. The best operation conditions on a one-pot reactor were established: temperature, reaction time, xylose, and catalyst dosage. Then, a kinetic model was used to evaluate the specific reaction rate, activation energy, and pre-exponential factor of the reactions involved in the reaction pathway from xylose conversion to furfural; where every probable reaction was related to the presence of Brønsted and Lewis acid sites present in this type of catalyst.
Experimental
Materials
Xylose (99%), γ-valerolactone (99%), poly(ethylene glycol)-block-poly(propylene glycol)-block-poly (ethylene glycol) = pluronic 123 (P123), sodium chloride (NaCl), hydrogen peroxide (H2O2) (30%) tetraethyl orthosilicate (TEOS) (98%), (3-mercaptopropyl)trimethoxysilane (MPTMS) (95%), titanium(IV) isopropoxide (TiO4(i-Pr)4, 97%), aluminum isopropoxide (AlO3(i-Pr)3, 98%), zirconyl chloride octahydrate (ZrOCl2·8H2O, 99%). All chemicals used were of analytical grade and were purchased from Sigma Aldrich.Catalysts synthesis
Catalyst preparation was carried out by in situ sol–gel method, following a procedure already reported.31 The prepared catalysts were SBA-15, SBA-15-SO3H, and SBA-15-(X)SO3H where X = Al(III), Ti(IV) or Zr(IV). The following molar ratios were used: 0.019![[thin space (1/6-em)]](https://www.rsc.org/images/entities/char_2009.gif) :
:![[thin space (1/6-em)]](https://www.rsc.org/images/entities/char_2009.gif) P123/0.1
P123/0.1![[thin space (1/6-em)]](https://www.rsc.org/images/entities/char_2009.gif) :
:![[thin space (1/6-em)]](https://www.rsc.org/images/entities/char_2009.gif) MPTMS/147
MPTMS/147![[thin space (1/6-em)]](https://www.rsc.org/images/entities/char_2009.gif) :
:![[thin space (1/6-em)]](https://www.rsc.org/images/entities/char_2009.gif) H2O/1
H2O/1![[thin space (1/6-em)]](https://www.rsc.org/images/entities/char_2009.gif) :
:![[thin space (1/6-em)]](https://www.rsc.org/images/entities/char_2009.gif) TEOS/0.54
TEOS/0.54![[thin space (1/6-em)]](https://www.rsc.org/images/entities/char_2009.gif) :
:![[thin space (1/6-em)]](https://www.rsc.org/images/entities/char_2009.gif) HCl/1.8
HCl/1.8![[thin space (1/6-em)]](https://www.rsc.org/images/entities/char_2009.gif) :
:![[thin space (1/6-em)]](https://www.rsc.org/images/entities/char_2009.gif) H2O2/1
H2O2/1![[thin space (1/6-em)]](https://www.rsc.org/images/entities/char_2009.gif) :
:![[thin space (1/6-em)]](https://www.rsc.org/images/entities/char_2009.gif) NaCl/0.1
NaCl/0.1![[thin space (1/6-em)]](https://www.rsc.org/images/entities/char_2009.gif) :
:![[thin space (1/6-em)]](https://www.rsc.org/images/entities/char_2009.gif) AlO3(iPr)3;0.1
AlO3(iPr)3;0.1![[thin space (1/6-em)]](https://www.rsc.org/images/entities/char_2009.gif) :
:![[thin space (1/6-em)]](https://www.rsc.org/images/entities/char_2009.gif) TiO4(i-Pr)4; 0.1
TiO4(i-Pr)4; 0.1![[thin space (1/6-em)]](https://www.rsc.org/images/entities/char_2009.gif) :
:![[thin space (1/6-em)]](https://www.rsc.org/images/entities/char_2009.gif) ZrOCl2·8H2O.
ZrOCl2·8H2O.
To prepare SBA-15, NaCl and P123 were dissolved in an HCl solution (0.2 mol L−1) at 40 °C and the mixture was kept at this temperature for 3 h, then TEOS was added dropwise. In the case of SBA-15-SO3H, the same procedure was followed, but after 2 h of the TEOS addition, a mixture of MPTMS and H2O2 was added.
The synthesis of SBA-15-(X)SO3H samples involves the same procedure as SBA-15, but after 2 h of the TEOS addition, the metal precursor was added (AlO3(i-Pr)3, TiO4(i-Pr)4 or ZrOCl2·8H2O) allowing it to hydrolyze for 2 h. After that, the mixture of MPTMS-H2O2 was added.
In all cases, after the last step, it allows the polymerization and condensation reactions during 24 h with stirring at 40 °C. Afterward, the solution was placed in polypropylene bottles and aged at 100 °C under static conditions for 24 h. The solution was filtered to obtain a white material which was washed with distilled water and dried for 12 h at 80 °C. The material was then weighed and for each gram of material obtained, 50 mL of ethanol was added to be placed in a reflux system at 80 °C for 24 h. Finally, the above solution was filtered and dried at 80 °C for 12 h. It is worth mentioning that all materials were dried at 100 °C before the catalytic activity tests.
Catalysts characterization
The X-ray diffraction patterns of the samples were measured in a PANalytical Empyrean using Kα radiation (λ = 1.54056 Å) at 40 kV and 30 mA. The data were recorded in a 2θ range between 10 to 80° with a step size of 0.026° and a counting time of 0.4 seconds per step. Small angle X-ray diffractograms (SAXRD) were obtained with an XRD Anton-Par SAXSess-Emc2 equipment using Cu Kα radiation (λ = 1.54056 Å), between 0.5° ≤ 2θ ≤ 2°. The unit cell parameter a0 (Table 1) was calculated from a0 = 2d100/√3.35,36 Thermogravimetric analysis (TGA) was conducted in a PerkinElmer TGA 4000 thermogravimetric analyzer. TG curves were obtained under a dynamic atmosphere of nitrogen (20 mL min−1), a heating rate of 20 °C min−1 from 30 to 800 °C, with a change of gas to oxygen (20 mL min−1) when the temperature was equal to or greater than 700 °C. The infrared experiments were performed in a PerkinElmer Frontier FT-IR spectrometer equipped with a diamond crystal; the spectra were collected in a range from 4000 to 600 cm−1 at 16 cm−1 of resolution using an average of 16 scans in an attenuated total reflectance (ATR) mode. The textural properties: surface area, and pore diameter of the catalysts were analyzed by nitrogen physisorption at −196 °C from the BET and the BJH method, respectively; in a Quanta Chrome Autosorb iQ instrument. Before the measurements, the samples were degassed under vacuum at 100 °C for 10 h. The SEM-EDS analysis was performed with a JEOL JSM-7600F analytical electron microscope. At the conditions used, the depth of analysis was 2 μm model operated at 5 kV. Surface acidity was studied by adsorption of pivalonitrile, pressed disks of the pure catalyst powders were made, placed into the IR cell, and then outgassed at 200 °C for 2 h. After that, a pulse of pivalonitrile (6 Torr) was introduced at room temperature, and IR spectra were collected outgassing at room temperature and 120 °C for 15 min. Experiments were performed with an FTIR Nicolet 6700 spectrophotometer, with a resolution of 4 cm−1 and 100 scans per spectrum. All spectra obtained were normalized to a weight of 10 mg cm−2. X-ray photoelectron spectroscopy (XPS) assessments of the samples doped with Al, Ti, and Zr were carried out on a JPS-9200 spectrometer from JEOL using a monochromatic Al-Kα source (1486.6 eV). Charge correction was carried out taking the adventitious carbon signal C 1s at 285 eV. XPS data processing was performed using the AANALYZER version 2.25 RDATAA (robust data analysis) interactive least-square software. The elemental analysis of carbon, hydrogen, and sulfur was done using 15 mg of fresh and used catalyst, the sample was burned until combustion in a PerkinElmer PE2400 elemental analyzer using as calibration compounds cystine, acetanilide, and sulfamic acid. In addition, the microanalysis of the fresh and used catalyst to measure the percentage of silicon, oxygen, zirconium, and sulfur was done using energy dispersive spectroscopy (EDS) in an Oxford Aztec 100 instrument.| Catalyst | Parameter a0 (Å) | Specific surface area (m2 g−1) | Pore diameter (nm) |
|---|---|---|---|
| SBA-15 | 129 | 465 | 5.2 |
| SBA-15-SO3H | 134 | 618 | 6.5 |
| SBA-15-(Al)SO3H | 131 | 596 | 6.6 |
| SBA-15-(Ti)SO3H | 134 | 674 | 5.6 |
| SBA-15-(Zr)SO3H | 134 | 693 | 6.6 |
Catalytic conversion of xylose into furfural
The reactions were carried out in a batch Parr reactor. In standard conditions, 0.23 g of xylose, GVL/H2O (mm = 9![[thin space (1/6-em)]](https://www.rsc.org/images/entities/char_2009.gif) :
:![[thin space (1/6-em)]](https://www.rsc.org/images/entities/char_2009.gif) 1, 10 g in total), and 0.023 g of catalyst were charged into the reactor. The air in the reactor was purged with nitrogen and the initial pressure at 5 atm, followed by programmed heating up to the target temperature (140–180 °C) for a set reaction time (60–180 min). The stirring speed was 600 rpm. After the reaction time finished, an ice bath was used to cool the reactor to room temperature. The liquid obtained during the process was filtered through PVDF filters (polyvinylidene fluoride) of 0.22 μ and deposited into amber vials for GC and HPLC analysis.
1, 10 g in total), and 0.023 g of catalyst were charged into the reactor. The air in the reactor was purged with nitrogen and the initial pressure at 5 atm, followed by programmed heating up to the target temperature (140–180 °C) for a set reaction time (60–180 min). The stirring speed was 600 rpm. After the reaction time finished, an ice bath was used to cool the reactor to room temperature. The liquid obtained during the process was filtered through PVDF filters (polyvinylidene fluoride) of 0.22 μ and deposited into amber vials for GC and HPLC analysis.
Furfural concentrations were analyzed in a gas chromatograph equipped with a flame ionization detector (FID) and a BR-SWax column, N2 was used as the mobile phase with a flow of 0.8 mL min−1, the detector was set at 300 °C and the column temperature was 222 °C. To determine xylose concentrations, samples were analyzed on an HPLC instrument (Agilent 1260) equipped with a refractive index detector and a Hi-Plex H column at 35 °C. As a mobile phase, a 5 mmol L−1 H2SO4 solution was used with a flow rate of 0.5 mL min−1. The column oven and the RID were kept at 35 °C and 45 °C, respectively. The xylose conversion, furfural yield, and furfural selectivity were calculated as follows:37,38
 | (1) |
 | (2) |
 | (3) |
Results and discussion
Crystal, textural, and morphological properties
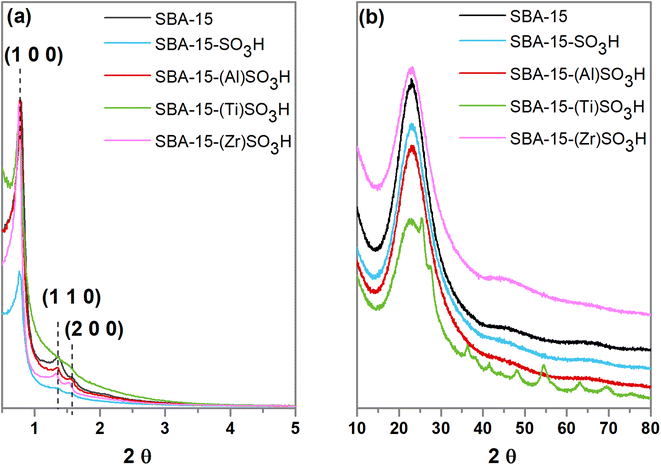
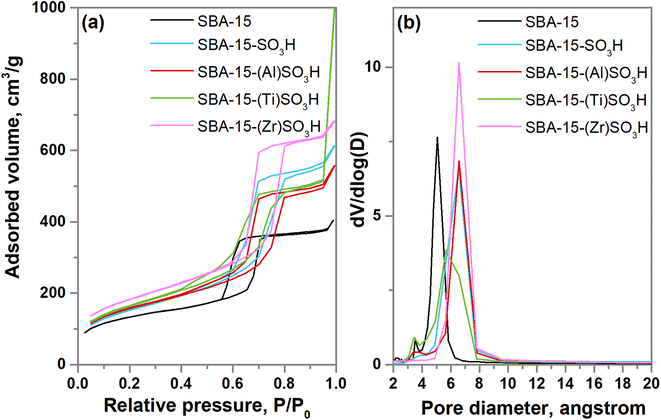
Small and wide angle XRD patterns of SBA-15-(X)SO3H materials are shown in Fig. 1a. The XRD diffractograms at small angle showed three peaks at 2θ = 0.8°, 1.4° and 1.6° related to the planes (1 0 0) (1 1 0) and (2 0 0) which are associated with a P6mm hexagonal arrangement (PDF 58-0344).31,32,39,40 The incorporation of sulfonic groups in the SBA-15-SO3H sample generates an XRD pattern of less intensity and a small shift of the main peak to lower angles31 suggesting a small loss of ordered mesoporosity and an increase in the unit cell parameter a0. In addition, the reflections (1 1 0) and (2 0 0) are not present in SBA-15-(Ti)SO3H which is attributed to a decrease in the wall thickness resulting in a partial destruction of the pore structure.31 The wide angle XRD diffractograms (Fig. 1b) depict the typical broad brand between 2θ values at 20° and 30°, with a maximum at 22.9° associated with the amorphous silica walls.41,42 However, SBA-15-(Ti)SO3H shows diffraction peaks at 2θ = 25.5°, 27.6°, 36.2°, 41.2°, 48.2°, 54.4°,63.1° and 69.4° related to TiO2 nanoparticles, in anatase phase, that were not incorporated into the SBA-15 framework (JCPDS 01-073-1764).43,44The N2 physisorption isotherms of doped SBA-15-SO3H are depicted in Fig. 2a. In general, the adsorption–desorption isotherms are considered type IVa, and according to IUPAC classification belong to mesoporous materials, where the capillary condensation is accompanied by hysteresis loop, this characteristic is related to the adsorption system, in the case of nitrogen adsorption, the hysteresis starts for pores wider than 4 nm.45 Regarding the hysteresis loop, the SBA-15-SO3H materials doped with transitional metals showed a type I hysteresis loop at relative pressures of around 0.6–0.8 which are related to the narrow range of uniform cylindrical pores.39,46,47 The addition of Ti(IV) in the SBA-15-(Ti)SO3H sample seems to modify the hysteresis loop showing a two-step desorption brand (type II hysteresis) associated with the existence of bottleneck mesoporous and the pore blocking by TiO2 nanoparticles reducing the pore diameter, which is in line with the wide angle XRD patterns, and the pore diameter distribution depicted in Fig. 2b.31,46,47
The specific surface area and the average pore size of doped SBA-15-SO3H catalysts were calculated from the BET and BJH methods (Table 1). The incorporation of sulfonic groups and metal ions increases the specific surface area of SBA-15 up to 30% and provokes an increment of 27% of the pore diameter this probably obeys the substitution of silicon by the larger covalent radius of metal ions and the enlargement of the unit cell when isopropyl sulfonic groups replace oxygen atoms in the SBA-15 structure. An exception is the SBA-15-(Ti)SO3H catalyst whose increment was only 8% possibly due to the pore blocking by TiO2 nanoparticles, as it is observed in the hysteresis loop and the XRD results.
Table 2 shows the Si/X and Si/S molar ratios obtained by EDS. The Si/X molar ratios obtained for each metal ion indicate the amount of each metal ion incorporated into the SBA-15 framework as well as possible metal oxides deposited externally on the surface. In agreement with the XRD results the low Si/Ti molar ratio is mainly associated with the deposition of TiO2 nanoparticles on the material surface as the XRD results showed, but also, to incorporation of Ti(IV) into the SBA-15 framework. In the case of SBA-15-(Al)SO3H and SBA-15-(Zr)SO3H, the XRD results indicated that the Si/X molar ratio calculated obeys internal metal ions of Al(III) and Zr(IV) incorporated into the SBA-15 framework which is in line with the increment in the surface area and pore diameter of these materials. The Si/Zr molar ratio found in SBA-15(Zr)SO3H is in good agreement with the literature.31,48 On the contrary, the addition of Al(III) into the SBA-15 structure is almost ten times lower than expected, this can be attributed to the high solubility of Al(III) in the gel under acid conditions, where a low pH value is beneficial for maintaining the mesostructured of SBA-15.49,50 In the case of the Si/S molar ratio, the percentage of sulfur incorporation in all samples is around 53% and 67%, but also, the incorporation of ion metals enhances the addition of sulfonic groups as previously reported.31,36
| Catalyst | Si/X | Si/S |
|---|---|---|
| SBA-15 | — | — |
| SBA-15-SO3H | — | 19 |
| SBA-15-(Al)SO3H | 114 | 17 |
| SBA-15-(Ti)SO3H | 9 | 15 |
| SBA-15-(Zr)SO3H | 22 | 18 |
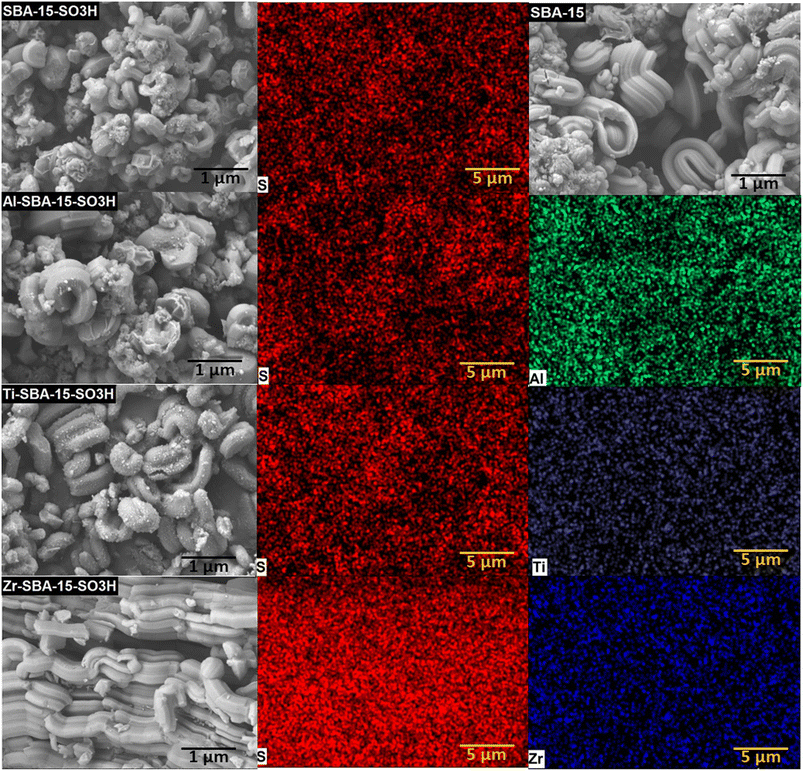
The SEM micrographs of SBA-15-(X)SO3H catalysts showed that all samples possess a wheat-like structure of SBA-15 (Fig. 3),51,52 composed of small cylinders or rod-shaped aggregates. However, the micrograph of SBA-15-SO3H shows rod-like aggregates of smaller size than SBA-15 material, which is attributed to the low mesoscopic order found in the small angle XRD pattern of this material.31 The SEM micrographs of SBA-15-(Al)SO3H and SBA-15-(Ti)SO3H also presented small spheroidal particles due to the incorporation of metal particles,40,42 in the case of SBA-15-(Ti)SO3H, the amount of this particles is more evident, which is in line with the XRD and N2 physisorption results. Also, the micrograph of SBA-15-(Zr)SO3H shows a more ordered wheat-like macrostructure with elongated rod-shaped aggregates that are systematically agglomerated to form ropelike domains.53 The length of these particles is associated with conditions of the synthesis process where the content of water and polarity of micelles were reduced due to the synergistic effect of sulfonic groups and Zr(IV) reduction.31,54 In addition, the micrographs of elemental mapping of Al, Ti, Zr, and S for each sample of SBA-15-(X)SO3H are shown in Fig. 3 showing the good distribution of these elements in the framework of SBA-15.
Thermal stability and functional groups
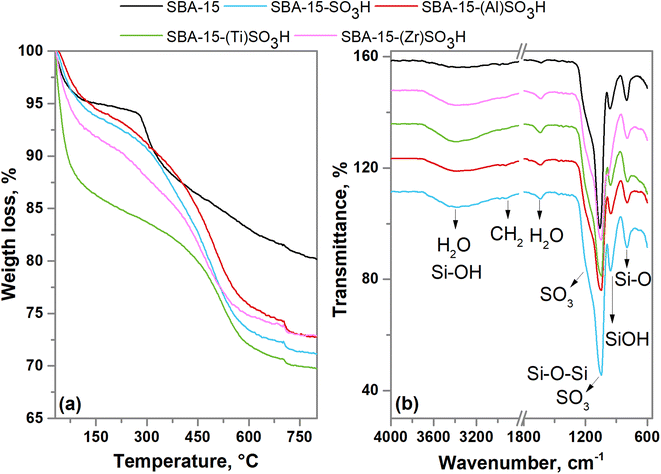
The thermogravimetric analysis of SBA-15-(X)SO3H materials is plotted in Fig. 4a. The first weight loss is in the range of 30 to 100 °C which is related to the loss of water physiosorbed on the surface. The thermogram indicates a loss percentage of around 4% to 12.5%, the SBA-15-(Ti)SO3H sample with the greater weight loss, demonstrating a more hydrophilicity character for this material.55 The second weight loss is around 100 °C to 280 °C for the SBA-15 sample, which is attributed to the surfactant (P123) decomposition that was not removed during the washing step with ethanol.31,51 Whereas the TGA profiles of the other materials indicated a loss weight in the range of 100 °C to 500 °C which is first related to the residual moieties of the block copolymer (∼300 °C) and is also associated to degradation of the propyl groups bonded to thiol (∼350 °C), or sulfonic groups (∼450 °C).51,53 The third weight loss occurred between 300 °C to 700 °C for SBA-15 material related to the decomposition of organic matter.31 For all materials, the last weight loss (from 500 °C to 700 °C) is associated with the total decomposition of alkyl sulfonic groups.51,55,56Fig. 4b shows the FTIR spectra of all catalysts, indicating a broad band around 3400 cm−1 associated with O–H stretching vibration typical of hydrogen bonding between silanol groups and physiosorbed water molecules.56 There is a band around 1630 cm−1 related to the bending vibrations of O–H groups.36,39,51 The band at about 960 cm−1 is related to uncondensed silanol groups (Si–OH).36,51 The asymmetric stretching vibrations of Si–O–Si appear at 1100 cm−1, while the symmetric stretching vibrations for Si–O bonds are observed at about 800 cm−1.39,51,56 The barely perceptible bands at 1380 cm−1 and 1460 cm−1 correspond to the C–O–C vibrations as well as the signals at 2980 and 2920 cm−1 associated with C–H stretching vibration evidence the presence of residual copolymer in all samples as it was found in TGA analysis.51,53 In addition, the incorporation of the propyl sulfonic groups is evidenced by the antisymmetric and symmetric S–O vibrational modes which are visible as a shoulder at 1125 cm−1 and a band at 1046 cm−1, respectively, this latter is overlapped with the asymmetric vibrations of Si–O–Si (1100 cm−1) leading to a band with a maximum at around 1070 cm−1.55 Furthermore, the absence of the band at about 2400 cm−1 is attributed to the weak vibration of the thiol group (–SH) indicating the possible complete oxidation of the MPTMS precursor to sulfonic groups.51
Surface acid properties
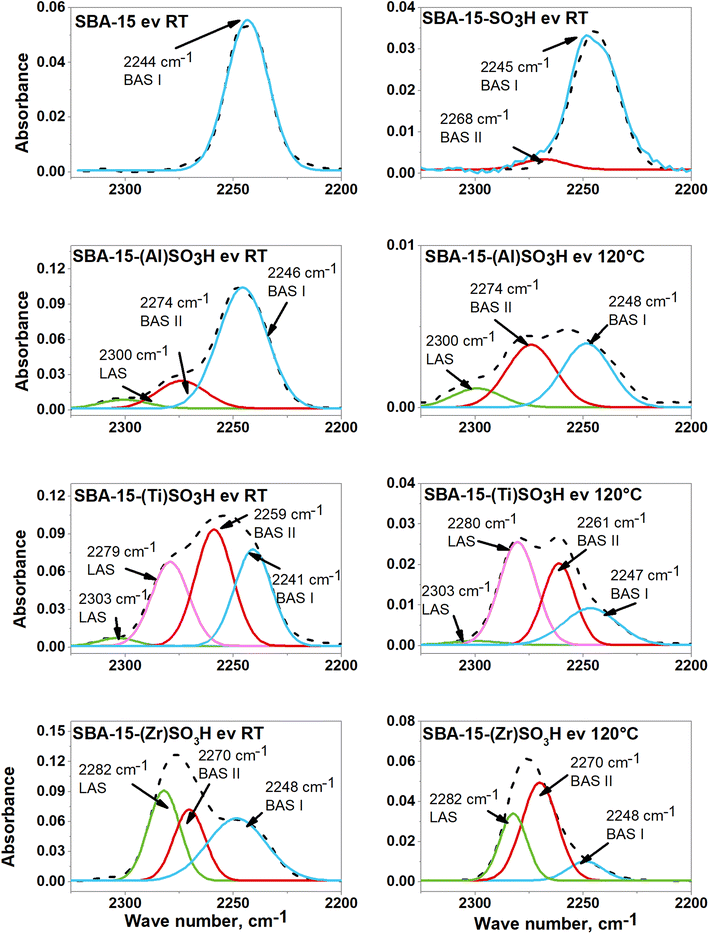
The study of the Lewis and Brønsted surface acid sites on doped SBA-15-SO3H materials was made through the adsorption of pivalonitrile (PN). The FTIR spectra in the range of 2350 cm−1 to 2200 cm−1 of all catalysts with adsorbed PN and after a deconvolution process are shown in Fig. 5, this region is associated with C![[triple bond, length as m-dash]](https://www.rsc.org/images/entities/char_e002.gif) N stretching vibration from pivalonitrile on Lewis and Brønsted acid sites from zeolites and silicon oxides doped with Al+3, Ti+4 and Zr+4 cations.57 The FTIR spectra of adsorbed pivalonitrile evacuated at 120 °C for SBA-15 and SBA-15-SO3H materials are not shown since any vibration band of adsorbed pivalonitrile was observed, which is indicative of the less acidic character of these samples in comparison to materials functionalized with metal ions. The SBA-15 spectrum presents a band at about 2244 cm−1, associated with PN interaction with silanol groups (Si–OH, BAS I).57–59 The SBA-15-SO3H spectrum also shows the same band at around 2245 cm−1, and a second band at 2268 cm−1 attributed to OH's groups bonded to the silica surface with adjacent propyl sulfonic groups (S–OH, BAS II)31 as it was observed by FTIR results in Fig. 4b, and thus, attributed to stronger Brønsted acid sites.
N stretching vibration from pivalonitrile on Lewis and Brønsted acid sites from zeolites and silicon oxides doped with Al+3, Ti+4 and Zr+4 cations.57 The FTIR spectra of adsorbed pivalonitrile evacuated at 120 °C for SBA-15 and SBA-15-SO3H materials are not shown since any vibration band of adsorbed pivalonitrile was observed, which is indicative of the less acidic character of these samples in comparison to materials functionalized with metal ions. The SBA-15 spectrum presents a band at about 2244 cm−1, associated with PN interaction with silanol groups (Si–OH, BAS I).57–59 The SBA-15-SO3H spectrum also shows the same band at around 2245 cm−1, and a second band at 2268 cm−1 attributed to OH's groups bonded to the silica surface with adjacent propyl sulfonic groups (S–OH, BAS II)31 as it was observed by FTIR results in Fig. 4b, and thus, attributed to stronger Brønsted acid sites.
The FTIR spectra of SBA-15-(Al)SO3H catalysts evacuated at room temperature and 120 °C possess the same two bands of SBA-15-SO3H attributed to Brønsted acid sites, located at around 2247 cm−1(BAS I), and 2274 cm−1 (BAS II), this latter is associated to silanol groups adjacent to propyl sulfonic groups, but also to hydroxyl groups bonded to the silica framework with adjacent aluminum ion (Si–OH–Al).57 The third band at around 2300 cm−1 is indicative of coordinatively unsaturated Al(III) cations in tetrahedral coordination located into the SBA-15 framework, and thus, this band belongs to Lewis acid sites.60,61
In the case of SBA-15-(Ti)SO3H material, the FTIR spectra evacuated at room temperature and 120 °C showed four bands. After outgassing, a band at around 2241 cm−1 which could be assigned to the interaction of pivalonitrile with silanol groups and its adsorption on terminal hydroxyls of TiO2.60 When the evacuation temperature is increased to 120 °C the intensity of this band decreases and its maximum shifts to 2247 cm−1 (BAS I), which denotes the low strength of Brønsted acid sites of TiO2 in comparison to silanol groups of doped SBA-15. The second band is located at around 2260 cm−1 and is assigned to silanol groups close to titanium ions incorporated into the SBA-15 framework, then this band is related to Brønsted acid sites type II (BAS II). The third band at 2280 cm−1 can be attributed to pivalonitrile species interacting with the Lewis acid sites (LAS) of TiO2, this result is in line with the findings in the XRD characterization. The last band at 2303 cm−1 is related to LAS that belongs to coordinatively unsaturated Ti(IV) cations in tetrahedral coordination located in the SBA-15 framework.60,61
The FTIR spectra of SBA-15-(Zr)SO3H possess the same two bands of SBA-15-SO3H at around 2248 cm−1(BAS I) and 2270 cm−1(BAS II) associated with Brønsted acid sites, whereas the peak at 2282 cm−1 is related to CN stretching vibration of pivalonitrile interacting with LAS related to Zr(IV) ions.58,59
The relative percentage of acid sites LAS, BAS I, and BAS II is shown in Table 3. The LAS is related to metal ions in the SBA-15 framework in tetrahedral coordination, whereas the BAS type I belongs to terminal silanol groups, and the BAS type II is assigned to silanol groups nearby to propyl sulfonic groups or metal ions, as was discussed above. It is observed in Table 3 that SBA-15 only possesses BAS I, while the incorporation of sulfonic groups into the framework of SBA-15-SO3H produced a small fraction of BAS II. In general, the incorporation of the metal ion into the SBA-15-SO3H framework provokes first the generation of LAS, and second, the metal ions act synergistically with sulfonic groups increasing the strength of the BAS II and LAS, this is evidenced by the greater percentage of BAS II and LAS found when the evacuation temperature is increased from room temperature up to 120 °C, and this occurred in all SBA-15-(X)SO3H samples.
| Material | % rel. BAS Ia | % rel. BAS IIa | % rel. LASa |
|---|---|---|---|
| a The relative percentage of each acid site was obtained by dividing its band area by the total area formed by the different sites (Brønsted and Lewis). | |||
| SBA-15 ev RT | 100 | 0 | 0 |
| SBA-15-SO3H ev RT | 93.1 | 6.9 | 0 |
| SBA-15-(Al)SO3H ev RT | 76.7 | 17.6 | 5.7 |
| SBA-15-(Al)SO3H ev 120 °C | 43.9 | 43.1 | 13.0 |
| SBA-15-(Ti)SO3H ev RT | 31.6 | 38.2 | 30.2 |
| SBA-15-(Ti)SO3H ev 120 °C | 23.1 | 30.5 | 46.4 |
| SBA-15-(Zr)SO3H ev RT | 38.4 | 23.2 | 38.4 |
| SBA-15-(Zr)SO3H 120 °C | 11.4 | 58.1 | 30.4 |
The relative percentage of BAS II and LAS of SBA-15-(Al)SO3H obtained when pivalonitrile is evacuated at room temperature and 120 °C, indicated that the concentration of BAS II and LAS increases 25.5% and 7.3, respectively. In the case of SBA-15-(Ti)SO3H when the evacuation temperature changed to 120 °C, the population of BAS I and BAS II decreased by 8.5% and 7.7% respectively, while the percentage of LAS augmented proportionally, in this material the strongest and the highest population of acid sites belongs to LAS related to TiO2 that was not incorporated into the SBA-15 framework (Fig. 5).
In the SBA-15-(Zr)SO3H sample when the evacuation temperature is raised to 120 °C the BAS I and LAS decreased by 27% and 8%, respectively, whereas the BAS II augmented proportionally, indicating that in this material BAS II are the strongest acid sites.
Chemical environment: X-ray photoelectron spectroscopy
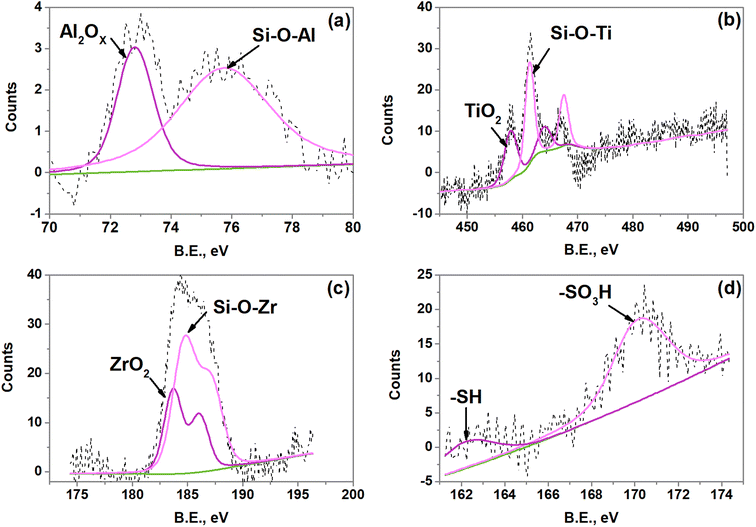
As mentioned above (surface acid properties), the acid site type BAS II is associated with hydroxyl groups bonded to the silica framework with adjacent aluminum ion (Si–OH–Al) and silanol groups adjacent to propyl sulfonic groups. To inquire on the extent of incorporation of the metal ions Al3+, Ti4+, and Zr4+ into the SBA-15 framework (extent of incorporation) as well as the chemical state of S, XPS measurements were performed. The deconvolution of the XPS Al 2p, Ti 2p, Zr 3d, and S 2p (only the spectrum of the SBA-15-(Zr)SO3H material is shown) is exhibited in Fig. 6. The Al 2p spectrum presents two species of aluminum, one located at 72.7 eV and the second one at 75.6 eV. The first is ascribed to Al2Ox, while the band at higher binding energy is attributed to Al3+ in silica framework.62 In the case of the SBA-15-(Ti)SO3H sample two doublets were found for Ti 2p, the peak at 457.7 eV is associated with Ti–O bonds that are associated with TiO2 specie.63 Another peak located at 532.8 eV was assigned to Si–O–Ti.64 The Zr 3d XPS spectrum presents two groups of signals resultant of Si–O–Zr (184.7 eV) and ZrO2 (183.7 eV) species.65,66 Concerning the region of S 2p was fitted with two doublets around 169 and 162 eV. The latter peak is characteristic of –SO3H6,7 and another doublet is associated with the thiol group –SH.67,68 The existence of the thiol group is due to the incomplete oxidation of the MPTMS precursor to sulfonic groups. The binding energy and the relative percentage of each species of Al, Ti, Zr, and S are listed in Table 4. The relative percentage of a given element is obtained by dividing its peak area by the total area formed by the different species of the same element.69| Catalyst | Al 2p/Ti 2p/Zr 3d | S 2p | ||||
|---|---|---|---|---|---|---|
| Assignment | BE (eV) | Rel. (%) | Assignment | BE (eV) | Rel. (%) | |
| SBA-15-(Al)SO3H | Al2Ox | 72.7 | 37.4 | S–H | 166.8 | 34.1 |
| Si–O–Al | 75.6 | 62.6 | SO3H | 170.1 | 65.9 | |
| SBA-15-(Ti)SO3H | TiO2 | 457.8 | 40.3 | S–H | 162.9 | 23 |
| Si–O–Ti | 461.2 | 59.7 | SO3H | 170.7 | 77 | |
| SBA-15-(Zr)SO3H | ZrO2 | 183.7 | 34.3 | S–H | 161.9 | 22.2 |
| Si–O–Zr | 184.7 | 65.7 | SO3H | 169.9 | 77.8 | |
It is observed that the catalysts present metal ions extra framework generating Al2Ox, TiO2, and ZrO2 interfacial respectively. However, most of the metal is incorporated into the SBA-15 framework. On the other hand, the largest amount of sulfur (about two-thirds) is in sulfonic groups, while the rest is in the form of thiol group (S–H). As mentioned above the extent of incorporation of metal ions into the SBA-15 framework and the number of sulfonic groups are important parameters for catalytic performance due to its relationship with the acid sites BAS II. In this context, the catalyst with a higher extent of incorporation and population of –SO3H groups is SBA-15-(Zr)SO3H, this is in line with the population of acid sites BAS II in the catalyst (see surface acid properties). On the other hand, compared between the catalysts doped with Al and Ti, the extent of incorporation is slightly greater in the catalyst with Al (a 2.9%) and the contrary occurs with the population of sulfonic groups, which is higher in the catalyst with Ti (a 11.1%). Otherwise, the acid site LAS is related to species of metal oxides deposited externally on the surface, being the catalyst SBA-15-(Ti)SO3H with higher metal oxide (TiO2).
Catalytic performance under standard conditions
To determine the catalyst with the best performance in the transformation of xylose, furfural selectivity, and yield, reactions were carried out at common conditions (120 °C for 60 minutes, a catalyst to xylose (mm = 1![[thin space (1/6-em)]](https://www.rsc.org/images/entities/char_2009.gif) :
:![[thin space (1/6-em)]](https://www.rsc.org/images/entities/char_2009.gif) 10), γ-valerolactone (GVL) to H2O (mm = 9
10), γ-valerolactone (GVL) to H2O (mm = 9![[thin space (1/6-em)]](https://www.rsc.org/images/entities/char_2009.gif) :
:![[thin space (1/6-em)]](https://www.rsc.org/images/entities/char_2009.gif) 1).
1).
SBA-15 is not presented in Fig. 7a, since this catalyst does not show any xylose conversion and thus, any furfural production. As is noticed, the small proportion of BAS II in SBA-15-SO3H in comparison with SBA-15 (Table 3) is enough to obtain xylose conversion and furfural selectivity. When Al or Ti is incorporated into the SBA-15-SO3H framework the xylose conversion and the furfural yield are slightly increased, however, when the presence of Zr duplicates the xylose conversion and furfural yield in comparison to SBA-15-SO3H.
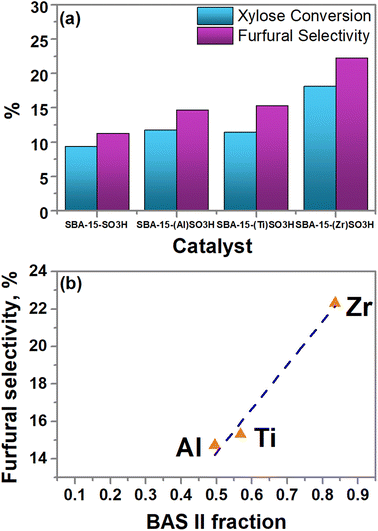 | ||
| Fig. 7 (a) Furfural production from xylose in standard conditions, and (b) linear correlation between furfural selectivity (mol%) and BAS II fraction. | ||
A probable explanation was found when the furfural selectivity was related to the BAS II fraction. The BAS II fraction was obtained by dividing its relative percentage by the total percentage formed by Brønsted acid sites (BAS II/(BAS I + BAS II)). The BAS II fraction changes when the transition metal is incorporated in SBA-15-SO3H, increasing as Al(III) < Ti(IV) < Zr(IV). Fig. 7b shows that the furfural selectivity is a function of the amount of BAS type II, a linear trend between the BAS II fraction and furfural selectivity is observed. This is in line with the results published by Weingarten et al.70 In this way, the catalyst with Zr (SBA-15-(Zr)SO3H) has shown the best xylose conversion and furfural yield which was related to its high population of BAS type II (Table 3).
Influence of reaction temperature and time
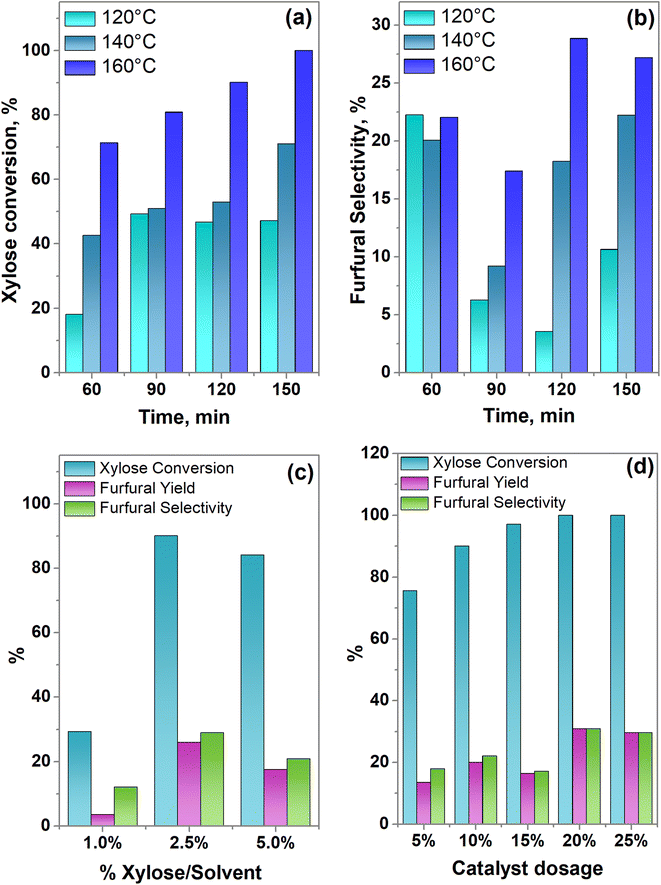
Once the most active catalyst (SBA-15-(Zr)SO3H) was selected, we proceeded to study the effect of temperature and reaction time on the catalyst. As the reaction temperature increased from 120 to 160 °C, the xylose conversion is duplicated obtaining 100% after 150 min of reaction time (Fig. 8a). It is noticed that the furfural selectivity first reached a maximum after 60 minutes (Fig. 8b), and then the selectivity decreased, this behavior has been reported in literature,71 and possibly obeys to a condensation reaction between an intermediate and furfural or to the xylose reaction with the furfural produced in another reaction route.70,72 On the other hand, this decrease in furfural yield is less pronounced when the reaction temperature increases, then the best conditions of reaction time and temperature were 120 min and 160 °C since the highest furfural selectivity of 28.85% was reached.Influence of xylose/solvent mass ratio
The influence of the xylose (XL) concentration to produce furfural was studied with 3 different amounts (xylose/solvent: 1%, 2.5%, and 5%) at reaction temperature and time of 160 °C and 120 minutes, respectively; with a 9![[thin space (1/6-em)]](https://www.rsc.org/images/entities/char_2009.gif) :
:![[thin space (1/6-em)]](https://www.rsc.org/images/entities/char_2009.gif) 1 mass ratio of GVL/H2O and 0.023 g (10 wt%) of SBA-15-(Zr)SO3H catalyst.
1 mass ratio of GVL/H2O and 0.023 g (10 wt%) of SBA-15-(Zr)SO3H catalyst.
Fig. 8c shows that the lowest yield of furfural obtained was when the amount of xylose was 1%, it is attributed to the low concentration of solute (xylose) in the reaction medium leading to a lower frequency of molecular collision with the catalytic material,73 which is demonstrated by the low percentage of xylose conversion. When 2.5% of xylose was used, 90.04% of xylose was transformed to obtain a furfural yield of 26 mol%. Nonetheless, further increase in the xylose dosage had a negative effect on the furfural yield, this can be related to the higher frequency of collision of xylose and furfural molecules already produced, increasing furfural polymerization itself and polymerization between xylose and furfural. Therefore, the optimal dosage of xylose turned out to be a xylose-solvent ratio of 2.5%.
Influence of catalyst dosage
The influence of the SBA-15-(Zr)SO3H catalyst dosage on the conversion of xylose to furfural was analyzed, under the best experimental conditions of concentration of xylose (xylose/solvent = 2.5%), temperature (160 °C), and reaction time (120 min) resulting in the previous results.Fig. 8d exhibits the influence of the SBA-15-(Zr)SO3H catalyst dosages on the yield and selectivity of furfural. When the amount of catalyst SBA-15-(Zr)SO3H is incremented from 5 to 20 wt% the conversion of xylose increased from 75.6 to 100%, showing the highest xylose conversion, furfural yield, and selectivity. Nonetheless, a catalyst loading of 25 wt% slightly decreased the yield and selectivity of furfural compared with 20 wt%, this is attributed to an excess of catalyst–substrate which possibly hinders the mass transport (external diffusion), also an increase in the population of Lewis acid sites, can accelerate the degradation of furfural, as well as promoting condensation, generating a greater amount of humins, inhibiting the formation of furfural.17,74 Accordingly, the highest efficiency of the SBA-15-(Zr)SO3H sample was reached when 20 wt% of catalyst and 2.5% of xylose/solvent were used, at 160 °C of reaction temperature and after 120 minutes of reaction time.
Kinetic study
A kinetic study was made using the best reaction conditions found (see paragraph above), and then a series of reactions were carried out at different reaction times and temperatures, to evaluate kinetics parameters. A previous study72 indicates that the dehydration reaction of xylose in a system of one phase consists of two parallel reactions. One of them is the dehydration of xylose into furfural (reaction (4)) and another reaction involves the transformation of xylose and furfural to produce humins (reaction (5)). The third reaction is the formation of humins from the decomposition of furfural (reaction (6)). The model is described as follows:
 | (4) |
 | (5) |
 | (6) |
Reaction (4) is a pseudo-first order concerning xylose. Reaction (5) is the second order based on xylose and furfural respectively. The furfural decomposition (reaction (6)) is found to be the first order for furfural.70 found that both acid sites (LAS and BAS) are involved in reactions (4) and (6), while reaction (5), is predominantly catalyzed by LAS.
Based on model,72 the following system of equations was considered. Where XL means xylose and FU is furfural:
 | (7) |
 | (8) |
To calculate the kinetic parameters of the reaction system, computational analysis was made using the Micro-Math Scientist software and the Powell method for least square adjustment. Experimental concentrations (reactant and products) and the system of equations (see above) were taken as input data, whereas the reaction rate constants were obtained as output data. To obtain the kinetic parameters such as the apparent activation energy (Ea) and the pre-exponential factor, A, of the three reaction pathways associated with the transformation of xylose; the different temperatures, and the Arrhenius equation [k = A exp(−Ea/RT)] were used.
Fig. 9 shows the experimental data and calculated values of xylose concentration of SBA-15-(Zr)SO3H catalyst at different reaction temperatures using the kinetic model for the dehydration of xylose in a system of one phase.72 Although the model presents an R2 > 0.98, the slight deviations indicate that the kinetic model does not fully describe what happens in the reaction system, but it is a good approximation. The values of the kinetic parameters at different reaction temperatures are shown in Table 5. The rate constants k1 and k2, involved in the two parallel reactions for the xylose conversion, increase with temperature as was expected. On the other hand, when the reaction temperature goes from 140 to 180 °C the value of k2 is higher than k1 respectively. Thus, the selectivity factor k1/k2, which is ∼0.063 at 160 and 180 °C, and ∼0.034 at 140 °C, indicates that in the temperature range used (140, 160, and 180 °C), the transformation of xylose is widely favored by the second parallel reaction that is the transformation of xylose and furfural to produce humins. No changes in the ratio k1/k2 between 160 and 180 °C were observed because at higher temperatures the formation of humins (reaction (5)) is also favored, as shown in the magnitude of the k2. Thus, the adequate reaction temperature is 160 °C. Besides the low value of the k3 concerning k1 and k2 values, indicates that the reaction route related to the decomposition of furfural into humins is not favored.
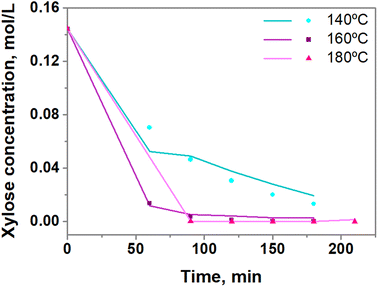 | ||
| Fig. 9 Profile of xylose concentration using SBA-15-(Zr)SO3H catalyst at 140, 160 and 180 °C. Line: experimental data, symbol: calculated data. | ||
| Temperature (°C) | |||
|---|---|---|---|
| 140 | 160 | 180 | |
| k1 (min−1) | 7.71 × 10⁻³ | 2.43 × 10⁻² | 3.70 × 10⁻² |
| k2 (L mol−1 min−1) | 2.29 × 10⁻¹ | 3.80 × 10⁻¹ | 5.86 × 10⁻¹ |
| k3 (min−1) | 1.00 × 10⁻¹³ | 2.00 × 10⁻⁸ | 9.20 × 10⁻⁶ |
| k1/k2 | 0.0336 | 0.0639 | 0.0631 |
The calculated Arrhenius parameters are shown in Table 6. The activation energy value (Ea) and the pre-exponential factor (A) related to the dehydration of xylose to produce furfural (reaction (4)) were higher than another parallel reaction (reaction (5)) which implicates the transformation between xylose and furfural to generate humins. The lower activation energy of reaction (5) indicates that it requires less energy to begin, this is in line with the sharp decrease in furfural selectivity at 120 °C in comparison with higher reaction temperatures (Fig. 8b).
| Reaction rate constant | Ea (kJ mol−1) | A |
|---|---|---|
| k1 | 61.40 | 4.95 × 10⁵ |
| k2 | 36.53 | 0.11 × 10⁵ |
Then, our results show that not only the total of Brønsted acid sites are involved in reaction (4), but particularly the BAS II. Thus, the hydroxyl groups bonded to the sulfur or transition metal (BAS II) are the ones that catalyze the dehydration of xylose to produce furfural (reaction (4)). Otherwise, there is no trend between furfural production and the number of LAS, indicating these last catalyze reaction (5). Thus, LAS have been found to negatively impact furfural production, favoring reaction (5).70
Table 7 compares the results obtained in this work with other reported studies. As we can see, in some of them there is a marked difference in the operation conditions, such as catalyst dosage where some studies use five times the amount of catalyst or even ∼26 times higher,75 as well as solvent medium, time, and reaction temperature causing the difference in yield and selectivity. However, the results obtained in this work are comparable with the studies shown in Table 7, such as the results from Jia et al.76 which used a similar reaction temperature, and the same catalyst dosage. It is important to point out that even though the reaction conditions are similar a possible reason for the difference in furfural selectivity between Jia et al. results and this work might be due to greater sulfonic groups present on the catalyst SO42−/Sn-DM while the catalyst SBA-15-(Zr)SO3H around 78% of the total sulfur is present as though sulfonic group and the rest as thiol group (–SH) (see Table 4). As mentioned before, sulfonic groups as related to strong Brønsted acid sites (BAS II).
| Catalyst | Catalyst dosage | Xylose dosage | Reaction system | Reaction time (min) | Reaction temperature (°C) | Yield (%) | Selectivity (%) | Ref. |
|---|---|---|---|---|---|---|---|---|
| SBA-15-(Zr)SO3H | 4.5 g L−1 | 22 g L−1 | γ-Valerolactone/H2O | 120 | 160 | 38.1 | 39.23 | This work |
| Propylsulfonic SBA-15 | 120 g L−1 | 20 g L−1 | Water/toluene | 1200 | 170 | 82 | 85 | 77 |
| SO42−/Sn-DM | 4 g L−1 | 20 g L−1 | Water | 180 | 170 | 42.16 | 49.77 | 76 |
| OMC-SO3H | 20 g L−1 | 16 g L−1 | γ-Valerolactone/H2O | 45 | 200 | 76.7 | NR | 37 |
| MC-SnOx | 20 g L−1 | 20 g L−1 | 2-MTHF | 20 | 180 | 57.9 | 53.9 | 38 |
The reusability of the catalyst
Catalyst recyclability tests were carried out in a total volume of 10 mL, a 9![[thin space (1/6-em)]](https://www.rsc.org/images/entities/char_2009.gif) :
:![[thin space (1/6-em)]](https://www.rsc.org/images/entities/char_2009.gif) 1 mass ratio of GVL/H2O, 2.5 wt% of xylose, and 0.023 g (10 wt%) of SBA-15-(Zr)SO3H catalyst at 160 °C and 120 min. After the reaction, the catalyst was recovered by centrifugation and decantation in falcon tubes of 50 mL, the precipitate was washed with 10 mL of methanol and then rinsed with 10 mL of distilled water, finally, it was filtered on Whatman #1 paper and dried at 100 °C. The solid on the filter paper was recovered and used for the next reaction, repeating the procedure until the fifth cycle.
1 mass ratio of GVL/H2O, 2.5 wt% of xylose, and 0.023 g (10 wt%) of SBA-15-(Zr)SO3H catalyst at 160 °C and 120 min. After the reaction, the catalyst was recovered by centrifugation and decantation in falcon tubes of 50 mL, the precipitate was washed with 10 mL of methanol and then rinsed with 10 mL of distilled water, finally, it was filtered on Whatman #1 paper and dried at 100 °C. The solid on the filter paper was recovered and used for the next reaction, repeating the procedure until the fifth cycle.
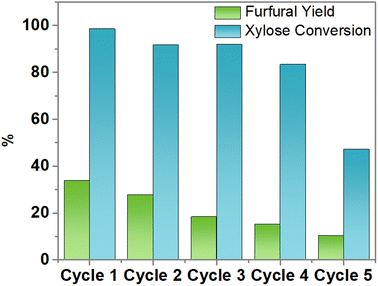
The xylose conversion is maintained during 4 cycles; however, it decreases by 43% after the fifth cycle (Fig. 10). The furfural yield decreases in each reaction cycle, with a notorious decrement in the fifth cycle which may be attributed to the deposition of carbonaceous species leading to the blockage of some active sites of the SBA-15-(Zr)SO3H catalyst,78 which is related to the deposition of humins, the product of reaction (5). This was confirmed by the semi-quantitative analysis of EDS of silicon, oxygen, zirconium, and sulfur, and also, the quantitative elemental analysis of carbon and sulfur. According to Table 8, the carbon content of SBA-15-(Zr)SO3H fresh catalyst increases 2.7 times after the fifth reaction cycle, while the mass percentages of zirconium, and sulfur are maintained in the SBA-15 framework.
Conclusions
It was grafted the sulfonic groups (FTIR result) and doped with metal ions Al(III), Ti(IV), and Zr(IV) to the silicon oxide structure of SBA-15, maintaining the typical hexagonal arrangement of these materials (SAXS, WASX, and XPS results).The type of metal used to dope the structure of SBA-15-SO3H generated significant changes in the physicochemical properties of the material. The Zr-doped catalyst had a greater surface area, pore diameter, and pore volume than the Al and Ti-doped catalysts. In addition, the catalyst with Zr presented a higher number of total acid sites (see adsorption of pivalonitrile results). Being the catalyst SBA-15-(Zr)SO3H with the best activity in the conversion of xylose into furfural. The furfural selectivity of the catalysts SBA-15-(X)SO3H (X = Al(III), Ti(IV) or Zr(IV)) is closely associated to the fraction of strongest Brønsted acid sites type II (BAS II), ascribed to hydroxyl groups bonded the sulfur or transition metal. Thus, to obtain high furfural selectivity through reaction (4) is necessary to increase the amount of acidic groups S–OH and S–M–OH. But also, decrease the number of Lewis acid sites (LAS), since these have been shown to have a negative impact on the production of furfural, favoring the production of humins (reaction (5)).
Author contributions
A. R. G. and D. A. C. M. conceived the project and defined the visualization, conceptualization, and data curation as the project progressed. A. G. A. assessed the acid sites of the materials. J. S. L., T. K. M. M., and L. J. R. G. conducted all the experimental work and the analysis of the raw data. Further formal analysis, writing, review, and editing of the text were performed by all authors.Conflicts of interest
There are no conflicts to declare.Acknowledgements
We acknowledge financial support from the National Council of Humanities Sciences and Technologies of Mexico (CONAHCYT) (Master Scholarship to Jesús Sifuentes-López). A.R.G. thanks Dr Jorge Ramirez (UNICAT, Universidad Nacional Autónoma de México) for providing the equipment to study the surface acidity of the materials and Dra. Dora A. Solís Casados (Universidad Autónoma del Estado de México) for XPS assessments.References
- P. Sudarsanam, R. Zhong, S. Van den Bosch, S. M. Coman, V. I. Parvulescu and B. F. Sels, Chem. Soc. Rev., 2018, 47, 8349–8402 RSC.
- I. Agirrezabal-Telleria, I. Gandarias and P. L. Arias, Catal. Today, 2014, 234, 42–58 CrossRef.
- M. J. Antal, T. L. William, S. Mok and G. N. Richards, Mechanism of formation of 2-furaldehyde from D-xylose*, Carbohydr. Res., 1991, 217, 71–85 CrossRef.
- W. De Jong and G. Marcotullio, Int. J. Chem. React. Eng., 2010, 8, 1–27 Search PubMed.
- J. J. Bozell and G. R. Petersen, Green Chem., 2010, 12, 539–554 RSC.
- G. Fan, Y. Wang, Z. Hu, J. Yan, J. Li and G. Song, Carbohydr. Polym., 2018, 200, 529–535 CrossRef PubMed.
- J. P. Lange, E. Van Der Heide, J. Van Buijtenen and R. Price, ChemSusChem, 2012, 5, 150–166 CrossRef PubMed.
- R. Mariscal, P. Maireles-Torres, M. Ojeda, I. Sádaba and M. López Granados, Energy Environ. Sci., 2016, 9, 1144–1189 RSC.
- Q. Yu, Z. Song, X. Zhuang, L. Liu, W. Qiu, J. Shi, W. Wang, Y. Li, Z. Wang and Z. Yuan, Cellulose, 2019, 26, 8263–8277 CrossRef.
- L. Zhang, H. Yu, P. Wang, H. Dong and X. Peng, Bioresour. Technol., 2013, 130, 110–116 CrossRef PubMed.
- W. Xu, S. Zhang, J. Lu and Q. Cai, Environ. Prog. Sustainable Energy, 2017, 36, 690–695 CrossRef.
- W. Yang, P. Li, D. Bo, H. Chang, X. Wang and T. Zhu, Bioresour. Technol., 2013, 133, 361–369 CrossRef PubMed.
- H. Gómez Bernal, L. Bernazzani and A. M. Raspolli Galletti, Green Chem., 2014, 16, 3734–3740 RSC.
- H. Li, Z. Fang, R. L. Smith and S. Yang, Prog. Energy Combust. Sci., 2016, 55, 98–194 CrossRef.
- V. Choudhary, A. B. Pinar, S. I. Sandler, D. G. Vlachos and R. F. Lobo, ACS Catal., 2011, 1, 1724–1728 CrossRef.
- H. Li, J. Ren, L. Zhong, R. Sun and L. Liang, Bioresour. Technol., 2015, 176, 242–248 CrossRef PubMed.
- T. Zhang, W. Li, Z. Xu, Q. Liu, Q. Ma, H. Jameel, H. Chang and L. Ma, Bioresour. Technol., 2016, 209, 108–114 CrossRef PubMed.
- X. Li, X. Yuan, G. Xia, J. Liang, C. Liu, Z. Wang and W. Yang, J. Catal., 2020, 392, 175–185 CrossRef.
- I. Agirrezabal-Telleria, A. Larreategui, J. Requies, M. B. Güemez and P. L. Arias, Bioresour. Technol., 2011, 102, 7478–7485 CrossRef PubMed.
- S. M. Bruce, Z. Zong, A. Chatzidimitriou, L. E. Avci, J. Q. Bond, M. A. Carreon and S. G. Wettstein, J. Mol. Catal. A Chem., 2016, 422, 18–22 CrossRef.
- X. Guo, F. Guo, Y. Li, Z. Zheng, Z. Xing, Z. Zhu, T. Liu, X. Zhang and Y. Jin, Appl. Catal., A, 2018, 558, 18–25 CrossRef.
- G. Gómez Millán, J. Phiri, M. Mäkelä, T. Maloney, A. M. Balu, A. Pineda, J. Llorca and H. Sixta, Appl. Catal., A, 2019, 585, 117180 CrossRef.
- E. I. Gürbüz, J. M. R. Gallo, D. M. Alonso, S. G. Wettstein, W. Y. Lim and J. A. Dumesic, Angew. Chem., Int. Ed., 2013, 52, 1270–1274 CrossRef PubMed.
- P. Bhaumik, T. Kane and P. L. Dhepe, Catal. Sci. Technol., 2014, 4, 2904–2907 RSC.
- P. Bhange, D. S. Bhange, S. Pradhan and V. Ramaswamy, Appl. Catal., A, 2011, 400, 176–184 CrossRef.
- I. I. Slowing, B. G. Trewyn, S. Giri and V. S. Y. Lin, Adv. Funct. Mater., 2007, 17, 1225–1236 CrossRef.
- S. P. Hudson, R. F. Padera, R. Langer and D. S. Kohane, Biomaterials, 2008, 29, 4045–4055 CrossRef PubMed.
- S. Chirra, S. Siliveri, R. Gangalla, S. Goskula, S. R. Gujjula, A. K. Adepu, R. Anumula, S. S. Sivasoorian, L.-F. Wang and V. Narayanan, J. Mater. Chem. B, 2019, 7, 7235–7245 RSC.
- C. Gonzalez-Arellano, K. Yoshida, R. Luque and P. L. Gai, Green Chem., 2010, 12, 1281–1287 RSC.
- C. Liang, M.-C. Wei, H.-H. Tseng and E.-C. Shu, Chem. Eng. J., 2013, 223, 785–794 CrossRef.
- D. A. Cabrera-Munguia, H. González, E. Tututi-Ríos, A. Gutiérrez-Alejandre and J. L. Rico, J. Mater. Res., 2018, 33(21), 3634–3645 CrossRef.
- W. Li, K. Xu, L. Xu, J. Hu, F. Ma and Y. Guo, Appl. Surf. Sci., 2010, 256, 3183–3190 CrossRef.
- S.-Y. Chen, T. Mochizuki, Y. Abe, M. Toba and Y. Yoshimura, Appl. Catal., B, 2014, 148–149, 344–356 CrossRef.
- C. I. S. Léon, D. Song, F. Su, S. An, H. Liu, J. Gao, Y. Guo and J. Leng, Microporous Mesoporous Mater., 2015, 204, 218–225 CrossRef.
- G. Muthu Kumaran, S. Garg, K. Soni, M. Kumar, J. K. Gupta, L. D. Sharma, K. S. Rama Rao and G. Murali Dhar, Microporous Mesoporous Mater., 2008, 114, 103–109 CrossRef.
- E. Tututi-Ríos, H. González, D. A. Cabrera-Munguia, A. Gutiérrez-Alejandre and J. L. Rico, Catal. Today, 2022, 394–396, 235–246 CrossRef.
- X. Wang, M. Qiu, Y. Tang, J. Yang, F. Shen, X. Qi and Y. Yu, Int. J. Biol. Macromol., 2021, 187, 232–239 CrossRef PubMed.
- N. Zhou, C. Zhang, Y. Cao, J. Zhan, J. Fan, J. H. Clark and S. Zhang, J. Clean Prod., 2021, 311, 127780 CrossRef.
- S. Jeenpadiphat, E. M. Björk, M. Odén and D. N. Tungasmita, J. Mol. Catal. A: Chem., 2015, 410, 253–259 CrossRef.
- I. Rakngam, N. Osakoo, J. Wittayakun, N. Chanlek, A. Pengsawang, N. Sosa, T. Butburee, K. Faungnawakij and P. Khemthong, Microporous Mesoporous Mater., 2021, 317, 110999–111009 CrossRef.
- D. Bhuyan, A. Gogoi, M. Saikia, R. Saikia and L. Saikia, Mater. Res. Express, 2015, 2(7), 075402 CrossRef.
- D. A. Cabrera-Munguia, H. González, A. Gutiérrez-Alejandre, J. L. Rico, R. Huirache-Acuña, R. Maya-Yescas and R. E. del Río, Catal. Today, 2017, 282(2), 195–203 CrossRef.
- M. Robotti, S. Dosta, I. G. Cano, A. Concustell, N. Cinca and J. M. Guilemany, Adv. Powder Technol., 2016, 27, 1257–1264 CrossRef.
- M. Ghadiry, M. Gholami, C. K. Lai, H. Ahmad and W. Y. Chong, PLoS One, 2016, 11(4), 1–14 CrossRef PubMed.
- M. M. Rahman, M. Muttakin, A. Pal, A. Z. Shafiullah and B. B. Saha, Energies, 2019, 12, 4565–4598 CrossRef.
- K. A. Cychosz and M. Thommes, Engineering, 2018, 4, 559–566 CrossRef.
- R. López-Asensio, C. P. J. Gómez, C. G. Sancho, R. Moreno-Tost, J. A. Cecilia and P. Maireles-Torres, Int. J. Mol. Sci., 2019, 20(4), 828–849 CrossRef PubMed.
- G. Yang, L. Wang and H. Jiang, React. Chem. Eng., 2020, 5, 1833–1844 RSC.
- Y. Chen, Y. Huang, J. Xiu, X. Han and X. Bao, Appl. Catal., A, 2004, 273, 185–191 CrossRef.
- Y. Zheng, J. Li, N. Zhao, W. Wei and Y. Sun, Microporous Mesoporous Mater., 2006, 92, 195–200 CrossRef.
- B. O. Dalla Costa, M. S. Legnoverde, C. Lago, H. P. Decolatti and C. A. Querini, Microporous Mesoporous Mater., 2016, 230, 66–75 CrossRef.
- W. Xie and L. Hu, J. Oleo Sci., 2016, 65, 803–813 CrossRef PubMed.
- D. Margolese, J. A. Melero, S. C. Christiansen, B. F. Chmelka and G. D. Stucky, Chem. Mater., 2000, 12, 2448–2459 CrossRef.
- S. Ruthstein, J. Schmidt, E. Kesselman, Y. Talmon and D. Goldfarb, J. Am. Chem. Soc., 2006, 128, 3366–3374 CrossRef PubMed.
- A. S. Cattaneo, C. Ferrara, D. C. Villa, S. Angioni, C. Milanese, D. Capsoni, S. Grandi, P. Mustarelli, V. Allodi, G. Mariotto, S. Brutti and E. Quartarone, Microporous Mesoporous Mater., 2016, 219, 219–229 CrossRef.
- X. Shi, Y. Wu, H. Yi, G. Rui, P. Li, M. Yang and G. Wang, Energies, 2011, 4, 669–684 CrossRef.
- B. Gil, K. Kałahurska and A. Kowalczyk, Appl. Catal., A, 2019, 578, 63–69 CrossRef.
- E. Rodríguez-Castellón, A. Jiménez-López, P. Maireles-Torres, D. J. Jones, J. Rozière, M. Trombetta, G. Busca, M. Lenarda and L. Storaro, J. Solid State Chem., 2003, 175, 159–169 CrossRef.
- A. Infantes-Molina, J. Mérida-Robles, P. Maireles-Torres, E. Finocchio, G. Busca, E. Rodríguez-Castellón, J. L. G. Fierro and A. Jiménez-López, Microporous Mesoporous Mater., 2004, 75, 23–32 CrossRef.
- A. Gutiérrez-Alejandre, M. Trombetta, G. Busca and J. Ramírez, Microporous Mater., 1997, 12, 79–91 CrossRef.
- A. Gutiérrez-Alejandre, M. González-Cruz, M. Trombetta, G. Busca and J. Ramíreza, Microporous Mesoporous Mater., 1998, 23, 265–275 CrossRef.
- C. M. A. Parlett, L. J. Durndell, A. Machado, G. Cibin, D. W. Bruce, N. S. Hondow, K. Wilson and A. F. Lee, in Catalysis Today, Elsevier B.V., 2014, vol. 229, pp. 46–55 Search PubMed.
- X. Zhu, G. Wen, H. Liu, S. Han, S. Chen, Q. Kong and W. Feng, J. Mater. Sci.: Mater. Electron., 2019, 30, 13826–13834 CrossRef.
- N. Paengjun, K. Vibulyaseak and M. Ogawa, Sci. Rep., 2021, 11, 3210–3221 CrossRef PubMed.
- V. A. Valles, Y. Sa-ngasaeng, M. L. Martínez, S. Jongpatiwut and A. R. Beltramone, Fuel, 2019, 240, 138–152 CrossRef.
- M. D. Gracia, A. M. Balu, J. M. Campelo, R. Luque, J. M. Marinas and A. A. Romero, Appl. Catal., A, 2009, 371, 85–91 CrossRef.
- W. Wang, X. Cao, H. Guo, X. Yang, N. Guo and Y. Ma, Mol. Catal., 2022, 524, 112329–112337 CrossRef.
- R. Wang, X. Liang, F. Shen, M. Qiu, J. Yang and X. Qi, ACS Sustain. Chem. Eng., 2020, 8, 1163–1170 CrossRef.
- M. Bravo-Sanchez, A. Romero-Galarza, J. Ramírez, A. Gutiérrez-Alejandre and D. A. Solís-Casados, Appl. Surf. Sci., 2019, 493, 587–592 CrossRef.
- R. Weingarten, G. A. Tompsett, W. C. Conner and G. W. Huber, J. Catal., 2011, 279, 174–182 CrossRef.
- J. M. R. Gallo, D. M. Alonso, M. A. Mellmer, J. H. Yeap, H. C. Wong and J. A. Dumesic, Top. Catal., 2013, 56, 1775–1781 CrossRef.
- R. Weingarten, J. Cho Jr, C. Wm. Curtis and G. W. Huber, Green Chem., 2010, 12, 1423–1429 RSC.
- R. Sahu and P. L. Dhepe, ChemSusChem, 2012, 5, 751–761 CrossRef PubMed.
- X. Hu, C. Lievens and C. Z. Li, ChemSusChem, 2012, 5, 1427–1434 CrossRef PubMed.
- I. Agirrezabal-Telleria, A. Larreategui, J. Requies, M. B. Güemez and P. L. Arias, Bioresour. Technol., 2011, 102, 7478–7485 CrossRef PubMed.
- Q. Jia, X. Teng, S. Yu, Z. Si, G. Li, M. Zhou, D. Cai, P. Qin and B. Chen, Bioresour. Technol. Rep., 2019, 6, 145–151 CrossRef.
- I. Agirrezabal-Telleria, J. Requies, M. B. Güemez and P. L. Arias, Appl. Catal., B, 2012, 115–116, 169–178 CrossRef.
- X. Zhang, T. Wang, L. Ma and C. Wu, Fuel, 2010, 89, 2697–2702 CrossRef.
| This journal is © The Royal Society of Chemistry 2023 |

