 Open Access Article
Electrochemical detection of creatinine: exploiting copper(II) complexes at Pt microelectrode arrays†
Keerakit Kaewket and
Kamonwad Ngamchuea *
*
School of Chemistry, Institute of Science, Suranaree University of Technology, 111 University Avenue, Suranaree, Muang, Nakhon Ratchasima 30000, Thailand. E-mail: kamonwad@g.sut.ac.th; Tel: +66 (0) 44 224 637
First published on 15th November 2023
Abstract
This work develops a rapid and highly sensitive electrochemical sensor for creatinine detection at platinum microelectrode arrays (Pt-MEA). Copper(II) ions are introduced to form the electroactive creatinine complex, which is then detected at Pt-MEA through a direct reduction reaction. Electrochemical behaviors of the creatinine complex are also explored at Pt macrodisc and microdisc electrodes in comparison with Pt-MEA. At the Pt-MEA, the linear range, sensitivity, and limit of detection of creatinine are determined to be 0.00–5.00 mM, 5401 ± 99 A m−2 M−1, and 0.059 mM (3SB/m), respectively. Notably, the Pt-MEA requires only 10 μL of sample and allows direct measurement of creatinine in synthetic urine with 97.39 ± 4.78% recovery.
1 Introduction
Creatinine is a chemical waste product that arises from muscle metabolism, specifically as a byproduct of creatine breakdown.1 It is produced in the muscles and subsequently filtered out of the body by the kidneys, primarily through urine, at a constant rate. In clinical analysis, creatinine serves as a crucial indicator for assessing renal function and is used as a biomarker to evaluate kidney health. Moreover, creatinine finds applications not only in diagnosing renal function but also in studying muscle atrophy,2 thyroid disease,3 diabetic nephropathy,4 and drug-induced nephrotoxicity.5 Additionally, it is utilized as a detection agent in sports to identify the prohibited use of stimulants.6 Given its significance, there is substantial interest in developing sensitive, specific, and rapid methods for detecting creatinine.In recent years, various laboratory-based techniques such as liquid chromatography,7 mass spectroscopy, chemiluminescence,8 enzymatic assays,9 and microfluidics10 have been developed for the measurement of creatinine. These methods have shown significant advancements in the analysis of creatinine, particularly addressing selectivity issues encountered with the conventional Jaffe reaction.11 The Jaffe reaction can be influenced by several compounds present in blood or urine, including urea, glucose, dopamine, uric acid, bilirubin, and pyruvate.12–14 However, despite these improvements, these available techniques often face limitations for on-site diagnosis and point-of-care due to their high cost of instruments or reagents, time-consuming analysis, and complex pre-treatment requirements. Therefore, the main objective of this study is to develop a method for creatinine detection using an electrochemical sensor, which offers distinct advantages such as rapidity, high sensitivity, and simplicity.
To detect creatinine electrochemically, enzymes and biomolecules such as creatinine amidinohydrolase,15 creatinine deiminase,16 and creatinine iminohydrolase17 have been employed through their immobilization on the electrode surface. Nevertheless, these enzymatic electrochemical creatinine sensors are not without limitations, as they exhibit a certain extent of enzyme instability and are susceptible to damage when exposed to extreme conditions.18 Recognizing the significance of addressing these shortcomings, recent developments have led to the creation of non-enzymatic creatinine sensors.19–23 This work proposes an alternative methodology for the non-enzymatic detection of creatinine, an apparently electrochemically inert compound. Specifically, the detection mechanism relies on the formation of electrochemically active creatinine complexes and direct voltammetric analysis at microelectrode arrays.
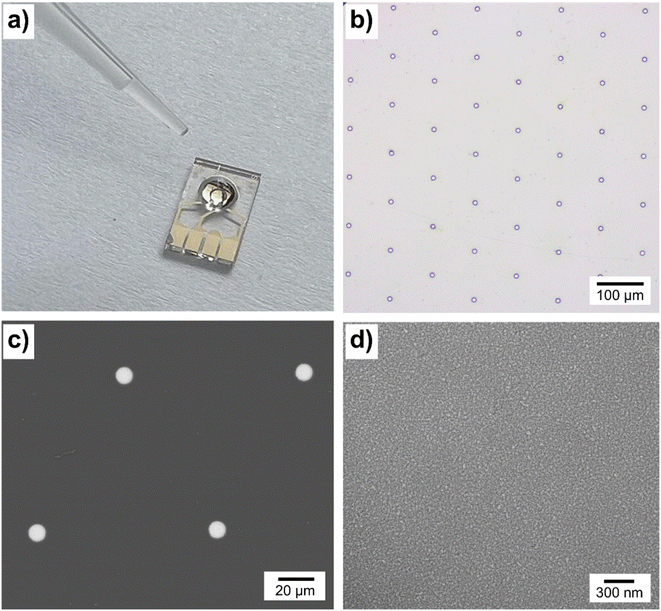
Microscopic electrodes offer advantages over conventional macroelectrodes in electrochemical sensors, including measurements in low ionic strength samples, reduced ohmic drop, high current density, high mass transfer flux, and low background charging current.24,25 The arrays of microelectrodes are suitable for in vitro and in vivo applications, enhancing current responses and sensitivities while overcoming issues with low magnitude currents, electrical noises, and stray capacitance encountered at the isolated individual microelectrode.26 Microelectrode arrays demonstrate high sensitivity, low limit of detection, and can handle small sample volumes, making them successful in detecting various organic and inorganic analytes.27,28
This work progressively investigated the electrochemical characteristics of creatinine complexes with copper ions on platinum (Pt) electrodes, spanning from macro-scale to micro-scale and culminating in the utilization of microelectrode arrays. Subsequently, a novel direct sensor for creatinine detection was developed, built upon the copper complex formation approach (Scheme 1).
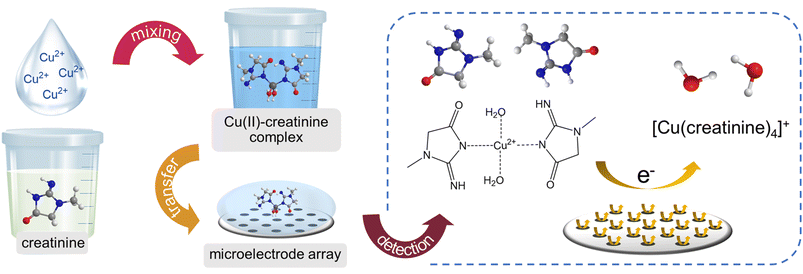 | ||
| Scheme 1 A schematic diagram showing the measurement procedure and the redox process of the developed creatinine sensor. | ||
2 Experimental
2.1 Chemical reagents
All chemical reagents were of analytical grades and used as received without further purification: creatinine (2-amino-1-methyl-2-imidazolin-4-one, ≥98.0%, Sigma-Aldrich), sodium L-lactate (C3H5NaO3, ≥99.0%, Sigma-Aldrich), L-ascorbic acid (C6H8O6, ≥99.0%, Sigma-Aldrich), urea (NH2CONH2, ≥99.0%, Sigma-Aldrich), dopamine hydrochloride ((HO)2C6H3CH2CH2NH2·HCl, ≥97.5%, Sigma-Aldrich), citric acid (HOC(COOH)(CH2COOH)2, 99.5%, QRëC), copper(II) sulfate pentahydrate (CuSO4·5H2O, ≥99%, Sigma-Aldrich), sulfuric acid (H2SO4, 98.0%, Ana Pure), potassium sulfate (K2SO4, ≥99.0%, Sigma-Aldrich), sodium chloride (NaCl, ≥99.0%, Sigma-Aldrich), sodium phosphate monobasic (NaH2PO4, ≥99.0%, Sigma-Aldrich), sodium phosphate dibasic (Na2HPO4, ≥99.0%, Sigma-Aldrich), sodium hydrogencarbonate (NaHCO3, 99.8%, QRëC), magnesium sulfate (MgSO4, ≥98.0%, Tokyo Chemical Industry), and sodium sulfate (Na2SO4, ≥99.0%, Sigma-Aldrich).A synthetic urine sample was prepared according to established protocols from previous literature studies to closely mimic the composition of real urine samples.29 The synthetic urine was formulated to contain the following components: 170.0 mM urea, 11.0 mM sodium L-lactate, 1.7 mM L-ascorbic acid, 3.0 μM dopamine hydrochloride, 2.0 mM citric acid, 90.0 mM sodium chloride, 7.0 mM sodium phosphate monobasic, 7.0 mM sodium phosphate dibasic, 25.0 mM sodium hydrogencarbonate, 2.0 mM magnesium sulfate, and 10.0 mM sodium sulfate.
2.2 Electrochemical studies
All electrochemical measurements were conducted with an Autolab PGSTAT302N potentiostat (Metrohm, Netherlands) in a Faraday cage at a temperature of 25 °C, employing a standard three-electrode setup. For reference and counter electrodes, a mercury/mercury sulfate (Hg/HgSO4 in saturated K2SO4, ItalSens) and a platinum wire were used, respectively. Three types of platinum (Pt) working electrodes were investigated: a Pt macrodisc with a diameter of 2.00 mm (CH Instruments), a Pt microdisc with a diameter of 25.00 μm (ItalSens), and a Pt microdisc electrode array (MEA) consisting of 90 electrodes with a diameter of 10 μm (MicruX). Prior to use, the working electrodes were cleaned in 0.50 M H2SO4 at an applied potential of 1.8 V for a duration of 5.0 minutes. The working electrodes were characterized using the standard [Fe(CN)6]4−/3− redox probe in Section S1, ESI.†The electrochemical measurements of copper–creatinine systems were conducted in the presence of a 0.10 M K2SO4 supporting electrolyte. This choice of supporting electrolyte was made to prevent any potential precipitate or complex formation between Cu2+ and anions in the electrolyte, allowing us to exclusively investigate the interaction between Cu2+ and creatinine. All experiments were conducted in triplicate, and the reported values represent the means of these replicates, with the accompanying error bars indicating the standard deviations.
3 Results and discussion
In this work, the electrochemical behaviors of creatinine, copper, and copper–creatinine complexes were investigated at the Pt macrodisc electrode, Pt microdisc electrode, and Pt microelectrode array (Pt-MEA). Subsequently, an electrochemical sensor for creatinine detection was developed based on the formation of the copper–creatinine complexes. The analytical performance of the sensor was evaluated, and the sensor was then applied to synthetic urine samples.3.1 Cyclic voltammetry of creatinine at a Pt macrodisc electrode
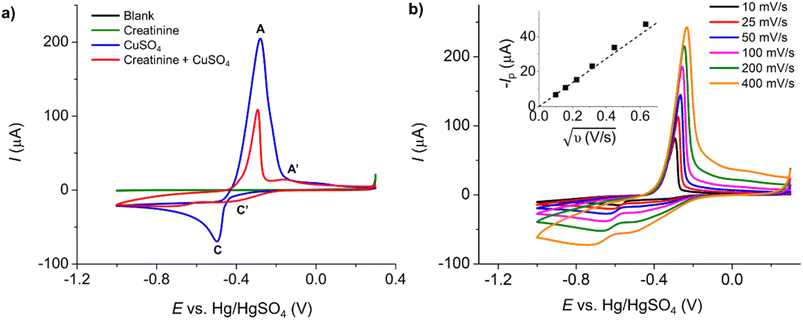
Initially, the electrochemical properties of creatinine and the formation of copper–creatinine complexes were investigated at a Pt macrodisc electrode in the presence of a 0.10 M K2SO4 supporting electrolyte. Fig. 1a illustrates that creatinine did not display any oxidation or reduction responses at the Pt macroelectrode, indicating its electrochemically inert nature in the aqueous solution within the studied potential window. However, upon the introduction of Cu2+ ions, the voltammogram exhibited distinct reversible reduction and oxidation peaks, denoted as C’ at −0.40 V and A’ at 0.16 V, respectively. These peaks emerged due to the complexation between copper ions and creatinine and were absent when only Cu2+ was present in the solution (without creatinine). The formation of Cu(II)–creatinine complex was evidenced by the change in the colors of the solutions as well as their corresponding UV-visible spectra, as shown in Fig. S4 in the ESI.†
 | (1) |
![[thin space (1/6-em)]](https://www.rsc.org/images/entities/char_2009.gif) 485 C mol−1), A is the electrode surface area, D is the diffusion coefficient, c∗ is the bulk concentration, v is the voltage scan rate, R is the molar gas constant, and T is the absolute temperature in kelvin.
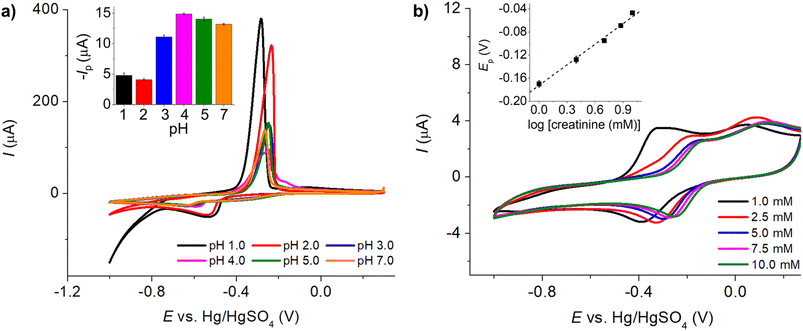
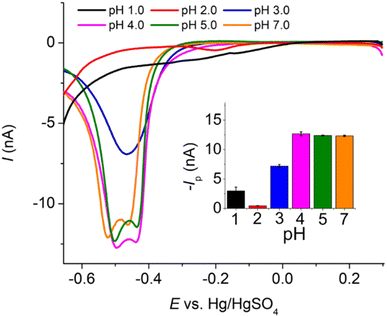
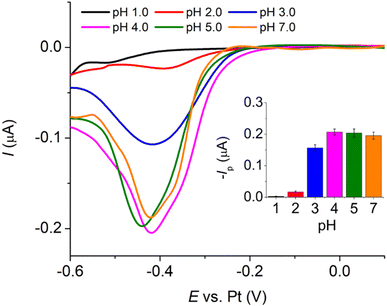
485 C mol−1), A is the electrode surface area, D is the diffusion coefficient, c∗ is the bulk concentration, v is the voltage scan rate, R is the molar gas constant, and T is the absolute temperature in kelvin.Fig. 2a illustrates that when pH < 3, the voltammetric response exhibits only the peaks corresponding to the oxidation and reduction of free copper ions, with no discernible presence of peaks associated with the copper–creatinine complexes. These observations suggest that at lower pH levels, the formation of a complex between creatinine and copper is not favorable or that creatinine experiences reduced stability under such acidic conditions.30 In contrast, at pH ≥ 3, distinct responses denoted by peaks C’ and A’ become apparent, which signifies the successful formation of copper–creatinine complexes under these specific pH conditions. Notably, the voltammograms manifest the most substantial cathodic peak C’ current at a pH of 4.0.
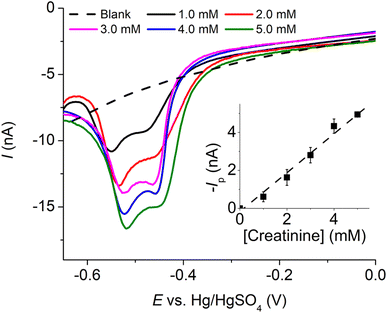
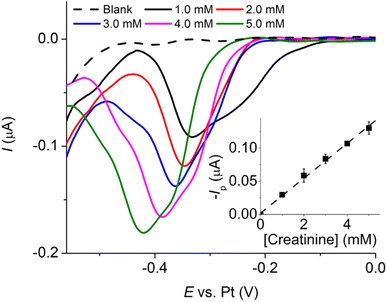
Subsequently, we explored the influence of creatinine concentrations on the voltammetric responses. As illustrated in Fig. 2b, an increase in creatinine concentrations corresponded to a shift in reduction peak potentials towards less negative values. This shift indicates that the Cu(II)–creatinine complex is more easily reducible than free Cu2+ and suggests an enhanced energetic stability of the reduction product. This observation aligns with the presence of peak C’ at a lower overpotential compared to the reduction of free Cu2+ as seen in the previous section.
The relationship between the change in peak potential (ΔEp) and log[creatinine] yielded a slope of −0.118 ± 0.006 V per decade of log[creatinine], which is consistent with prior studies conducted on a glassy carbon electrode.23 Our previous research has also delved into the identity of the copper–creatinine complex that forms when Cu2+ is introduced to aqueous creatinine solutions, and it has been identified as [Cu(creatinine)2(H2O)2]2+.23 Other thermodynamic parameters of the [Cu(creatinine)2(H2O)2]2+ complex such as binding energies, bond lengths, and charge distribution have also been reported.23 The results thus suggests that upon the application of cathodic potentials, the complex undergoes a one-electron reduction to form [Cu(creatinine)4]+, acquiring two additional creatinine molecules as ligands in replacement of water ligands.
The reduction reaction of the copper–creatinine complex that occurs at the electrode can be summarized below.
| [Cu(creatinine)2(H2O)2]2+(aq) + 2 creatinine(aq) + e− ⟶ [Cu(creatinine)4]+(aq) + 2 H2O(l) | (2) |
3.2 Cyclic voltammetry of creatinine at a Pt microdisc electrode
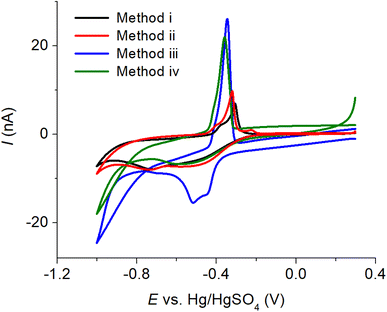
To obtain a reliable voltammetric response at a macroelectrode, a substantial amount (100-fold the concentration of the target analyte) of a supporting electrolyte is required.31 This ensures the creation of a homogeneous electric field undisturbed by the oxidation or reduction of the analyte, leading to a well-defined voltammetric response. However, in many cases, samples may have lower ionic strengths than required, necessitating the addition of supporting electrolytes during sample preparation. This introduces an extra step in the process. On the other hand, microelectrodes enable measurements in low ionic strength solutions and offer several advantages, including efficient radial diffusion, increased current density, reduced ohmic drop, and low capacitive current. Cyclic voltammetry of copper–creatinine complex was therefore next investigated at a Pt microdisc electrode in this section.In particular, our main focus lies in the use of electrochemical cleaning in sulfuric acid, a solvent commonly utilized for cleaning metal electrodes.32,33 Due to its strong acidic properties, the use of sulfuric acid in electrode cleaning has effectively eliminated various organic and inorganic impurities, as well as restored the electrode's conductivity and performance.34 Four methods were considered in this work: (i) mechanical polishing using alumina powder with three different sizes (1.0, 0.3, and 0.05 μm diameter), (ii) immersing the electrode in 0.50 M H2SO4 for 5.0 minutes at open circuit potential, (iii) applying a constant potential of 1.80 V for 5.0 minutes in 0.50 M H2SO4, and (iv) applying a constant potential of 1.80 V for 5.0 minutes, followed by cyclic voltammetry in the potential range from −1.80 to 1.80 V at a scan rate of 10.0 mV s−1 in 0.50 M H2SO4.
The voltammograms of the copper–creatinine complex in Fig. 4 demonstrate that ‘Method iii’ produced the highest cathodic peak currents and excellent reproducibility (%RSD = 1.42%, n = 3). Consequently, this method was chosen for the subsequent studies. Additionally, the cathodic measurement exhibited better reproducibility (%RSD = 1.42%, n = 3) compared to the anodic response (%RSD = 65.04%, n = 3). This difference arises from the high sensitivity of copper oxidation to various factors, including surface structures of the electrodes, residual O2 in solution, applied potential ranges, and electrode cleanliness.35 Given these considerations, the cathodic responses were employed for measuring the copper–creatinine complex in the following sections.
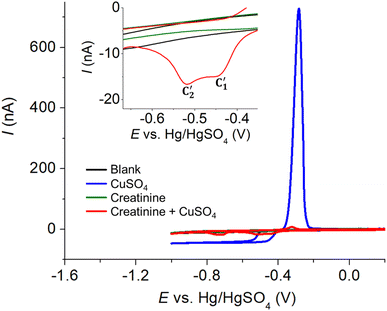 | ||
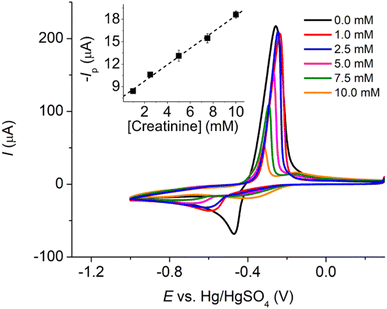
| Fig. 5 Cyclic voltammograms at a Pt microdisc electrode of blank 0.10 M K2SO4 (black), 10.0 mM CuSO4 (blue), 5.0 mM creatinine (green), and a mixture of 10.0 mM CuSO4 and 5.0 mM creatinine (red). | ||
Meanwhile, the voltammogram of free Cu2+ reduction yields a steady-state response due to convergent/radial diffusion at the microelectrode.36 Additionally, there is a peak-shaped anodic response whose peak size is limited by the amount of copper metal deposited on the electrode surface during the forward cathodic scan (Fig. 5, blue line).
In the presence of both creatinine and Cu2+, where the copper–creatinine complex is formed, two cathodic peaks emerged at −0.45 V and −0.52 V (Fig. 5, red line). The steady-state currents of free Cu2+ reduction was no longer observed after the complex formation. The peak splitting could be attributed to the two-step reduction: Cu(II) to Cu(I) and Cu(I) to Cu(0), possibly due to the stabilization of the Cu(I) intermediate by creatinine.23
It is worth noting that the oxidation response of copper, both in the presence and absence of creatinine, exhibits reproducibility issues, making it unsuitable for analytical purposes. As a result, our subsequent sections will place a predominant emphasis on the reduction reactions and present the outcomes using linear sweep voltammetry (LSV) in the reduction scans.
3.3 Cyclic voltammetry of creatinine at a Pt microelectrode arrays (Pt-MEA)
To further enhance the analytical performance and overcome the challenge of the low magnitude of currents that often lead to noise issues at a microscale electrode, Pt microelectrode arrays (Pt-MEA) were employed and investigated in this section. This approach allows us to maintain the advantages of microelectrodes, such as reduced ohmic drop and a low requirement for supporting electrolyte, while simultaneously improving the sensitivity of the measurement.The analytical performances of the three types of platinum electrodes investigated, namely Pt macrodisc electrode, Pt microdisc electrode, and Pt-MEA, have been summarized in Table 1 and compared with other existing electrochemical methods for creatinine detection. Notably, the utilization of Pt-MEA has significantly enhanced the sensitivity and limit of detection for creatinine detection through the copper complexes formation approach. Although the limit of detection (LOD) attained in this study was higher than that reported in certain prior investigations, it is important to emphasize that our sensitivity outperforms most existing methods, and the achieved LOD remains substantially lower than the typical urinary creatinine levels observed in healthy individuals (12.8 to 13.4 mM in males and 9.8 to 10.3 mM in females).39 The selectivity of the developed sensor and its application in synthetic urine will be evaluated in the subsequent sections.
| Electrode | Method | Linear range (mM) | Sensitivity (A m−2 M−1) | LOD (mM) | Ref. |
|---|---|---|---|---|---|
| a Abbreviations: AMP: chronoamperometry, CuPc: copper phthalocyanine, CV: cyclic voltammetry, DPV: differential pulse voltammetry, EPPG: edge plane pyrolytic graphite, ERGO: electrochemically reduced graphene oxide, GC: glassy carbon, LSV: linear sweep voltammetry, MIP: molecularly imprinted polymer, NPs: nanoparticles, PAA: polyacrylamide, μPAD: micropaper-based analytical device, Pt-MEA: Pt microelectrode arrays, SPCB: screen printed carbon black, SPCE: screen printed carbon electrode, SWV: square wave voltammetry. | |||||
| Au–Ag bimetallic | CV | 1.0–10.0 | 19![[thin space (1/6-em)]](https://www.rsc.org/images/entities/char_2009.gif) 391 391 |
0.8 | 40 |
| Cu/SCPE | DPV | 0.0–3.0 | 117 | 0.084 | 22 |
| 3.0–20.0 | |||||
| Cu2O/MIP/SPCE | AMP | 1–25 | 2169 | 2.2 × 10⁻⁵ | 41 |
| CuO/ERGO/SPCE | AMP | 0.01–2.0 | 280 | 2.0 × 10⁻⁴ | 42 |
| EPPG | CV | 0–6 | 1743 | 0.27 | 43 |
| 7.5–11.5 | |||||
| Fe3+ based μPAD/CB | DPV | 0.106–4.50 | N/A | 0.084 | 44 |
| Fe3+/CB/SPCB | DPV | 0.100–0.650 | N/A | 0.043 | 45 |
| PAA gel-Cu2+/Cu2O NPs/SPCE | DPV | 0.200–100 | N/A | 0.0065 | 46 |
| SPCE | SWV | 0.36–3.7 | 851 | 0.0086 | 47 |
| Pt macrodisc | CV | 1.00–10.00 | 347 ± 13 | 0.10 | This work |
| Pt microdisc | LSV | 0.00–5.00 | 2097 ± 80 | 0.670 | This work |
| Pt-MEA | LSV | 0.00–5.00 | 5401 ± 99 | 0.059 | This work |
3.4 Reproducibility tests
The reproducibility of voltammetric measurements was assessed for both within (intra) and between (inter) Pt-MEAs. For the mixture containing 4.0 mM creatinine and 10.0 mM CuSO4, the relative standard deviation (RSD) of voltammetric peak currents within the same Pt-MEA was determined to be 1.65% (n = 3, refer to Fig. S3a in the ESI†), showcasing the remarkable repeatability of the electrode. Furthermore, when comparing measurements across three different Pt-MEA electrodes, the RSD was calculated as 1.41% (n = 3, refer to Fig. S3b in the ESI†), indicating excellent reproducibility between electrodes.3.5 Interference studies
The selectivity of the developed method was examined by adding potential interferences commonly present in urine, such as 250.0 mM urea, 0.50 mM uric acid, 0.60 mM ascorbic acid, 20.0 μM dopamine, and 15.0 mM lactate. The concentrations of the interferences studied in this work were higher than those typically observed in human urine. The measurement of the mixture containing 5.0 mM creatinine and 10.0 mM CuSO4 at both the Pt microdisc electrode and Pt-MEA showed no significant changes in the current responses (<5%) when all the interferences were added, demonstrating the excellent selectivity of the developed method for creatinine detection.3.6 Application in synthetic urine
The developed method was used to detect creatinine in synthetic urine at both the Pt microdisc electrode and Pt-MEA. The developed method was investigated by standard addition method of 1.00 mM creatinine in the synthetic urine. Synthetic urine was prepared following established protocols from previous literature studies, as described in Section 2.1.29 When CuSO4 was added to the synthetic urine sample, precipitation occurred due to the complex formation of Cu2+ ions with anions such as hydrogen carbonate ion ([HCO3]−), dihydrogen phosphate ion ([H2PO4]−), and hydrogen phosphate ion ([HPO4]2−). To eliminate the anions, 100.0 mM CaCl2 was added to form complexes with the anions, and the solution was then filtered using filter paper. The percentage recoveries were found to be 99.02 ± 1.60% for the Pt microdisc electrode and 97.39 ± 4.78% for Pt-MEA. These close to 100% recoveries serve as a validation of the developed sensor's high selectivity, accuracy, and precision in detecting creatinine.The high selectivity of the developed sensor can be attributed to the strong affinity between Cu2+ and creatinine, leading to the formation of a distinctive electroactive complex. Previous theoretical studies have elucidated the strength of the interaction between copper ions and creatinine, encompassing critical parameters such as binding energies, bond lengths, and charge distribution.23 While it is plausible that other analytes could potentially form complexes with Cu2+, the resulting complexes would exhibit different electrochemical properties compared to the copper–creatinine complex. Consequently, they would not produce a reduction peak at the same potential. Additionally, this selectivity was ensured through the implementation of an excess quantity of Cu2+. This approach guarantees that, even in samples containing potential interfering chemical species, an ample supply of Cu2+ remains available for the formation of complexes with creatinine.
4 Conclusion
We have developed an electrochemical sensor for the determination of creatinine through the formation of copper–creatinine complexes at Pt microelectrode arrays (Pt-MEA), as well as Pt macrodisc and Pt microdisc electrodes. We have also established an electrode preparation method to ensure high electroactivity and reproducibility. The developed sensor has demonstrated high sensitivity, excellent reproducibility, selectivity, and a low limit of detection for precise creatinine determination. The method's validity was confirmed by percentage recoveries close to 100% in synthetic urine. The utilization of Pt-MEA allows simple and convenient analysis without the need for sample dilution or addition of supporting electrolytes, requiring only 10 μL of samples, which is beneficial in clinical analysis. This newly developed electrochemical approach offers promising potential for accurate and efficient creatinine detection in various applications, including clinical diagnostics and biomedical research. In addition to platinum (Pt), alternative electrode materials, which may potentially offer cost-effectiveness and equivalent or superior performance compared to platinum, could be explored.Conflicts of interest
The authors declare no known competing financial interests or personal relationships that could have appeared to influence the work reported in this paper.Acknowledgements
This work is financially supported by Suranaree University of Technology Research and Development Fund [Grant number: IRD1-102-66-12-33].References
- E. P. Randviir and C. E. Banks, Analytical methods for quantifying creatinine within biological media, Sens. Actuators, B, 2013, 183, 239–252 CrossRef CAS.
- W. das Neves, C. R. Alves, A. P. de Souza Borges and G. de Castro Jr, Serum creatinine as a potential biomarker of skeletal muscle atrophy in non-small cell lung cancer patients, Front. physiol., 2021, 12, 625417 CrossRef PubMed.
- R. Naguib and E. Elkemary, Thyroid Dysfunction and Renal Function: A Crucial Relationship to Recognize, Cureus, 2023, 15(2), e35242 Search PubMed.
- A. K. Netere and A. K. Sendekie, Time to doubling of serum creatinine in patients with diabetes in Ethiopian University Hospital: Retrospective follow-up study, Plos One, 2022, 17(9), e0274495 CrossRef CAS PubMed.
- S. Y. Kim and A. Moon, Drug-induced nephrotoxicity and its biomarkers, Biomol. Ther., 2012, 20(3), 268 CrossRef CAS PubMed.
- S. Gamagedara, H. Shi and Y. Ma, Quantitative determination of taurine and related biomarkers in urine by liquid chromatography–tandem mass spectrometry, Anal. Bioanal. Chem., 2012, 402, 763–770 CrossRef CAS PubMed.
- A. Hewavitharana and H. Bruce, Simultaneous determination of creatinine and pseudouridine concentrations in bovine plasma by reversed-phase liquid chromatography with photodiode array detection, J. Chromatogr. B, 2003, 784(2), 275–281 CrossRef CAS PubMed.
- S. Hanif, P. John, W. Gao, M. Saqib, L. Qi and G. Xu, Chemiluminescence of creatinine/H2O2/Co2+ and its application for selective creatinine detection, Biosens. Bioelectron., 2016, 75, 347–351 CrossRef CAS PubMed.
- L. Piéroni, P. Delanaye, A. Boutten, A.-S. Bargnoux, E. Rozet, V. Delatour, M.-C. Carlier, A.-M. Hanser, E. Cavalier and M. Froissart, A multicentric evaluation of IDMS-traceable creatinine enzymatic assays, Clin. Chim. Acta, 2011, 412(23–24), 2070–2075 CrossRef PubMed.
- Y.-H. Lin, S.-H. Wang, M.-H. Wu, T.-M. Pan, C.-S. Lai, J.-D. Luo and C.-C. Chiou, Integrating solid-state sensor and microfluidic devices for glucose, urea and creatinine detection based on enzyme-carrying alginate microbeads, Biosens. Bioelectron., 2013, 43, 328–335 CrossRef CAS PubMed.
- F. Wei, S. Cheng, Y. Korin, E. F. Reed, D. Gjertson, C.-m. Ho, H. A. Gritsch and J. Veale, Serum creatinine detection by a conducting-polymer-based electrochemical sensor to identify allograft dysfunction, Anal. Chem., 2012, 84(18), 7933–7937 CrossRef CAS PubMed.
- C.-H. Chen and M. S. Lin, A novel structural specific creatinine sensing scheme for the determination of the urine creatinine, Biosens. Bioelectron., 2012, 31(1), 90–94 CrossRef CAS PubMed.
- A.-S. Bargnoux, N. Kuster, E. Cavalier, L. Piéroni, J.-S. Souweine, P. Delanaye and J.-P. Cristol, Serum creatinine: advantages and pitfalls, J. Lab. Precis. Med., 2018, 3(8), 71 CrossRef.
- K. Allegaert, P. Vermeersch, A. Smits, D. Mekahli, E. Levtchenko and S. Pauwels, Paired measurement of urinary creatinine in neonates based on a Jaffe and an enzymatic IDMS-traceable assay, BMC Nephrol., 2014, 15(1), 1–5 CrossRef PubMed.
- A. Tiwari and S. Shukla, Chitosan-g-polyaniline: a creatine amidinohydrolase immobilization matrix for creatine biosensor, eXPRESS Polym. Lett., 2009, 3(9), 553–559 CrossRef CAS.
- M. Braiek, M. A. Djebbi, J.-F. Chateaux, A. Bonhomme, R. Vargiolu, F. Bessueille and N. Jaffrezic-Renault, A conductometric creatinine biosensor prepared through contact printing of polyvinyl alcohol/polyethyleneimine based enzymatic membrane, Microelectron. Eng., 2018, 187, 43–49 CrossRef.
- T. Osaka, S. Komaba and A. Amano, Highly sensitive microbiosensor for creatinine based on the combination of inactive polypyrrole with polyion complexes, J. Electrochem. Soc., 1998, 145(2), 406 CrossRef CAS.
- Q. Dong, H. Ryu and Y. Lei, Metal oxide based non-enzymatic electrochemical sensors for glucose detection, Electrochim. Acta, 2021, 370, 137744 CrossRef CAS.
- A. Nagarajan, V. Sethuraman and R. Sasikumar, Non-enzymatic electrochemical detection of creatinine based on a glassy carbon electrode modified with a Pd/Cu2O decorated polypyrrole (PPy) nanocomposite: an analytical approach, Anal. Methods, 2023, 15(11), 1410–1421 RSC.
- A. Nagarajan, V. Sethuraman, T. Sridhar and R. Sasikumar, Development of Au@NiO decorated polypyrrole composite for non-Enzymatic electrochemical sensing of cholesterol, J. Ind. Eng. Chem., 2023, 120, 460–466 CrossRef CAS.
- K. Ngamchuea, C. Moonla, A. Watwiangkham, S. Wannapaiboon and S. Suthirakun, Electrochemical and structural investigation of copper phthalocyanine: Application in the analysis of kidney disease biomarker, Electrochim. Acta, 2022, 428, 140951 CrossRef CAS.
- S. Jankhunthod, K. Kaewket, P. Termsombut, C. Khamdang and K. Ngamchuea, Electrodeposited copper nanoparticles for creatinine detection via the in situ formation of copper-creatinine complexes, Anal. Bioanal. Chem., 2023, 1–12 Search PubMed.
- K. Ngamchuea, S. Wannapaiboon, P. Nongkhunsan, P. Hirunsit and I. Fongkaew, Structural and electrochemical analysis of copper-creatinine complexes: application in creatinine detection, J. Electrochem. Soc., 2022, 169(2), 020567 CrossRef CAS.
- K. Ngamchuea, C. Lin, C. Batchelor-McAuley and R. G. Compton, Supported microwires for electroanalysis: sensitive amperometric detection of reduced glutathione, Anal. Chem., 2017, 89(6), 3780–3786 CrossRef CAS PubMed.
- K. Ngamchuea, C. Batchelor-McAuley and R. G. Compton, Anodic stripping voltammetry of silver in the absence of electrolytes: Theory and experiment, J. Electroanal. Chem., 2018, 830, 122–130 CrossRef.
- S. J. Rowley-Neale and C. E. Banks, Biosensors—Microelectrode Design and Operation, in Encyclopedia of Interfacial Chemistry, ed. K. Wandelt, Elsevier, Oxford, 2018, pp. 72–80 Search PubMed.
- A. Lavacchi, U. Bardi, C. Borri, S. Caporali, A. Fossati and I. Perissi, Cyclic voltammetry simulation at microelectrode arrays with COMSOL Multiphysics, J. Appl. Electrochem., 2009, 39, 2159–2163 CrossRef CAS.
- K. Kaewket, P. Janphuang, P. Laohana, N. Tanapongpisit, W. Saenrang and K. Ngamchuea, Silver microelectrode arrays for direct analysis of hydrogen peroxide in low ionic strength samples, Electroanalysis, 2023, 35(2), e202200200 CrossRef CAS.
- G. Jiang, J. Wang, Y. Yang, G. Zhang, Y. Liu, H. Lin, G. Zhang, Y. Li and X. Fan, Fluorescent turn-on sensing of bacterial lipopolysaccharide in artificial urine sample with sensitivity down to nanomolar by tetraphenylethylene based aggregation induced emission molecule, Biosens. Bioelectron., 2016, 85, 62–67 CrossRef CAS PubMed.
- X. Gao, R. Gui, H. Guo, Z. Wang and Q. Liu, Creatinine-induced specific signal responses and enzymeless ratiometric electrochemical detection based on copper nanoparticles electrodeposited on reduced graphene oxide-based hybrids, Sens. Actuators, B, 2019, 285, 201–208 CrossRef CAS.
- E. J. Dickinson, J. G. Limon-Petersen, N. V. Rees and R. G. Compton, How much supporting electrolyte is required to make a cyclic voltammetry experiment quantitatively “diffusional”? A theoretical and experimental investigation, J. Phys. Chem. C, 2009, 113(25), 11157–11171 CrossRef CAS.
- X. Xu, A. Makaraviciute, J. Pettersson, S.-L. Zhang, L. Nyholm and Z. Zhang, Revisiting the factors influencing gold electrodes prepared using cyclic voltammetry, Sens. Actuators, B, 2019, 283, 146–153 CrossRef CAS.
- L. Jacobse, S. J. Raaijman and M. T. Koper, The reactivity of platinum microelectrodes, Phys. Chem. Chem. Phys., 2016, 18(41), 28451–28457 RSC.
- A. Saeid and K. Chojnacka, Sulfuric Acid, in Encyclopedia of Toxicology, ed. P. Wexler, Academic Press, Oxford, 3rd edn, 2014, pp. 424–426 Search PubMed.
- K. Ngamchuea, An overview of the voltammetric behaviour of Cu single-crystal electrodes, Curr. Opin. Electrochem., 2022, 101193 Search PubMed.
- A. M. Bond, Past, present and future contributions of microelectrodes to analytical studies employing voltammetric detection. A review, Analyst, 1994, 119(11), 1R–21R RSC.
- K. Ahn Jin, Chapter 27–Acidosis, in Comprehensive Pediatric Hospital Medicine, ed. L. B. Zaoutis and V. W. Chiang, Mosby, Philadelphia, 2007, pp. 125–132 Search PubMed.
- M. R. Clarkson, C. N. Magee and B. M. Brenner, Chapter 2–Laboratory Assessment of Kidney Disease, in Pocket Companion to Brenner and Rector's The Kidney, ed. W. B. Saunders, Philadelphia, 8th edn, 2011, pp. 21–41 Search PubMed.
- K. Kashani, M. H. Rosner and M. Ostermann, Creatinine: From physiology to clinical application, Eur. J. Intern. Med., 2020, 72, 9–14 CrossRef CAS PubMed.
- A. Nene, C. Phanthong, W. Surareungchai and M. Somasundrum, Electrochemical detection of creatinine using Au–Ag bimetallic nanoparticles, J. Solid State Electrochem., 2023, 27, 2869–2875 CrossRef CAS.
- S. Nur Ashakirin, M. H. M. Zaid, M. A. S. M. Haniff, A. Masood and M. F. Mohd Razip Wee, Sensitive electrochemical detection of creatinine based on electrodeposited molecular imprinting polymer modified screen printed carbon electrode, Measurement, 2023, 210, 112502 CrossRef.
- S. Boobphahom, N. Ruecha, N. Rodthongkum, O. Chailapakul and V. T. Remcho, A copper oxide-ionic liquid/reduced graphene oxide composite sensor enabled by digital dispensing: Non-enzymatic paper-based microfluidic determination of creatinine in human blood serum, Anal. Chim. Acta, 2019, 1083, 110–118 CrossRef CAS PubMed.
- E. P. Randviir, D. K. Kampouris and C. E. Banks, An improved electrochemical creatinine detection method via a Jaffe-based procedure, Analyst, 2013, 138(21), 6565–6572 RSC.
- E. L. Fava, T. Martimiano do Prado, T. Almeida Silva, F. Cruz de Moraes, R. Censi Faria and O. Fatibello-Filho, New Disposable Electrochemical Paper-based Microfluidic Device with Multiplexed Electrodes for Biomarkers Determination in Urine Sample, Electroanalysis, 2020, 32(5), 1075–1083 CrossRef CAS.
- E. L. Fava, T. M. D. Prado, A. Garcia-Filho, T. A. Silva, F. H. Cincotto, F. Cruz de Moraes, R. C. Faria and O. Fatibello-Filho, Non-enzymatic electrochemical determination of creatinine using a novel screen-printed microcell, Talanta, 2020, 207, 120277 CrossRef CAS PubMed.
- S. Kalasin, P. Sangnuang, P. Khownarumit, I. M. Tang and W. Surareungchai, Evidence of Cu(I) Coupling with Creatinine Using Cuprous Nanoparticles Encapsulated with Polyacrylic Acid Gel-Cu(II) in Facilitating the Determination of Advanced Kidney Dysfunctions, ACS Biomater. Sci. Eng., 2020, 6(2), 1247–1258 CrossRef CAS PubMed.
- J.-C. Chen, A. Kumar, H.-H. Chung, S.-H. Chien, M.-C. Kuo and J.-M. Zen, An enzymeless electrochemical sensor for the selective determination of creatinine in human urine, Sens. Actuators, B, 2006, 115(1), 473–480 CrossRef CAS.
Footnote |
| † Electronic supplementary information (ESI) available. See DOI: https://doi.org/10.1039/d3ra06175b |
| This journal is © The Royal Society of Chemistry 2023 |

