 Open Access Article
Creative Commons Attribution 3.0 Unported Licence
Hydrophobic carboxymethyl cellulose as a clean-up sorbent in the determination of nitrofuran metabolites in animal-fat samples
Omar A. Thabet ab,
Faisal S. Al Muzinib,
Abdulaziz M. Atiyab,
Khalid A. Alamry
 *a,
Mahmoud A. Hussein
 *ac and
Richard Hoogenboom
 d
d
aDepartment of Chemistry, Faculty of Science, King Abdulaziz University, Jeddah 21589, Saudi Arabia. E-mail: kaalamri@kau.edu.sa; mahussein74@yahoo.com; maabdo@kau.edu.sa
bSaudi Food and Drug Authority, Jeddah 22311, Saudi Arabia
cChemistry Department, Faculty of Science, Assiut University, Assiut 71516, Egypt
dSupramolecular Chemistry Group, Department of Organic and Macromolecular Chemistry, Centre of Macromolecular Chemistry (CMaC)Ghent University, Krijgslaan 281 S4, 9000 Ghent, Belgium
First published on 10th November 2023
Abstract
Hydrophobic carboxymethyl cellulose (CMC) biopolymers were fabricated for the removal of fat from food sample matrices. The hydrophobic CMCs were synthesised via the esterification of CMC with three alcohols with carbon chains of different lengths, methanol, butanol, and octadecanol, in the presence of sulfuric acid. The structure of the three synthesised hydrophobic CMCs was verified using FT-IR, and the physicochemical properties were investigated by TGA, SEM, and X-ray. Characterization confirmed the successful synthesis of the hydrophobic CMCs and that the hydrophobic groups are embedded in the sorbent biopolymer to interact with fat and reduce the fat content of the sample extract. Moreover, the performance of the fabricated hydrophobic CMCs was studied in two applications: fat removal and the determination of nitrofuran (NF) metabolites in fat samples. In the first application, excellent results were observed for fat removal; the highest percentage of fat removed from food sample extracts was 94.2% and the lowest was 88.5%. Successful results were also observed in the determination of NF metabolites in fat samples, as the final extract was clear and pure using the hydrophobic CMCs, while it was turbid for the control sample. In addition, the recovery of four NF metabolites was in the range of 97–117%. In general, the hydrophobic CMCs showed promising and satisfactory results, with CMC-C18 exhibiting the best results. The NF detection method was validated using CMC-C18 in three spiking levels; 0.5, 1.0 and 1.5 μg kg−1. The average recoveries of NF range between 83.3 to 104.3%, and the intra-day precision was determined by coefficient of variation, which was below 10% for all NF. The limit of detection and limit of quantification were between 0.6 to 0.9 and 0.20 to 0.28 μg kg−1 respectively. For linearity, the correlation coefficient (r2) was higher than 0.99 for NF metabolites. Overall, the hydrophobic CMCs can be further developed and safely used as green sorbents in food analysis applications.
Introduction
The polysaccharide biopolymer cellulose is an important bioresource with unique properties. For this reason, it has been of research interest over the last few decades. It is the most abundant of the known biopolymers, is easy to obtain, low in cost, safe for humans and the environment, biodegradable, biocompatible, renewable, simple to chemically modify, and has numerous derivatives.1 These features make cellulose an ideal material, and as such it has been widely used in various fields, such as in food, medicine, environmental treatment, and the textile industry.2 Cellulose is composed of anhydro-D-glucopyranose units (AGUs), which feature three hydroxyl groups that increase the reactivity of the compound.3 Therefore, based on this structure, further modification and chemical functionalisation of cellulose have been successfully achieved to generate materials with desired properties, such as cellulose acetate, cellulose nitrate, methylcellulose, and carboxymethyl cellulose.4Carboxymethyl cellulose (CMC) is a well-known anionic derivative of the cellulose family that exhibits high solubility in water and a higher molecular weight than cellulose.5 It can be produced by replacing one of the hydroxyl groups in the AGU with a sodium carboxymethyl group. This reaction is achieved via alkalization followed by carboxymethylation. In alkalization, the hydroxyl group is activated using reaction media and sodium hydroxide, and after that carboxymethylation is achieved using monochloroacetate salt.6 CMC has been widely used in manufacturing and product development due to its unique chemical and physical properties. More than half a million tonnes of CMC are produced annually to be used in various applications, such as in pharmaceuticals, medicine, and food.7 In food, CMC is used as a thickener, stabilizer, and emulsifier8 as, like cellulose, it is safe, non-toxic, biocompatible, and biodegradable.9 Moreover, CMC can be chemically modified according to requirements. Modification can be achieved at the C2 and C3 hydroxyl groups in the AGU or at the C6 carboxyl group.10 As a result, the modified CMC can be tuned to have hydrophilic or hydrophobic properties.10–12
Nitrofuran (NF) metabolites analysis is one of challenging food analysis applications. They are a group of synthetic antibiotics used in aquaculture, honeybees, and livestock to treat bacterial infection.13 The chemical structure of NF features a nitro group embedded in a furan ring, which endows the compound with its bactericidal activity.14 There are four well-known compounds in the NF class of antibiotics that are commonly used in animal treatment: nitrofurazone (NFZ), furaltadone (FTD), furazolidone (FZD), and nitrofurantoin (NFT).15 These drugs exhibit a short half-life in organisms, and are converted to the metabolites semicarbazide (SEM), 3-amino-5-(4-morpholinyl-methyl)-1,3-oxazolidin-2-one (AMOZ), 3-amino-1,3-oxazolidin-2-one (AOZ), and 1-amino-hydantoin (AHD) after digestion.16 Several research studies have addressed the hazards associated with these NF metabolites, as they are considered to be highly toxic carcinogenic and mutagenic compounds.17 Therefore, most countries have banned NF usage, and set a value of 1 μg kg−1 as a minimum required performance limit (MRPL) for NF metabolites.18 In spite of this strict legislation, NFs are still used for treatment purposes in livestock.
To ensure the safety of animal products and monitor the abuse of NF drugs usage, many analytical methods have been developed, such as high-performance liquid chromatography coupled with tandem mass spectrometry (LC-MS/MS). As NF metabolites are low in molecular weight, the majority of analytical methods require the use of derivatisation techniques involving 2-nitrobenzaldehyde to detect NF metabolites reliably by LC-MS/MS.19 The most critical step in NF analysis is the clean-up process that has a significant effect on the recovery of the target compounds as well as the purity of the final extractor which is injected in the LC-MS/MS system. The efficiency of clean-up step is important to overcome animal matrix interferences, especially fats interference, which have a significant effect on NF metabolite determination at the MRPL level. Several approaches have been reported for clean-up techniques, for instance, solid phase extraction (SPE),14,20–22 liquid–liquid extraction (LLE)23–26 and freezing fats filtration.27,28 In spite of the diversity of such techniques, they have many limitations such as time consuming, high cost, large amount of used chemicals and low efficiency. Therefore, challenges still exist in terms of fat matrix interferences and the development of a green, low-cost, simple, and accurate clean-up technique is required.
In this study, a fat sorbent is developed using a biopolymer to remove fat interferences in clean-up step for NF metabolites detection analysis in animal-fat samples. The unique derivatives of CMC biopolymer were synthesized and chosen as a sorbent after doing some modification by embedding hydrophobic molecules to absorb fat present in the animal-fat sample. Practically, CMC was reacted with non-polar hydrocarbon chains by esterification via an eco-friendly ultrasound-assisted procedure to obtain hydrophobic CMCs. After that, the structures of the synthesized hydrophobic CMCs were verified using Fourier-transform infrared (FT-IR) spectroscopy, thermogravimetric analysis (TGA), scanning electron microscopy (SEM), and X-ray diffractometry (XRD). Finally, the performance of the hydrophobic CMCs was investigated for two applications: fat removal and the determination of NF metabolite residues from fat samples using LC-MS/MS.
Experimental
Materials and equipment
All solvents and chemicals were of analytical grade. Carboxymethyl cellulose CMC (Sigma Aldrich), methanol (99.8%, Fisher), 1-butanol (99.8%, Fisher), 1-octadecanol (97%, Alfa Aesar), sulfuric acid (96%, PanReac), ethanol (99.7%, VWR), acetone (99.5%, BDH), ethyl acetate (99.95%, HPLC grade, Fisher), dimethyl sulfoxide (99.5%, Fluka), hydrochloric acid (36%, ROMIL), deionised (DI) water (VWR), 2-nitrobenzaldehyde (2-NP) (Sigma Aldrich), anhydrous ammonium acetate (97%, VWR), anhydrous di-potassium hydrogen orthophosphate (99.0%, Sigma Aldrich), and sodium hydroxide (97%, Merck) were used in the experiments. AOZ, AHD, AMOZ, SEM, AMOZ-d5, AOZ-d4, AHD-13C3, and SEM-(13C,15N2) were purchased from Sigma Aldrich.The equipment used in the polymer synthesis, such as the ultrasonic water bath (Elmasonic-S 60H), 13![[thin space (1/6-em)]](https://www.rsc.org/images/entities/char_2009.gif) 000 rpm centrifuge (HERMLE), nitrogen evaporation water bath (Caliper, TurboVap LV), rotary shaker (Heidolph), ESI-LC MS/MS Triple Quad (6500+, sciex), were used for the NF metabolite determination. In regard to characterization techniques, FT-IR spectroscopy (Thermo Scientific, Nicolet iS50 FT-IR spectrometer) was used to identify functional groups, XRD (Bruker Co, D8 Discover, Cu target, 40 kV, 40 mA, wavelength 1.54 Å) was used to study crystallographic structures, differential scanning calorimetry thermogravimetry (DSC-TG) (Setaram, Themys one +) was used to study the response of the synthesized biopolymer to heating, and field-emission SEM (FE-SEM) (QUANTA FEG 205) was used to observe the microstructure the biopolymer.
000 rpm centrifuge (HERMLE), nitrogen evaporation water bath (Caliper, TurboVap LV), rotary shaker (Heidolph), ESI-LC MS/MS Triple Quad (6500+, sciex), were used for the NF metabolite determination. In regard to characterization techniques, FT-IR spectroscopy (Thermo Scientific, Nicolet iS50 FT-IR spectrometer) was used to identify functional groups, XRD (Bruker Co, D8 Discover, Cu target, 40 kV, 40 mA, wavelength 1.54 Å) was used to study crystallographic structures, differential scanning calorimetry thermogravimetry (DSC-TG) (Setaram, Themys one +) was used to study the response of the synthesized biopolymer to heating, and field-emission SEM (FE-SEM) (QUANTA FEG 205) was used to observe the microstructure the biopolymer.
Ultrasound-assisted esterification of CMC
CMC was modified by esterification via an eco-friendly ultrasound-assisted procedure using three alcohols with different carbon-chain lengths (methanol, butanol and octadecanol). The synthesis of the hydrophobic CMCs was adapted from similar literature methods.29–32 Briefly, three conical flasks with caps were prepared. To the first, CMC (1 g) in methanol (200 mL) was added (CMC-C1); to the second, butanol (450 mL) was added (CMC-C4); and to the third, octadecanol (4.5 g) in methanol (200 mL) was added (CMC-C18). After that, concentrated sulfuric acid 96% (1 mL) was added to each one, and then the flasks were placed in an ultrasonic water bath set at 40 °C for 2 h. After this time, the newly synthesised hydrophobic CMC products were filtered, then washed with about 50 mL of ethanol (70%) twice, followed by acetone. The new products were then dried in an oven at 40 °C for 1 h. The physical and chemical properties of the synthesised biopolymers were determined using different characterisation methods (FT-IR, XRD, DSC TG, and SEM).Determination of fat% removal
To investigate the performance of the synthesized hydrophobic CMCs in the removal of fat, chicken (2 g, fat sample) was extracted using the same method previously described. Next, the obtained fat was weighed after evaporating the solvent, and was then dissolved again using ethyl acetate before adding the hydrophobic CMCs. The mixture was shaken for 10 min in a rotary shaker, the solvent was evaporated, and then the sample was weighed to determine the remaining fat. The fat% removal was calculated by dividing the weight of the fat after using the hydrophobic CMCs by the initial weight of the fat, then multiplying the attained value by 100. This process was repeated three times and the average percentage was reported for each biopolymer.Nitrofuran (NF) metabolites analysis
The extraction of NF metabolites from tissue sample, including the derivatization process, were conducted according to a previous method reported in the literature, with slight modifications.33 Briefly, a sample (2 g) of minced and homogenized chicken was weighed in a test tube, then fortified with NF metabolites and isotope internal standards at a level of 100 μg kg−1. After that, DI water (4 mL), 1 M HCl (0.5 mL), and 50 mM 2-NP (150 μL) were added sequentially to the sample. The mixture was then vortexed and placed in a dark and closed water bath at 50 °C for 2 h. Next, the pH was adjusted by adding 0.1 M K2HPO4 (5 mL) and 1 M NaOH (0.4 mL). The sample was then vortexed again, and ethyl acetate (5 mL) was added to extract the target analytes. After shaking for 1 min, the test tube was placed in a centrifuge at 4000 rpm at 4 °C for 5 min. The upper layer of the sample was then collected in a clean test tube and evaporated to dryness using an evaporation system. After that, the analytes were re-dissolved in MeOH (400 μL) and 0.1 g of the hydrophobic CMCs were added. The mixture was then shaken for 10 min, before being centrifuged again at 4000 rpm at 4 °C for 5 min. Finally, the upper layer of the sample was transferred to an LC vial.LC-MS/MS analysis
The instrumentation setup was displayed under ideal conditions, the used system was +ESI LC-MS/MS AB Science Triple Quad 6500+ equipped with an Agilent UPLC 1290. The separation of NF compounds was achieved at flow rate of 0.2 mL min−1, with injection volume 5 μL. The mobile phase was a gradient containing 80% 0.5 mM ammonium acetate in methanol (eluent A) and pure methanol (eluent B), with gradient programme as follows: 0 min: 20% B, 7 min: 55% B, 8 min: 20% B, 13 min: 20% B. The total run was 13 min including the washing step. The analytical column was reverse phase (Luna 150 × 2 mm, 3 μm C18(2) 100 Å), which was operated at column oven at 40 °C. The mass spectrometry was Triple Q 6500+ with electrospray ionization at positive mode (+ESI). The ion source parameters were as follows: temp. 550 °C, ion spray voltage 5500 V, curtain gas pressure 35 psi, collision gas 8 psi, ion source gas 1 pressure 50 psi, ion source gas 2 pressure 60 psi. The detection of NF analytes was done by Multiple Reaction Monitoring (MRM) mode, all MRMs and compound-dependent parameters were illustrated in Table 1.| Analyte | Precursor ion (m/z) | Product ions (m/z) | DP (V) | CE (eV) |
|---|---|---|---|---|
| a Quantifier ion, DP (declustering potential), CE (collision energy). | ||||
| 2-NP-SEM | 209.1 | 166.2a, 192.2 | 46 | 13, 25 |
| 2-NP-SEM-13C,15N2 | 212.2 | 168.2 | 46 | 15 |
| 2-NP-AOZ | 236.0 | 134.1a, 104.0 | 46 | 17, 30 |
| 2-NP-AOZ-D4 | 240.4 | 134.1 | 100 | 17 |
| 2-NP-AHD | 249.0 | 134.0a, 178.1 | 46 | 20, 20 |
| 2-NP-AHD-13C3 | 252.0 | 134.0 | 111 | 15 |
| 2-NP-AMOZ | 334.8 | 291.1a, 262.1 | 116 | 15, 25 |
| 2-NP-AMOZ-D4 | 339.7 | 296.0 | 116 | 17 |
Results and discussion
Synthesis
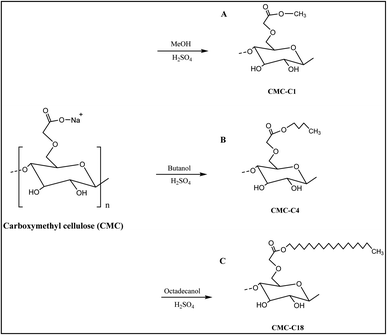
The synthesis of the hydrophobic CMCs was conducted by esterification of CMC with three different alcohols to endow the biopolymer with hydrophobic properties. First, esterification was performed with methanol, which contains one carbon (CMC-C1). Second, butanol was added to the biopolymer to form CMC linked to a chain containing four hydrocarbons (CMC-C4). Finally, to obtain CMC with a long hydrocarbon chain, octadecanol was added to obtain a biopolymer with 18 hydrocarbons (CMC-C18), which increased the hydrophobicity of CMC. The synthesised hydrophobic CMCs are shown in Fig. 1.Characterisation
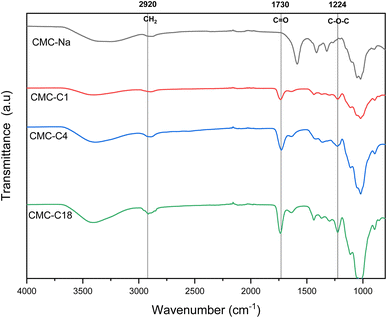
The structures and physicochemical properties of the synthesized hydrophobic CMCs were verified using several characterization methods.![[double bond, length as m-dash]](https://www.rsc.org/images/entities/char_e001.gif) O group can be observed at 1730 cm−1, which is also observed for pure CMC-Na shifted to 1600 cm−1 due to the esterification with the alcohol. Hence, the successful esterification of CMC for all the hydrophobic CMCs was confirmed by the presence of both characteristic bands at 1224 cm−1 and 1730 cm−1. In addition, additional bands confirm the conserving of the structure of CMC, such as the band at 2920 cm−1 related to the C–H stretching of a CH2 group, as well as the broad band between 3200 cm−1 and 3600 cm−1 attributed to the stretching vibration of O–H. All the mentioned characteristic bands are consistent with the bands previously reported for similar structures reported in the literature.29,34–38
O group can be observed at 1730 cm−1, which is also observed for pure CMC-Na shifted to 1600 cm−1 due to the esterification with the alcohol. Hence, the successful esterification of CMC for all the hydrophobic CMCs was confirmed by the presence of both characteristic bands at 1224 cm−1 and 1730 cm−1. In addition, additional bands confirm the conserving of the structure of CMC, such as the band at 2920 cm−1 related to the C–H stretching of a CH2 group, as well as the broad band between 3200 cm−1 and 3600 cm−1 attributed to the stretching vibration of O–H. All the mentioned characteristic bands are consistent with the bands previously reported for similar structures reported in the literature.29,34–38
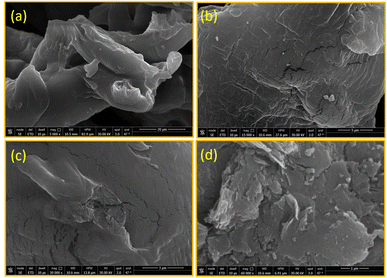
![[thin space (1/6-em)]](https://www.rsc.org/images/entities/char_2009.gif) 00×, where the sample surface has a hard appearance with tiny voids. At a higher magnification of 300
00×, where the sample surface has a hard appearance with tiny voids. At a higher magnification of 300![[thin space (1/6-em)]](https://www.rsc.org/images/entities/char_2009.gif) 00× (Fig. 5c), the sample surface is mountainous in appearance with deep voids. At the highest magnification of 600
00× (Fig. 5c), the sample surface is mountainous in appearance with deep voids. At the highest magnification of 600![[thin space (1/6-em)]](https://www.rsc.org/images/entities/char_2009.gif) 00× (Fig. 5d), the surface of CMC-C18 shows aggregated slices and particles like hills. These changes in the surface of CMC-C18 confirm the successful chemical modification of the biopolymer and its increased surface area, which boost its absorbance and enhance its interaction with the target.
00× (Fig. 5d), the surface of CMC-C18 shows aggregated slices and particles like hills. These changes in the surface of CMC-C18 confirm the successful chemical modification of the biopolymer and its increased surface area, which boost its absorbance and enhance its interaction with the target.
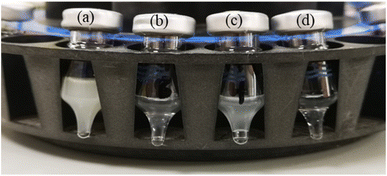 | ||
| Fig. 6 The physical appearance of the final extractor of nitrofuran metabolites determination, (a) QC (without Hydrophobic CMCs), (b) CMC-C18, (c) CMC-C4, (d) CMC-C1. | ||
The second investigation in the performance of the hydrophobic CMCs was undertaken by determining the effect of the hydrophobic CMCs on the target analytes. Tissue sample was spiked with the NF metabolites (SEM, AOZ, AMOZ, and AHD) and then the recoveries were studied after applying the hydrophobic CMCs as a clean-up step. Table 1 illustrates the concentrations and recoveries of NF metabolites using the hydrophobic CMCs. The results show that the NF metabolite concentrations and recoveries are between 0.97 and 1.17 μg kg−1 and 97–117%, respectively, excluding the recovery of AMOZ in CMC-C4, which was around 157%. This result could be an overestimation due to the used sample interference. Overall, the hydrophobic CMCs were able to remove the unwanted matrix, especially fats, and maintain the target analytes without effecting their extraction. All recoveries were acceptable and met the specifications stipulated in EU regulation 2002/657/EC,47 which states that recovery should be between 50 and 120% for concentrations of ≤1 μg kg−1. The multiple reaction monitoring (MRM) chromatograms of NF metabolites and their isotope internal standards in a spiked sample are shown in Fig. 7.
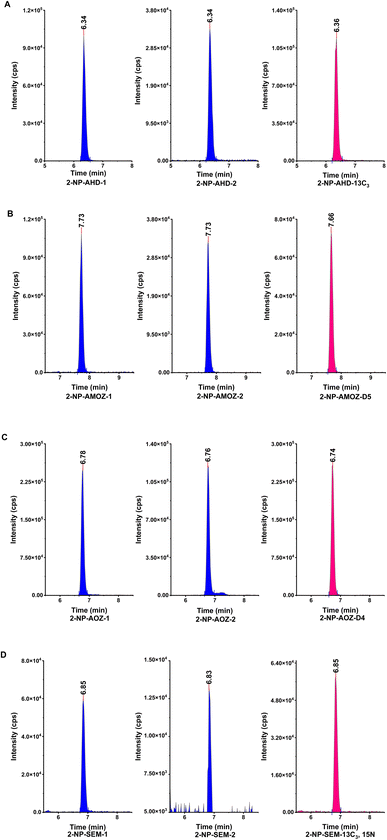 | ||
| Fig. 7 The chromatograms of nitrofuran metabolites MRMs and isotope internal standard, (A) 2-NP-AHD, (B) 2-NP-AMOZ, (C) 2-NP-AOZ, (D) 2-NP-SEM. | ||
It is important to note that the regeneration and reusability of hydrophobic CMCs are not preferred due to they were interacted with fat matrix of food sample and will be precipitated and discard at the end of analysis. The rewash or removing of the fat content by organic solvent could damage the structure of hydrophobic CMCs or remove it as well with fat molecules.
| Analyte | Spike level (μg kg−1) | CMC-C1 | CMC-C4 | CMC-C18 | ||||||
|---|---|---|---|---|---|---|---|---|---|---|
| Conc. (μg kg−1) | Recovery (%) | CV (%) | Conc. (μg kg−1) | Recovery (%) | CV (%) | Conc. (μg kg−1) | Recovery (%) | CVa (%) | ||
| a CV: coefficient of variation. | ||||||||||
| AOZ | 1 | 1.12 | 112 | 6.7 | 1.02 | 102 | 3.9 | 1.17 | 117 | 2.8 |
| AMOZ | 1.05 | 105 | 5.3 | 1.57 | 157 | 11.9 | 1.15 | 115 | 4.0 | |
| AHD | 1.08 | 108 | 6.3 | 0.97 | 97 | 4.3 | 1.04 | 104 | 6.7 | |
| SEM | 1.03 | 103 | 5.3 | 1.007 | 100 | 4.2 | 1.04 | 104 | 5.9 | |
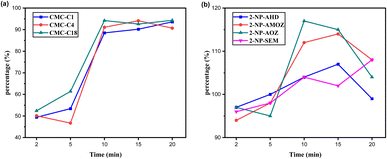
The shaking time after adding the hydrophobic CMCs was studied and optimised due to the significant effect it has on fat removal and maintaining the target analytes. Shaking times of 2, 5, 10, 15 and 20 min were selected for both applications. Fig. 8a shows the fat% removal over three experiments. It can be seen that the hydrophobic CMCs removed 45–65% of fat content after 2 to 5 min of shaking, which increased to 85–95% by 10 min. After 15 to 20 min of shaking, the fat% removal slightly increased for CMC-C1 and CMC-C4 and slightly decreased for CMC-C18. Therefore, 10 min of shaking was determined to be the optimal time needed to remove fat from the sample.
Regarding the NF metabolite application, the same shaking times were studied for types of the hydrophobic CMCs to evaluate their performance. All the shaking times were able to maintain NF recoveries of 94–117%, as shown in Fig. 8b. So, the optimal shaking time of 10 min for fat% removal was determined to be suitable for NF recovery Table 3.
| Analyte | Spiking level | Recovery | Intra-day precision | Correlation coefficient | LOD | LOQ |
|---|---|---|---|---|---|---|
| (μg kg−1) | % | (% CV) | (r2) | (μg kg−1) | (μg kg−1) | |
| AOZ | 1.5 | 103.3 | 4.8 | 0.9957 | 0.09 | 0.28 |
| 1 | 102.9 | 5.5 | ||||
| 0.5 | 93.8 | 5.9 | ||||
| AMOZ | 1.5 | 98.7 | 6.4 | 0.9985 | 0.06 | 0.20 |
| 1 | 99.6 | 5.5 | ||||
| 0.5 | 96.2 | 4.2 | ||||
| AHD | 1.5 | 99.3 | 4.5 | 0.9966 | 0.08 | 0.27 |
| 1 | 104.3 | 3.1 | ||||
| 0.5 | 89.5 | 6.0 | ||||
| SEM | 1.5 | 99.9 | 4.7 | 0.9944 | 0.08 | 0.27 |
| 1 | 95.7 | 4.9 | ||||
| 0.5 | 83.3 | 6.5 |
Compared to others sorbents or processes of fat removal such as freezing, SPE and LLE, hydrophobic CMCs materials are green based on biopolymer. They are also reducing the analysis time, low cost and small quantity to remove fats. Table 5 summaries the most common sorbents or processes that have been used in fat removal of food sample analysis.
| No. | Sorbent/process | Technique | Application | Removal% | Adv. | Dis-adv. | Ref. |
|---|---|---|---|---|---|---|---|
| 1 | Freezing-lipid filtration | Freezing | Endocrine-disrupting phenols in fish sample | 90 | Low-cost, simple | Time-consuming, interference with analyte | 27 and 28 |
| 2 | Hexane | LLE | Pesticide analysis in high-fat samples | 47 | Fast, simple | Large amount of solvents, low efficiency | 24 |
| 3 | Acidic or basic treatments | LLE | Steroids in animal tissues | NA | Simple | Large amount of solvents, low efficiency, many interference | 25 and 26 |
| 4 | C18, silica, phenyl | Automatic TurborFlow online SPE column | Veterinary drug residues in milk | NA | Reducing-error source, high efficiency | High-cost, instrumentation, large amounts of solvent, time-consuming, contamination | 49 |
| 5 | PSA, C18, MgSO4 | d-SPE | Sulfonamides in bovine liver | NA | Simple, fast, kit package | High cost, analytes suppression | 50 |
| 6 | EMR-lipid | d-SPE | Mycotoxins, acrylamide and 5-hydroxymethylfurfural in biscuit | NA | Simple, fast, kit package, nanomaterial | Unknown material, high cost | 20 and 21 |
| 7 | Florisil | SPE column | Pesticide residues in olives and olive oil | NA | Simple, commercially available | Time consuming, large amount of solvents | 22 |
| 8 | Hydrophobic CMCs biopolymer | d-SPE | Nitrofuran metabolites in fat sample food | 88.5–94.2 | Simple, fast, green | Need synthesis | This work |
Conclusion
In this work, CMC was chemically modified by esterifying it with methanol, butanol, and octadecanol in the presence of sulfuric acid to obtain the respective hydrophobic biopolymers. The synthesis occurred successfully, then confirmed by characterization techniques. The performance of the synthesised hydrophobic CMCs was investigated by measuring the fat removal percentage and their use as clean-up sorbents in NF metabolite determination. The hydrophobic CMCs showed high performance by removing fat from food sample extracts. Detection of NF metabolites were investigated using the hydrophobic CMCs, and the method was validated using CMC-C18 as clean-up sorbent. The use of the hydrophobic CMCs as sorbents in food analysis applications, especially for foods with a high fat content, shows promise as a fast, low-cost, eco-friendly, and simple method. It is thus highly recommended to use hydrophobic CMCs in other food analysis applications, either as a removal sorbent or to extract target analytes. Moreover, the hydrophobic CMCs could be further developed using nanocomposites to produce nanomaterials with specific and distinct properties.Disclaimer
“The views expressed in this paper are those of the author(s) and do not necessarily reflect those of the SFDA or its stakeholders. Guaranteeing the accuracy and the validity of the data is solely the responsibility of the research team”.Author contributions
O. A. Thabet: methodology, investigation, writing – original draft; F. S. Al Muzini and A. M. Atiya: methodology, investigation; K. A. Alamry and M. A. Hussein: conceptualization, investigation, writing – review & editing; R. Hoogenboom: review & editing – final draft.Conflicts of interest
There are no conflicts to declare.Acknowledgements
The Deanship of Scientific Research (DSR), King Abdulaziz University, Jeddah, Saudi Arabia, funded this project under grant no. KEP-Phd-46-130-1443. The authors, therefore acknowledge with thanks DSR technical and financial support. Furthermore, the authors are grateful to the Jeddah lab, Saudi Food and Drug Authority (SFDA), Saudi Arabia, for providing the study equipment and obtaining permission to publish this work.References
- P. Heasman, A. Y. Mehandzhiyski, S. Ghosh and I. Zozoulenko, A computational study of cellulose regeneration: All-atom molecular dynamics simulations, Carbohydr. Polym., 2023, 311(1–9), 120768, DOI:10.1016/J.CARBPOL.2023.120768.
- M. K. Bin Bakri, M. R. Rahman and F. I. Chowdhury, “Chapter 1 – Sources of cellulose”, in Fundamentals and Recent Advances in Nanocomposites Based on Polymers and Nanocellulose, ed. M. R. Rahman, Elsevier, 2022, pp. 1–18, DOI:10.1016/B978-0-323-85771-0.00012-9.
- A. F. Lehrhofer, T. Goto, T. Kawada, T. Rosenau and H. Hettegger, The in vitro synthesis of cellulose – A mini-review, Carbohydr. Polym., 2022, 285(1–10), 119222, DOI:10.1016/J.CARBPOL.2022.119222.
- L. W. Wong, M. Fahimizadeh and J. B. L. Tan, Cellulose and cellulose derivatives-based nanosystems as therapeutic platform, Polymeric Nanosystems, 2023, vol. 1, pp. 113–147, DOI:10.1016/B978-0-323-85656-0.00022-X.
- M. C. Popescu, B. I. Dogaru and C. M. Popescu, Effect of cellulose nanocrystals nanofiller on the structure and sorption properties of carboxymethyl cellulose-glycerol-cellulose nanocrystals nanocomposite systems, Materials, 2020, 13(1–15), 2900, DOI:10.3390/ma13132900.
- H. Wahyuni, S. Yuliasmi, H. Aisyah and D. Riati, Characterization of Synthesized Sodium Carboxymethyl Cellulose with Variation of Solvent Mixture and Alkali Concentration, Open Access Maced. J. Med. Sci., 2019, 7, 3878–3881, DOI:10.3889/oamjms.2019.524.
- A. Pettignano, A. Charlot and E. Fleury, Solvent-free synthesis of amidated carboxymethyl cellulose derivatives: Effect on the thermal properties, Polymers, 2019, 11(1–18), 1227, DOI:10.3390/polym11071227.
- L. Zhou, et al., Effects of carboxymethyl cellulose on the emulsifying, gel and digestive properties of myofibrillar protein-soybean oil emulsion, Carbohydr. Polym., 2023, 309, 120679, DOI:10.1016/J.CARBPOL.2023.120679.
- Y. Geng, et al., Recent advances in carboxymethyl chitosan-based materials for biomedical applications, Carbohydr. Polym., 2023, 305, 120555, DOI:10.1016/J.CARBPOL.2023.120555.
- S. Dacrory, H. Abou-Yousef, S. Kamel, R. Abouzeid, M. Abelaziz and M. Elbadry, Functionalization and cross-linking of carboxymethyl cellulose in aqueous media, Cellul. Chem. Technol., 2019, 53, 23–33, DOI:10.35812/CelluloseChemTechnol.2019.53.03.
- Y. Wang, X. Wang, Y. Xie and K. Zhang, Functional nanomaterials through esterification of cellulose: a review of chemistry and application, Cellulose, 2018, 25, 3703–3731, DOI:10.1007/s10570-018-1830-3.
- J. Strätz, A. Liedmann, M.-L. Trutschel, K. Mäder, T. Groth and S. Fischer, Development of hydrogels based on oxidized cellulose sulfates and carboxymethyl chitosan, Cellulose, 2019, 26, 7371–7382, DOI:10.1007/s10570-019-02596-6.
- A. O. Melekhin, V. V. Tolmacheva, V. V. Apyari and S. G. Dmitrienko, Current trends in analytical strategies for the chromatographic determination of nitrofuran metabolites in food samples. An update since 2012, J. Chromatogr. A, 2022, 1685, 463620, DOI:10.1016/J.CHROMA.2022.463620.
- X. Gong, et al., Determination of Nitrofuran Metabolites in Complex Food Matrices Using a Rough, Cheap, Easy-Made Wooden-Tip-Based Solid-Phase Microextraction Probe and LC-MS/MS, J. Chem., 2022, 2022(1–12), 1315276, DOI:10.1155/2022/1315276.
- B. Owusu-Doubreh, W. O. Appaw and V. Abe-Inge, Antibiotic residues in poultry eggs and its implications on public health: A review, Sci. Afr., 2023, 19(1–9), e01456, DOI:10.1016/J.SCIAF.2022.E01456.
- G. Regan, C. Elliott and M. Danaher, Nitrofuran Antibacterials and the Analysis of Their Residues in Food, Elsevier Reference Collection in Food Science, 2023, DOI:10.1016/B978-0-12-822521-9.00107-6.
- N. Nabilah Mohd Noor, N. Hazirah Kamaruzaman, A. Al-Gheethi, R. Maya Saphira Radin Mohamed and M. S. Hossain, Degradation of antibiotics in aquaculture wastewater by bio-nanoparticles: A critical review, Ain Shams Eng. J., 2023, 14(1–13), 101981, DOI:10.1016/J.ASEJ.2022.101981.
- European Union, “2003/181/EC: Commission Decision of 13 March 2003 Amending Decision 2002/657/EC as Regards the Setting of Minimum Required Performance Limits (MRPLs) for Certain Residues in Food of Animal Origin (Text with EEA Relevance) (notified under document number C (2003) 764)”, Official Journal of the European Union, 2003, vol. L 071, pp. 17–18 Search PubMed.
- P. Guichard, M. Laurentie, D. Hurtaud-Pessel and E. Verdon, Confirmation of five nitrofuran metabolites including nifursol metabolite in meat and aquaculture products by liquid chromatography-tandem mass spectrometry: Validation according to European Union Decision 2002/657/EC, Food Chem., 2021, 342, 128389, DOI:10.1016/J.FOODCHEM.2020.128389.
- M. D. Peres, S. Nascimento and F. S. Pelicao, A new clean-up approach for stomach content toxicological analysis, Forensic Sci. Int., 2019, 302, 109936, DOI:10.1016/j.forsciint.2019.109936.
- Y. Long, et al., Development of QuEChERS clean-up based on EMR-lipid for simultaneous analysis of 9 mycotoxins, acaylamide and 5-Hydroxymethylfurfural in biscuit by UHPLC-MS/MS, Food Chem., 2023, 409, 135265, DOI:10.1016/j.foodchem.2022.135265.
- C. Ferrer, et al., Determination of pesticide residues in olives and olive oil by matrix solid-phase dispersion followed by gas chromatography/mass spectrometry and liquid chromatography/tandem mass spectrometry, J. Chromatogr. A, 2005, 1069, 183–194, DOI:10.1016/j.chroma.2005.02.015.
- M. Yang, et al., Rapid determination of nitrofuran metabolites residues in honey by ultrasonic assisted derivatization - QuEChERS - high performance liquid chromatography/tandem mass spectrometry, J. Food Compos. Anal., 2022, 114, 104812, DOI:10.1016/J.JFCA.2022.104812.
- P. Toledo Netto, et al., A rapid, environmentally friendly, and reliable method for pesticide analysis in high-fat samples, Talanta, 2012, 101, 322–329, DOI:10.1016/j.talanta.2012.09.034.
- A. A. Stolker, P. W. Zoontjes and L. A. Ginkel, The use of supercritical fluid extraction for the determination of steroids in animal tissues, Analyst, 1998, 123, 2671–2676, 10.1039/a805127e.
- C. Naert, M. Piette, N. Bruneel and C. Van Peteghem, Occurrence of Polychlorinated Biphenyls and Polybrominated Diphenyl Ethers in Belgian Human Adipose Tissue Samples, Arch. Environ. Contam. Toxicol., 2006, 50, 290–296, DOI:10.1007/s00244-004-0234-6.
- Y. G. Ahn, J. Seo, J. H. Shin, J. Khim and J. Hong, Development of new cleanup method of polychlorinated dibenzo-p-dioxins/dibenzofurans in fish by freezing-lipid filtration, Anal. Chim. Acta, 2006, 576, 31–36, DOI:10.1016/j.aca.2006.03.010.
- Y. G. Ahn, et al., Application of solid-phase extraction coupled with freezing-lipid filtration clean-up for the determination of endocrine-disrupting phenols in fish, Anal. Chim. Acta, 2007, 603, 67–75, DOI:10.1016/j.aca.2007.09.045.
- D. Murdzheva and P. Denev, Chemical modification of alginic acid by ultrasonic irradiation, Acta Sci. Nat., 2016, 3, 13–18, DOI:10.1515/asn-2016-0002.
- T. Taubner, M. Marounek and A. Synytsya, Preparation and characterization of amidated derivatives of alginic acid, Int. J. Biol. Macromol., 2017, 103, 202–207, DOI:10.1016/j.ijbiomac.2017.05.070.
- M. loelovich, Adjustment of Hydrophobic Properties of Cellulose Materials, Polymers, 2021, 13, 1241, DOI:10.3390/polym13081241.
- D. Santos, et al., A single step ultrasound-assisted nitrocellulose synthesis from microcrystalline cellulose, Ultrason. Sonochem., 2021, 72, 105453, DOI:10.1016/j.ultsonch.2020.105453.
- D. Chen, J.-M. Delmas, D. Hurtaud-Pessel and E. Verdon, Development of a multi-class method to determine nitroimidazoles, nitrofurans, pharmacologically active dyes and chloramphenicol in aquaculture products by liquid chromatography-tandem mass spectrometry, Food Chem., 2020, 311, 125924, DOI:10.1016/j.foodchem.2019.125924.
- S. M. Shaban, I. Aiad, A. H. Moustafa and O. H. Aljoboury, Some alginates polymeric cationic surfactants; surface study and their evaluation as biocide and corrosion inhibitors, J. Mol. Liq., 2019, 273, 164–176, DOI:10.1016/j.molliq.2018.10.017.
- M. Rozali, Z. Ahmad and M. I. N. Mohamad Isa, Interaction Between Carboxy Methylcellulose and Salicylic Acid Solid Biopolymer Electrolytes, Adv. Mater. Res., 2015, 1107, 223–229, DOI:10.4028/www.scientific.net/AMR.1107.223.
- J. Ning, et al., Synergetic Sensing Effect of Sodium Carboxymethyl Cellulose and Bismuth on Cadmium Detection by Differential Pulse Anodic Stripping Voltammetry, Sensors, 2019, 19(1–17), 5482, DOI:10.3390/s19245482.
- S. Ghazali, K. Kubulat, M. I. N. Mohamad Isa, A. S. Samsudin and W. M. K. Wan Mohamed Zin, Contribution of Methyl Substituent on the Conductivity Properties and Behaviour of CMC-Alkoxy Thiourea Polymer Electrolyte, Mol. Cryst. Liq. Cryst., 2014, 604, 126–141, DOI:10.1080/15421406.2014.968058.
- M. Rozali, N. Ahmad and M. I. N. Mohamad Isa, Effect of Adipic Acid Composition on Structural and Conductivity Solid Biopolymer Electrolytes Based on Carboxy Methylcellulose Studies, Am. -Eurasian J. Sustain. Agric., 2015, 9, 39–45 Search PubMed.
- K. A. Alamry and A. Khan, Efficient and easily retrievable green modified carboxymethyl cellulose coated A. indica stem bark encapsulated metal nanoparticles towards the reduction of o-nitrophenol and azo dyes, Appl. Nanosci., 2021, 11, 1057–1074, DOI:10.1007/s13204-021-01672-3.
- H. Abou-Yousef, E. Saber, M. S. Abdel-Aziz and S. Kamel, Efficient alternative of antimicrobial nanocomposites based on cellulose acetate/Cu-NPs, Soft Matter, 2018, 16, 141–150, DOI:10.1080/1539445X.2018.1457540.
- A. Abdel-Galil, H. E. Ali, A. Atta and M. R. Balboul, Influence of nanostructured TiO2 additives on some physical characteristics of carboxymethyl cellulose (CMC), J. Radiat. Res. Appl. Sci., 2014, 7(1), 36–43, DOI:10.1016/j.jrras.2013.11.004.
- M. Jebrane, N. Terziev and I. Heinmaa, Biobased and Sustainable Alternative Route to Long-Chain Cellulose Esters, Biomacromolecules, 2017, 18, 498–504, DOI:10.1021/acs.biomac.6b01584.
- R. H. Althomali, K. A. Alamry, M. A. Hussein, A. Khan, S. S. Al-Juaid and A. M. Asiri, Modification of alginic acid for the removal of dyes from aqueous solutions by solid-phase extraction, Int. J. Environ. Anal. Chem., 2022, 102, 3673–3693, DOI:10.1080/03067319.2020.1772772.
- B. Kumar, et al., Nanoporous sodium carboxymethyl cellulose-g-poly (Sodium acrylate)/fecl3 hydrogel beads: Synthesis and characterization, Gels, 2020, 6(1–11), 49, DOI:10.3390/gels6040049.
- A. N. Al-hakimi, G. M. Asnag, F. Alminderej, I. A. Alhagri, S. M. Al-Hazmy and E. M. Abdallah, Enhanced structural, optical, electrical properties and antibacterial activity of selenium nanoparticles loaded PVA/CMC blend for electrochemical batteries and food packaging applications, Polym. Test., 2022, 116(1–9), 107794, DOI:10.1016/j.polymertesting.2022.107794.
- T. Sangnim, S. K. Zandu, S. Kaur, O. A. Odeku, K. Huanbutta and I. Singh, Development and Evaluation of MCC-SiO2/CMC-SiO2 Conjugates as Tablet Super-Disintegrants, Polymers, 2022, 14(1–18), 1035, DOI:10.3390/polym14051035.
- “2002/657/EC: Commission Decision of 12 August 2002 implementing Council Directive 96/23/EC concerning the performance of analytical methods and the interpretation of results (Text with EEA relevance) (notified under document number C(2002) 3044)”, 2002, vol. 221, pp. 8–36, http://data.europa.eu/eli/dec/2002/657/oj Search PubMed.
- WHO and FAO, “Codex Alimentarius Commission Procedural Manual”, 2023, vol. 28, p. 220, DOI:10.4060/cc5042en.
- W. Zhu, et al., Rapid determination of 88 veterinary drug residues in milk using automated TurborFlow online clean-up mode coupled to liquid chromatography-tandem mass spectrometry, Talanta, 2016, 148, 401–411, DOI:10.1016/j.talanta.2015.10.037.
- L. Zhao and J. Stevens, Determination of Sulfonamide Antibiotics in Bovine Liver Using Agilent SampliQ QuEChERS EN Kits by LC-MS-MS. Agilent application note. Available: http://www.chem.agilent.com/Library/applications/5990-5086EN.pdf., LCGC North Am., 2012, vol. 39, pp. 1–8.
| This journal is © The Royal Society of Chemistry 2023 |

