DOI:
10.1039/D3RA06648G
(Paper)
RSC Adv., 2023,
13, 36130-36143
A combined first principles and experimental approach to Bi2WO6†
Received
29th September 2023
, Accepted 1st December 2023
First published on 12th December 2023
Abstract
Here we synthesized Bi2WO6 (BWO) using both solid-state reaction (SBWO) and hydrothermal (HBWO-U and HBWO-S) methods. The orthorhombic Pca21 phase purity in all samples is confirmed from Rietveld refinement of X-ray diffraction data, Raman spectroscopy, and Fourier transform infrared spectroscopy. The HBWO-U and HBWO-S morphology revealed rectangular, spherical, and rod-like features with an average particle size of 55 nm in field emission scanning electron micrographs. A high-resolution transmission electron micrograph showed spherical-shaped particles in the HBWO-U sample with an average diameter of ∼10 nm. The diffuse reflectance-derived indirect electronic band gaps lie within the 2.79–3.23 eV range. The BWO electronic structure is successfully modeled by Hubbard interaction Ud and Up corrected Perdew–Burke–Ernzerhof generalized gradient approximation GGA-PBE+Ud+Up with van der Waals (vdW) force in effect. The optimized (Ud, Up) values are further justified by tuning the Hartree–Fock (HF) exact-exchange mixing parameter αHF from 25% in Heyd–Scuseria–Ernzerhof (HSE06) to 20% in the PBE-HF20% functional. Moreover, no inconsistencies were seen in the GGA-PBE+Ud+Up+vdW simulated crystallographic parameters, and the elastic tensor, phonon, and linear optical properties. Overall, the computationally cheap GGA-PBE+Ud+Up with vdW force may have successfully probed the physical properties of BWO.
1 Introduction
Semiconductor oxides based on benign and stable bismuth (Bi) have reigned supreme in visible-light-induced photocatalytic applications to mitigate disconcerting environmental issues.1–4 The Bi brings about many interesting properties owing to its stereochemical and lone-pair activity, sp coupling, and spin–orbit interaction.5–8 Tungsten (W), with partially filled 5d states in its oxides, also holds promise for photocatalytic actions.9–11 Their combined oxide bismuth tungstate Bi2WO6 (BWO) turned out to be an n-type semiconducting material belonging to the Aurivillius phase where pseudo-perovskite [WO4]2− octahedral layers are stacked between [Bi2O2]2+ layers and possesses a band gap of ∼2.8 eV.12,13 The BWO has manifested many fascinating photocatalytic, dielectric, ferroelectric, and piezoelectric properties that are pertinent to the photodegradation of pollutants, water splitting, and photovoltaic applications.14
Several experimental methods like solid-state reactions, and sol–gel, hydrothermal, solvothermal, and microwave-assisted techniques have been used to synthesize BWO.14,15 The first principles simulations using density functional theory (DFT) can serve as an indispensable tool for understanding the functional properties of BWO.16,17 The accuracy of DFT simulations suffers critically due to the improper modeling of partially filled W-5d orbitals in BWO for generalized gradient approximation (GGA) of Perdew–Burke–Ernzerhof (PBE).18,19 The Hubbard interaction corrected GGA-PBE+Ud version, where the Ud is applied to the W-5d, was used to study polaron formation effects, seems to underestimate the electronic band gap of bulk BWO measured from the density of states (DOS) compared to the experimental observations.20 Moreover, the indirect nature of the BWO band gap is not confirmed by the electronic band structure (BS) simulation based on GGA-PBE+Ud.21,22 The computationally intense and sophisticated Heyd–Scuseria–Ernzerhof (HSE06) functional with 25% Hartree–Fock (HF) exact-exchange mixing overestimates the band gap in electronic BS simulations.23 In recent times, corrections to electronic and optical properties have been simulated using the quasi-particle GW method with spin–orbit interaction turned on.24 The computational burden of these advanced many-body methods can be huge and requires careful parameter optimization to keep the simulation tractable. A computationally cheap DFT functional capable of reliably simulating the physical properties of BWO is often desired. To this aim, we invoke the GGA-PBE+Ud+Up formalism including the van der Waals (vdW) force to model the observations regarding experimentally synthesized BWO.25,26
Here we synthesized BWO following solid-state reaction and hydrothermal techniques. The X-ray diffraction, Raman, and Fourier transform infrared spectroscopy were used to confirm the desired orthorhombic Pca21 phase purity in all synthesized samples. The surface morphology and chemical purity analysis were performed using field emission scanning electron micrographs and energy-dispersive X-ray spectroscopy, respectively. High-resolution Transmission Electron Microscopy and X-ray Photoelectron Spectroscopy were used to probe the crystallinity and chemical states of the samples. The diffuse reflectance measurements were performed to estimate the electronic band gaps of the BWO samples. The photocatalytic degradation performance of all BWO samples in degrading the methylene blue (MB) dye is studied with UV-vis absorption measurements. We tuned the Hubbard (Ud, Up) corrections within the GGA-PBE+Ud+Up formalism including the vdW force to reliably reproduce the electronic properties of the experimentally synthesized BWO samples. The optimized GGA-PBE+Ud+Up+vdW simulated results were benchmarked against computationally intense HSE06 and PBE-HF20% functionals where the Hartree–Fock (HF) exact-exchange parameter αHF is tuned. The elastic tensor, vibrational phonon, and linear optical properties were probed in detail to justify the use of the optimized (Ud, Up) values.
2 Methodology
2.1 Computational details
The projector augmented wave (PAW) based spin-polarized DFT simulations were performed using the Vienna Ab Initio Simulation Package (VASP) code.27,28 The orthorhombic Bi2WO6 unit cell contains a total of 36 atoms comprising of Bi (8), W (4), and O (24) atoms. The PAW considered Bi 5d106s26p3 (15), W 5p65d46s2 (12), and O 2s22p4 (6) electrons as valence and the remaining ones are treated as the core. The plane wave basis expansion is used with a 580 eV energy cutoff. A 9 × 9 × 3 Monkhorst–Pack k-mesh was used to sample the Brillouin Zone (BZ) in structural relaxation (Hellmann–Feynman force convergence 10−4 eV Å−1) and single point self-consistent total energy (convergence accuracy of 10−8 eV per atom) calculations. The Quantum-ESPRESSO (QE) code was used to calculate the Raman tensor using the finite difference method with similar values for the simulation parameters.
The exchange–correlation (xc) functional dictates the DFT simulation accuracy and complexity.29,30 The finite difference technique was used to simulate the Raman tensor using GGA-PBE and GGA-PBE+Ud+Up functionals.28,31–37 The GGA-PBE functional leads to localized d orbital binding energy underestimation that inflates its hybridization with p orbitals.16,17,38–40 This spurious p–d coupling enhancement shifts the valence band maximum (VBM) up in energy, leading to band gap narrowing effects.41 Moreover, the W-5d orbitals in BWO are less spatially localized than many 3d orbitals present in transition metals.42 The interaction and correlation corrections have been applied to W-5d and O-2p orbitals within the GGA-PBE+Ud+Up approach.25,26,43,44 The lattice parameter overestimation in GGA-PBE and GGA-PBE+Ud+Up was reduced by incorporating the van der Waals (vdW) force with DFT-D3 method including Becke–Johnson (BJ) damping.45 The phonon DOS, BS, and Born charge were simulated using the finite difference method in Phonopy based on 2 × 2 × 2 supercell containing 288 atoms.46,47 The 2nd order force constants are calculated for GGA-PBE and GGA-PBE+Ud+Up with vdW taken into account. Moreover, HSE06 hybrid functional with the Hartree–Fock (HF) exact exchange mixing parameter αHF = 25% was used to simulate electronic and optical properties.17,38,48–52 The αHF is tuned to 20% as PBE-HF20% functional to obtain better agreement with GGA-PBE+Ud+Up+vdW simulation and experimentally measured electronic band gap.53–55 The PBE-HFαHF% functional use HSE screened approach similar to HSE06 with xc energy EHSExc given in terms of short-range (SR) and long-range (LR) terms as
| | |
EHSExc = αHFEHF,SRx(μ) + (1 − αHF)EPBE,SRx(μ) + EPBE,LRx(μ) + EPBEc(μ)
| (1) |
where the screening parameter
μ in hybrid functionals was set to 0.2 Å
−1.
56 The WANNIER90 tool is used to keep the computational burden manageable in hybrid functional-based electronic BS simulations.
17,39,57,58 The optical properties are derived from complex dielectric constant simulations for GGA-PBE+vdW, GGA-PBE+
Ud+
Up+vdW, HSE06 and PBE-HF20% functionals.
16,17,38,39
2.2 Sample preparation
2.2.1 Solid-state reaction. Solid-state reaction-based sample was synthesized following our previous works in ref. 16, 17, 38, 59 and 60. The stoichiometric amount of Bi(NO3)3·5H2O (Merck Germany, 99+% pure) and Na2WO4·2H2O (Merck Germany, 99+% pure) were weighed as precursor materials. The Bi(NO3)3·5H2O was hand milled for 30 min using an agate mortar. Next Na2WO4·2H2O was added to it and the mixture was hand milled again for 2 h. Circular pellets made in a hydraulic press (Weber-Pressen) with 25 kN uni-axial force were sintered at 300 °C for 2 h. The pre-sintered pellets were crushed into fine powder form before being subjected to subsequent sintering at higher temperatures. After a number of trial sintering, the optimum temperature for phase pure BWO was found to be 650 °C, and termed as SBWO hereafter.
2.2.2 Hydrothermal synthesis. The 20 mmol (9.9 g) Bi(NO3)3·5H2O (Merck Germany, 99+% pure) and 10 mmol (3.332 g) Na2WO4·2H2O were first dissolved homogeneously by vigorous stirring and sonication in 9 mL of 20% HNO3 solution separately. A mixture was formed after 80 mL of ethylene glycol was poured into this solution. The pH of the mixture was set to 7.5 by adding a required portion of KOH and converted to a suspension by subsequent magnetic stirring for 1 h. The resulting suspension was loaded into a 100 mL Teflon-lined autoclave and then reacted at 180 °C for 20 h inside an oven. Subsequently, the reactor was cooled to room temperature naturally. The resulting product was centrifuged at 10000 rpm for 10 min with first ethanol and then distilled water for 6 consecutive cycles and then heated at 80 °C for 16 h to obtain powder form samples termed as HBWO-U. This unsintered HBWO-U sample was sintered at 400 °C for 2 h and the resulting sample was labeled as HBWO-S subsequently.
2.2.3 Photocatalytic sample preparation. The 100 mL of MB solution was prepared at 10 ppm concentration. For each of the SBWO, HBWO-U, and HBWO-S photocatalysts, 1 g L−1 solutions were prepared at pH = 10 with the proper amount of NH4OH in the dye-photocatalyst mixture. The adsorption–desorption equilibrium was attained to form suspension by constant magnetic stirring for 30 min in the dark. The liquid suspensions were under constant magnetic stirring during the optical exposure from the Hg–Xe lamp. The stirring avoids inhomogeneity of the MB concentration across the solution and prevents spurious degradation effects. High-speed centrifuging (12![[thin space (1/6-em)]](https://www.rsc.org/images/entities/char_2009.gif) 000 rpm, 5 cycles) facilitated the photocatalyst removal from the dye solution. The UV-vis absorption measurements are taken in finite intervals for SBWO (30 min), HBWO-U (10 min), and HBWO-S (10 min) to evaluate the photocatalytic degradation performances.
000 rpm, 5 cycles) facilitated the photocatalyst removal from the dye solution. The UV-vis absorption measurements are taken in finite intervals for SBWO (30 min), HBWO-U (10 min), and HBWO-S (10 min) to evaluate the photocatalytic degradation performances.
2.3 Characterization techniques
Programmable high-temperature Muffle Furnaces (Nabertherm LT 5/14 & Kejia M1700) were used for sample sintering. The powdered X-ray Diffraction (XRD) data within 10° to 80° diffraction angle were recorded at 35 kV tube voltage and 20 mA tube current with Cu Kα radiation (λ = 0.15418 nm) in a Rigaku SmartLab SE multipurpose XRD system. The Raman bands for the samples are obtained from 532 nm laser excitation in a Horiba Scientific Confocal Raman Microscope LabRAM HR Evolution. The PerkinElmer Spectrum Fourier Transform Infrared (FTIR) spectrometer was used to obtain the relevant IR absorption bands of the samples. The morphology and chemical purity of the SBWO sample were studied using a Scanning Electron Microscope (SEM, AVO Research) and Energy Dispersive X-ray Spectroscopy (EDX, EDAX Team) respectively. For hydrothermally synthesized samples, morphology studies were performed using Field Emission Scanning Electron Microscopy (FESEM, JEOL 7610F), Transmission Electron Microscopy (TEM), High-Resolution Transmission Electron Microscopy (HRTEM), and Selected Area Electron Diffraction (SAED) measurements using Thermo Fischer Scientific Talos F200X. The Kα X-ray Photoelectron Spectroscopy (XPS) was done using Thermo Fischer Scientific X-ray Photoelectron Spectrometer where the 284.8 eV binding energy C-1s level was used for calibration. The optical characterizations were performed by UV-vis diffuse reflectance measurements in a Shimadzu UV-2600i UV-Vis-NIR spectrometer. The samples' photocatalytic performance was estimated from UV-vis absorption spectra measured with a Shimadzu UV-1900i spectrometer.
3 Results and discussion
3.1 X-Ray diffraction analysis
The powder XRD data of solid-state reaction synthesis-based samples with different sintering temperatures of 400, 500, 600, 650, and 800 °C are presented in Fig. 1(a). The phase pure Bi2WO6 was evident in the SBWO sample sintered at 650 °C. In samples with other sintering temperatures, the Bi2O3 impurity peaks were present. The Rietveld refinement in Fig. 1(b) revealed a pure orthorhombic phase in SBWO with the goodness of fitting χ2 = 1.75. The orthorhombic phase was also confirmed both in HBWO-U (χ2 = 1.45) and HBWO-S (χ2 = 1.27) samples as presented in Fig. 1(c) and (d), respectively. The orthorhombic phase belongs to the Pca21 space group and point group mm2 (JCPDS No. 39-0256). No unwanted impurity peaks were detected. The sharp intense peaks corroborate good crystallinity in all samples. The diffraction peak intensity of HBWO-U is decreased and increased compared to SBWO and HBWO-S samples, respectively. This is suggestive of crystallite growth with temperature. The broadening in the (131) peak for hydrothermally synthesized HBWO-U and HBWO-S as compared to that of the SBWO sample indicates the existence of small-size particles in them. The line width analysis with the Scherrer formula revealed average crystallite sizes to be 22 nm (SBWO), 8 nm (HBWO-U), and 12 nm (HBWO-S). The most intense diffraction peak in all samples is (1 3 1) which is in line with (1 2m + 1 1) peak of Aurivillius phases.61
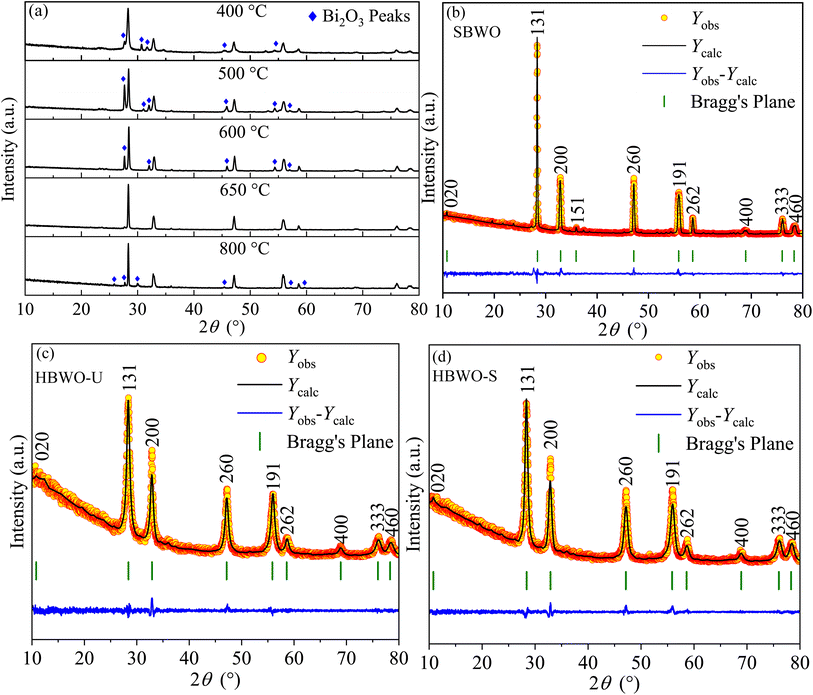 |
| | Fig. 1 (a) Powder XRD patterns of BWO samples with different sintering temperatures prepared in solid-state reaction. Rietveld refined XRD patterns on top of (b) experimentally observed data of SBWO, hydrothermally synthesized (c) unsintered HBWO-U, and (d) sintered HBWO-S samples. The yellow circles are the experimental data points (Yobs), the black solid line represents the calculated refined pattern Ycal, the bottom blue curve Ydiff shows the difference between the Yobs and Ycal values. | |
Table S1† reveals that both GGA-PBE and GGA-PBE+Ud+Up functionals overestimated the unit cell volume by ∼7.7% and ∼5.93% compared to the experimental observations. The inclusion of vdW force provides correction to the lattice parameters and reduces the unit cell volume estimation error to 3.79% and 2.18% for GGA-PBE+vdW and GGA-PBE+Ud+Up+vdW, respectively, see Table S2.† Hence the inclusion of vdW force has the potential to improve the reliability of the DFT simulations.
3.2 Raman analysis
The measured Raman spectra of the samples are presented in Fig. 2. The group theory dictates A1g, B1g and Eg symmetry modes to be Raman active near the BZ center of orthorhombic Bi2WO6.62–64 All experimentally observed Raman bands are interpreted in accordance with the corresponding atomic motion along with the DFT simulated peaks in Table S3†.65 The phase-independent external lattice modes are located near 130 (Eg) and 150 cm−1 (A1g). The antisymmetric deformation (B1g) of WO6 octahedra stems Raman bands near ∼220 nm in HBWO-U and HBWO-S samples. The Raman peaks near ∼250 cm−1 can be explicated as symmetric bending vibration (A1g) of Bi–O bonds. The bands around ∼280 and ∼410 cm−1 arose from antisymmetric bending vibrations (Eg) of WO6 octahedra. The coupled Bi3+ and WO6−6 unit undergoes simultaneous translation (Eg) which produce Raman bands near 300 cm−1. The asymmetric bridge mode (B1g) of the WO6 chain bridge originates the Raman bands at ∼710 and ∼800 cm−1. The peaks near 724 and ∼814 cm−1 can be interpreted as asymmetric stretching modes (B1g) of O–W–O bonds in the WO6 octahedral cluster. Both GGA-PBE and GGA-PBE+Up+Ud derived Raman peaks are in good agreement with the experimental observations.
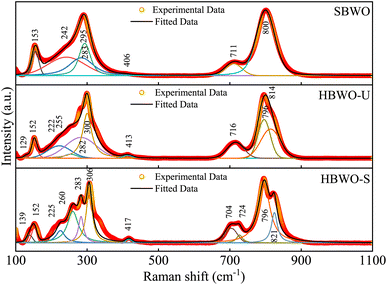 |
| | Fig. 2 Deconvoluted room temperature Raman spectra of SBWO, HBWO-U, and HBWO-S. | |
3.3 Fourier transform infrared spectroscopy
The FTIR spectra of SBWO, HBWO-U, and HBWO-S samples are displayed in Fig. 3. The observed FTIR absorption bands are assigned to their respective atomic bond vibrations in Table S4.†66,67 The symmetric Bi–O stretching stems the IR absorption near ∼427 and ∼820 cm−1. The absorption originating from antisymmetric Bi–O–Bi stretching can be seen in 533 and 565 cm−1. The IR bands (∼680, ∼700) and (∼1056, ∼1029) cm−1 can be assigned to W–O symmetric stretching. The 958 cm−1 (SBWO) and ∼3471 (HBWO-U, and HBWO-S) cm−1 IR absorption can be ascribed to the bending vibration of O–H bonds in water molecules present in the sample. For hydrothermally synthesized samples, the O-H stretching vibration is located near ∼1634 cm−1. The symmetric stretching of C![[double bond, length as m-dash]](https://www.rsc.org/images/entities/char_e001.gif) O bonds appear near 1314 cm−1 (HBWO-U) and 1392 cm−1 (HBWO-S). The adsorption of atmospheric CO2 may have originated these IR bands.
O bonds appear near 1314 cm−1 (HBWO-U) and 1392 cm−1 (HBWO-S). The adsorption of atmospheric CO2 may have originated these IR bands.
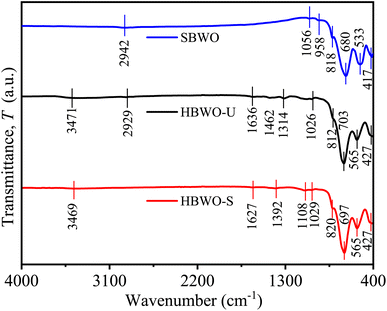 |
| | Fig. 3 FTIR spectra of SBWO, HBWO-U, and HBWO-S. | |
3.4 Morphology analysis
Fig. 4 presents the SEM and FESEM micrographs. The SBWO grains in Fig. 4(a) were irregularly shaped with an average size of ∼175 nm. The higher sintering temperature of the solid-state reaction may have provided enough energy for this irregular thermal grain nucleation and growth. For the HBWO-U sample, a mixture of rectangular and spherically shaped particles with 55 nm size are visible in the FESEM micrograph presented in Fig. 4(b). The subsequent sintering promoted rectangular rod-like features in particles as presented in Fig. 4(c). The EDX spectra of Bi, W, and O in Fig. S1† are also in good agreement with that of Bi2WO6.68–70 The experimental atomic percentage (at%) and weight percentage (wt%) of Bi, W, and O in Table S5† conform to that of theoretical values conforming to the atomic ratio of Bi2WO6. Fig. 5 presents the HRTEM, and SAED measurements of HBWO-U and HBWO-S samples. Fig. 5(a) shows randomly distributed spherical-shaped particles with a diameter of ∼10 nm in HBWO-U sample. In the case of HBWO-S, uniform sheets are revealed in Fig. 5(b). HRTEM images in Fig. 5(c) and (d) show distinct lattice fringes separated by 0.31 (R1 & R3) and 0.27 (R2 & R4) nm that correspond to d-spacing of (131) and (020) crystallographic planes of Bi2WO6.70–72 The non-uniform intensity of concentric circular-shaped diffraction rings visible in SAED images in Fig. 5(e) and (f) are characteristic of the textured polycrystalline nature of the samples.
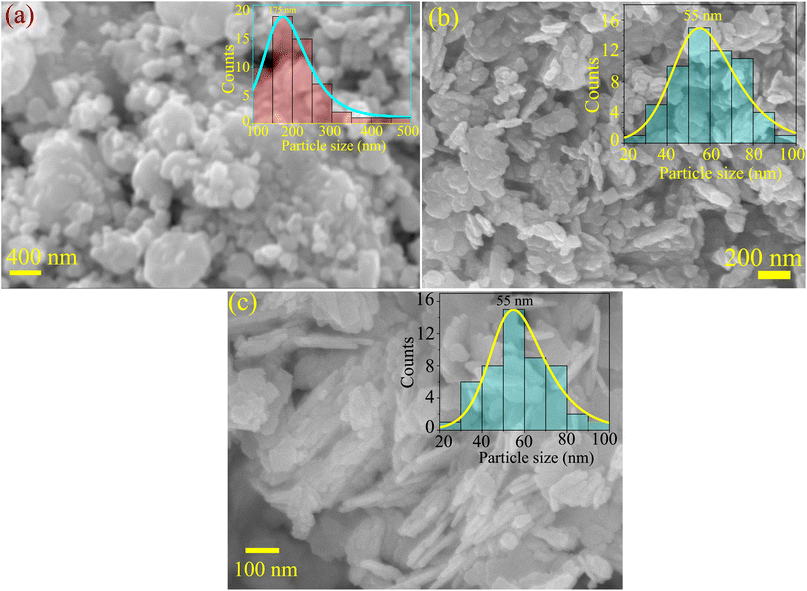 |
| | Fig. 4 (a) SEM micrograph of SBWO. FESEM micrographs of (b) HBWO-U, and (c) HBWO-S. | |
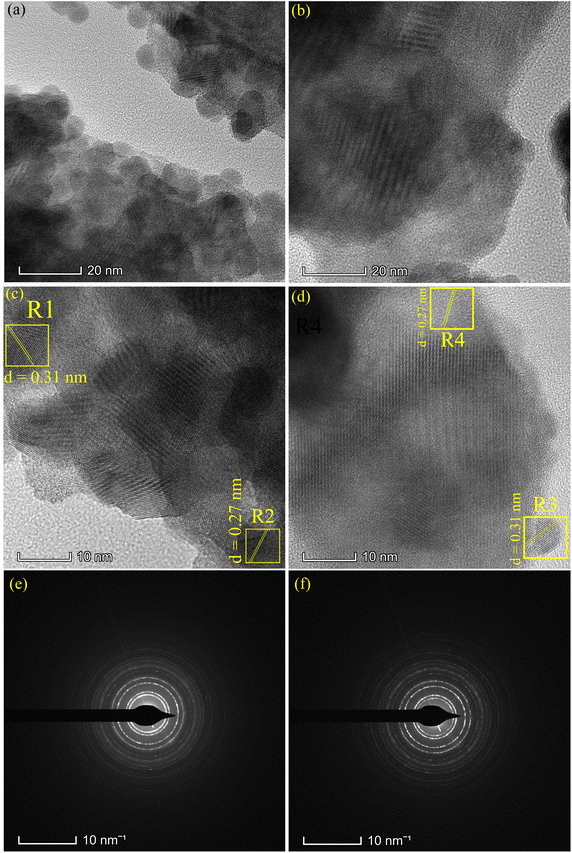 |
| | Fig. 5 TEM images of (a) HBWO-U, (b) HBWO-S. HRTEM images of (c) HBWO-U, and (d) HBWO-S. SAED images of (e) HBWO-U, and (f) HBWO-S. | |
3.5 X-ray Photoelectron Spectroscopy
The full XPS spectrum in Fig. 6(a) revealed Bi, W, and O elements in HBWO-U and HBWO-S samples.73 The XPS peaks at 159.2 and 164.5 eV in Fig. 6(b) are characteristic to Bi-4f7/2 and Bi-4f5/2 spin–orbit splitting of Bi3+ in BWO.67 The W-4f7/2 and W-4f5/2 XPS peaks at 35.6 and 37.7 eV of HBWO-U are slightly shifted to higher binding energies of 35.7 and 37.8 eV for HBWO-S as shown in Fig. 6(c), and are ascribed to W6+ in BWO lattice.74,75 The O-1s peak at 530.4 eV (530.5 eV) of HBWO-U (HBWO-S) in Fig. 6(d) can be designated to lattice oxygen of W–O and Bi–O bonding. The weak XPS peak at 531.8 eV (531.9 eV) of HBWO-U (HBWO-S) can be attributed to C![[double bond, length as m-dash]](https://www.rsc.org/images/entities/char_e001.gif) O bonds adsorbed on the surface of samples.72
O bonds adsorbed on the surface of samples.72
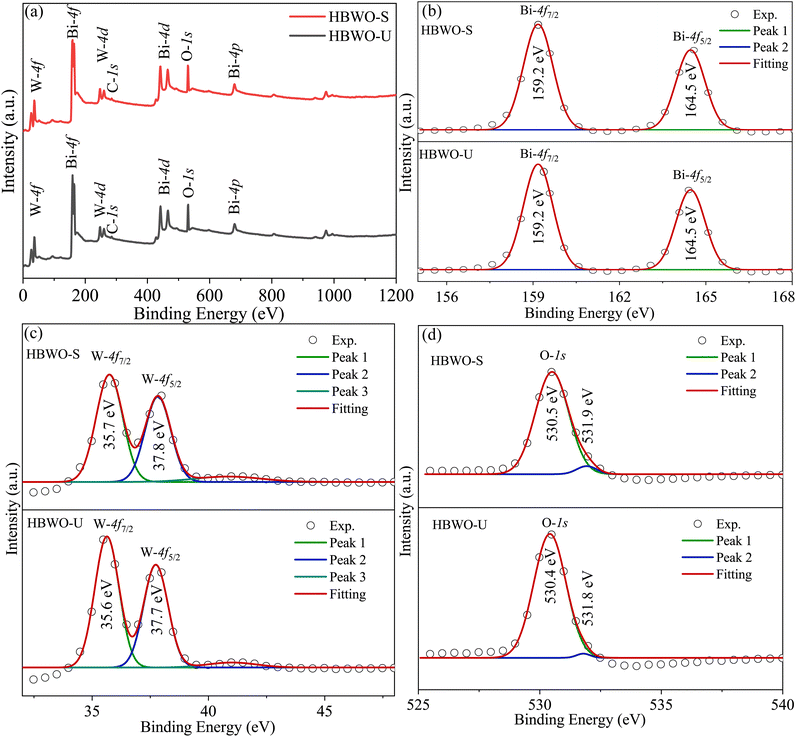 |
| | Fig. 6 (a) XPS full survey, and core level XPS spectra of (b) Bi-4f, (c) W-4f, and (d) O-1s for HBWO-U and HBWO-S. | |
3.6 UV-vis spectroscopy
The Kubelka–Munk function F(R∞) was used to convert the UV-vis diffuse reflectance into absorption as presented in Fig. 7(a). The samples' steep absorption edges lie within the 350-450 nm wavelength bands. The band gap Eg was estimated from| | |
[F(R∞)hν]1/γ = A(hν − Eg),
| (2) |
where A, h, and ν represent proportionality constant, Planck's constant, and incident photon frequency, respectively. The parameter γ sets the direct and indirect nature of the band gap. By extrapolating the Tauc's plots onto the energy axes for γ = 2 in Fig. 7(b), the indirect Eg turned out to be 2.84, 3.13, and 2.79 eV for SBWO, HBWO-U, and HBWO-S, respectively. The measured band gaps are consistent with that of the ref. 75–79.
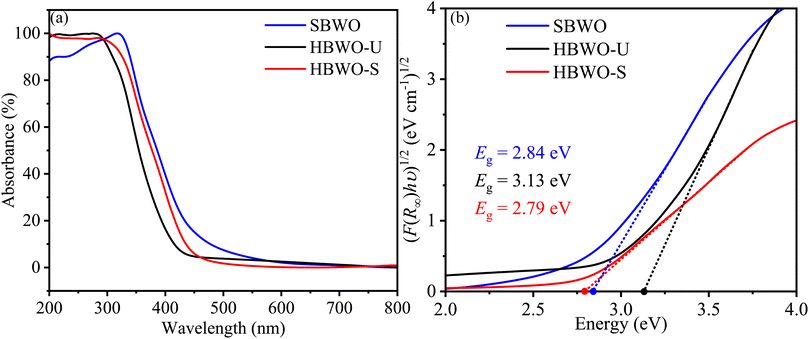 |
| | Fig. 7 (a) UV-vis diffuse absorption spectra, and (b) Tauc plots of SBWO, HBWO-U and HBWO-S samples. | |
3.7 Photocatalytic measurements
The MB photocatalytic degradation of SBWO, HBWO-U, and HBWO-S are estimated from UV-vis absorption measurements as displayed in Fig. 8. The photocatalyst and MB dye concentrations are set to 1 g L−1 and 10 ppm, respectively at pH = 10 in all cases. The reduction of MB characteristic intensity peak at 663 nm over exposure time indicates complete annihilation of it in cases of SBWO (180 min) and HBWO-U (60 min). To illustrate the significant degradation of HBWO-U in the dark, absorption spectra were recorded for one sample placed in the darkness and another under illumination, see Fig. 9(a) and (b). The absorption spectra are identical for the initial 30 min dark condition as expected. Because of the MB adsorption onto the photocatalyst, MB degradation in Fig. 9(a) continues as time progresses in the dark condition. The MB degradation Fig. 9(b) is much faster due to the optical exposure case. The absorption curve nearly flattens and loses its distinctive shape just after 30 min of illumination. The overall photocatalytic efficiencies are estimated by plotting C/C0 vs. irradiation time in Fig. 10(a), where C0 and C stand for the MB concentration at initial and some specific time, respectively. The HBWO-S degraded 60% of MB in 60 min of irradiation as presented in Fig. 10(a) (inset). The pseudo-first-order degradation kinetics is captured in Fig. 10(b) with Langmuir–Hinshelwood model using ln(C0/C) = kt. By linear fitting the data, the reaction rate k is estimated to be 0.0172 (SBWO), 0.0546 (HBWO-U), and 0.0131 min−1 (HBWO-S). The observed binding energy increment for W and O species as shown in Section 3.5 may have degraded the photocatalytic activity of HBWO-S compared to the HBWO-U sample.
 |
| | Fig. 8 The photocatalytic degradation measurements from UV-vis absorption spectra of (a) SBWO, (b) HBWO-U, and (c) HBWO-S photocatalysts (1 g L−1) with 10 ppm MB dye. | |
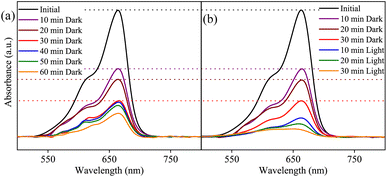 |
| | Fig. 9 The photocatalytic degradation measurements from UV-vis absorption spectra of SBWO-U (a) in dark, and (b) under optical exposure. | |
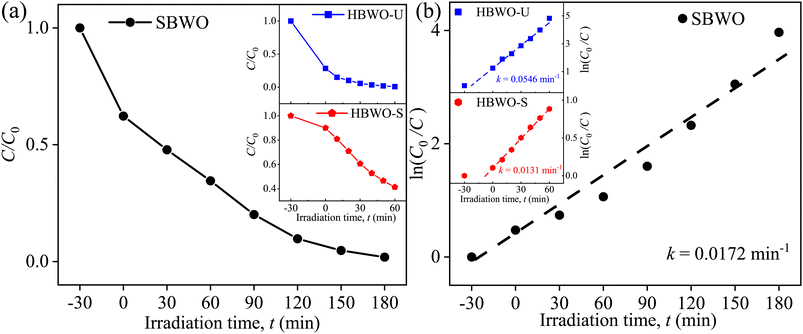 |
| | Fig. 10 (a) Time-dependent photocatalytic degradation fraction C/C0, (b) linear fitted time-dependent photocatalytic degradation fraction of 10 ppm MB for 1 g L−1 SBWO, HBWO-U, and HBWO-S photocatalysts at pH = 10. | |
3.8 Electronic properties simulation
The band gap Eg is measured from the total density of states (TDOS) and its projections onto different relevant orbitals (PDOS), see Fig. S2–S7.† It is evident in Fig. 11(a) that beyond Ud = Up = 9 eV, the vdW force have negligible effect on Eg. Fig. 11(b) reveals Eg of ∼2.61 eV, closer to experimental Eg of SBWO (2.84 eV) and HBWO-S (2.79 eV), for Ud = Up = 14 eV with vdW force in effect. Moreover, the HSE06 (αHF = 25%) provides an overestimation of Eg (2.98 eV) in Fig. 11(c). By tuning the αHF to 20% in HSE screened approach, the PBE-HF20% functional yields Eg = 2.79 eV. For all functionals, the DOS share following common features: (i) the valence band (VB) stems from Bi-6s, Bi-6p, W-5p, W-5d, and O-2p orbitals, (ii) the top of the VB is comprised of hybridization among dominant O-2p and small Bi-6s and Bi-6p orbitals, (iii) the conduction band (CB) is formed with Bi6p, W-5d, O-2p and small portion of O-2s orbitals, and (iv) the bottom of the CB is mainly comprised of W-5d and O-2p orbital mixing.
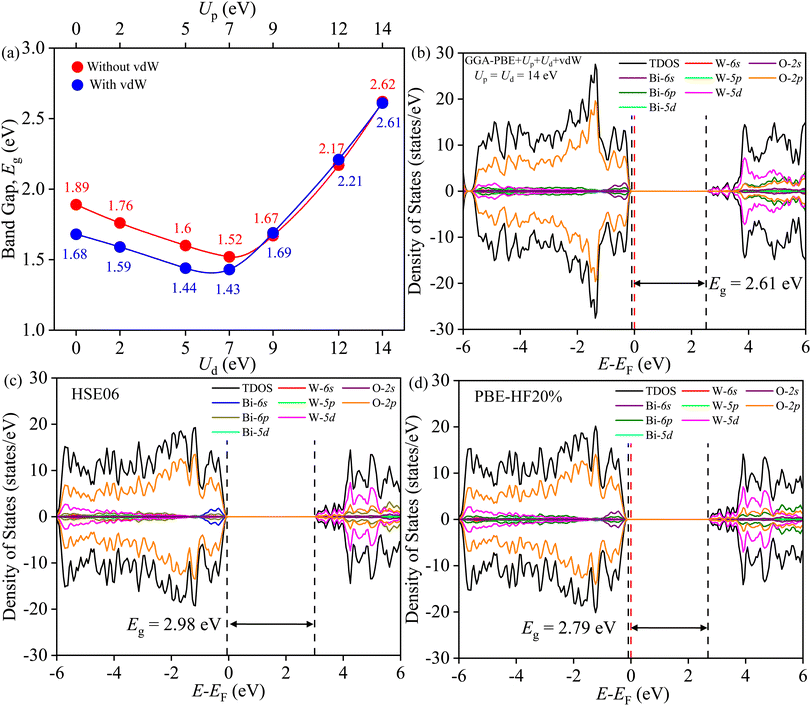 |
| | Fig. 11 (a) Band gap Eg tuning with Ud and Up with and without vdW force, (b) TDOS and PDOS of BWO for GGA-PBE+Ud+Up+vdW, (c) HSE06, and (d) PBE-HF20%. | |
The direct/indirect nature of the band gap can only be found from electronic BS simulation. The GGA-PBE in Fig. 12(a) provides an erroneous direct band gap for BWO even with the presence of vdW force. The valence band maxima (VBM) and conduction band minima (CBm) are located at the Γ point in BZ. But the optimum GA-PBE+Ud+Up with the vdW force gives rise to the correct indirect transition as shown in Fig. 12(b). The VBM is located in Γ → X and the CBm occurred at Γ. The BS derived from HSE06 corroborated similar BS dispersion in Fig. 12(c) but overestimated the Eg (3.26 eV). With αHF = 20%, the PBE-HF20% reduces the overestimation to 3.05 eV in Fig. 12(d). All these results corroborate the reliability of the GGA PBE+Ud+Up+vdW simulations.
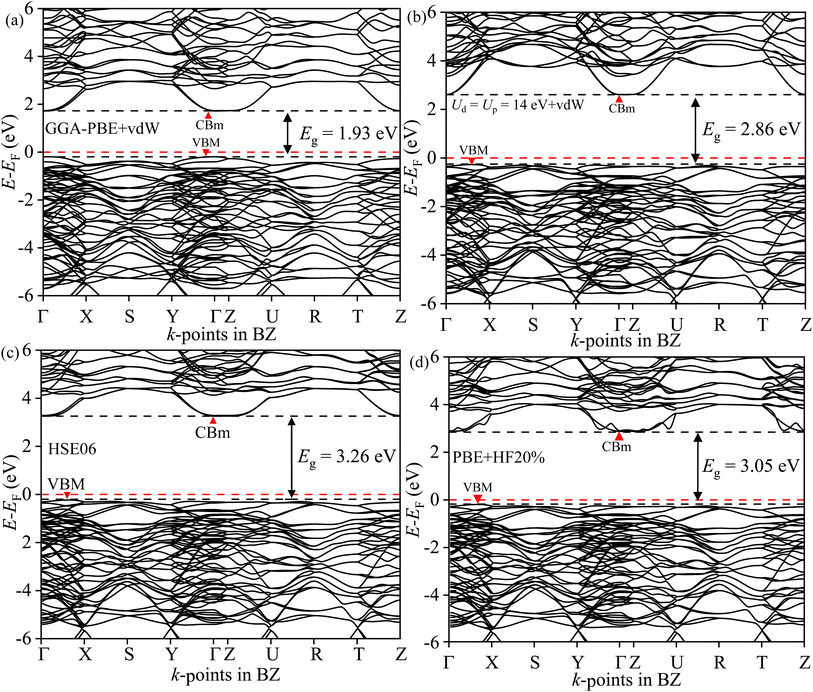 |
| | Fig. 12 Electronic BS of BWO along Γ, R, S, T, U, X, Y, and Z high symmetry k-points in BZ for (a) GGA-PBE+vdW, (b) GGA-PBE+Ud+Up+vdW, (c) HSE06 and (d) PBE-HF20%. | |
3.9 Optical properties simulation
The optical properties are defined by angular frequency ω dependent complex dielectric constant ε(ω) = εreal(ω) + iεimag(ω). The εimag is derived from the dipole transition matrix and the Kramer–Kronig relation is used to obtain εreal from it for different functionals. Fig. 13(a) provides evidence for close agreement of GGA-PBE+Ud+Up+vdW with PBE-HF20% for εreal. The perfect match in the ω → 0 limit corroborates the refractive indices agreement of both functionals. In Fig. 13(b), the steep rising edges of εimag along with the position of the peak in energy for both functionals are also in accord. The energy threshold beyond which optical absorption α shoots up depends on the band gap and varies for different functionals as shown in Fig. 13(c). The good agreement between the onset of absorption for GGA-PBE+Ud+Up+vdW with PBE-HF20% is a direct consequence of their agreement in band gap estimation.
 |
| | Fig. 13 (a) Real part of dielectric constant εreal, (b) imaginary part of the dielectric constant εimag, and (c) absorption coefficient α as a function photon energy E calculated with GGA-PBE+vdW, GGA-PBE+Up+Ud+vdW, HSE06 (αHF = 25%), and PBE-HF20% (αHF = 20%) averaged over three different polarization Ex, Ey and Ez. | |
3.10 Elastic properties simulation
The structural stability of orthorhombic BWO was verified from elastic tensor Cijs simulations for GGA-PBE, GGA-PBE+vdW, GGA-PBE+Ud+Up, and GGA-PBE+Ud+Up+vdW.80,81 The simulated elastic properties are presented in Table S6.† The orthorhombic Pca21 symmetry defines nine independent Cijs: C11, C12, C13, C22, C23, C33, C44, C55, and C66 that satisfy the required Born stability criterion| | |
C11 > 0, C44 > 0, C55 > 0, C66 > 0, C11C22 > C122, C11C22C33 + 2C12C13C23 − C11C232 − C22C132 − C33C122 > 0,
| (3) |
regardless of the vdW force as can be seen from Table S5†.82–84 The salient elastic properties like bulk-modulus (BV, BR and BH), shear modulus (GV, GR and GH), Young's modulus (EV, ER and EH), Poisson's ratio (νV, νR and νH) and Pugh's ratio (kV, kR and kH) were simulated for Voigt (V), Reuss (R) and Hill (H) framework.85–87 The Hubbard (Ud, Up) corrections and the vdW force inflate the bulk, shear, and Young's moduli compared to that of GGA-PBE which imply plastic deformation and stiffness enhancement. The brittle nature of BWO is prevalent in all cases as Poisson's ratio stayed below the threshold value of 0.33. The Pugh's ratio is well below the brittle/ductile value of 1.75 which further confirms the brittle nature of BWO.
3.11 Phonon properties simulations
The dynamical stability can be probed from phonon modes of the material.16,17,39,40 The simulated phonon BS and DOS using finite difference supercell method are shown in Fig. 14. The absence of imaginary frequency modes in the entire BZ corroborates the dynamical stability of HBWO for both GGA-PBE and GGA-PBE+Ud+Up with vdW force in action. The supercell allows displacement distortion that helps to establish the dynamical stability of the BWO structure.46,88,89 The Bi, W, and O have decreasing inertial resistance to atomic vibration due to a reduction in the atomic masses. The vibrational spectra of Bi (heavy), and O (light) dominate over 15–200 and 250–500 cm−1 ranges, respectively as shown in the phonon DOS of Fig. 14(a) and (b). The phonon DOS peaks are in good agreement with experimental FTIR peaks in Table S4.† The average of the diagonal Born effective charge (BEC) tensor elements in Table S7† yields +4.675, +7.66, and −2.97 for Bi, W, and O1 atoms. For Ud = Up = 14 eV with vdW force, the born charge anomalies are increased due to electronic charge delocalization in favor of covalent bonding.
 |
| | Fig. 14 Phonon BS, total DOS, and partial DOS of B, W, and O atoms in BWO using the finite-difference supercell approach for (a) GGA-PBE+vdW, and (b) GGA-PBE+Ud+Up+vdW. The phonon BS is simulated along Γ, R, S, T, U, X, Y, and Z high symmetry k-points in BZ. | |
4 Conclusion
The orthorhombic Pca21 phase purity in the SBWO, HBWO-U, and HBWO-S samples was confirmed from XRD, Raman, and FTIR measurements. The morphology analysis revealed particle shapes to vary over rectangular, spherical, and rod-like features as per the FESEM measurements. The HRTEM images revealed randomly distributed particles with size ∼10 nm in HBWO-U sample. The polycrystalline nature of samples is confirmed by ring-shaped SAED patterns. The UV-vis diffuse reflectance revealed indirect electronic band gap variation within the 2.79–3.23 eV energy window. The diluted Coulomb interaction of localized W-5d orbital is successfully modeled with computationally cheap GGA-PBE+Ud+Up functional with the vdW force that reproduced experimentally observed crystallographic parameters, and electronic band gaps of as-synthesized samples. The use of optimized values of Ud and Up is justified by reproducing the BWO electronic properties by tuning the Hartree–Fock exact-exchange mixing parameter αHF from 25% in the HSE06 to 20% in PBE-HF20% functional. Moreover, the tuned GGA-PBE+Ud+Up+vdW successfully probed the elastic tensor, phonon, and optical properties of BWO. Overall, the computationally cheap PBE+Ud+Up with vdW force may have successfully modeled the relevant physical properties of BWO.
Data availability
The data that support the findings of this study are available from the corresponding author upon reasonable request.
Author contributions
I. A. planned and supervised the entire project, and wrote the original article. Q. S. H. synthesized the samples by hydrothermal methods and performed all photocatalytic measurements. M. S. synthesized samples with solid-state reaction technique. Q. S. H., S.·S.·N., S. A., and I. A. performed the DFT simulations. M. N. I. K. and H. N. helped with XRD, FTIR, TEM, HRTEM, and SAED measurements. M. S. B. provided the SEM and EDX measurements. U. S. A. performed the XPS measurements. S. J. helped with the Raman measurements. F. C. performed the FESEM measurements. K. S. H. helped with optical measurements. Q. S. H., S. M. S. I., T. A. M., and I. A. performed the data analysis.
Conflicts of interest
The authors declare no competing interests.
Acknowledgements
I. A. gratefully acknowledges financial support from the University of Dhaka for conducting this research project. I. A. thankfully extends his courtesy to the Bangladesh Research and Education Network (BdREN) for providing excellent high-performance computational resources. I. A. also acknowledges resource-sharing support from Md. Shafiul Alam and Md. Mosaddek Khan, University of Dhaka. I. A. would like to extend his courtesy to Shirin Akter Jahan and Md. Saiful Quddus, Institute of Glass and Ceramic Research and Testing (IGCRT), Bangladesh Council of Scientific and Industrial Research (BCSIR) for facilitating XPS measurements. K. S. H. acknowledges the support from the International Science Program (ISP), Uppsala University, Sweden. T. A. M. acknowledges a Research Fellowship from the Semiconductor Technology Research Centre, University of Dhaka.
References
- P. Chen, H. Liu, W. Cui, S. C. Lee, L. Wang and F. Dong, EcoMat, 2020, 2, e12047 CrossRef CAS.
- W. Fang and W. Shangguan, Int. J. Hydrogen Energy, 2019, 44, 895 CrossRef CAS.
- R. He, D. Xu, B. Cheng, J. Yu and W. Ho, Nanoscale Horiz., 2018, 3, 464 RSC.
- S. Wang, L. Wang and W. Huang, J. Mater. Chem. A, 2020, 8, 24307 RSC.
- R. Yu, A. Fan, M. Yuan, T. Li and J. Wang, Phys. Chem. Chem. Phys., 2016, 18, 23702 RSC.
- Q. Sun, J. Wang, W.-J. Yin and Y. Yan, Adv. Mater., 2018, 30, 1705901 CrossRef.
- D. Tiwari, D. Alibhai, D. Cherns and D. J. Fermin, Chem. Mater., 2020, 32, 1235 CrossRef CAS.
- K. Yoshii, T. Fukuda, H. Akahama, J. Kano, T. Kambe and N. Ikeda, Phys. C, 2011, 471, 766 CrossRef CAS.
- I. M. Szilágyi, B. Fórizs, O. Rosseler, Á. Szegedi, P. Németh, P. Király, G. Tárkányi, B. Vajna, K. Varga-Josepovits and K. László, et al., J. Catal., 2012, 294, 119 CrossRef.
- F. Wang, C. Di Valentin and G. Pacchioni, J. Phys. Chem. C, 2012, 116, 8901 CrossRef CAS.
- V. Dutta, S. Sharma, P. Raizada, V. K. Thakur, A. A. P. Khan, V. Saini, A. M. Asiri and P. Singh, J. Environ. Chem. Eng., 2021, 9, 105018 CrossRef CAS.
- X. Liu, S. Gu, Y. Zhao, G. Zhou and W. Li, J. Mater. Sci. Technol., 2020, 56, 45 CrossRef CAS.
- J. Tian, Y. Sang, G. Yu, H. Jiang, X. Mu and H. Liu, Adv. Mater., 2013, 25, 5075 CrossRef CAS.
- A. Elaouni, M. El Ouardi, A. BaQais, M. Arab, M. Saadi and H. A. Ahsaine, RSC Adv., 2023, 13, 17476 RSC.
- H. Yi, L. Qin, D. Huang, G. Zeng, C. Lai, X. Liu, B. Li, H. Wang, C. Zhou, F. Huang, S. Liu and X. Guo, Chem. Eng. J., 2019, 358, 480 CrossRef CAS.
- Q. S. Hossain, S. Ahmed, S. S. Nishat, M. Z. Hossain, M. Khan, T. Hasan, M. S. Bashar, M. Hakim, I. M. Syed, K. S. Hossain and I. Ahmed, RSC Adv., 2023, 13, 14291 RSC.
- M. Z. Hossain, S. S. Nishat, S. Ahmed, Q. S. Hossain, M. Khan, T. Hasan, M. S. Bashar, A. S. H. Faysal, I. M. Syed, K. S. Hossain, S. Hussain, M. M. Khan and I. Ahmed, RSC Adv., 2023, 13, 5576 RSC.
- X. Liu and H.-Q. Fan, Optik, 2018, 158, 962 CrossRef CAS.
- T. P. T. Linh, N. D. Phu, P. Van Hai and L. H. Hoang, J. Electron.
Mater., 2021, 50, 4027 CrossRef CAS.
- J. Tao, Q. Zhang and T. Liu, Phys. Chem. Chem. Phys., 2022, 24, 22918 RSC.
- A. Rauf, M. Ma, S. Kim, M. S. A. S. Shah, C.-H. Chung, J. H. Park and P. J. Yoo, Nanoscale, 2018, 10, 3026 RSC.
- X. Meng and Z. Zhang, J. Photochem. Photobiol., A, 2015, 310, 33 CrossRef CAS.
- J. Zhang, P. Deng, M. Deng, H. Shen, Z. Feng and H. Li, ACS Omega, 2020, 5, 29081 CrossRef CAS PubMed.
- H. Ahmad, A. Rauf, A. Ahmad, A. Ulhaq and S. Muhammad, RSC Adv., 2021, 11, 32330 RSC.
- N. N. Lathiotakis, A. N. Andriotis and M. Menon, Phys. Rev. B: Condens. Matter Mater. Phys., 2008, 78, 193311 CrossRef.
- S.-G. Park, B. Magyari-Köpe and Y. Nishi, Phys. Rev. B: Condens. Matter Mater. Phys., 2010, 82, 115109 CrossRef.
- G. Kresse and J. Furthmüller, Phys. Rev. B: Condens. Matter Mater. Phys., 1996, 54, 11169 CrossRef CAS.
- G. Kresse and D. Joubert, Phys. Rev. B: Condens. Matter Mater. Phys., 1999, 59, 1758 CrossRef CAS.
- A. Jain, Y. Shin and K. A. Persson, Nat. Rev. Mater., 2016, 1, 1 Search PubMed.
- R. O. Jones, Rev. Mod. Phys., 2015, 87, 897 CrossRef.
- P. Giannozzi, S. Baroni, N. Bonini, M. Calandra, R. Car, C. Cavazzoni, D. Ceresoli, G. L. Chiarotti, M. Cococcioni and I. Dabo, et al., J. Phys.: Condens. Matter, 2009, 21, 395502 CrossRef.
- P. Giannozzi, O. Andreussi, T. Brumme, O. Bunau, M. B. Nardelli, M. Calandra, R. Car, C. Cavazzoni, D. Ceresoli and M. Cococcioni, et al., J. Phys.: Condens.Matter, 2017, 29, 465901 CrossRef CAS.
- P. Giannozzi, O. Baseggio, P. Bonfà, D. Brunato, R. Car, I. Carnimeo, C. Cavazzoni, S. De Gironcoli, P. Delugas and F. Ferrari Ruffino, et al., J. Chem. Phys., 2020, 152, 154105 CrossRef CAS PubMed.
- D. M. Ceperley and B. J. Alder, Phys. Rev. Lett., 1980, 45, 566 CrossRef CAS.
- G. B. Bachelet, D. R. Hamann and M. Schlüter, Phys. Rev. B: Condens. Matter Mater. Phys., 1982, 26, 4199 CrossRef CAS.
- M. Bettega, L. Ferreira and M. Lima, Phys. Rev. A, 1993, 47, 1111 CrossRef CAS.
- G. Kresse and J. Hafner, J. Condens. Matter Phys., 1994, 6, 8245 CrossRef CAS.
- J. Fardush Tanha, S. Farhad, U. Honey, N. Tanvir, T. Hasan, S. Shahriyar Nishat, A. Kabir, S. Ahmed, M. Hakim, M. Khan, M. Moniruzzaman and I. Ahmed, J. Appl. Phys., 2021, 130, 235107 CrossRef CAS.
- S. Ahmed, S. S. Nishat, A. Kabir, A. S. H. Faysal, T. Hasan, S. Chakraborty and I. Ahmed, Phys. B, 2021, 615, 413061 CrossRef CAS.
- S. Ahmed, T. Hasan, A. S. H. Faysal, S. S. Nishat, M. Khan, A. Kabir and I. Ahmed, Comput. Mater. Sci., 2022, 214, 111743 CrossRef CAS.
- X. Ma, B. Lu, D. Li, R. Shi, C. Pan and Y. Zhu, J. Phys. Chem. C, 2011, 115, 4680 CrossRef CAS.
- H. S. Park, K. E. Kweon, H. Ye, E. Paek, G. S. Hwang and A. J. Bard, J. Phys. Chem. C, 2011, 115, 17870 CrossRef CAS.
- O. Volnianska, P. Boguslawski, J. Kaczkowski, P. Jakubas, A. Jezierski and E. Kaminska, Phys. Rev. B: Condens. Matter Mater. Phys., 2009, 80, 245212 CrossRef.
- R. M. Sheetz, I. Ponomareva, E. Richter, A. N. Andriotis and M. Menon, Phys. Rev. B: Condens. Matter Mater. Phys., 2009, 80, 195314 CrossRef.
- S. Grimme, S. Ehrlich and L. Goerigk, J. Comput. Chem., 2011, 32, 1456 CrossRef CAS.
- A. Togo and I. Tanaka, Scr. Mater., 2015, 108, 1 CrossRef CAS.
- A. Togo, L. Chaput, T. Tadano and I. Tanaka, J. Phys.: Condens. Matter, 2023, 35(35), 353001 CrossRef PubMed.
- T. Le Bahers, M. Rerat and P. Sautet, J. Phys. Chem. C, 2014, 118, 5997 CrossRef.
- C. Franchini, J. Phys.: Condens.Matter, 2014, 26, 253202 CrossRef.
- A. Stroppa and G. Kresse, Phys. Rev. B: Condens. Matter Mater. Phys., 2009, 79, 201201 CrossRef.
- A. Stroppa and S. Picozzi, Phys. Chem. Chem. Phys., 2010, 12, 5405 RSC.
- M. Marsman, J. Paier, A. Stroppa and G. Kresse, J. Phys.: Condens.Matter, 2008, 20, 064201 CrossRef CAS.
- K. E. Kweon and G. S. Hwang, Phys. Rev. B: Condens. Matter Mater. Phys., 2012, 86, 165209 CrossRef.
- A. D. Becke, J. Chem. Phys., 1993, 98, 1372 CrossRef CAS.
- J. Paier, M. Marsman and G. Kresse, Phys. Rev. B: Condens. Matter Mater. Phys., 2008, 78, 121201 CrossRef.
- K. E. Kweon and G. S. Hwang, Phys. Rev. B: Condens. Matter Mater. Phys., 2013, 87, 205202 CrossRef.
- A. A. Mostofi, J. R. Yates, Y.-S. Lee, I. Souza, D. Vanderbilt and N. Marzari, Comput. Phys. Commun., 2008, 178, 685 CrossRef CAS.
- Y. Hou, S. Ardo and R. Wu, Phys. Rev. Mater., 2021, 5, 065801 CrossRef CAS.
- S. Ahmed, A. S. H. Faysal, M. Khan, M. Basith, M. S. Bashar, H. Das, T. Hasan and I. Ahmed, Results Phys., 2021, 31, 104940 CrossRef.
- T. Hasan, A. Saha, M. Khan, R. Rashid, M. Basith, M. S. Bashar and I. Ahmed, AIP Adv., 2022, 12(9), 095003 CrossRef CAS.
- T. Zeng, X. Yu, S. Hui, Z. Zhou and X. Dong, Mater. Res. Bull., 2015, 68, 271 CrossRef CAS.
- M. Maczka, J. Hanuza, W. Paraguassu, G. Souza Filho, P. Tarso Cavalcante Freire and J. Mendes Filho, et al., Appl. Phys. Lett., 2008, 92, 112911 CrossRef.
- K. Zhou, J. Lu, Y. Yan, C. Zhang, Y. Qiu and W. Li, RSC Adv., 2020, 10, 12068 RSC.
- M. Ge and L. Liu, Mater. Sci. Semicond. Process., 2014, 25, 258 CrossRef CAS.
- L.-W. Zhang, Y.-J. Wang, H.-Y. Cheng, W.-Q. Yao and Y.-F. Zhu, Adv. Mater., 2009, 21, 1286 CrossRef CAS.
- J. Yu, J. Xiong, B. Cheng, Y. Yu and J. Wang, J. Solid State Chem., 2005, 178, 1968 CrossRef CAS.
- F. Chen, D. Li, B. Luo, M. Chen and W. Shi, J. Alloys Compd., 2017, 694, 193 CrossRef CAS.
- R. Song, N. Chen, B. Han, S. Yu, Y. Wang, K. Liu, Z. Tong and H. Zhang, Environ. Sci. Pollut. Res., 2021, 28, 36434 CrossRef CAS.
- Y.-H. B. Liao, J. X. Wang, J.-S. Lin, W.-H. Chung, W.-Y. Lin and C.-C. Chen, Catal. Today, 2011, 174, 148 CrossRef CAS.
- S.-P. Hu, C.-Y. Xu and L. Zhen, Mater. Lett., 2013, 95, 117 CrossRef CAS.
- Z. Cui, D. Zeng, T. Tang, J. Liu and C. Xie, J. Hazard. Mater., 2010, 183, 211 CrossRef CAS PubMed.
- A. Hao, X. Ning, Y. Cao, J. Xie and D. Jia, Mater. Chem. Front., 2020, 4, 2096 RSC.
- M. T. L. Lai, C. W. Lai, K. M. Lee, S. W. Chook, T. C. K. Yang, S. H. Chong and J. C. Juan, J. Alloys Compd., 2019, 801, 502 CrossRef CAS.
- X. Guo, D. Wu, X. Long, Z. Zhang, F. Wang, G. Ai and X. Liu, Mater. Charact., 2020, 163, 110297 CrossRef CAS.
- C. Huang, L. Chen, H. Li, Y. Mu and Z. Yang, RSC Adv., 2019, 9, 27768 RSC.
- A. Pancielejko, J. Łuczak, W. Lisowski, G. Trykowski, D. Venieri, A. Zaleska-Medynska and P. Mazierski, Appl. Surf. Sci., 2022, 599, 153971 CrossRef CAS.
- T. Xie, Y. Liu, H. Wang and Z. Wu, Sci. Rep., 2019, 9, 7551 CrossRef PubMed.
- M. Cheng, L. Yang, H. Li, W. Bai, C. Xiao and Y. Xie, Nano Res., 2021, 14, 3365 CrossRef CAS.
- Y. Zhu, Y. Wang, Q. Ling and Y. Zhu, Appl. Catal., B, 2017, 200, 222 CrossRef CAS.
- X. Wu, D. Vanderbilt and D. Hamann, Phys. Rev. B: Condens. Matter Mater. Phys., 2005, 72, 035105 CrossRef.
- S. Shang, Y. Wang and Z.-K. Liu, Appl. Phys. Lett., 2007, 90, 101909 CrossRef.
- F. Mouhat and F.-X. Coudert, Phys. Rev. B: Condens. Matter Mater. Phys., 2014, 90, 224104 CrossRef.
- Y. Huang, Y. Yuan, F. Ma, Z. Zhang, X. Wei and G. Zhu, Phys. Status Solidi, 2018, 255, 1700653 CrossRef.
- O. Gomis, B. Lavina, P. Rodríguez-Hernández, A. Muñoz, R. Errandonea, D. Errandonea and M. Bettinelli, J. Phys.: Condens.Matter, 2017, 29, 095401 CrossRef CAS PubMed.
- R. Hill, Proc. Phys. Soc., London, Sect. A, 1952, 65, 349 CrossRef.
- H. Dong, C. Chen, S. Wang, W. Duan and J. Li, Appl. Phys. Lett., 2013, 102, 182905 CrossRef.
- M. Yaakob, M. Taib, M. Deni, A. Chandra, L. Lu and M. Yahya, Ceram. Int., 2013, 39, S283 CrossRef CAS.
- K. B. Spooner, A. M. Ganose, W. W. Leung, J. Buckeridge, B. A. Williamson, R. G. Palgrave and D. O. Scanlon, Chem. Mater., 2021, 33, 7441 CrossRef CAS.
- Y. Tsuji, P. L. Dasari, S. Elatresh, R. Hoffmann and N. Ashcroft, J. Am. Chem. Soc., 2016, 138, 14108 CrossRef CAS PubMed.
|
| This journal is © The Royal Society of Chemistry 2023 |
Click here to see how this site uses Cookies. View our privacy policy here.  Open Access Article
 a,
Sadiq Shahriyar Nishat
 b,
Mohsina Sultana
 a,
Tasnim Ahmed Mahi
 ac,
Shahran Ahmed
 ad,
M. N. I. Khan
 e,
H. N. Das
 e,
Muhammad Shahriar Bashar
 f,
Umme Sarmeen Akhtar
 g,
Sharmin Jahan
 h,
Fariha Chowdhury
 i,
Khandker Saadat Hossain
 j,
Sazzad M. S. Imran
 a and
Imtiaz Ahmed
 *a
*a
![[thin space (1/6-em)]](https://www.rsc.org/images/entities/char_2009.gif) 000 rpm, 5 cycles) facilitated the photocatalyst removal from the dye solution. The UV-vis absorption measurements are taken in finite intervals for SBWO (30 min), HBWO-U (10 min), and HBWO-S (10 min) to evaluate the photocatalytic degradation performances.
000 rpm, 5 cycles) facilitated the photocatalyst removal from the dye solution. The UV-vis absorption measurements are taken in finite intervals for SBWO (30 min), HBWO-U (10 min), and HBWO-S (10 min) to evaluate the photocatalytic degradation performances.![[double bond, length as m-dash]](https://www.rsc.org/images/entities/char_e001.gif) O bonds appear near 1314 cm−1 (HBWO-U) and 1392 cm−1 (HBWO-S). The adsorption of atmospheric CO2 may have originated these IR bands.
O bonds appear near 1314 cm−1 (HBWO-U) and 1392 cm−1 (HBWO-S). The adsorption of atmospheric CO2 may have originated these IR bands.

![[double bond, length as m-dash]](https://www.rsc.org/images/entities/char_e001.gif) O bonds adsorbed on the surface of samples.72
O bonds adsorbed on the surface of samples.72


