 Open Access Article
Computer vision for non-contact monitoring of catalyst degradation and product formation kinetics†
Chunhui
Yan
 a,
Megan
Cowie
a,
Calum
Howcutt
a,
Katherine M. P.
Wheelhouse
a,
Megan
Cowie
a,
Calum
Howcutt
a,
Katherine M. P.
Wheelhouse
 b,
Neil S.
Hodnett
 b,
Martin
Kollie
a,
Martin
Gildea
a,
Martin H.
Goodfellow
 a and
Marc
Reid
 *a
*a
aWestCHEM Department of Pure & Applied Chemistry University of Strathclyde, Glasgow, UK. E-mail: marc.reid.100@strath.ac.uk
bGSK R&D Medicine Development and Supply, Stevenage, UK
First published on 7th March 2023
Abstract
We report a computer vision strategy for the extraction and colorimetric analysis of catalyst degradation and product-formation kinetics from video footage. The degradation of palladium(II) pre-catalyst systems to form ‘Pd black’ is investigated as a widely relevant case study for catalysis and materials chemistries. Beyond the study of catalysts in isolation, investigation of Pd-catalyzed Miyaura borylation reactions revealed informative correlations between colour parameters (most notably ΔE, a colour-agnostic measure of contrast change) and the concentration of product measured by off-line analysis (NMR and LC-MS). The breakdown of such correlations helped inform conditions under which reaction vessels were compromised by air ingress. These findings present opportunities to expand the toolbox of non-invasive analytical techniques, operationally cheaper and simpler to implement than common spectroscopic methods. The approach introduces the capability of analyzing the macroscopic ‘bulk’ for the study of reaction kinetics in complex mixtures, in complement to the more common study of microscopic and molecular specifics.
Introduction
Catalyst degradation
Despite the broad implications of homogeneous catalyst deactivation, it oftentimes presents a less rewarding pursuit than the design and application of new catalyst modalities.1–4 However, the problem of degradation affects homogeneous metal-catalysed processes spanning cobalt-catalysed H2 evolution,5 nickel-catalysed polymerisation of ethylene,6 rhodium-catalysed heteroarene hydrogenation7 and aryl silylation,8 iridium-catalysed hydrogenation9 and hydrogen-isotope exchange,10 and ruthenium-catalysed transfer hydrogenation11,12 and olefin metathesis.13,14 This list is by no means comprehensive. In balance, it is well-known that such catalyst degradation processes can represent formation of catalytically-competent heterotopic clusters,4,7,15–18 and not exclusively precipitation of catalytically inactive solid(s).Among all known homogeneous catalyst degradation challenges, palladium is arguably among the most widely studied.15–35 The formation of palladium black (hereafter ‘Pd black’, a term used colloquially to refer to the black precipitate of elemental Pd, formed via decomposition of various Pd complexes) is notorious for decreasing available active catalyst for the intended chemistry, complicating reaction work-up, and leading to expensive waste.19,36 Indeed, Pd black is known to affect Suzuki–Miyaura and Negishi cross-coupling,37 C–H arylation,16 heterogeneous catalyst functionalisation,30 homogeneous catalyst ligand design,24 alkene carbonylation,35 arene homocoupling,32 Heck reactions,33 metal scavenging and recycling,19,36 aerobic alcohol oxidation,22 tetrahydrofuran synthesis,21 arene allylation,23 homo- and co-polymerisation of ethylene,38 and Miyaura borylation.25
From the perspective of mechanistic investigation, a wealth of specific analytical methods have been expertly applied to understand the pathways through which Pd catalyst degradation occurs. Common techniques in the study of catalyst degradation mechanisms, include the use of dip probes (e.g. ATR-IR, Raman),31 cuvette-based methods (e.g. UV-vis, calorimetry),39,40 NMR,41,42 small angle neutron scattering,42 mass spectrometry,43 X-ray diffraction (XRD),18,36 and auto-sampling for offline gas or liquid chromatography.44,45 These methods are often used in combination to provide the fullest possible reaction understanding, covering different levels of analyte specificity and limits of detection.46 In this study, we investigated the development and application of computer vision as a camera-based method for providing data-rich, real-time, and non-contact kinetic information on product formation from colour changes of the reaction bulk. As an in-line (and viably on-line) complement to existing off-line analytical methods, we applied the same camera-based analysis to the widespread problem of Pd catalyst degradation processes in a way that complements the above-cited analytics.
Our colorimetric kinetics method is explored as an operationally cheap and simple method (relative to the set-up of more common spectroscopic reaction monitoring methods) of obtaining macroscopic kinetic information from the reaction bulk.
Computer vision for analytical chemistry
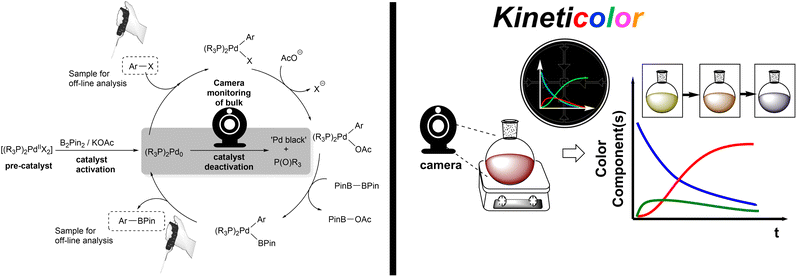
Computer vision (with related imaging technology) is the science of digitally quantifying real-world objects using camera technologies and algorithms. While the term is often (but not always) more specifically reserved for applications that go beyond raw image processing, computer vision has been widely applied across many industries, including the art,47 astronomy,48 automotive,47 and defence sectors.47 In the broadest sense, computer vision helps scientists objectively quantify subjective and fallible human vision using digital image capture and processing. Said images can then be more deeply analysed using computer-added algorithmic processing for feature filtering, object detection, and more. Computer vision for analytical chemistry (CVAC)49,50 is a subdivision of the broader space, providing a promising means of non-invasive analysis. Indeed, as a single image analysis technique, CVAC has notable precedent in chemical and related subdisciplines, including metallurgy,51 fruit drying process,52–55 meat quality control,56–59 trace element60–63 and illicit sample analyses,64 and monitoring the crystallization process (Scheme 1, left).55,65,66 | ||
| Scheme 1 Left: Exemplary breadth of known computer vision applications. Right: investigative philosophy of the current work to develop computer vision analysis for chemical kinetics. | ||
Comparatively, video analysis for the extraction of time-dependent colorimetric information in chemistry applications is underdeveloped.52,67–73 In relation to the current paper, Leadbeater and co-workers have shown that video recordings (provided as ESI†) serve to qualitatively document impending catalyst failure in microwave assisted reactions.50,74 Colour changes are ubiquitous across chemistry-related processes.75 And yet, in synthesis, colour itself is arguably more often qualitatively reported by eye, than (semi-)quantitatively assessed with help of colour charts, for example.49 However, CVAC, through the extraction of camera or camcorder pixel data, enables unambiguous quantification of colour, captured by the camera sensor, using colour models such as RGB (red–green–blue), HSV (hue-saturation-value), and CIE-L*a*b* (lightness, red to green, and blue to yellow).49 It is with these metrics that we investigated the ability to generate kinetic analysis of catalytic reaction bulk media and investigate possible correlations with established offline analytical techniques (Scheme 1, right). Using our in-development video analysis platform, Kineticolor, we sought to investigate this analytical method using Pd-catalyzed Miyaura borylation as a far-reaching case study (Scheme 2).
Results and discussion
Proof-of-concept analysis of Pd black formation
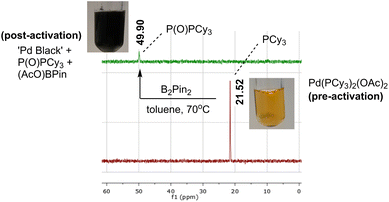
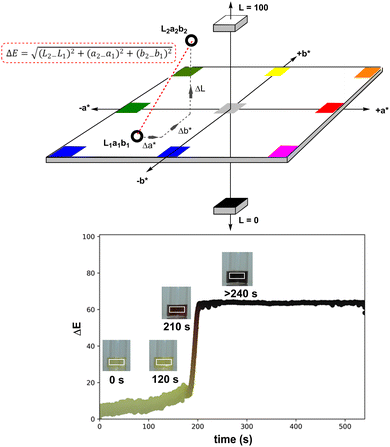
Inspired by the work of Wei et al. on the activation process of Pd(II) precatalysts for aryl halide borylation,25 we began our investigation using the same Pd bisphosphine system as an exploratory case study (Scheme 2). The attempted reduction of [Pd(OAc)2(PCy3)2] precatalyst toward the active Pd(0) catalyst was carried out under air to deliberately trigger catalyst deactivation. The degradation process presented an often instantaneous colour change, transitioning from a clear homogeneous yellow solution, characteristic of the pre-catalyst, to an opaque black heterogeneous suspension, signalling Pd black formation. The colour change illustrated (at least partial) catalyst failure. This assumption was corroborated by 31P NMR analysis revealing phosphine speciation differences for the colorimetrically distinct reaction samples (yellow versus black; Scheme 3). All Pd-ligated phosphine had been oxidised to phosphine oxide during the recorded degradation processes.We captured and quantified the colorimetric kinetic profile of this often rapid yellow to black colour transformation using camera-enabled computer vision methods. Specifically, we used Kineticolor – a software platform under development in our group – to analyse colour data from a selected region of interest in a video recording of a reaction over time. An exemplar output graph of the deactivation process is shown in Scheme 4. The software has been designed to enable kinetic analysis of video footage captured from any digital camera. As such, several camera and controlled lighting set-ups were employed throughout the investigation (see ESI,† and discussion on investigating correlations between analytical datasets).
The selected area of video footage analysed by Kineticolor (the white rectangles in Scheme 4, right, inset photos) aimed to minimise background and stirrer bar interference (see Fig. S4† for more details). The CIE L*a*b* colour space is set along three perpendicular dimensions: L* represents lightness (0 is black, 100 is white), a* covers green colours (negative values) through to red colours (positive values), and b* covers blue colours (negative values) through to yellow colours (positive values). From the CIE L*a*b* colour space, an intuitive measure of overall colour displacement known as delta E (ΔE) is derived. ΔE is a measure of Euclidean (i.e. straight line) displacement in the CIE L*a*b* colour space, and can be thought of as a measure of contrast change, as measured against the colours at time, t0 = 0 s (i.e. video frame 1).76 The higher the ΔE quantity at a given point in time, the greater and more visually obvious the colour change is relative to t0, irrespective of the exact colour change occurring. In the case of recording the events leading to the formation of Pd black, the ΔE versus time profile captures both slow and subtle colour changes (up to ca. 180 s) as well as rapid and obvious colour change events (at ca. 200 s). Kineticolor was also used to capture more granular colour change detail evident in RGB, HSV, and related colour models, beyond CIE-L*a*b* and ΔE. See ESI† for further details.
In relation to the formal colour models and quantification of reaction video footage, it is important to understand that, throughout this paper, we employ more loose descriptors of colour (“transparent”, “see-through”, “opaque”, “yellow”, “black”, etc.) to exemplify how one might qualitatively describe by-eye observations for lab book recording purposes. Where quantification is concerned, the reader will be directed to a colour model and magnitudes associated with the colour parameters being discussed.
Visually recording the physical & chemical factors impacting Pd black formation
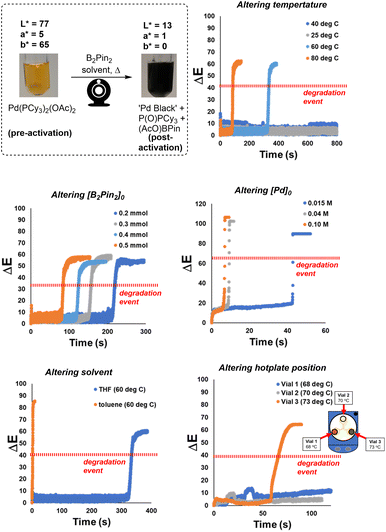
The proof-of-concept colour analysis showed that the acute colour change of the isolated Pd catalyst degradation experiments could be recorded and quantified, across various known colour models, using our computer vision-enabled analysis of the reaction bulk. We next applied the method to more fully assess the physical and chemical conditions affecting the colorimetric rate of Pd black formation in the same simplified system involving only the precatalyst. The ΔE versus time profiles in Scheme 5 demonstrate the ability to comprehensively capture and quantify the visible changes over time.The technique was applied to explore a range of synthetically relevant conditions. Increased B2Pin2 and Pd precatalyst concentrations decreased the time taken to reach the instantaneous degradation event. Above an approximate threshold of 40 °C in limited timeframe of analysis, elevated temperature also served to bring about a faster visible formation of Pd black. The paired effects of stirring rate and vessel positioning on the catalyst degradation process showed less obvious trends, but served to demonstrate the acute sensitivity of the system to changes in these parameters. Additional colour kinetic data versus time are available in the ESI.†
The more subtle impact of stirrer speed on the rate of catalyst deactivation requires further discussion. When a 3-in-1 clamp was used on the stirrer hotplate, the ΔE profiles shown in Scheme 5 (bottom right) illustrate that the degradation rates of three parallel runs were not reproducible. The temperature of each vial was measured by a thermometer, and recorded a range of 5 °C across three vials, and thus presumably contributed to the observed rate differences. However, through re-examination of the video, the stirring pattern of the stirrer bar in each vial (dictated by the central single magnet mechanism of the hotplate itself) was identified as another possible contributor to the notably distinct degradation patterns across the three vials. Specifically, the stirrer bar in vial 2 was set against the wall all the time, leading to inefficient mixing of the solution. Poor mixing, in turn, presumably hindered the degradation process and the observed lack of any pronounced yellow to black colour change. The stirrer bars within vials 1 and 3 behaved in a similar way, providing more vigorous mixing versus vial 2. However, vial 3, the hottest of the vials, turned to black only after 1 minute while vial 1 (5 °C cooler than vial 3) stayed at this reddish-brown colour for 6 minutes. The extreme sensitivity of catalyst deactivation to stirring profile is consistent with stirring-enabled changes in gas–liquid mass transport, allowing oxygen dissolution in solution at different rates. Alternatively, these data may point to a nucleation event that triggers the instantaneous degradation event, with more vigorous stirring causing more microscopic glass shearing and glass surface defects.77 See Scheme S6† for further data and discussion on mixing.
Visually recording the impact of air versus argon in Pd black formation
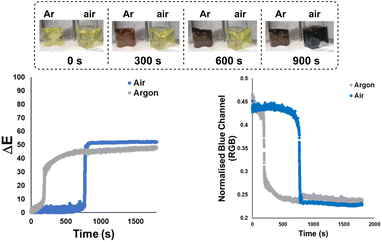
Next, the bulk colours of the catalyst solutions were compared when run under inert atmosphere (argon supply, dry Schlenk tube) versus exposed to air (Scheme 6). Once again, ΔE-time profiles were employed to track comparative changes over time. As became insightful in later statistical analysis (vide infra), Scheme 6 also serves to show that other colour parameters (in this case, the blue channel from the RGB space) that are extractable from the same video source can be used to describe the catalyst degradation kinetics. Intriguingly, the colour transition was quantifiably more gradual under inert conditions than in air, as captured by our Kineticolor computer vision work flow. The colour in the inert flask remained transparent (non-opaque) brown after 30 minutes. The air-exposed mixture followed the sudden transparent (see-through) yellow to opaque (non-see-through) black colour change of Pd black formation, consistent with vial-based experiments (above). A related experiment was carried out at the higher temperature of 72 °C, and showed a similar but faster pair of trends, again consistent with earlier vial-based experiments (Scheme S8†). Interestingly, the brown solution formed under argon instantly turned to black when it was exposed to air (Fig. S7†). These experiments provided our first evidence supporting the visual observation that the integrity of an inert atmosphere for a sensitive catalytic process could be recorded and quantified using our computer vision method, without the need to use specific extraneous indicators.78Applying computer vision kinetics to Pd-catalysed borylation
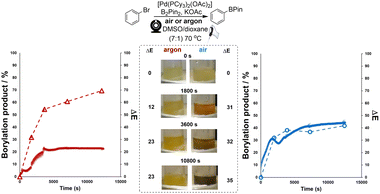
Preliminary studies focused on analysing catalyst degradation in isolation. Our investigation next looked at the analysis of more synthetically-relevant catalytic Miyaura borylation reactions, using the same catalyst. For this, we primarily focused on recording the colorimetric differences emerging from borylation reactions performed in inert versus air atmospheres. To cross-validate any interpretation of the colorimetric data derived from our computer vision method, samples of the reaction mixtures were taken for off-line analysis by 1H NMR and LC-MS. Both borylation reactions (one each under air or argon) started off with a visibly similar yellow hue. Over 3 hours, the reaction under air turned black, whereas the reaction under argon maintained a more vibrant yellow coloration (Scheme 7). Consistent with these observations, the maximum measured concentration of borylation product was approximately 1.8-fold higher in the argon atmosphere than under air. The results of computer vision-derived ΔE for each reaction were overlaid with independently measured concentrations for both aryl bromide decay and boronate ester evolution. Based on ΔE, the reaction under air displays a higher degree of contrast change (ΔEmax ≈ 45; Scheme 7, right) throughout the whole process versus the reaction under argon (ΔEmax ≈ 23; Scheme 7, left). This part of our investigation showed that the computer-vision-derived data from ex situ video recordings of the reaction bulk were able to provide useful and complementary information to that exposed by off-line concentration measurements. Whereas offline measurements tracked molecularly-specific analyte concentrations, the camera captured the resulting macroscopic bulk colour changes in the reactor. This is potentially valuable from two perspectives. First, the bulk colour can (as in cases exemplified below) be dominated by the formation of the desired product. In other cases, fleeting levels of coloured impurity, otherwise below the detection limit of variable in situ of offline sampling methods, can be made trackable by this camera-enabled bulk analysis approach.The results of ΔE shown in Scheme 8 (non-preheated conditions, right) exhibited a different but intriguing trend within the first hour of reaction versus the pre-heated case (Scheme 8, left). It revealed an additional quick colour change happening within 10 min of precatalyst addition, then the reaction mixture nearly turns to its original colour at around 40 min, and the remainder of the ΔE profile is similar to the one in Scheme 8, left. The additional colour change, not observed when the component solutions are all pre-heated, is presumably associated with thermally-promoted coordination of DMSO to the palladium catalyst.79,80 In this way, analysis of the reaction via computer vision, with its higher temporal resolution versus off-line sampling, captures unrecorded kinetic details hidden in the bulk.
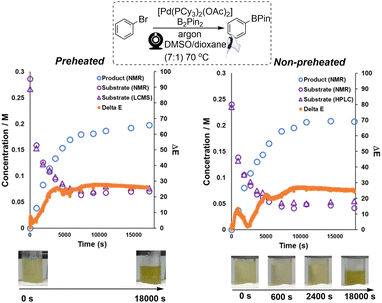 | ||
| Scheme 8 Left: The kinetic profile of Miyaura borylation combined with ΔE and calculated concentration data (substrate and product). Right: the combined kinetic profile of Miyaura borylation using a non-preheated catalyst solution. In all cases, open triangles represent substrate concentration by HPLC, open circles decaying over time represent substrate concentration by NMR, open circles increasing over time represent product concentration by NMR, and closed circles (tightly spaced) represent colour/camera-derived data. Bottom: screenshots from the video of the catalyst solutions at various time points. Conditions: See ESI† for detailed breakdown of pre-heated versus non-pre-heated distinction. | ||
Investigating correlations between analytical datasets
Having found qualitative complementarity between the computer vision and concentration datasets, we investigated possible quantitative correlations between colour and off-line concentration data. The latter had primarily been collected to validate the interpretation of the colour kinetics derived from our computer vision workflow. Following a brief reaction optimisation process (see ESI† for details), the borylation reactions, under air, nitrogen and argon, were monitored for 3 hours. Once again, off-line samples were collected for 1H NMR and LC-MS analysis. Under argon and nitrogen, there were relatively subtle colour changes, visible to the eye, even with only 0.2–0.5 mol% of catalyst used. Product concentration profile was qualitatively consistent with the ΔE profiles, where most of the recorded contrast change occurred before 60 min. The ΔEmax ≈ 20 was consistent with the subtle contrast of the pale-yellow to dark yellow colour change observed over time. The kinetic information made available by the computer vision work flow could also be visualised from additional, more specific colour model plots versus time, beyond the contrast changes captured in ΔE (see Fig. S8†).For this part of the investigation, lighting control and camera choice played a more notable role. To this point in the investigation, a key part of our computer vision kinetics approach has been to demonstrate the value of capturing relative colour changes over time. Without reference to any absolute colour, the time-based profile of the reactions has served to highlight the important, time-sensitive events associated with catalyst degradation and productive reaction progress. This approach enables valuable bulk kinetics to be captured in situations where lighting control is a challenge. However, to formally investigate colour-concentration correlations in this non-trivial metal-catalysed reaction mixture, we ensured use of a single camera and light box to continuously capture footage for several hours (see ESI† for full details). To further demonstrate the accessibility of this approach, all data produced on a single camera has been used without the need for formal calibration against a standard.
To investigate possible correlations between computer vision and off-line concentration datasets, time-matched samples from each independent dataset were curated (see Table S1†). Importantly for reactions under argon and nitrogen, the selected correlations between off-line concentration and colour measurements were consistent with the highest ranking Mutual Information (M. I.)81 scores. As a probabilistic and non-parametric complement to regression modelling, M. I. ensured that the colour features modelled were those with the most likely overlap in information relative to concentration data, without necessarily assuming the relationships were linear. This calculation alone provides compelling evidence that bulk non-contact measures of reaction colour can provide useful information on reaction progress, complementary to direct measures of particular analyte concentration.
Scheme 9 exemplifies the correlation using those colour parameters calculated to carry high M. I. with product concentration. To assess potential predictive power in these correlations, cross-validated single-component linear regression for each colour-concentration pairing are also shown in Scheme 9. For those reactions under argon and nitrogen, off-line NMR-measured product concentration showed statistically significant correlation and prediction of concentration using several colour parameters of high rank in the M. I. analysis. The NMR correlation with the blue parameter from the RGB colour space is exemplified in Scheme 9. Such correlations, predictive power, and mutual information between colour and concentration measures were broken for comparable reactions under air (see VTNA and Mutual Information ESI† Sections). In air, reactions turned more noticeably black compared to subtler changes under argon and nitrogen.
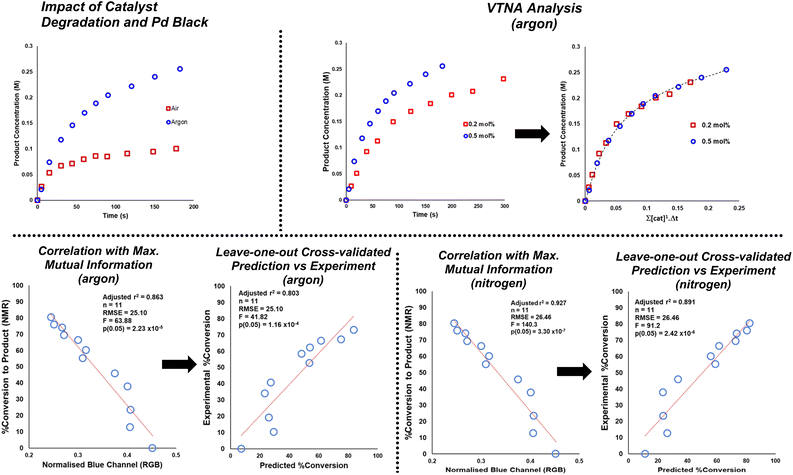 | ||
| Scheme 9 Top left: Exemplar of stalled product formation under air (red squares) versus under argon (blue circles) at 0.5 mol% catalyst loading, as measured by 1H NMR. Top right: VTNA analysis consistent with first order kinetics in catalyst under argon. See ESI† for comparable nitrogen data. Bottom left: concentration vs. colour parameter of maximum mutual information, and leave-one-out cross validated linear model of concentration prediction from the same colour parameter for borylation under an argon atmosphere. Bottom right: the same correlation analysis for a comparable borylation under a nitrogen atmosphere. The trends displayed here are consistent with those concluded by use of the more widely used ΔE metric. | ||
Variable time normalization analysis (VTNA)82 evidenced first order reactions in catalyst under argon and comparable reactivity under nitrogen. Compared to argon, the same reaction under air stalled at 2.5-fold lower product conversion in the same time. The correlations in Scheme 9 with the blue parameter are exemplified on account of their highest ranking among all calculated colour parameters, as quantified by M. I. analysis. The colour-concentration trends are qualitatively consistent with those measurable by the more intuitive ΔE metric used throughout this investigation (see ESI† for details).
To the best of our knowledge, the colour-concentration correlations exemplified in Scheme 9 (and backed up by mutual information calculations) are the first of their kind for a complex metal-catalysed reaction mixture. These correlations provide the necessary demonstration that, in practically demanding or restrictive environments, there is potential to use camera data instead of the more sophisticated concentration-capturing analytics to capture meaningful reaction progress, without ever touching the vessel. Since the submission of this publication, we have gone on to demonstrate the significance of this finding in the context of using non-contact cameras in place of more invasive probe-based analytics, when the reaction mixing profile has to be maintained between process-lab and full manufacturing scales.83
Limitations
It is important to emphasise that the computer vision-enabled kinetics method introduced here is built to complement existing analytics, not replace them. Such imaging methods provide a non-contact, data-rich measure of the visible reaction bulk. With appropriate verification from existing molecularly-specific analytics (HPLC and NMR among them, as exemplified in this study), it is envisaged that such measures of bulk kinetics may provide fit-for-purpose measures of reaction progress when other analytics are more challenging to deploy.It is also important to note that the Kineticolor methods described herein measure surface level signatures of reaction bulk. The aim here has been to more fully draw out the reaction monitoring and model-building capacity that is unlockable from everyday digital camera technology. While now partly attended in a sister publication,83 no claim is made here to attend the subsurface fluid dynamics that may be hidden below the detectable surface.
Conclusions
We have demonstrated the analytical power of computer vision-based kinetic profiling of reaction bulk to follow reaction progress. The method was demonstrated for analyses of both isolated catalyst solutions and more analytically complex Miyaura borylation reactions of broad utility under synthetically-relevant conditions. In the study of inert versus air atmospheres, modelling of colour kinetic data versus off-line NMR and LC-MS sampling data evidenced a means of diagnosing successful versus failed reactions based on recorded colour. Mutual information (M. I.), single-component linear regression, and variable time normalization analysis were used in combination to ensure that the most relevant colour-concentration data were modelled. Thus, strong evidence has been provided showing that bulk colour data recorded by non-contact video recording contains valuable information complementary to that obtained by more traditional sampling for off-line concentration measurements. It is envisaged that computer vision-enabled reaction monitoring will have a broader range of applications of colorimetric kinetic analysis of reaction bulk, in and beyond catalysis, at various reaction scales. Broader applications of non-invasive camera-based reaction monitoring are now ongoing in our laboratories.Data availability
The datasets supporting this article have been uploaded as part of the ESI.†Author contributions
Chunhui Yan: methodology; software; validation; formal analysis; investigation; data curation; writing (original draft). Megan Cowie: methodology; validation; investigation; data curation. Calum Howcutt: methodology; validation; investigation; data curation. Katherine M. Wheelhouse: conceptualization; validation. Neil S. Hodnett: conceptualization; validation. Martin Kollie: software; validation; formal analysis. Martin Gildea: software; validation; formal analysis. Martin H. Goodfellow: software; supervision. Marc Reid: conceptualization; methodology; software; formal analysis; resources; data curation; writing (original draft); writing (review & editing); visualization; supervision; project administration; funding acquisition.Conflicts of interest
M. R. is leading the commercialisation of the Kineticolor software.Acknowledgements
MR, CH, MK, MG and MHG thank the Centre for Process Analytics & Control Technology (CPACT) and the Analytical Chemistry Trust Fund for seed funding. MR thanks UK Research & Innovation for Future Leaders Fellowship funding (MR/T043458/1).Notes and references
- R. H. Crabtree, Chem. Rev., 2015, 115, 127–150 CrossRef CAS PubMed.
- D. G. Blackmond, J. Am. Chem. Soc., 2015, 137, 10852–10866 CrossRef CAS PubMed.
- J. Burés, Angew. Chem., Int. Ed., 2016, 55, 2028–2031 CrossRef PubMed.
- D. Gärtner, S. Sandl and A. J. von Wangelin, Catal. Sci. Technol., 2020, 10, 3502–3514 RSC.
- P. Wang, G. Liang, M. R. Reddy, M. Long, K. Driskill, C. Lyons, B. Donnadieu, J. C. Bollinger, C. E. Webster and X. Zhao, J. Am. Chem. Soc., 2018, 140, 9219–9229 CrossRef CAS PubMed.
- T. F. C. Cruz, C. A. Figueira, L. F. Veiros and P. T. Gomes, Organometallics, 2021, 40, 2594–2609 CrossRef CAS.
- S. Kim, F. Loose, M. J. Bezdek, X. Wang and P. J. Chirik, J. Am. Chem. Soc., 2019, 141, 17900–17908 CrossRef CAS PubMed.
- E. C. Keske, T. H. West and G. C. Lloyd-Jones, ACS Catal., 2018, 8, 8932–8940 CrossRef CAS.
- R. H. Crabtree, Acc. Chem. Res., 1979, 12, 331 CrossRef CAS.
- J. A. Brown, A. R. Cochrane, S. Irvine, W. J. Kerr, B. Mondal, J. A. Parkinson, L. C. Paterson, M. Reid, T. Tuttle, S. Andersson and G. N. Nilsson, Adv. Synth. Catal., 2014, 356, 3551–3562 CrossRef CAS.
- A. M. R. Hall, P. Dong, A. Codina, J. P. Lowe and U. Hintermair, ACS Catal., 2019, 9, 2079–2090 CrossRef CAS.
- J. Medina and L. Sasson, Mod. Res. Catal., 2014, 3, 68–88 CrossRef.
- S. J. Ton and D. E. Fogg, ACS Catal., 2019, 9, 11329–11334 CrossRef CAS.
- S. A. Rufh, A. Y. Goudreault, M. Foscato, V. R. Jensen and D. E. Fogg, ACS Catal., 2018, 8, 11822–11826 CrossRef CAS.
- N. W. J. Scott, M. J. Ford, C. Schotes, R. R. Parker, A. C. Whitwood and I. J. S. Fairlamb, Chem. Sci., 2019, 10, 7898–7906 RSC.
- C. G. Baumann, S. De Ornellas, J. P. Reeds, T. E. Storr, T. J. Williams and I. J. S. Fairlamb, Tetrahedron, 2014, 70, 6174–6187 CrossRef CAS.
- A. F. Lee, P. J. Ellis, I. J. S. Fairlamb and K. Wilson, Dalton Trans., 2010, 39, 10473 RSC.
- P. J. Ellis, I. J. S. Fairlamb, S. F. J. Hackett, K. Wilson and A. F. Lee, Angew. Chem., Int. Ed., 2010, 49, 1820–1824 CrossRef CAS PubMed.
- C. E. Garrett and K. Prasad, Adv. Synth. Catal., 2004, 346, 889–900 CrossRef CAS.
- T. Iwasawa, M. Tokunaga, Y. Obora and Y. Tsuji, J. Am. Chem. Soc., 2004, 126, 6554–6555 CrossRef CAS PubMed.
- Y. Kawamura, T. Imai and T. Hosokawa, Synlett, 2006, 2006, 3110–3114 CrossRef.
- B. A. Steinhoff, A. E. King and S. S. Stahl, J. Org. Chem., 2006, 71, 1861–1868 CrossRef CAS PubMed.
- M. Iwasaki, S. Hayashi, K. Hirano, H. Yorimitsu and K. Oshima, Tetrahedron, 2007, 63, 5200–5203 CrossRef CAS.
- L. Guo, H. Gao, Q. Guan, H. Hu, J. Deng, J. Liu, F. Liu and Q. Wu, Organometallics, 2012, 31, 6054–6062 CrossRef CAS.
- C. S. Wei, G. H. M. Davies, O. Soltani, J. Albrecht, Q. Gao, C. Pathirana, Y. Hsiao, S. Tummala and M. D. Eastgate, Angew. Chem., Int. Ed., 2013, 52, 5822–5826 CrossRef CAS PubMed.
- K. Böck, J. E. Feil, K. Karaghiosoff and K. Koszinowski, Chem. – Eur. J., 2015, 21, 5548–5560 CrossRef PubMed.
- A. J. Reay, L. A. Hammarback, J. T. W. Bray, T. Sheridan, D. Turnbull, A. C. Whitwood and I. J. S. Fairlamb, ACS Catal., 2017, 7, 5174–5179 CrossRef CAS PubMed.
- D. Balcells and A. Nova, ACS Catal., 2018, 8, 3499–3515 CrossRef CAS.
- V. M. Chernyshev, A. V. Astakhov, I. E. Chikunov, R. V. Tyurin, D. B. Eremin, G. S. Ranny, V. N. Khrustalev and V. P. Ananikov, ACS Catal., 2019, 9, 2984–2995 CrossRef CAS.
- A. B. Fasman and N. V. Perkas, J. Mol. Catal., 1989, 55, 220–228 CrossRef CAS.
- D. D. Kragten, R. A. Van Santen, M. K. Crawford, W. D. Provine and J. J. Lerou, Inorg. Chem., 1999, 38, 331–339 CrossRef CAS.
- S. Mukhopadhyay, G. Rothenberg, G. Lando, K. Agbaria, M. Kazanci and Y. Sasson, Adv. Synth. Catal., 2001, 343, 455–459 CrossRef CAS.
- A. H. M. de Vries, J. M. C. A. Mulders, J. H. M. Mommers, H. J. W. Henderickx and J. G. de Vries, Org. Lett., 2003, 5, 3285–3288 CrossRef CAS PubMed.
- M. Tromp, J. R. A. Sietsma, J. A. van Bokhoven, G. P. F. van Strijdonck, R. J. van Haaren, A. M. J. van der Eerden, P. W. N. M. van Leeuwen and D. C. Koningsberger, Chem. Commun., 2003, 128–129 RSC.
- A. M. Trzeciak, W. Wojtków and J. J. Ziółkowski, Inorg. Chem. Commun., 2003, 6, 823–826 CrossRef CAS.
- Ş. Sarioǧlan, Platinum Met. Rev., 2013, 57, 289–296 CrossRef.
- A. N. Marquard, L. E. Slaymaker, R. J. Hamers and R. H. Goldsmith, Mol. Catal., 2017, 429, 10–17 CrossRef CAS.
- C.-Y. Wang, D.-M. Tan, K. S. Chan, Y.-H. Liu, S.-M. Peng and S.-T. Liu, J. Organomet. Chem., 2005, 690, 4920–4925 CrossRef CAS.
- A. C. Ferretti, J. S. Mathew and D. G. Blackmond, Ind. Eng. Chem. Res., 2007, 46, 8584–8589 CrossRef CAS.
- P. Ruiz-Castillo, D. G. Blackmond and S. L. Buchwald, J. Am. Chem. Soc., 2015, 137, 3085–3092 CrossRef CAS PubMed.
- N. W. J. Scott, M. J. Ford, N. Jeddi, A. Eyles, L. Simon, A. C. Whitwood, T. Tanner, C. E. Willans and I. J. S. Fairlamb, J. Am. Chem. Soc., 2021, 143, 9682–9693 CrossRef CAS PubMed.
- D. T. Racys, J. Eastoe, P. O. Norrby, I. Grillo, S. E. Rogers and G. C. Lloyd-Jones, Chem. Sci., 2015, 6, 5793–5801 RSC.
- G. T. Thomas, K. Ronda and J. S. Mcindoe, Dalton Trans., 2021, 50, 15533–15537 RSC.
- S. M. Mennen, C. Alhambra, C. L. Allen, M. Barberis, S. Berritt, T. A. Brandt, A. D. Campbell, J. Castañón, A. H. Cherney, M. Christensen, D. B. Damon, J. Eugenio De Diego, S. García-Cerrada, P. García-Losada, R. Haro, J. Janey, D. C. Leitch, L. Li, F. Liu, P. C. Lobben, D. W. C. Macmillan, J. Magano, E. McInturff, S. Monfette, R. J. Post, D. Schultz, B. J. Sitter, J. M. Stevens, I. I. Strambeanu, J. Twilton, K. Wang and M. A. Zajac, Org. Process Res. Dev., 2019, 23, 1213–1242 CrossRef CAS.
- N. K. Adlington, L. R. Agnew, A. D. Campbell, R. J. Cox, A. Dobson, C. F. Barrat, M. A. Y. Gall, W. Hicks, G. P. Howell, A. Jawor-Baczynska, L. Miller-Potucka, M. Pilling, K. Shepherd, R. Tassone, B. A. Taylor and A. Williams, J. Org. Chem., 2019, 84, 4735–4747 CrossRef CAS PubMed.
- M. Zühlke, S. Sass, D. Riebe, T. Beitz and H.-G. Löhmannsröben, Chempluschem, 2017, 82, 1266–1273 CrossRef PubMed.
- A. Fernández, Electron. Lett. Comput. Vis. Image Anal., 2017, 16, 25–28 Search PubMed.
- R. Elasmar, in 2016 New York Scientific Data Summit (NYSDS), IEEE, 2016, pp. 1–2 Search PubMed.
- L. F. Capitán-Vallvey, N. López-Ruiz, A. Martínez-Olmos, M. M. Erenas and A. J. Palma, Anal. Chim. Acta, 2015, 899, 23–56 CrossRef PubMed.
- S. V. Ley, R. J. Ingham, M. O'Brien and D. L. Browne, Beilstein J. Org. Chem., 2013, 9, 1051–1072 CrossRef CAS PubMed.
- J. Alberto and S. Tenório, Metall. Mater., 2011, 64, 187–191 Search PubMed.
- M. Shahabi, S. Rafiee, S. S. Mohtasebi and S. Hosseinpour, Food Sci. Technol. Int., 2014, 20, 465–476 CrossRef PubMed.
- A. Iheonye, Y. Gariepy and V. Raghavan, Dry. Technol., 2020, 38, 130–146 CrossRef.
- P. Udomkun, M. Nagle, D. Argyropoulos, A. N. Wiredu, B. Mahayothee and J. Müller, J. Food Meas. Charact., 2017, 11, 2142–2150 CrossRef.
- R. Kacker, S. Maaß, J. Emmerich and H. Kramer, AIChE J., 2018, 64, 2450–2461 CrossRef CAS.
- C. T. Kucha and M. O. Ngadi, J. Food Meas. Charact., 2020, 14, 1105–1115 CrossRef.
- S. Retz, V. E. Porley, G. von Gersdorff, O. Hensel, S. Crichton and B. Sturm, Dry. Technol., 2017, 35, 2002–2014 CrossRef CAS.
- N. E. Barbri, A. Halimi and K. Rhofir, IJIREEICE, 2014, 02, 2060–2063 CrossRef.
- A. Taheri-Garavand, S. Fatahi, M. Omid and Y. Makino, Meat Sci., 2019, 156, 183–195 CrossRef PubMed.
- A. Abbaspour, M. A. Mehrgardi, A. Noori, M. A. Kamyabi, A. Khalafi-Nezhad and M. N. S. Rad, Sens. Actuators, B, 2006, 113, 857–865 CrossRef CAS.
- A. Lopez-Molinero, D. Liñan, D. Sipiera and R. Falcon, Microchem. J., 2010, 96, 380–385 CrossRef CAS.
- L. L. Zamora, P. A. López, G. M. A. Fos, R. M. Algarra, A. M. M. Romero and J. M. Calatayud, Talanta, 2011, 83, 1575–1579 CrossRef CAS PubMed.
- K. Nitinaivinij, T. Parnklang, C. Thammacharoen, S. Ekgasit and K. Wongravee, Anal. Methods, 2014, 6, 9816–9824 RSC.
- N. López-Ruiz, M. M. Erenas, I. De Orbe-Payá, L. F. Capitán-Vallvey, A. J. Palma and A. Martínez-Olmos, J. Sens., 2016, 2016, 7087013 Search PubMed.
- J. J. Liu, C. Y. Ma and X. Z. Wang, in Chinese Journal of Chemical Engineering, Chemical Industry Press, 2016, vol. 24, pp. 101–108 Search PubMed.
- L. L. Simon, Z. K. Nagy and K. Hungerbuhler, Org. Process Res. Dev., 2009, 13, 1254–1261 CrossRef CAS.
- P. Shiri, V. Lai, T. Zepel, D. Griffin, J. Reifman, S. Clark, S. Grunert, L. P. E. Yunker, S. Steiner, H. Situ, F. Yang, P. L. Prieto and J. E. Hein, iScience, 2021, 24, 102176 CrossRef CAS PubMed.
- J. Fitschen, S. Hofmann, J. Wutz, A. V. Kameke, M. Hoffmann, T. Wucherpfennig and M. Schlüter, Chem. Eng. Sci.: X, 2021, 10, 100098 CAS.
- M. A. Khalid, A. Ray, S. Cohen, M. Tassieri, D. Andriejus, D. Tseng, J. Reboud, A. Ozcan and J. M. Cooper, ACS Nano, 2019, 13, 11062–11069 CrossRef CAS PubMed.
- D. Caramelli, D. Salley, A. Henson, G. A. Camarasa, S. Sharabi, G. Keenan and L. Cronin, Nat. Commun., 2018, 9, 1–10 CrossRef CAS PubMed.
- T. R. Knutson, C. M. Knutson, A. R. Mozzetti, A. R. Campos, C. L. Haynes and R. L. Penn, J. Chem. Educ., 2015, 92, 1692–1695 CrossRef CAS.
- M. P. Luna and J. M. Aguilera, Food Biophys., 2014, 9, 61–68 CrossRef.
- V. Briones and J. M. Aguilera, Food Res. Int., 2005, 38, 87–94 CrossRef.
- M. D. Bowman, N. E. Leadbeater and T. M. Barnard, Tetrahedron Lett., 2008, 49, 195–198 CrossRef CAS.
- A Scopus search of 48,318 primary research articles, written in the English language between 1945 and 2022, focussed on Chemistry, containing mention of “red”, “yellow”, “pink”, “purple”, “orange”, or “blue” in the title, abstract, or keyword list was carried out. The word “green” was omitted on account of unavoidable conflation with “green chemistry” or “sustainable chemistry” topics. Of those 48,318 articles curated, 54 appeared in 1980, then 237, 1184, 1966, and 2522 papers appeared in 1990, 2000, 2010, and 2020, respectively.
- R. G. Kuehni, Color Res. Appl., 1990, 15, 261–265 CrossRef.
- R. Müller, E. D. Zanotto and V. M. Fokin, J. Non. Cryst. Solids, 2000, 274, 208–231 CrossRef.
- A. W. Carlson, D. A. Primka, E. D. Douma and M. A. Bowring, Dalton Trans., 2020, 49, 15213–15218 RSC.
- T. Diao, P. White, I. Guzei and S. S. Stahl, Inorg. Chem., 2012, 51, 11898–11909 CrossRef CAS PubMed.
- W. Zierkiewicz and T. Privalov, Organometallics, 2005, 24, 6019–6028 CrossRef CAS.
- C. E. Shannon, Bell Syst. Tech. J., 1948, 27, 379–423 CrossRef.
- J. Burés, Angew. Chem., Int. Ed., 2016, 55, 16084–16087 CrossRef PubMed.
- H. Barrington, A. Dickinson, J. Mcguire, C. Yan and M. Reid, Org. Process Res. Dev., 2022, 26, 3073–3088 CrossRef CAS PubMed.
Footnote |
| † Electronic supplementary information (ESI) available. See DOI: https://doi.org/10.1039/d2sc05702f |
| This journal is © The Royal Society of Chemistry 2023 |

![[thin space (1/6-em)]](https://www.rsc.org/images/entities/char_2009.gif) :
: