 Open Access Article
Creative Commons Attribution 3.0 Unported Licence
Solvent-mediated precipitating synthesis and optical properties of polyhydrido Cu13 nanoclusters with four vertex-sharing tetrahedrons†
Xinzhang
Lin
 ad,
Jie
Tang
ad,
Chenyu
Zhu
a,
Li
Wang
b,
Yang
Yang
ad,
Ren'an
Wu
ad,
Jie
Tang
ad,
Chenyu
Zhu
a,
Li
Wang
b,
Yang
Yang
ad,
Ren'an
Wu
 b,
Hongjun
Fan
 *c,
Chao
Liu
 *a and
Jiahui
Huang
 *a
*a
aDalian National Laboratory for Clean Energy, Dalian Institute of Chemical Physics, Chinese Academy of Sciences, Dalian 116023, China. E-mail: chaoliu@dicp.ac.cn; jiahuihuang@dicp.ac.cn
bLaboratory of High-Resolution Mass Spectrometry Technologies, Dalian Institute of Chemical Physics, Chinese Academy of Sciences, Dalian 116023, China
cState Key Laboratory of Molecular Reaction Dynamics, Dalian Institute of Chemical Physics, Chinese Academy of Sciences, Dalian 116023, China. E-mail: fanhj@dicp.ac.cn
dUniversity of Chinese Academy of Sciences, Beijing 100049, China
First published on 20th December 2022
Abstract
Structurally defined metal nanoclusters facilitate mechanism studies and promote functional applications. However, precisely constructing copper nanoclusters remains a long-standing challenge in nanoscience. Developing new efficient synthetic strategies for Cu nanoclusters is highly desirable. Here, we propose a solvent-mediated precipitating synthesis (SMPS) to prepare Cu13H10(SR)3(PPh3)7 nanoclusters (H–SR = 2-chloro-4-fluorobenzenethiol). The obtained Cu13 nanoclusters are high purity and high yield (39.5%, based on Cu atom), proving the superiority of the SMPS method. The Cu13 nanoclusters were comprehensively studied via a series of characterizations. Single crystal X-ray crystallography shows that the Cu13 nanoclusters contain a threefold symmetry axis and the Cu13 kernel is protected by a monolayer of ligands, including PPh3 and thiolates. Unprecedentedly, the aesthetic Cu13 kernel is composed of four vertex-sharing tetrahedrons, rather than the common icosahedral or cuboctahedral M13. The intramolecular π⋯π interactions between thiolates and PPh3 on the surface contribute to the stable configuration. Furthermore, electrospray ionization mass spectrometry (ESI-MS) and nuclear magnetic resonance (NMR) revealed the existence of ten hydrides, including four types of hydrides. Density functional theory (DFT) calculations without simplifying the ligands simulated the location of the 10 hydrides in the crystal structure. Additionally, the steady-state ultraviolet-visible absorption and fluorescence spectra of the Cu13 nanoclusters exhibit unique optical absorbance and photoluminescence. The ultrafast relaxation dynamics were also studied via transient absorption spectroscopy, and the three decay components are attributed to the relaxation pathways of internal conversion, structural relaxation and radiative relaxation. This work provides not only a novel SMPS strategy to efficiently synthesize Cu13 nanoclusters, but also a better insight into the structural characteristics and optical properties of the Cu nanoclusters.
Introduction
Copper has exerted a profound influence on human society since the Bronze Age. Atomically precise copper nanoclusters protected by organic ligands have been on the upsurge in nanoscience during the last decade.1–5 Copper-based nanomaterials play a crucial role in the applications of energy conversion,6,7 bio-imaging8 and chemical sensing,9etc. For example, copper is the dominant metal catalyst for the production of hydrocarbons through the electrochemical reduction of CO2.10,11 Additionally, metal nanoclusters exhibit a discrete electronic structure originating from quantum size effects and provide a novel opportunity for engineering their abundant molecular-like properties.12–14 The well-defined atomic composition and precise crystal structure of nanoclusters are beneficial for exploring their formation mechanism and catalytic mechanism and constructing structure–property relationships at the atomic level.15,16 Therefore, the controllable synthesis and structure determination of copper nanoclusters are of critical importance in nanotechnology. Over the decades, tremendous progress has been achieved in organic-ligand-protected Au and Ag nanoclusters, such as Au25,17–19 Au40,20–22 Au60,23,24 Au92,25,26 Au110,27 Au279,28 Ag25,29 Ag78,14,30 Ag141,31 Ag374,32etc. In contrast, the number of Cu nanoclusters is extremely limited owing to the high susceptibility towards oxidation of Cu. A handful of ligand-protected Cu nanoclusters have been synthesized and structurally characterized, such as Cu11,33,34 Cu13,35–38 Cu15,4 Cu18,39,40 Cu20,41–43 Cu23,5,44,45 Cu25,40,46,47 Cu28,48 Cu32,49,50 Cu36,1 Cu53,51,52 Cu61,53 Cu81,54etc. Nevertheless, compared with Au and Ag nanoclusters, the library of Cu nanoclusters requires further enrichment and expansion. However, the efficient synthesis of Cu nanoclusters still remains challenging.The synthetic methods for Cu nanoclusters have generally followed those of Au and Ag nanoclusters. The Brust–Schiffrin method,55 a general strategy for Au nanoclusters, is also appropriate to synthesize Cu nanoclusters. Chen et al. prepared mixed-size Cun (n ≤ 8) nanoclusters using this method.56 Moreover, Sun et al. utilized the gradient reduction strategy with Cu powder and Ph2SiH2 as reductants, respectively, to obtain Cu23 nanoclusters.5 Zheng et al. designed a diamine-assisted synthetic strategy to construct Cu32 nanoclusters in an inert atmosphere.50 Bakr et al. presented a one-pot direct reduction strategy to synthesize Cu81 nanoclusters.54 Additionally, some other synthetic approaches for Cu nanoclusters have also been reported, including a water-in-oil microemulsion strategy, electrochemical synthesis, microwave-assisted polyol synthesis, etc.57,58 Although researchers have tried their best to develop the synthesis of Cu nanoclusters, effective synthetic strategies to obtain more Cu nanoclusters are still lacking. In addition, difficult separation, low yields and complicated procedures are limitations in the synthetic process. Therefore, designing and developing novel synthetic strategies to efficiently boost the purity and yield of Cu nanoclusters is of great importance and significance.
Herein, we develop a solvent-mediated precipitating synthesis (SMPS) to prepare a polyhydrido Cu nanocluster formulated as Cu13H10(SR)3(PPh3)7 (Cu13 for short). The SMPS is an efficient strategy to synthesize high-purity Cu13 nanoclusters in high yield. X-ray crystallographic analysis revealed that Cu13 nanoclusters have a threefold symmetry axis and comprise a Cu13 kernel with three types of exterior ligands. The Cu13 kernel consists of four vertex-sharing tetrahedrons, making it quite different from the common icosahedral or cuboctahedral M13 kernels. The intramolecular π⋯π interactions between thiolates and PPh3 are favorable to the configurational stability. ESI-MS and NMR analysis confirmed the molecular composition of the Cu13 nanoclusters including the number and type of hydrides. DFT was carried out to simulate the UV-vis absorption, electronic structure and location of the 10 hydrides for the nanocluster. Of note, to obtain accurate results, DFT calculations were performed using the entire structure of the Cu13 nanoclusters, without the conventional substitution of H–SCH3 for H–SR. Furthermore, the UV-vis absorption spectrum of the Cu13 nanoclusters exhibits multiple broad absorption peaks, while the emission spectrum exhibits three obvious peaks at 408, 434 and 458 nm, respectively. The transient absorption spectra revealed the ultrafast excited-state dynamics of the Cu13 nanoclusters with three relaxation pathways.
Experimental section
Chemicals and materials
All the following reagents were purchased and used as received without further purification. Cuprous bromide (CuBr, 99%), sodium borohydride (NaBH4, 98%), methanol (CH3OH, analytical grade), toluene (C7H8, analytical grade) and n-hexane (C6H14, chromatographic grade) were purchased from Sinopharm Chemical Reagent Co. Ltd. Acetonitrile (CH3CN, analytical grade) and dichloromethane (CH2Cl2, analytical grade) were purchased from Kermel. 2-Chloro-4-fluorobenzenethiol (C6H4ClFS, 97%) and triphenylphosphine (PPh3, 99%) were purchased from Alfa Aesar. All glassware was cleaned with aqua regia (v(HCl)/v(HNO3) = 3![[thin space (1/6-em)]](https://www.rsc.org/images/entities/char_2009.gif) :
:![[thin space (1/6-em)]](https://www.rsc.org/images/entities/char_2009.gif) 1), rinsed with ultrapure water, and then dried in an oven prior to use.
1), rinsed with ultrapure water, and then dried in an oven prior to use.
Synthesis of Cu13H10(SR)3(PPh3)7 nanoclusters
The Cu13 nanoclusters were prepared via a one-pot synthesis. 20 mg CuBr was dissolved in 10 mL CH3CN in a round-bottom flask. The solution was stirred vigorously using a magnetic stirrer at room temperature. After about five minutes, 5 mL CH3OH and 5 mL CH2Cl2 were added to the above solution. Subsequently, 37 mg PPh3 was added. Then, 17 μL of 2-chloro-4-fluorobenzenethiol was added. After about 20 minutes, 100 mg NaBH4 was added directly to the solution. About 10 minutes later, an orange-red precipitate was observed in the solution. After about 1 h, the precipitate was the crude product, and impurities in the supernatant were removed after centrifugation. Finally, the precipitate was dissolved in CH2Cl2 to extract the pure product. Of note, the product can also be prepared using CuCl or CuCl2·2H2O to replace CuBr, but the yield is lower than using CuBr.Synthesis of Cu13D10(SR)3(PPh3)7 nanoclusters
The deuterated Cu13 nanoclusters were prepared using the same procedure as the Cu13H10(SR)3(PPh3)7 nanoclusters via replacing NaBH4 with NaBD4.Single-crystal X-ray crystallography
Red block crystals of the Cu13 nanoclusters were grown in a mixture of CH2Cl2 and hexane in a 4 °C refrigerator. The X-ray crystallographic data of the Cu13 nanoclusters was collected using a single crystal X-ray diffractometer (Bruker D8 VENTURE) using Cu Kα radiation (λ = 1.54178 Å) at Shanghai Jiao Tong University. The structure was solved by direct methods and refined with full-matrix least squares on F2 using the SHELXTL software package and Olex2. All non-hydrogen atoms were refined anisotropically.59–61 CCDC deposition number: 2170868.Other physical measurements
The UV-vis spectra of Cu13 nanoclusters dissolved in CH2Cl2 were collected using a SHIMADZU UV-1800 spectrophotometer. The fluorescence spectra of the Cu13 nanoclusters were obtained using an Agilent Technologies Cary Eclipse Fluorescence Spectrophotometer. The electrospray ionization mass spectrum (ESI-MS) of the nanoclusters dissolved in a mixture of toluene and methanol (v/v = 1/1) was collected using a Fourier Transform Ion Cyclotron Resonance Mass Spectrometer (SolariX XR-15T). Digital photos of the solution and crystals of the Cu13 nanoclusters were shot using an MI 8 AI dual camera. XPS was conducted using a Thermo Fisher ESCALAB 250xi. 1H NMR and 2H NMR spectroscopy were carried out using a Bruker AVANCE 400 MHz and AVANCE III HD 700 MHz, respectively.Computational method
Density function theory calculations (DFT) were performed with the Gaussian 16 program package.62 The structural optimizations were carried out with the wb97xd functional63 and def2-SVP basis set.64 NMR shielding tensors were computed using the Gauge-Independent Atomic Orbital (GIAO) method on the optimized geometries, and the chemical shifts were calculated using tetramethylsilane as the reference.65 The electronic excitations were calculated using the time-dependent DFT method on the optimized geometries, and the UV-vis spectrum was simulated using a Gaussian broadening function with a full width at half maximum of 0.66667 eV.66Results and discussion
Synthesis and crystallization
The Cu13H10(SR)3(PPh3)7 nanoclusters were obtained via a solvent-mediated precipitating synthesis. First, CuBr was dissolved in CH3CN, followed by the addition of CH3OH and CH2Cl2 in the proper order. Next, PPh3 and 2-chloro-4-fluorobenzenethiol were added successively. Finally, NaBH4 was added directly to the above solution to reduce the Cu–ligand complexes. About 10 minutes later, an orange-red precipitate appeared in the solution (Fig. S1a†). After centrifugation, the supernate containing the excess or unreacted reagents was removed, and the precipitate was the target product. The yield of the product was high (39.5% based on Cu atom). It is worth mentioning that the prepared product was of high purity without further washing, proving the superiority of the SMPS strategy. Choosing different types of solvent is beneficial to the interfacial reaction and precipitation of the Cu nanoclusters. This method might represent a strategy to synthesize less-stable metal nanoclusters via modulating the reaction solvents, in which the metal nanoclusters have different solubilities. Red block crystals of the Cu13 nanoclusters (Fig. S1b–d†) were grown in a mixture of CH2Cl2 and hexane in a 4 °C refrigerator for 1–2 days (for details, see Experimental section). Using NaBD4 to replace NaBH4, the deuterated analogue (Cu13D10(SR)3(PPh3)7, Cu13D for short) was synthesized following the same procedure.Crystal structure
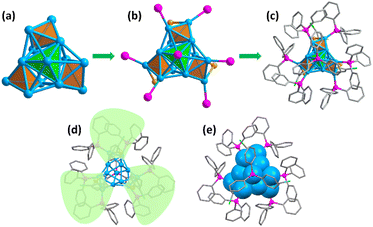
The crystal structure of the Cu13 nanoclusters was determined using single crystal X-ray crystallography. The Cu13 nanoclusters crystallized in the trigonal crystal system with the R![[3 with combining macron]](https://www.rsc.org/images/entities/char_0033_0304.gif) space group, and twelve Cu13 nanoclusters are packed in a unit cell (Table S1 and Fig. S2†). Fig. 1 shows the total crystal structure of the Cu13 nanoclusters with a threefold symmetry (C3) axis. Four tetrahedrons constitute the aesthetic Cu13 kernel via sharing three vertices, which is different from the common M13 icosahedron or cuboctahedron structures (Fig. 1a). The tetrahedron at the top marked in green occupies the C3 axis, and the three tetrahedrons in the bottom marked in orange are distributed symmetrically along the C3 axis. The Cu13 metal kernel is encapsulated by 7 PPh3 and 3 thiolates, and the total structure looks like a tri-blade fan (Fig. 1b–e), which is similar to that of Cu15 nanoclusters.4
space group, and twelve Cu13 nanoclusters are packed in a unit cell (Table S1 and Fig. S2†). Fig. 1 shows the total crystal structure of the Cu13 nanoclusters with a threefold symmetry (C3) axis. Four tetrahedrons constitute the aesthetic Cu13 kernel via sharing three vertices, which is different from the common M13 icosahedron or cuboctahedron structures (Fig. 1a). The tetrahedron at the top marked in green occupies the C3 axis, and the three tetrahedrons in the bottom marked in orange are distributed symmetrically along the C3 axis. The Cu13 metal kernel is encapsulated by 7 PPh3 and 3 thiolates, and the total structure looks like a tri-blade fan (Fig. 1b–e), which is similar to that of Cu15 nanoclusters.4
Further structural investigation revealed that the Cu13 kernel could be divided into two layers (Fig. 2a and b). The first layer containing 7 Cu atoms looks like a hat from the front view, and is made up of four quadrilaterals from the top view (Fig. 2c and d). The second layer containing 6 Cu atoms is a propeller-like structural unit, which is a Cu3 triangle connected to three single Cu atoms from the top view (Fig. 2e and f). The average Cu–Cu length of the Cu13 nanoclusters is 2.57 Å with a range from 2.415 Å to 2.792 Å (Tables S2 and S3†), which is close to the Cu–Cu length of bulk Cu and lower than that of other reported Cu nanoclusters (Table S4†), indicating stronger Cu–Cu interactions.
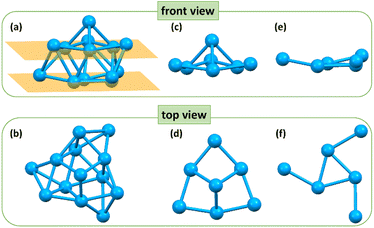 | ||
| Fig. 2 The front view and top view of (a and b) the skeleton structure, (c and d) first layer and (e and f) second layer of the Cu13H10(SR)3(PPh3)7 nanoclusters. Color code: blue, Cu. | ||
With regard to the exterior protective monolayer of Cu13 nanoclusters, each of the seven PPh3 is directly connected to one Cu atom via a single Cu–P bond. One PPh3 is located on the C3 symmetry axis, and the other six PPh3, along with the three thiolates, are arranged symmetrically around the C3 axis (Fig. S3†). Each thiolate bonds with two Cu atoms in a low-coordinated μ2-η1, η1 bridging mode (Fig. S4†). The Cu–P and Cu–S bond length ranges are 2.229–2.240 Å (average: 2.237 Å) and 2.262–2.285 Å (average: 2.274 Å), respectively. The three Cu–S–Cu angles are 69.8° (Table S3†). It is worth mentioning that the weak inter-ligand interactions in the metal nanoclusters are important for the atomic construction of the surface structure and the unit cell packing arrangement. In the Cu13 nanoclusters, the intramolecular π⋯π interactions with a short distance (3.686 Å) exist between the benzene rings of the thiolates and PPh3 on the surface, resulting in the stable configuration (Fig. 3).
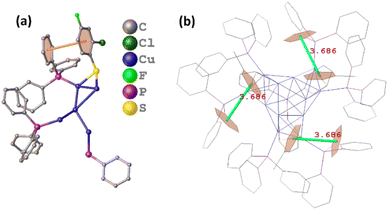 | ||
| Fig. 3 The π⋯π interactions between thiolates and PPh3 on the surface of the Cu13H10(SR)3(PPh3)7 nanoclusters shown in the asymmetric unit (a) and total structure (b). | ||
Molecular formula and chemical state
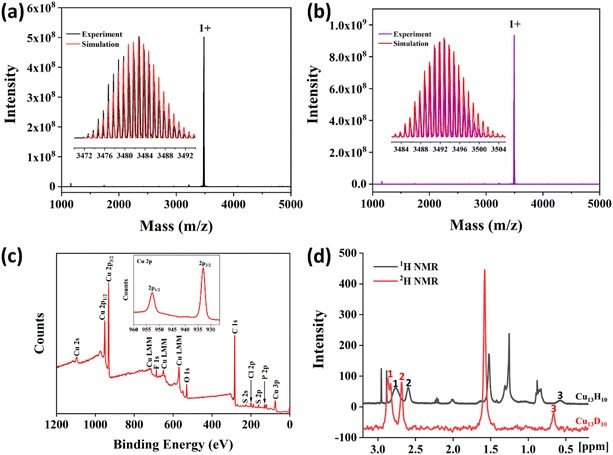
To further identify the molecular formula, electrospray ionization mass spectroscopy (ESI-MS) of the Cu13 nanoclusters in positive mode was carried out using a Fourier transform ion cyclotron resonance mass spectrometer. As shown in Fig. 4a, a dominant peak with one positive charge was observed at m/z = 3482.7 in the mass spectrum. The inset spectra showed that the experimental value was highly consistent with the simulated isotopic distribution, corresponding to the formula [Cu13H10(SR)3(PPh3)7 + Cu+ + PPh3]+. To confirm the number of hydrogen atoms, the deuterated analogue was prepared using NaBD4 as the reducing agent. The ESI-MS of the deuterated analogue shows a prominent peak at m/z = 3492.7, which was attributed to the formula [Cu13D10(SR)3(PPh3)7 + Cu+ + PPh3]+, thus indicating the existence of 10 hydride ligands in the Cu13 nanoclusters (Fig. 4b).X-ray photoelectron spectroscopy (XPS) was carried out to investigate the elemental composition and chemical states of Cu13 nanoclusters. XPS spectra confirmed the presence of the expected elements Cu, S, P, F, Cl, and C (Fig. 4c). The inset exhibits the binding energy for Cu 2p1/2 at 952.7 eV and Cu 2p3/2 at 932.9 eV in the Cu13 nanoclusters. However, it is difficult to identify the chemical state of Cu owing to the same Cu 2p3/2 binding energy (932.6 eV) being observed for both Cu0 and Cu+ (Cu2S) species.4 The three Cu LMM peaks can be observed in the XPS, and the smallest binding energy is 570.0 eV, which is same as that of Cu2O. The Cu LMM binding energy of Cu0 is 568.0 eV.67 Additionally, no satellite signal for Cu 2p3/2 from Cu(II) was observed at approximately 943 eV in the XPS spectra of Cu13 nanoclusters. Therefore, the chemical state of Cu in the Cu13 nanoclusters is close to that of Cu(I), which is consistent with that of other Cu nanoclusters.4,54
Nuclear magnetic resonance (NMR) was performed to identify the chemical shifts of the hydrides in the Cu13 nanoclusters. In the 1H NMR spectra, Cu13 and Cu13D nanoclusters exhibit similar peaks (Fig. S5†). The peaks at 8–6.4 ppm correspond to protons in the thiolates and PPh3 phenyl groups. The broadening of peaks between 8 and 6.4 ppm is ascribed to the differences in the environments of the ligands (Fig. S5†). Moreover, the Cu13 nanoclusters show three additional peaks centered at 2.76, 2.60 and 0.57 ppm in the 1H NMR spectrum, compared with the Cu13D nanoclusters (Fig. S5† and 4d). The ratio of the areas of the three peaks at 2.76, 2.60 and 0.57 ppm is 6![[thin space (1/6-em)]](https://www.rsc.org/images/entities/char_2009.gif) :
:![[thin space (1/6-em)]](https://www.rsc.org/images/entities/char_2009.gif) 3
3![[thin space (1/6-em)]](https://www.rsc.org/images/entities/char_2009.gif) :
:![[thin space (1/6-em)]](https://www.rsc.org/images/entities/char_2009.gif) 1. Notably, the peak at 2.76 ppm is wide, probably because of the overlap of two peaks. To further determine the type and ratio of the hydrides, the 2H NMR of Cu13 and Cu13D were measured. In the 2H NMR spectra, both the Cu13 and Cu13D nanoclusters exhibit peaks at 7.26 and 1.57 ppm, corresponding to CDCl3 and D2O, respectively (Fig. S6†). However, the Cu13D nanoclusters show four more peaks than the Cu13 nanoclusters; these peaks are centered at 2.86, 2.83, 2.68 and 0.66 ppm and correspond to the hydrides (Fig. S6† and 4d). The ratio of the areas of the four peaks at 2.86, 2.83, 2.68 and 0.66 ppm is 3
1. Notably, the peak at 2.76 ppm is wide, probably because of the overlap of two peaks. To further determine the type and ratio of the hydrides, the 2H NMR of Cu13 and Cu13D were measured. In the 2H NMR spectra, both the Cu13 and Cu13D nanoclusters exhibit peaks at 7.26 and 1.57 ppm, corresponding to CDCl3 and D2O, respectively (Fig. S6†). However, the Cu13D nanoclusters show four more peaks than the Cu13 nanoclusters; these peaks are centered at 2.86, 2.83, 2.68 and 0.66 ppm and correspond to the hydrides (Fig. S6† and 4d). The ratio of the areas of the four peaks at 2.86, 2.83, 2.68 and 0.66 ppm is 3![[thin space (1/6-em)]](https://www.rsc.org/images/entities/char_2009.gif) :
:![[thin space (1/6-em)]](https://www.rsc.org/images/entities/char_2009.gif) 3
3![[thin space (1/6-em)]](https://www.rsc.org/images/entities/char_2009.gif) :
:![[thin space (1/6-em)]](https://www.rsc.org/images/entities/char_2009.gif) 3
3![[thin space (1/6-em)]](https://www.rsc.org/images/entities/char_2009.gif) :
:![[thin space (1/6-em)]](https://www.rsc.org/images/entities/char_2009.gif) 1. The two peaks at 2.86 and 2.83 ppm in the 2H NMR spectrum are so close that they obviously overlap. Accordingly, it can be inferred that the wide peak at 2.76 ppm in the 1H NMR spectrum is also due to the overlap of two peaks, considering the area and position of the peak (Table S5†). Therefore, combined with the ESI-MS results, the NMR data further demonstrates that it is reasonable that the Cu13 nanoclusters contain 10 hydrides, including four types of hydrides.
1. The two peaks at 2.86 and 2.83 ppm in the 2H NMR spectrum are so close that they obviously overlap. Accordingly, it can be inferred that the wide peak at 2.76 ppm in the 1H NMR spectrum is also due to the overlap of two peaks, considering the area and position of the peak (Table S5†). Therefore, combined with the ESI-MS results, the NMR data further demonstrates that it is reasonable that the Cu13 nanoclusters contain 10 hydrides, including four types of hydrides.
Modeling the hydride positions
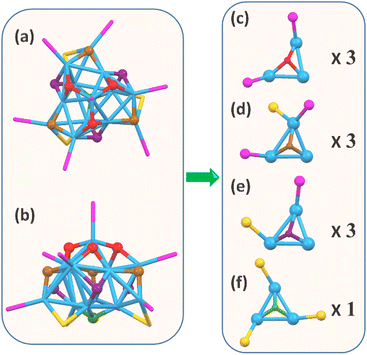
To determine the hydride positions in the Cu13 nanoclusters, DFT calculations were carried out to optimize the geometric structure of the Cu13 nanoclusters. Instead of the widely used simplified model in which the H–SR ligands in the thiolates are replaced by HS-CH3 to save computational resources, the full model with the entire Cu13 structure was used in this work to reproduce the effects of the ligands. This is especially important for our Cu13H10(SR)3(PPh3)7 nanoclusters, since intramolecular π⋯π interactions exist between the benzene rings of the thiolate and PPh3 ligands on the surface. The optimizations were based on the X-ray crystal structure (Fig. S7†), and the adopted strategy is similar to that in a previous report.54 First, only the hydrides were relaxed, and then both the hydrides and Cu were fully relaxed. Initial structures with μ1, μ2 and μ3 hydrides were tried, and all of them optimized to the same structure (Table S7†). The optimized structure of the Cu13 nanoclusters is in accordance with the crystallographic structure (Fig. S8†). The simulated hydride sites in the optimized structure of the Cu13 nanoclusters are shown in Fig. 5a and b. Each of the 10 hydrides was connected to three Cu atoms in a μ3 mode, and the hydrides could be categorized into four groups according to the triangular Cu3 coordination environment. The number of hydrides located at the top, middle and bottom is 3, (3 + 3) and 1, respectively. First, the three hydrides marked in red at the top are bound to a Cu3 triangle coordinated with two PPh3 (Fig. 5c). Second, the three hydrides marked in brown at the middle are connected to Cu3 triangles with one thiolate and two PPh3 (Fig. 5d). Third, the three hydrides marked in purple at the middle are connected to a Cu3 triangle with one thiolate and one PPh3 (Fig. 5e). Fourth, the only hydride marked in green at the bottom is linked to a Cu3 triangle with three thiolates (Fig. 5f). Of note, the two types of hydrides located at the middle have similar coordination environments, so they show nearly the same chemical shifts and their peaks overlap in the NMR spectra. The types and number of hydrides from the optimized structure are in good agreement with the NMR results.Optical properties
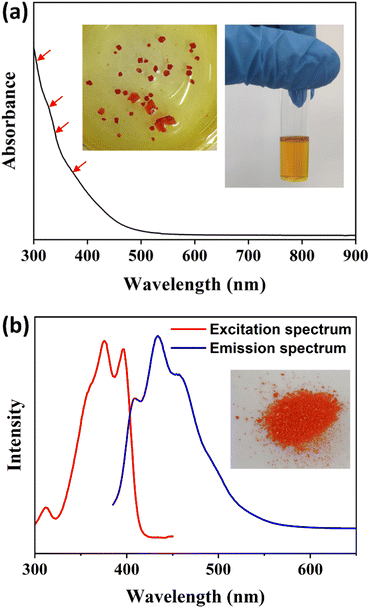
The steady-state UV-vis absorption spectrum of the Cu13 nanoclusters exhibits four weak broad peaks at 305, 325, 340 and 360 nm (Fig. 6a). The absorption peaks are not entirely obvious, which is a common phenomenon in Cu nanoclusters.4,33,54,68 The UV-vis absorption spectrum was calculated using the time-dependent DFT method based on the entire structure of the Cu13 nanoclusters, and a decay curve can be observed (Fig. S9†). Actually, several absorption peaks at 300.9, 304.4, 311.8, 326.3, 328.2, 340.5, 342.4, 356.0 and 364.1 nm were predicted according to the oscillator strength (Fig. S9†). In summary, the calculated absorption peaks mainly lie in four approximate bands: 300–304 nm, 326–328 nm, 340–342 nm and 356–364 nm, which is in good agreement with the experimental spectrum. The Kohn–Sham molecular orbitals of the Cu13 nanoclusters are shown in Fig. S10.† The highest occupied molecular orbital (HOMO) and the lowest unoccupied molecular orbital (LUMO) are mainly composed of Cu and S atoms. Based on the maximum contribution to the absorption, the absorption peaks at 311.8, 328.2, 356.0 and 364.1 nm are attributed to the transition from Cu (3d) to Cu (4p). The other peaks arise from the transition between Cu (3d) and ligand π* (Table S6†).The photoluminescence properties of the Cu13 nanoclusters were studied via fluorescence spectroscopy. As shown in Fig. 6b, the excitation spectrum shows three apparent peaks at 312, 375 and 396 nm with a shoulder at approximately 360 nm. Under excitation at 375 nm, the unique emission spectrum exhibits three obvious peaks at 408, 434 and 458 nm, respectively. Furthermore, we carried out fluorescence spectroscopy for the Cu13 nanoclusters at low temperatures (Fig. S11†). As the temperature decreases, the intensity of the photoluminescence increases. The blue emission of the Cu13 nanoclusters is remarkable, and will probably have promising applications such as cell labelling.69–71 The photoluminescence might originate from the LMCT (ligand-to-metal charge transfer) process. The fluorescence is attributed to the electronic transition from the LUMO to the HOMO, and is mainly caused by charge transfer between the surface ligands with electron-donating capability and the Cu atoms with electron-withdrawing capability in the kernel.72,73
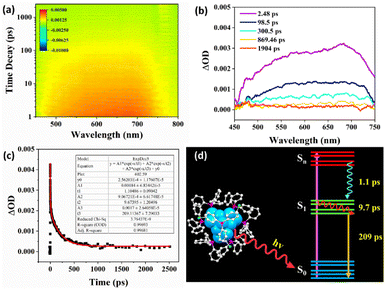
Exploring the excited-state dynamics of metal nanoclusters is essential to promote their practical applications. Femtosecond transient absorption spectroscopy was employed to study the excited-state properties of the Cu13 nanoclusters. The data map of the transient absorption spectrum as a function of the time delay after a 360 nm pump pulse is shown in Fig. 7a. It displays broad excited-state absorption (ESA) peaks at approximately 580 and 680 nm. Fig. 7b shows the transient absorption at different decay times, and the transient absorption signal decays almost to zero within 869.46 ps. Global fitting with a three-exponential-decay equation was applied to fit the time profile to analyze the ultrafast relaxation dynamics (Fig. 7c). To acquire good fitting quality, fitting the population dynamics of the transient absorption required three decay components: 1.1, 9.7, and 209 ps, respectively. This is similar to other metal nanoclusters.68,74Fig. 7d exhibits a schematic illustration of the proposed relaxation dynamics of the Cu13 nanoclusters. The ultrafast 1.1 ps component should be ascribed to the internal conversion from the Sn to the S1 state. The 9.7 ps component can be attributed to the structural relaxation of vibrational cooling from hot S1 to S1, while the 209 ps component corresponds to the radiative relaxation from S1 to the ground state S0 (Fig. 7d). Revealing the excited-state relaxation dynamics of Cu13 nanoclusters is favorable for its applications in energy conversion and photoelectric applications.
Conclusions
In summary, a novel synthetic strategy named solvent-mediated precipitating synthesis (SMPS) was developed to prepare high-purity Cu13H10(SR)3(PPh3)7 nanoclusters with high yield. The Cu13 nanoclusters comprise a Cu13 kernel and a monolayer of ligands including hydride, thiolate and PPh3. The aesthetic Cu13 kernel consists of four rare vertex-sharing tetrahedrons, and the ligands are arranged symmetrically around the C3 symmetry axis. The intramolecular π⋯π interactions between thiolates and PPh3 on the surface are conducive to the stable configuration. The number, type and location of the 10 hydrides were revealed comprehensively. Furthermore, the Cu13 nanoclusters exhibit unique optical absorbance and photoluminescence. The transient absorption spectra revealed the ultrafast relaxation dynamics behaviors of internal conversion, structural relaxation and radiative relaxation of the Cu13 nanoclusters. This work provides an efficient strategy to synthesize a novel Cu nanocluster.Data availability
We have provided the experimental and computational data in the ESI.†Author contributions
X. L. conceived the project, designed the synthesis, and analyzed data. J. T., C. Z. and Y. Y. performed the measurements. L. W. and R. W. tested the ESI-MS. F. H. finished the DFT calculations. C. L. and J. H. conceived the project and provided the guidance. The manuscript was written through contributions of all authors. All authors have given approval to the final version of the manuscript.Conflicts of interest
There are no conflicts to declare.Acknowledgements
We express our appreciation to Dr Qi Zhang and Prof. Kaijun Yuan for assistance in the collection of transient absorption spectra. We acknowledge financial support by Projects of International Cooperation and Exchanges NSFC (Fund No. 21961142006) and the Natural Science Foundation of China (No. 92061114).Notes and references
- C. Dong, R. W. Huang, C. Chen, J. Chen, S. Nematulloev, X. Guo, A. Ghosh, B. Alamer, M. N. Hedhili, T. T. Isimjan, Y. Han, O. F. Mohammed and O. M. Bakr, J. Am. Chem. Soc., 2021, 143, 11026–11035 CrossRef CAS PubMed.
- S. Lee, M. S. Bootharaju, G. Deng, S. Malola, H. Hakkinen, N. Zheng and T. Hyeon, J. Am. Chem. Soc., 2021, 143, 12100–12107 CrossRef CAS PubMed.
- L. L. M. Zhang, G. D. Zhou, G. Q. Zhou, H. K. Lee, N. Zhao, O. V. Prezhdo and T. C. W. Mak, Chem. Sci., 2019, 10, 10122–10128 RSC.
- S. Nematulloev, R. W. Huang, J. Yin, A. Shkurenko, C. Dong, A. Ghosh, B. Alamer, R. Naphade, M. N. Hedhili, P. Maity, M. Eddaoudi, O. F. Mohammed and O. M. Bakr, Small, 2021, 17, e2006839 CrossRef PubMed.
- B.-L. Han, Z. Liu, L. Feng, Z. Wang, R. K. Gupta, C. M. Aikens, C. H. Tung and D. Sun, J. Am. Chem. Soc., 2020, 142, 5834–5841 CrossRef CAS PubMed.
- J. C. Li, Y. Kuang, Y. T. Meng, X. Tian, W. H. Hung, X. Zhang, A. W. Li, M. Q. Xu, W. Zhou, C. S. Ku, C. Y. Chiang, G. Z. Zhu, J. Y. Guo, X. M. Sun and H. J. Dai, J. Am. Chem. Soc., 2020, 142, 7276–7282 CrossRef CAS PubMed.
- Y. H. Wang, A. Xu, Z. Y. Wang, L. S. Huang, J. Li, F. W. Li, J. Wicks, M. C. Luo, D. H. Nam, C. S. Tan, Y. Ding, J. W. Wu, Y. W. Lum, C. T. Dinh, D. Sinton, G. F. Zheng and E. H. Sargent, J. Am. Chem. Soc., 2020, 142, 5702–5708 CrossRef CAS PubMed.
- C. A. Chen, S. C. Chen, M. J. A. Shiddiky, C. F. Chen and K. C. W. Wu, Chem. Rec., 2020, 20, 174–186 CrossRef CAS PubMed.
- F. Peng, Y. Sun, Y. Lu, W. W. Yu, M. Y. Ge, J. C. Shi, R. Cong, J. M. Hao and N. Dai, Nanomaterials, 2020, 10, 774 CrossRef CAS PubMed.
- P. P. Yang, X. L. Zhang, F. Y. Gao, Y. R. Zheng, Z. Z. Niu, X. X. Yu, R. Liu, Z. Z. Wu, S. Qin, L. P. Chi, Y. Duan, T. Ma, X. S. Zheng, J. F. Zhu, H. J. Wang, M. R. Gao and S. H. Yu, J. Am. Chem. Soc., 2020, 142, 6400–6408 CrossRef CAS PubMed.
- L. Zhang, X. X. Li, Z. L. Lang, Y. Liu, J. Liu, L. Yuan, W. Y. Lu, Y. S. Xia, L. Z. Dong, D. Q. Yuan and Y. Q. Lan, J. Am. Chem. Soc., 2021, 143, 3808–3816 CrossRef CAS PubMed.
- Q. Yao, Z. Wu, Z. Liu, Y. Lin, X. Yuan and J. Xie, Chem. Sci., 2021, 12, 99–127 RSC.
- C. Sun, B. K. Teo, C. Deng, J. Lin, G. G. Luo, C. H. Tung and D. Sun, Coord. Chem. Rev., 2021, 427, 213576 CrossRef CAS.
- W. J. Zhang, Z. Liu, K. P. Song, C. M. Aikens, S. S. Zhang, Z. Wang, C. H. Tung and D. Sun, Angew. Chem., Int. Ed., 2021, 60, 4231–4237 CrossRef CAS PubMed.
- Y. Li and R. Jin, J. Am. Chem. Soc., 2020, 142, 13627–13644 CrossRef CAS PubMed.
- Y. Zhou, L. Liao, S. Zhuang, Y. Zhao, Z. Gan, W. Gu, J. Li, H. Deng, N. Xia and Z. Wu, Angew. Chem., Int. Ed., 2021, 60, 8668–8672 CrossRef CAS PubMed.
- M. W. Heaven, A. Dass, P. S. White, K. M. Holt and R. W. Murray, J. Am. Chem. Soc., 2008, 130, 3754–3755 CrossRef CAS PubMed.
- M. Zhu, C. M. Aikens, F. J. Hollander, G. C. Schatz and R. Jin, J. Am. Chem. Soc., 2008, 130, 5883–5885 CrossRef CAS PubMed.
- Y. Cao, V. Fung, Q. Yao, T. Chen, S. Zang, D. E. Jiang and J. Xie, Nat. Commun., 2020, 11, 5498 CrossRef CAS PubMed.
- Y. Zhao, S. Zhuang, L. Liao, C. Wang, N. Xia, Z. Gan, W. Gu, J. Li, H. Deng and Z. Wu, J. Am. Chem. Soc., 2020, 142, 973–977 CrossRef CAS PubMed.
- H. F. Qian, Y. Zhu and R. C. Jin, J. Am. Chem. Soc., 2010, 132, 4583–4585 CrossRef CAS PubMed.
- C. Zeng, Y. Chen, C. Liu, K. Nobusada, N. L. Rosi and R. Jin, Sci. Adv., 2015, 1, e1500425 CrossRef PubMed.
- Z. Gan, Y. Liu, L. Wang, S. Jiang, N. Xia, Z. Yan, X. Wu, J. Zhang, W. Gu, L. He, J. Dong, X. Ma, J. Kim, Z. Wu, Y. Xu, Y. Li and Z. Wu, Nat. Commun., 2020, 11, 5572 CrossRef CAS PubMed.
- Z. B. Gan, J. S. Chen, L. W. Liao, H. W. Zhang and Z. K. Wu, J. Phys. Chem. Lett., 2018, 9, 204–208 CrossRef CAS PubMed.
- L. Liao, J. Chen, C. Wang, S. Zhuang, N. Yan, C. Yao, N. Xia, L. Li, X. Bao and Z. Wu, Chem. Commun., 2016, 52, 12036–12039 RSC.
- C. J. Zeng, C. Liu, Y. X. Chen, N. L. Rosi and R. C. Jin, J. Am. Chem. Soc., 2016, 138, 8710–8713 CrossRef CAS PubMed.
- J. Q. Wang, S. Shi, R. L. He, S. F. Yuan, G. Y. Yang, G. J. Liang and Q. M. Wang, J. Am. Chem. Soc., 2020, 142, 18086–18092 CrossRef CAS PubMed.
- N. A. Sakthivel, S. Theivendran, V. Ganeshraj, A. G. Oliver and A. Dass, J. Am. Chem. Soc., 2017, 139, 15450–15459 CrossRef CAS PubMed.
- C. P. Joshi, M. S. Bootharaju, M. J. Alhilaly and O. M. Bakr, J. Am. Chem. Soc., 2015, 137, 11578–11581 CrossRef CAS PubMed.
- H. Yang, J. Yan, Y. Wang, G. Deng, H. Su, X. Zhao, C. Xu, B. K. Teo and N. Zheng, J. Am. Chem. Soc., 2017, 139, 16113–16116 CrossRef CAS PubMed.
- L. Ren, P. Yuan, H. Su, S. Malola, S. Lin, Z. Tang, B. K. Teo, H. Hakkinen, L. Zheng and N. Zheng, J. Am. Chem. Soc., 2017, 139, 13288–13291 CrossRef CAS PubMed.
- H. Y. Yang, Y. Wang, X. Chen, X. J. Zhao, L. Gu, H. Q. Huang, J. Z. Yan, C. F. Xu, G. Li, J. C. Wu, A. J. Edwards, B. Dittrich, Z. C. Tang, D. D. Wang, L. Lehtovaara, H. Hakkinen and N. F. Zheng, Nat. Commun., 2016, 7, 12809 CrossRef CAS PubMed.
- H. Li, H. Zhai, C. Zhou, Y. Song, F. Ke, W. W. Xu and M. Zhu, J. Phys. Chem. Lett., 2020, 11, 4891–4896 CrossRef CAS PubMed.
- B. Santiago-Gonzalez, A. Monguzzi, C. Capitani, M. Prato, C. Santambrogio, F. Meinardi and S. Brovelli, Angew. Chem., Int. Ed., 2018, 57, 7051–7055 CrossRef CAS PubMed.
- K. K. Chakrahari, R. P. B. Silalahi, J. H. Liao, S. Kahlal, Y. C. Liu, J. F. Lee, M. H. Chiang, J. Y. Saillard and C. W. Liu, Chem. Sci., 2018, 9, 6785–6795 RSC.
- F. Ke, Y. B. Song, H. Li, C. J. Zhou, Y. X. Du and M. Z. Zhu, Dalton Trans., 2019, 48, 13921–13924 RSC.
- K. K. Chakrahari, J. H. Liao, S. Kahlal, Y. C. Liu, M. H. Chiang, J. Y. Saillard and C. W. Liu, Angew. Chem., Int. Ed., 2016, 55, 14704–14708 CrossRef CAS PubMed.
- P. L. Rodriguez-Kessler, M. Rojas-Poblete and A. Munoz-Castro, Phys. Chem. Chem. Phys., 2021, 23, 18035–18043 RSC.
- Z. Chen, Y. Wang, L. Liu, Z. Zhang and F. Liang, Chem. Commun., 2012, 48, 11689–11691 RSC.
- T. A. Nguyen, Z. R. Jones, B. R. Goldsmith, W. R. Buratto, G. Wu, S. L. Scott and T. W. Hayton, J. Am. Chem. Soc., 2015, 137, 13319–13324 CrossRef CAS PubMed.
- A. W. Cook, Z. R. Jones, G. Wu, S. L. Scott and T. W. Hayton, J. Am. Chem. Soc., 2018, 140, 394–400 CrossRef CAS PubMed.
- R. S. Dhayal, J. H. Liao, Y.-R. Lin, P.-K. Liao, S. Kahlal, J. Y. Saillard and C. W. Liu, J. Am. Chem. Soc., 2013, 135, 4704–4707 CrossRef CAS PubMed.
- R. S. Dhayal, J. H. Liao, X. Wang, Y. C. Liu, M. H. Chiang, S. Kahlal, J. Y. Saillard and C. W. Liu, Angew. Chem., Int. Ed., 2015, 54, 13604–13608 CrossRef CAS PubMed.
- R.-W. Huang, J. Yin, C. Dong, P. Maity, M. N. Hedhili, S. Nematulloev, B. Alamer, A. Ghosh, O. F. Mohammed and O. M. Bakr, ACS Mater. Lett., 2020, 3, 90–99 CrossRef.
- S. Maity, D. Bain, S. Chakraborty, S. Kolay and A. Patra, ACS Sustainable Chem. Eng., 2020, 8, 18335–18344 CrossRef CAS.
- F. Li and Q. Tang, J. Catal., 2020, 387, 95–101 CrossRef CAS.
- A. Chen, X. Kang, S. Jin, W. Du, S. Wang and M. Zhu, J. Phys. Chem. Lett., 2019, 10, 6124–6128 CrossRef CAS PubMed.
- A. J. Edwards, R. S. Dhayal, P. K. Liao, J. H. Liao, M. H. Chiang, R. O. Piltz, S. Kahlal, J. Y. Saillard and C. W. Liu, Angew. Chem., Int. Ed., 2014, 53, 7214–7218 CrossRef CAS PubMed.
- R. S. Dhayal, J. H. Liao, S. Kahlal, X. Wang, Y. C. Liu, M. H. Chiang, W. E. van Zyl, J. Y. Saillard and C. W. Liu, Chem.–Eur. J., 2015, 21, 8369–8374 CrossRef CAS PubMed.
- S. Lee, M. S. Bootharaju, G. Deng, S. Malola, W. Baek, H. Hakkinen, N. Zheng and T. Hyeon, J. Am. Chem. Soc., 2020, 142, 13974–13981 CrossRef CAS PubMed.
- P. Yuan, R. H. Chen, X. M. Zhang, F. J. Chen, J. Z. Yan, C. F. Sun, D. H. Ou, J. Peng, S. C. Lin, Z. C. Tang, B. K. Teo, L. S. Zheng and N. F. Zheng, Angew. Chem., Int. Ed., 2019, 58, 835–839 CrossRef CAS PubMed.
- M. Qu, F. Q. Zhang, D. H. Wang, H. Li, J. J. Hou and X. M. Zhang, Angew. Chem., Int. Ed., 2020, 59, 6507–6512 CrossRef CAS PubMed.
- A. Ghosh, R.-W. Huang, B. Alamer, E. Abou-Hamad, M. N. Hedhili, O. F. Mohammed and O. M. Bakr, ACS Mater. Lett., 2019, 1, 297–302 CrossRef CAS.
- R. W. Huang, J. Yin, C. Dong, A. Ghosh, M. J. Alhilaly, X. Dong, M. N. Hedhili, E. Abou-Hamad, B. Alamer, S. Nematulloev, Y. Han, O. F. Mohammed and O. M. Bakr, J. Am. Chem. Soc., 2020, 142, 8696–8705 CrossRef PubMed.
- M. Brust, M. Walker, D. Bethell, D. J. Schiffrin and R. Whyman, J. Chem. Soc., Chem. Commun., 1994, 801–802 RSC.
- W. Wei, Y. Lu, W. Chen and S. Chen, J. Am. Chem. Soc., 2011, 133, 2060–2063 CrossRef CAS PubMed.
- A. Baghdasaryan and T. Burgi, Nanoscale, 2021, 13, 6283–6340 RSC.
- X. Liu and D. Astruc, Coord. Chem. Rev., 2018, 359, 112–126 CrossRef CAS.
- G. M. Sheldrick, Acta Crystallogr., Sect. A: Found. Crystallogr., 2008, 64, 112–122 CrossRef CAS PubMed.
- O. V. Dolomanov, L. J. Bourhis, R. J. Gildea, J. A. K. Howard and H. Puschmann, J. Appl. Crystallogr., 2009, 42, 339–341 CrossRef CAS.
- G. M. Sheldrick, Acta Crystallogr., Sect. C: Struct. Chem., 2015, 71, 3–8 Search PubMed.
- M. J. Frisch, G. W. Trucks, H. B. Schlegel, G. E. Scuseria, M. A. Robb, J. R. Cheeseman, G. Scalmani, V. Barone, G. A. Petersson and H. Nakatsuji, et al., Gaussian 16 program package, Gaussian, Inc., Wallingford CT, 2016 Search PubMed.
- J. D. Chai and M. Head-Gordon, Phys. Chem. Chem. Phys., 2008, 10, 6615–6620 RSC.
- F. Weigend and R. Ahlrichs, Phys. Chem. Chem. Phys., 2005, 7, 3297–3305 RSC.
- K. Wolinski, J. F. Hinton and P. Pulay, J. Am. Chem. Soc., 1990, 112, 8251–8260 CrossRef CAS.
- T. Lu and F. W. Chen, J. Comput. Chem., 2012, 33, 580–592 CrossRef CAS PubMed.
- I. Platzman, R. Brener, H. Haick and R. Tannenbaum, J. Phys. Chem. C, 2008, 112, 1101–1108 CrossRef CAS.
- S. Maity, D. Bain, K. Bhattacharyya, S. Das, R. Bera, B. Jana, B. Paramanik, A. Datta and A. Patra, J. Phys. Chem. C, 2017, 122, 13354–13362 CrossRef.
- R. Ghosh, A. K. Sahoo, S. S. Ghosh, A. Paul and A. Chattopadhyay, ACS Appl. Mater. Interfaces, 2014, 6, 3822–3828 CrossRef CAS PubMed.
- Z. G. Wang, B. K. Chen and A. L. Rogach, Nanoscale Horiz., 2017, 2, 135–146 RSC.
- Y. e. Shi, J. Ma, A. Feng, Z. Wang and A. L. Rogach, Aggregate, 2021, 2, e112 Search PubMed.
- X. Kang and M. Zhu, Chem. Soc. Rev., 2019, 48, 2422–2457 RSC.
- X. Kang, S. X. Wang, Y. B. Song, S. Jin, G. D. Sun, H. Z. Yu and M. Z. Zhu, Angew. Chem., Int. Ed., 2016, 55, 3611–3614 CrossRef CAS PubMed.
- T. Higaki, C. Liu, M. Zhou, T. Y. Luo, N. L. Rosi and R. C. Jin, J. Am. Chem. Soc., 2017, 139, 9994–10001 CrossRef CAS PubMed.
Footnote |
| † Electronic supplementary information (ESI) available: Detailed crystallographic structure analysis, NMR and molecular orbits for Cu13H10(SR)3(PPh3)7 nanoclusters. CCDC 2170868. For ESI and crystallographic data in CIF or other electronic format see DOI: https://doi.org/10.1039/d2sc06099j |
| This journal is © The Royal Society of Chemistry 2023 |

