
 Open Access Article
 This Open Access Article is licensed under a Creative Commons Attribution-Non Commercial 3.0 Unported Licence
Intracellular activated logic nanomachines based on framework nucleic acids for low background detection of microRNAs in living cells†
Xiao-Qiong
Li
,
Yi-Lei
Jia
,
Yu-Wen
Zhang
,
Hong-Yuan
Chen
and
Jing-Juan
Xu
 *
*
State Key Laboratory of Analytical Chemistry for Life Science, School of Chemistry and Chemical Engineering, Nanjing University, Nanjing 210023, China. E-mail: xujj@nju.edu.cn
First published on 20th June 2023
Abstract
DNA molecular machines based on DNA logic circuits show unparalleled potential in precision medicine. However, delivering DNA nanomachines into real biological systems and ensuring that they perform functions specifically, quickly and logically remain a challenge. Here, we developed an efficient DNA molecular machine integrating transfer-sensor-computation-output functions to achieve high fidelity detection of intracellular biomolecules. The introduction of pH nanoswitches enabled the nanomachines to be activated after entering the cell, and the spatial-confinement effect of the DNA triangular prism (TP) enables the molecular machine to process complex information at the nanoscale, with higher sensitivity and shorter response time than diffuse-dominated logic circuits. Such cascaded activation molecular machines follow the logic of AND to achieve specific capture and detection of biomolecules in living cells through a multi-hierarchical response, providing a new insight into the construction of efficient DNA molecular machines.
Introduction
Molecular machines based on DNA logic circuits have shown great promise in biosensing,1 molecular imaging,2,3 drug delivery4 and data storage.5 However, there are still some challenges to be solved. First, circuit leakage in the absence of an input is an important problem to be addressed. Circuit design defects may lead to initial leakage, and generally speaking, as the complexity and diversity of molecular circuits increase, so does the risk of leakage. In addition, input signals are widely distributed inside and outside the cell, which will cause nanomachines to be activated before reaching the target site, generating false positive signals and hindering precise diagnosis of diseases. To solve this problem, researchers have developed a number of on-site activation strategies. Exogenous light is often used as a stimulating source for intracellular activation, providing an unparalleled opportunity for spatiotemporal control of DNA molecular machines.6–8 Endogenous stimuli, such as overexpressed enzymes9–11 or RNA12,13 in cells, solve the problems of phototoxicity and limited penetration depth of light, maintaining the native state of live entities and achieving on-site orthogonal activation without interfering with existing biochemical processes. However, enzyme or RNA expression levels differ in different cell lines, and using them as endogenous stimuli is not conducive to comparing the expression levels of the target in different cell lines. In order to build a more general detection platform, we are trying to eliminate the differences in activation processes in different cell lines. The probe usually enters lysosomes via endocytosis, and its inherently acidic environment provides a way to eliminate differences in activation procedures. In recent years, pH-dependent DNA nanoswitches such as I-motif,14–16 A-motif,17 intermolecular three-strand DNA18–21 and DNA tweezers22 have been widely used, which provides a reference for the construction of pH-activated nanomachines.The speed of reactions inside the DNA molecular machine is another important issue. The number of DNA molecules required varies with the complexity of the reaction network and the increase in the reaction time is not conducive to the real-time detection of the target. The challenge for DNA molecular machines is to deliver complex DNA circuits to real biological systems and ensure that they work properly and quickly in complex environments. DNA framework nucleic acids (FNAs) with high delivery efficiency and excellent biocompatibility have been widely used in the detection of biomarkers for disease diagnosis.23–26 Compared with traditional commercial transfection agents lipofectamine 3000 27 and inorganic nanomaterials,28,29 FNAs can precisely control the spatial position of the loaded cargo and flexibly adjust the stoichiometric ratio between each element.4,30,31 Meanwhile, FNAs have a spatial-confinement effect, and the components of molecular circuits can be pre-condensed in a limited space, which has great potential in the construction of fast reaction probes.32 Although these strategies can improve the speed and efficiency of the probe to identify the target, they are also more susceptible to interference from the extracellular environment. In the process of delivery, the probe will also respond quickly to an extracellular target, thus making the problem of signal leakage more serious. So it is even more important to protect this fast response probe.
Here, we constructed a logic circuit-guided cascaded activated nanomachine (TP-SFH) for sensitive detection of microRNA (miRNA) in living cells. The pH nanoswitch was combined with the core entropy driven reaction (EDR), and the DNA triangular prism (TP) was used as the carrier to realize the integration of signal input, cascade activation, molecular computation and signal output. As shown in Scheme 1a, the components of the EDR (S and FH) are assembled on the TP; the fuel strand F is partially complementary to the pH nanoswitch (H strand), so the EDR is blocked due to lack of fuel. When the nanomachine enters the acid lysosome through endocytosis, the H strand folds into a triplex structure, releasing the F and opening the nanoswitch of the logic circuit (Scheme 1b). The target is first hybridized with S3 to replace S2, and the exposed F strand is further hybridized with S3 to replace S1 and the target. As shown in Scheme 1c, nanomachines without the protection of H will present a higher background signal (output 1) during circuit assembly due to the complete exposure of fuel F. During delivery, it is easy for unprotected nanomachines to perceive extracellular miRNA, thus generating fluorescence signal 2 (output 2). After entering the cell, the intracellular miRNA is captured and the circulating circuit is catalyzed to generate the correct signal (output 3). The signal presented in the cell is finally composed of output 1, output 2, and output 3, thus reducing the reliability of the results. The cascaded activated molecular machine TP-SFH can protect the fuel F from circuit leakage in the internal circuit of the machine, and the EDR is always in an inactive state to avoid interference from the extracellular target. During the process of entering the cell, TP-SFH is activated and finally only presents output 3, which is catalyzed by intracellular miRNA, achieving precise intracellular detection (Scheme 1d). We demonstrated that compared with freely diffused systems, TP-SFH can rapidly respond to intracellular targets. Based on the powerful logic judgment and signal amplification function of TP-SFH, low background and specific detection of intracellular miRNA can be realized.
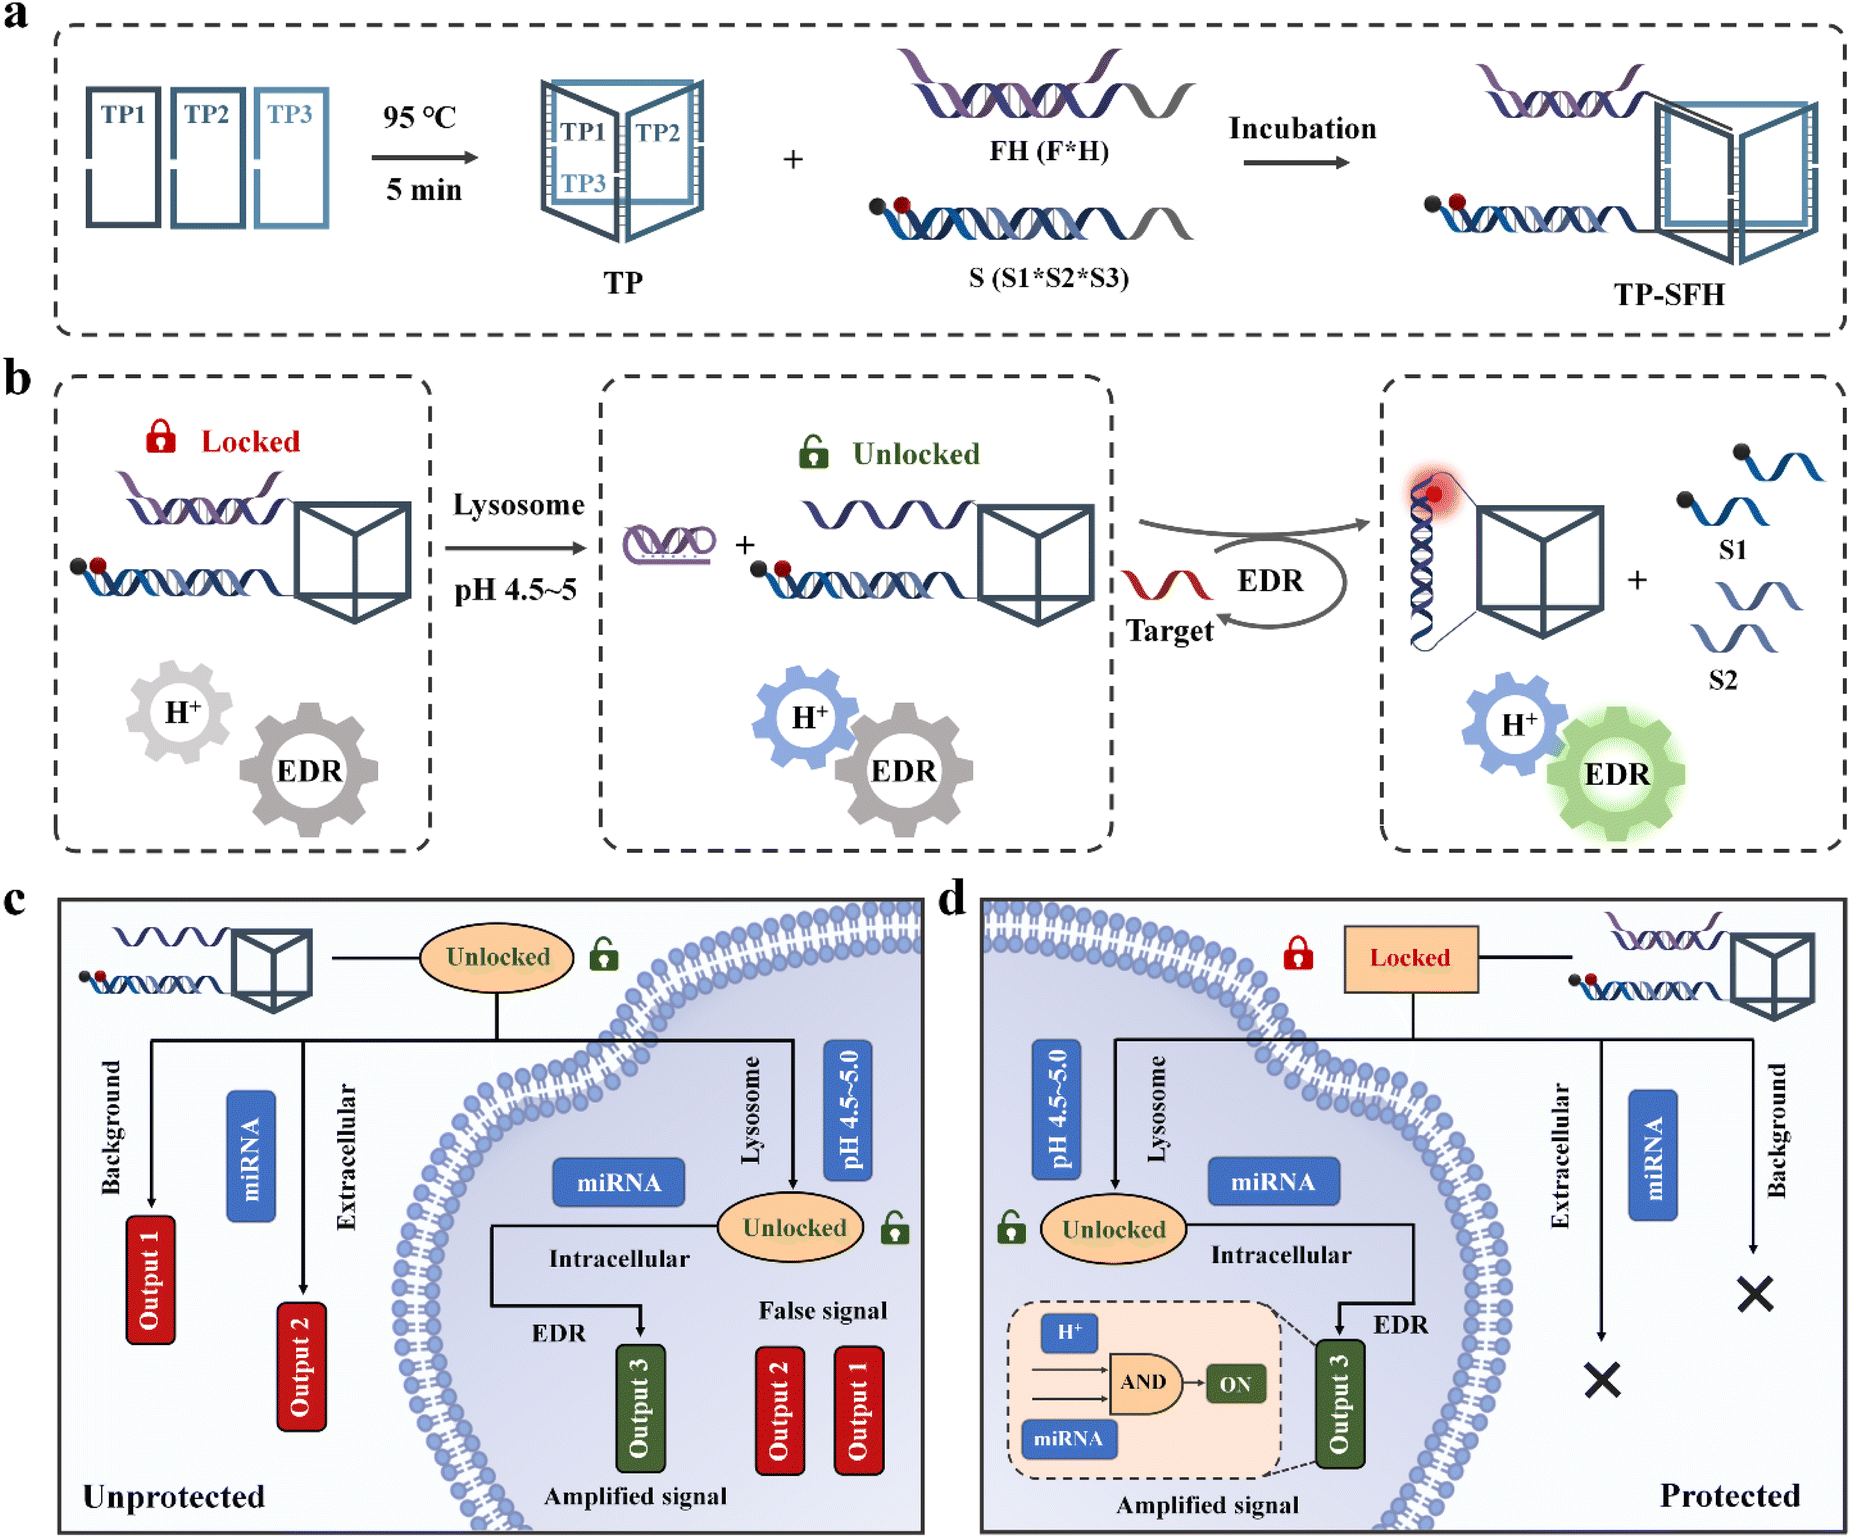 | ||
| Scheme 1 Schematic diagram of intracellular activated nanomachine TP-SFH for intracellular miRNA sensitive detection. (a) Construction of TP-SFH nanomachines. (b) The intracellular activation of TP-SFH. (c) Signal output from unprotected nanomachines during delivery. (d) Signal output generated by nanomachine TP-SFH during delivery. | ||
Results and discussion
Design and characterization of an EDR system
The core reaction of the probe TP-SFH is the EDR. Compared with the hybridization-based catalyst systems, the EDR does not require the design of special secondary structures, such as pseudoknots and hairpins. The reactions all use single-stranded DNA molecules of similar length, so the design is more flexible.33 As shown in Fig. 1a, the net EDR consists of three parts, which are substrate strand (S), fuel strand (F) and target strand (T). S is a ternary hybrid complex, which consists of S1, S2 and S3. Among them, S1 and S3 are modified with fluorescent groups or quenchers. DNA strands are subdivided into multiple functional domains, of which domain 2 and domain 4 are termed toehold domains, and domains 1 and 3 are called specificity domains. The lengths of domain 2 and domain 4 are designed to be 4 and 6 bases, respectively, which are short enough to be difficult to maintain hybridization without additional complementary bases. The length of domains 1 and 3 can be adjusted at will, but the thermal stability of the probe must be ensured. | ||
| Fig. 1 EDR verification. (a) The composition of the naked EDR system and its reaction equation. (b) Catalytic pathway of the EDR. (c) Characterization of the EDR by gel electrophoresis. Lane 1: 20 bp marker; lane 2: miR-21; lane 3: S1; lane 4: S2; lane 5: S3; lane 6: F; lane 7: S1 + S3; lane 8: S1 + S2 + S3 (S123); lane 9: S123 + F; lane 10: S123 + F + miR-21. (d) Gel electrophoresis characterization of the EDR in the presence of different concentrations of miR-21. Lane 1: 0 nM; lane 2: 50 nM; lane 3: 100 nM; lane 4: 200 nM; lane 5: 300 nM; lane 6: 500 nM. The concentrations of S and F were 1 μM. The inset is the intensity value of S1 extracted using Image-J. | ||
We selected microRNA-21 (miR-21) as the target to verify the reaction. As shown in Fig. 1b, when miR-21 exists, it first binds to the toehold domain 4* of S to obtain the intermediate M1. M1 is rearranged into the intermediate M2 through branch migration. At this time, there are only 4 bases complementary between S2 and S3, which is insufficient to maintain the binding state, so the intermediate M3 and S2 are obtained. F combines with the exposed toehold domain 2* to obtain the intermediate M4, and then M4 rearranges through branch migration to get M5 and release S1 to restore the fluorescence signal. M5 rearranges to generate waste strand W and release target strand T, which can be used as a catalyst to enter the next cycle, thus realizing signal amplification. It can be observed that the total number of base pairs and complementary regions in the reactants and products is constant, so the enthalpy change (ΔH) is approximately 0. According to the Gibbs free energy change ΔG = ΔH − TΔS, the driving force of the reaction is always TΔS, so the reaction is driven by the entropy gain of the liberated molecule. According to previous literature reports,34 we can estimate that the potential conversion rate of the system is greater than 99.99% without considering the reaction time (see the ESI† for calculation details).
The net EDR was demonstrated by gel electrophoresis, which is shown in Fig. 1c and S1.† Lanes 2–6 are miR-21, S1, S2, S3 and F, respectively. Lanes 7 and 8 are S1 + S3 and S1 + S2 + S3 (S), respectively, and lane 9 is a mixture of S and F without miR-21. In lane 10, after adding the target, the S disappears, waste W (which coincides with S1 + S3) appears, and S1 and S2 are replaced, indicating the occurrence of the EDR. In addition, by changing the concentration of miR-21, it can be seen that the bands of S gradually become shallower, and the bands of W, S1 and S2 gradually deepen. Quantization of S1 bands (modified with FAM) showed that the number of replaced S1 was indeed increasing gradually, which once again proved the successful occurrence of the EDR. We next measured the fluorescence emission spectra of the net EDR, and the excitation wavelength was selected as 470 nm. As shown in Fig. S2,† the fluorescence was effectively quenched by the complementary hybridization of S1 and S3 in the initial state. After adding F, the fluorescence intensity increased slightly and a background signal was generated. When the target strand miR-21 was added, a very strong fluorescence signal was generated, indicating that miR-21, as a catalyst, participated in the entropy-driven cycle and replaced a large amount of S1 from the S, realizing the response to miR-21.
Construction of a pH response nanoswitch
In order to achieve the specific detection of miRNA in living cells, to avoid signal leakage during delivery and to prevent background signals due to thermodynamically driven interactions between the fully exposed F and S, an endogenous activation strategy to utilize the acidic conditions of lysosomes to achieve intracellular EDR bioimaging was proposed. We constructed a DNA-based pH-triggered triplex nanoswitch containing W–C interaction and parallel Hoogsteen interaction. We can optimize the pH-response window by changing the proportion of TAT in the switching element.20 As shown in Fig. 2a, in this triplex nanoswitch, the first hairpin was obtained by the W–C hybridization of 8 bases, with a TAT ratio of 50% and the loop consists of 5 T bases. The sequence of the second loop is partly complementary to the F strand, and the sequence is adjustable. We assembled pH response sequence H and F to form FH, thus blocking the toehold domain of F completely. The EDR was blocked due to the lack of fuel, and only when the pH response strand H forms a triplex structure under acidic conditions to release the fuel strand, the EDR can recover its activity (Fig. 2b). | ||
| Fig. 2 Verification of properties of the pH nanoswitch. (a) Schematic diagram of the pH nanoswitch under acidic conditions (H strand). (b) Configuration transformation of the pH nanoswitch. (c) The change in relative fluorescence intensity caused by the conformational change of the H strand at different pH values (from 4.5 to 8.3). (d) Relative fluorescence intensities due to conformational change of FH at different pH values (from 4.5 to 8.3). (e) Intensity curves of pH nanoswitches at different pH values (from 4.5 to 8.3). | ||
First, we explored the pH responsiveness of strands H and FH. The pH-insensitive dye Alexa Fluor 488 (Fig. S3†) was conjugated at one end of the H strand, and BHQ1 was inserted into the loop of the hairpin. As shown in Fig. 2c, under acidic conditions, the H strand is more inclined to form a triplex structure, resulting in fluorescence quenching. However, at neutral pH, the H strand is more likely to form an open structure, and the fluorophore is separated from the quencher, thus increasing the fluorescence signal. As shown in Fig. 2e, the pH sensitive window of the net H strand is 6–7.8, which is basically consistent with previous literature reports.18 We also find that compared with a single H, the pH response window of FH is wider (4.8–7.2) and shifted towards the direction of lower pH (Fig. 2d). The reason for this phenomenon may be that the complementary region of F and H inhibits the change in the H configuration, and only when the pH is low enough, the duplex-to-triplex transition could occur. Changing the pH response window makes the pH nanoswitch more stable in a slightly acidic environment, which greatly reduces the possibility of signal leakage during probe delivery to tumor cells.
To optimize the pH nanoswitch, we adjusted the complementary sequences of H and F, and obtained H1, H2, H3, H4, H5 and H6 by changing the length of the complementary part and the number of the core sequences of the triplex structure (listed in Table S3†). We hybridized HX with F respectively to obtain FHX, and explored the blocking ability of HX to the EDR. As shown in Fig. S4a,† in the presence of miR-21, H3 almost completely blocked the EDR at a pH of 7.2. While when the pH was down to 5.0, a strong fluorescence signal is generated. So, we selected H3 as the pH nanoswitch of this system. Then we recorded the fluorescence intensity of the net EDR over time, and the results are shown in Fig. S4b.† It can be seen that the introduction of H maintains the strong blocking ability at physiological pH (pH 7.2). In this way, we constructed an AND logic, that is, only when pH is low enough and miR-21 exists, the probe can be activated. Such a design can not only avoid the high background signal brought by the fuel strand when the EDR module and DNA frame are assembled later, but can also lay a foundation for the realization of endogenous cascade activation in the living cells.
Probe assembly and localized-EDR
In order to deliver EDR components into cells, we used a DNA triangular prism (TP) consisting of three long DNA strands (Fig. 3 and S5†) as the carrier. First, we demonstrated the successful assembly of the probe TP-SFH by gel electrophoresis. As shown in Fig. S6a,† lanes 2–4 were TP1, TP1 + TP2 and TP1 + TP2 + TP3 (TP), respectively, and the band migration speed decreased successively, indicating the successful assembly of TP. Lanes 5–7 indicated that substrate S and fuel F as well as pH-responsive fuel FH can be assembled into TP by complementing single strands on the upper and lower bottom of the TP. New bands with low mobility appeared in lanes 8 and 9, indicating successful assembly of probe TP-SF and TP-SFH. As shown in Fig. S6c and d,† TP2 was modified by FAM, and TP and TP-SFH were assembled. Image-J was used to extract gray values of FAM. The yield of frame TP was 89.31%, and that of probe TP-SFH was 91.70%. Due to the load of S and FH, the rigidity of the frame structure is enhanced and the structure is more stable, so the yield is slightly increased. We further used DLS and AFM experiments to demonstrate the assembly process of the probe. As shown in Fig. 3a and b, after TP is assembled into TP-SFH, its size increased from 15.7 nm to 22.1 nm. A TP structure with a size of about 15 nm can be observed in Fig. S7a,† and when assembled into TP-SFH, the size increases to 23 nm (Fig. S7b†).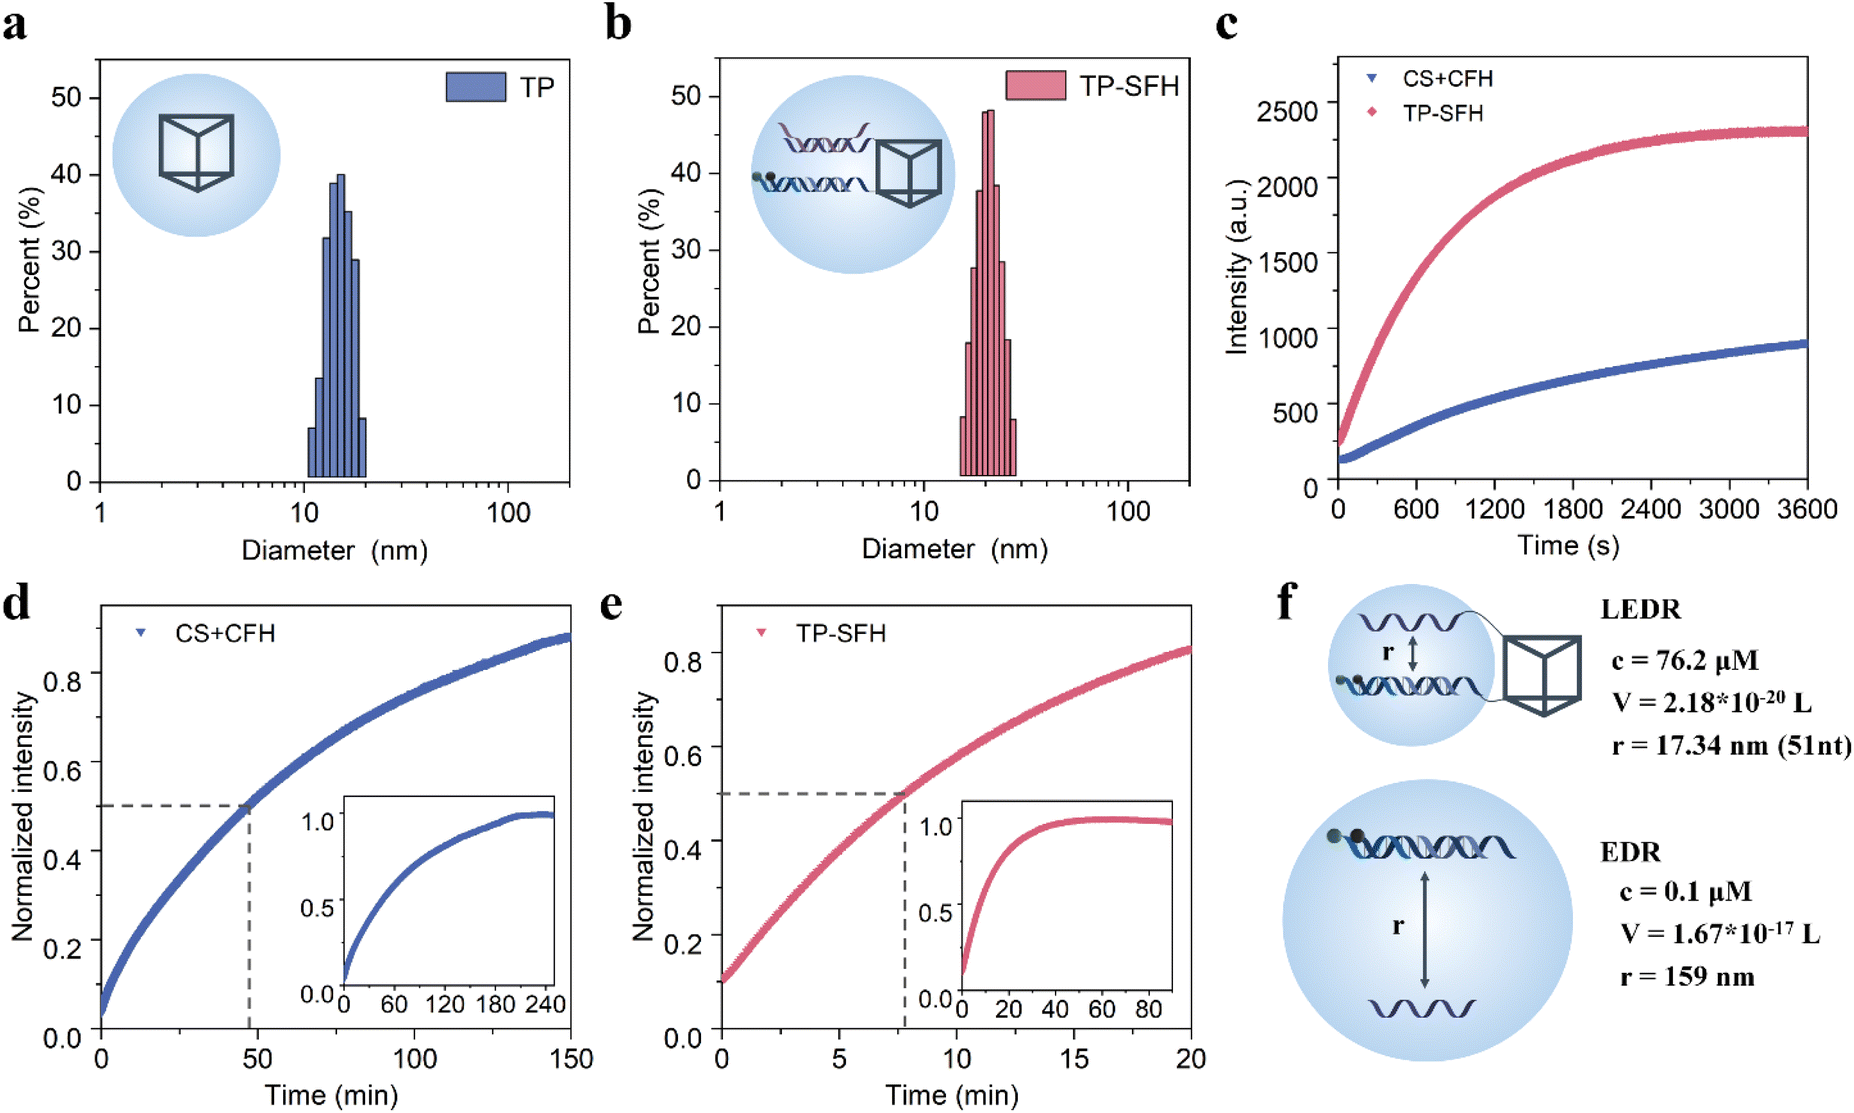 | ||
| Fig. 3 Synthesis and kinetics of TP-SFH nanomachines. (a) DLS analysis of TP. (b) DLS analysis of TP-SF. (c) Time-dependent fluorescence spectra of the EDR in free EDR probes (CS + CFH) and TP-SFH in the presence of 25 nM miRNA-21. (d) The fluorescence intensity of the free collision system changes with time until the end of the reaction. (e) The fluorescence intensity of the TP-SFH system changes with time until the reaction endpoint. Note: the dashed line indicates the time required for half of the reaction to complete. (f) The distance between the reactants S and F in the naked EDR and TP-SFH systems. V is the local spherical volume, c is the concentration of the reactants, and r is the distance between S and F. | ||
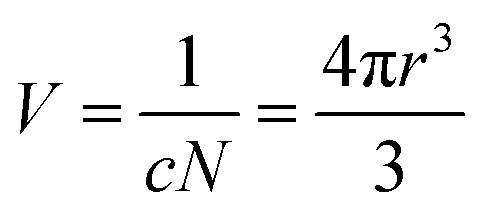
Next, we verified the effect of TP on the kinetics of the EDR. By contrast, nude S and FH without a TP skeleton were tested as the control group. Based on previous work,35 the addition of the anchor domain may affect the reaction rate when no TP is present. In order to avoid the influence of it as much as possible, we designed cS and cF to complement the anchor domain of S and F, respectively, so as to study the dynamics of a diffusion-dominated system. The probes were assembled in a PBS buffer with a pH of 7.2, and then were transferred to the PBS buffer with a pH of 5.0, and 25 nM miR-21 was added, respectively. The results are shown in Fig. 3c, and we can see that at the end of 60 min, the fluorescence intensity of the TP-SFH probe was about 2.54 times that of the naked EDR. We used half-completion time to measure the speed-up factor. As shown in Fig. 3d, it takes about 220 min for the CS + CFH system to basically reach equilibrium, and 47.33 min is the time for half of the reaction to be completed. As shown in Fig. 3e, it takes only about 50 min for the TP-SFH probe to reach the equilibrium, and the half-completion time is only 7.83 min. According to the experimental data, it can be considered that the local EDR experiences nearly 6 times the acceleration compared with the nude EDR.
The collision frequency theory36 is another plausible theory to explain this phenomenon.
 | (1) |
pH activation and fluorescence signal amplification
So far, we have built a nanomachine based on AND logic. First, the ability of intracellular activation was verified by an in vitro fluorescence experiment. As shown in Fig. 4a and b, compared with the blank group (curve i), when the pH value is 7.2 and the target miR-21 is present, the EDR circuit is inactivated due to the lack of fuel and thus cannot achieve the fluorescent readout (curve ii), indicating that the pH nanoswitch can effectively avoid the extracellular interference before the probe enters the cell. However, at pH 5.0, the fluorescence signal was enhanced even in the absence of the target (iii), which is because the fuel strand F is fully exposed at this time, and the circuit itself suffers from signal leakage. Fortunately, the environment the probe passes through during delivery is usually neutral or weakly acidic and cannot turn the pH nanoswitch on completely. Only when the pH nanoswitch is activated and the catalyst miR-21 is introduced, can the fluorescence signal of the TP-SFH system increase sharply (curve iv). This indicates that our nanomachine has a very low detection background, and is able to detect intracellular targets sensitively.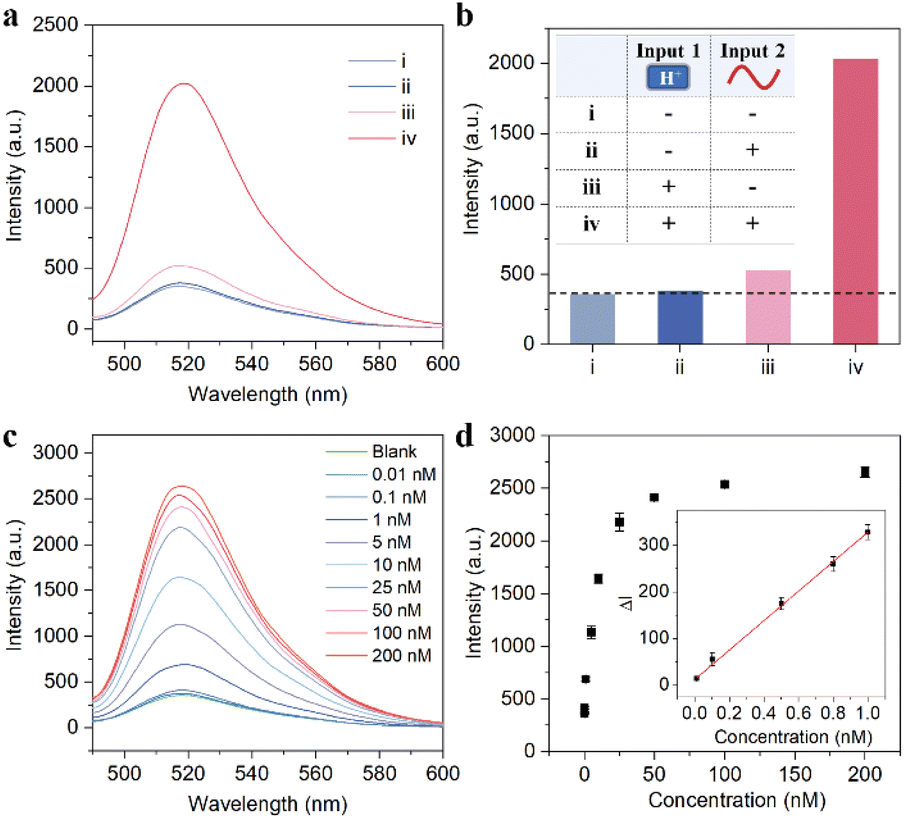 | ||
| Fig. 4 Performance of TP-SFH for miR-21 detection in vitro. Fluorescence spectra of different input signals (a) and their histogram (b). The inset of (b) shows the reaction conditions of each group of experiments (i) pH 7.2, in the absence of miR-21; (ii) pH 7.2, in the presence of miR-21; (iii): pH 5.0, without miR-21; (iv) pH 5.0, with miR-21. (c) Fluorescence response in the presence of different concentrations of miR-21. (d) Relationship between fluorescence intensity and different concentrations of miR-21. The inset showed a good linear correlation in the range of 0.01–1 nM (R2 = 0.998). All experiments were performed in PBS buffer with pH 5.0 for 30 min, and then different concentrations of miR-21 were mixed with the solution for 2 h. | ||
Then, we evaluated the sensing performance of the probe TP-SFH for miR-21 in order to provide a reliable tool for the specific detection of intracellular miRNAs. We explored the linearity and selectivity of TP-SFH. As shown in Fig. 4c, the fluorescence intensity showed a concentration-dependent trend. With the increase in miR-21 concentration, the fluorescence intensity also gradually increased and finally reached a plateau. The results in Fig. 4d show that the fluorescence intensity was linearly correlated with the concentration of miR-21 in the range of 0.01–1 nM (R2 = 0.998). In addition, we compared the signals induced by miR-21 with the corresponding signals of other miRNA simulators such as miR-155, miR-373, miR-122, miR-221, miR-141, and let-7a and the results are shown in Fig. S8.† The fluorescence intensity increased only when miR-21 was present which indicated that the probe TP-SFH had good selectivity.
Delivery of TP-SFH nanomachines and performance of pH nanoswitches
After successful establishment of a cascade activation machine in vitro, we further investigated whether this nanostructure can play a role in living cells. First, we explored the biocompatibility of TP-SFH. The cells were incubated with 0 nM–160 nM TP-SFH for 10 h, and the cytotoxicity of TP-SFH was evaluated by MTT assay. As shown in Fig. S9,† when the concentration was as high as 160 nM, the cell viability was still higher than 85%, indicating low toxicity of the probe. A 100 nM probe was selected for subsequent experiments. We used co-localization experiments to track the process of endocytosis and release of the probe from the lysosome. Before that, we first incubated TP-ON (only Cy5 modified) with the cells at different temperatures for 4 h. As shown in Fig. S10,† the probe hardly entered the cells after culturing at 4 °C, indicating that the probe based on the DNA framework entered the cells through the energy-dependent pathway. After TP-ON was co-incubated with cells for different times, the lysosomes were stained with the lysosome tracker Green. Meanwhile, Image J (Fiji) was used to analyze Pearson's correlation between the probe and lysosome at different incubation times. As shown in Fig. S11,† the fluorescence signal could be seen after the probe was incubated for 1 h, indicating that the probe is gradually entering the cell. When the incubation time was 2 h, the colocalization degree of the probe and lysosome reached the highest. When the incubation time was extended to 3–4 h, Pearson's correlation decreased gradually, indicating that the probe was gradually released from the lysosome. What's more, we recorded the distribution of the fluorescence signal of TP-ON by using layer scanning technology, and the results are shown in Fig. S12.† The blue area is the nucleus stained with Hoechst 33342, and the red area is the distribution of Cy5 modified on the probe. It can be seen that the probe successfully entered the cell and is mainly distributed in the cytoplasm.Next, we investigated the optimal incubation time and response speed of the probe. As shown in Fig. 5a and S13,† the 100 nM TP-ON probe was incubated with cells for different times, and Image-J was used to extract the fluorescence intensity of a single cell. We found that after 4 h of co-incubation, the probe almost completely entered the cell. Meanwhile, we explored the intracellular response of TP-SFH, as shown in Fig. 5b and S14.† It can be observed that the maximum signal will not appear until the incubation time reaches 5 h, indicating that the probe reaction was complete within 1 h. As a control, we assembled TP-S and TP-FH, respectively (S and FH were assembled on different TPs) and incubated them with MCF-7 cells for different times (Fig. 5c and S15†). It takes about 6–7 h to basically stabilize the fluorescence intensity, indicating that it takes about 2–3 h for the freely dispersed system to fully react, which indicates that the local effect of the TP can effectively improve the response speed of nanomachines. In the following experiment, we chose 5 h as the incubation time. As shown in Fig. S16,† after incubation for 5 h, Image J (Fiji) analysis showed that the Pearson's correlation between Cy5 fluorescence of TP-SFH and green fluorescence of the lysosome dye was 0.39. The poor colocalization effect again indicated that the probe TP-SFH could escape from the lysosome to the cytoplasm. In addition, we modified Cy3 to the 5′ end of S1 and Cy5 to the 3′ end of S3-TP, and assembled the probe TP-S-FRET using TP1, TP2, TP3, S1, and S3-TP (as shown in Fig. S17b†). The probe does not respond to the target and always generates a FRET signal, which helps us verify the stability of the frame probe. As shown in Fig. S17,† it could be observed that the FRET intensity hardly changed even if the incubation time reached 8 h, indicating that the probe possessed good stability during the incubation time of 5 h.
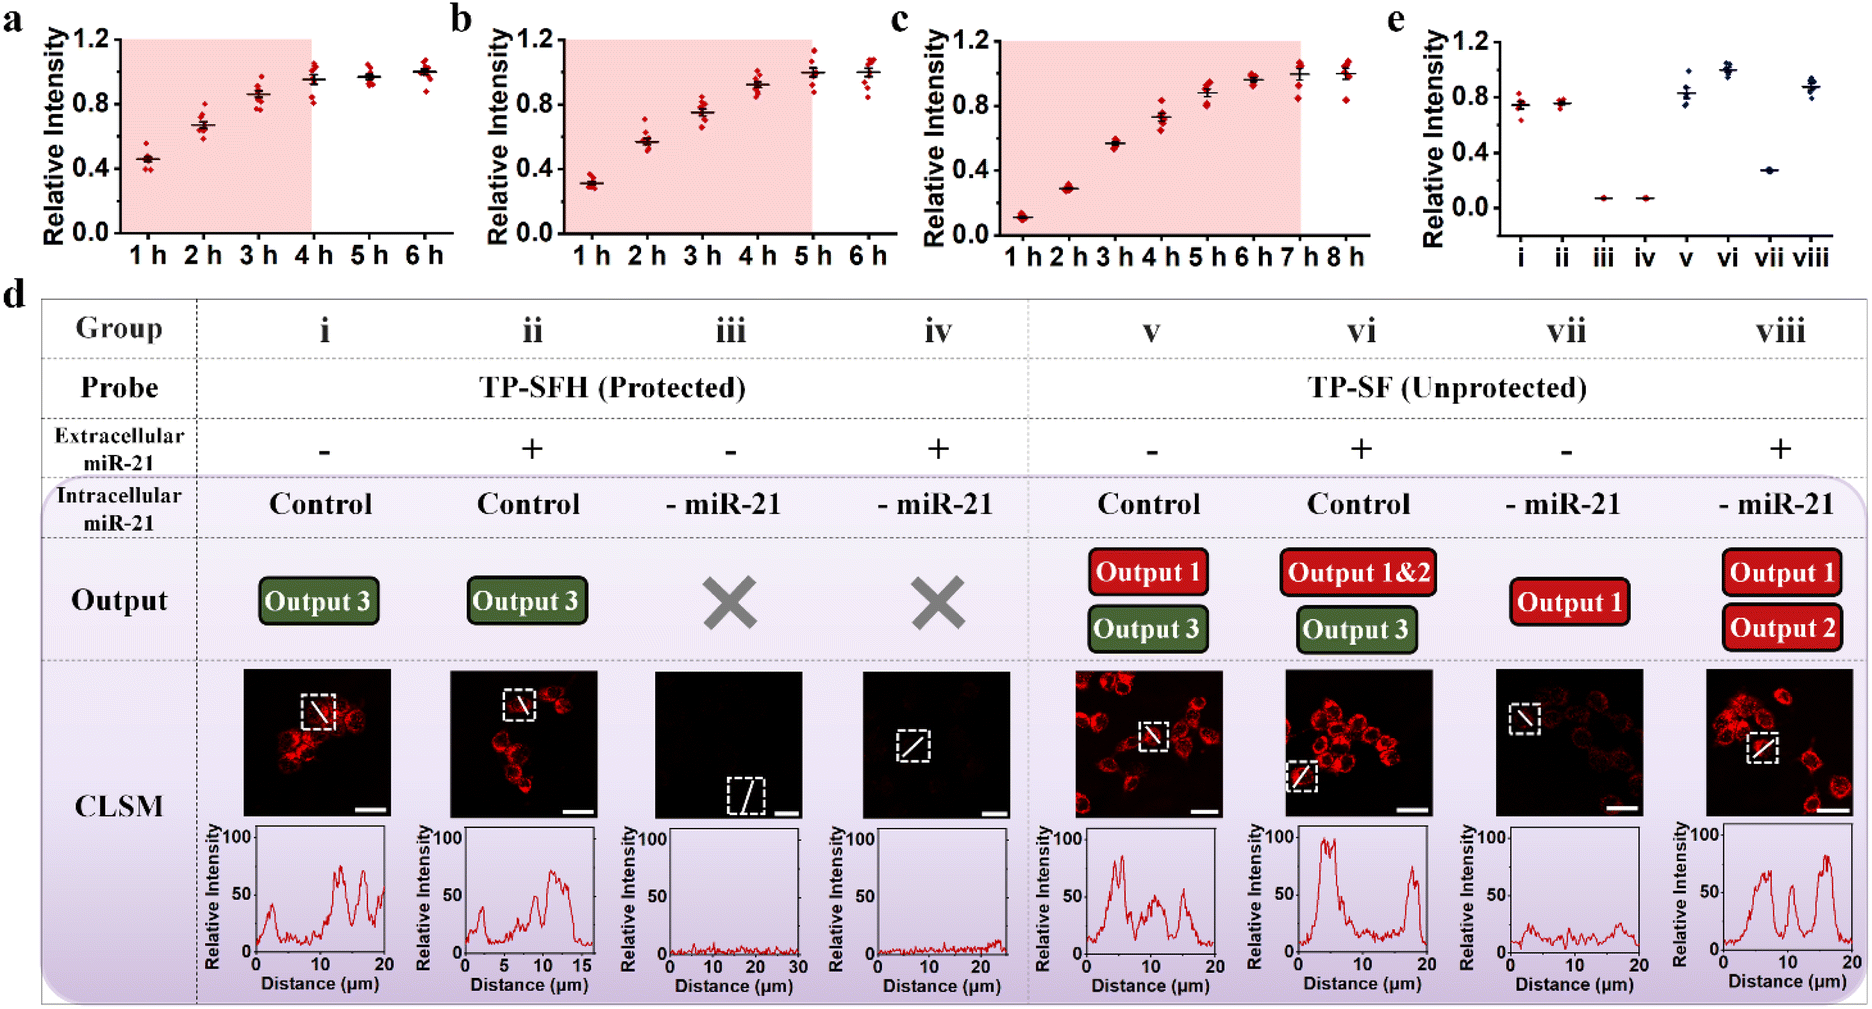 | ||
| Fig. 5 The response speed of TP-SFH and the protection function of the pH nanoswitch. Fluorescence intensity corresponding to different incubation times of TP-ON (a), TP-SFH (b) and TP-S & TP-F (c) with MCF-7. The corresponding CLSM images are shown in Fig. S12–S14.† (d) The intracellular signals of probe TP-SFH (i–iv) and TP-SF (v–viii) under different conditions. Additional miR-21 (2 nM) was added to the extracellular culture medium, denoted by “+”, and untreated was denoted by “−”. Pre-downregulated miR-21 expression levels in cells were labeled as “-miR-21”, and untreated was labeled as “Control”. (e) The corresponding statistical analysis of the fluorescence signal distributions from Fig. 5d. All scale bars correspond to 25 μm. | ||
Before conducting next cell experiments, we first verified the ability of the miR-21 inhibitor to downregulate miR-21 using fluorescence assay. The miR-21 inhibitor is a nucleic acid sequence that is completely complementary to miR-21. As shown in Fig. S18,† the ability of targets pretreated with the miR-21 inhibitor to trigger the TP-SFH reaction was greatly reduced, indicating that the downregulation of miR-21 was realized. As shown in Fig. 5d, to further explore the protective ability of the pH nanoswitch, we divided MCF-7 cells into eight groups and cultured them with protected probe TP-SFH and unprotected probe TP-SF for 5 h, respectively. Meanwhile, miR-21 was used to pretreat the extracellular environment (group ii, iv, vi, and viii) to simulate the delivery process with interference. The other groups were the control group and cultured with a normal medium. In addition, MCF-7 cells in i, ii, v, and vi were not treated, and the cells in group iii, iv, vii and viii were pretreated; miR-21 inhibitors were used to downregulate the expression level of miR-21 in the cells, so as to obtain the false positive signals output 1 & 2. It is worth noting that in this experiment, Cy5 was labeled at the end of S3, and BHQ2 was labeled at the end of S1 to ensure that all the fluorescence signals generated could be carried into cells by the DNA TP. On comparing groups i to iv, even with the addition of miR-21 in the culture medium, the TP-SFH would not be interfered with, and only output the correct signal brought by intracellular miR-21. When the intracellular miR-21 level was down-regulated, TP-SFH showed almost no fluorescence, indicating that the probe had an ultra-low background. In contrast, for unprotected probe TP-SF, because the F strand is fully exposed, the probe is prone to circuit leakage during assembly and delivery, resulting in significant output 1. Moreover, TP-SF is easily interfered with by extracellular miRNA, and a very obvious false positive signal output 2 can be observed in the experimental groups vii and viii with the addition of miR-21. As shown in Fig. 5e, we extracted the fluorescence intensity of each experimental group, so as to observe the response degree of various signals more clearly. In addition, we investigated the response effect of a completely blocked probe. As shown in Fig. S19,† the fully blocked probe TP-SFHT (HT, which adjusted the pH response part of the H sequence to a normal sequence) did not produce a significant fluorescence signal due to the lack of fuel in the EDR, and the nanomachine could not operate normally even in the presence of the target. It is proved that our DNA machine follows the AND logic in the cell and achieves the precise detection of intracellular miR-21 through cascade activation.
Performance evaluation of TP-SFH in living cells
We further investigated the ability of TP-SFH to monitor different concentrations of miR-21 in cells. MCF-7 model cells were pretreated with miR-21 mimics and miR-21 inhibitors, respectively, to achieve the up-regulation and down-regulation of miR-21. The TP-SFH nanomachines were co-incubated with these pretreated cells, and the results are shown in Fig. 6a. Compared with untreated cells (control), the fluorescence intensity of cells pretreated with an miR-21 mimic was significantly increased, while an obviously declined fluorescence signal was acquired in miR-21 inhibitor pretreated cells. We collected the fluorescence intensity in a single cell, and found that the signals were distributed in the cytoplasm, and the intensity was clearly differentiated. Ten cells were randomly selected, and their fluorescence intensity is shown in Fig. 6b. Meanwhile, the average fluorescence intensity of the three parallel experiments was quantified and is shown in Fig. S20a.† The results showed that the intracellular activated nanomachines designed by us could specifically recognize targets in living cells and reflect the different expression levels of miR-21.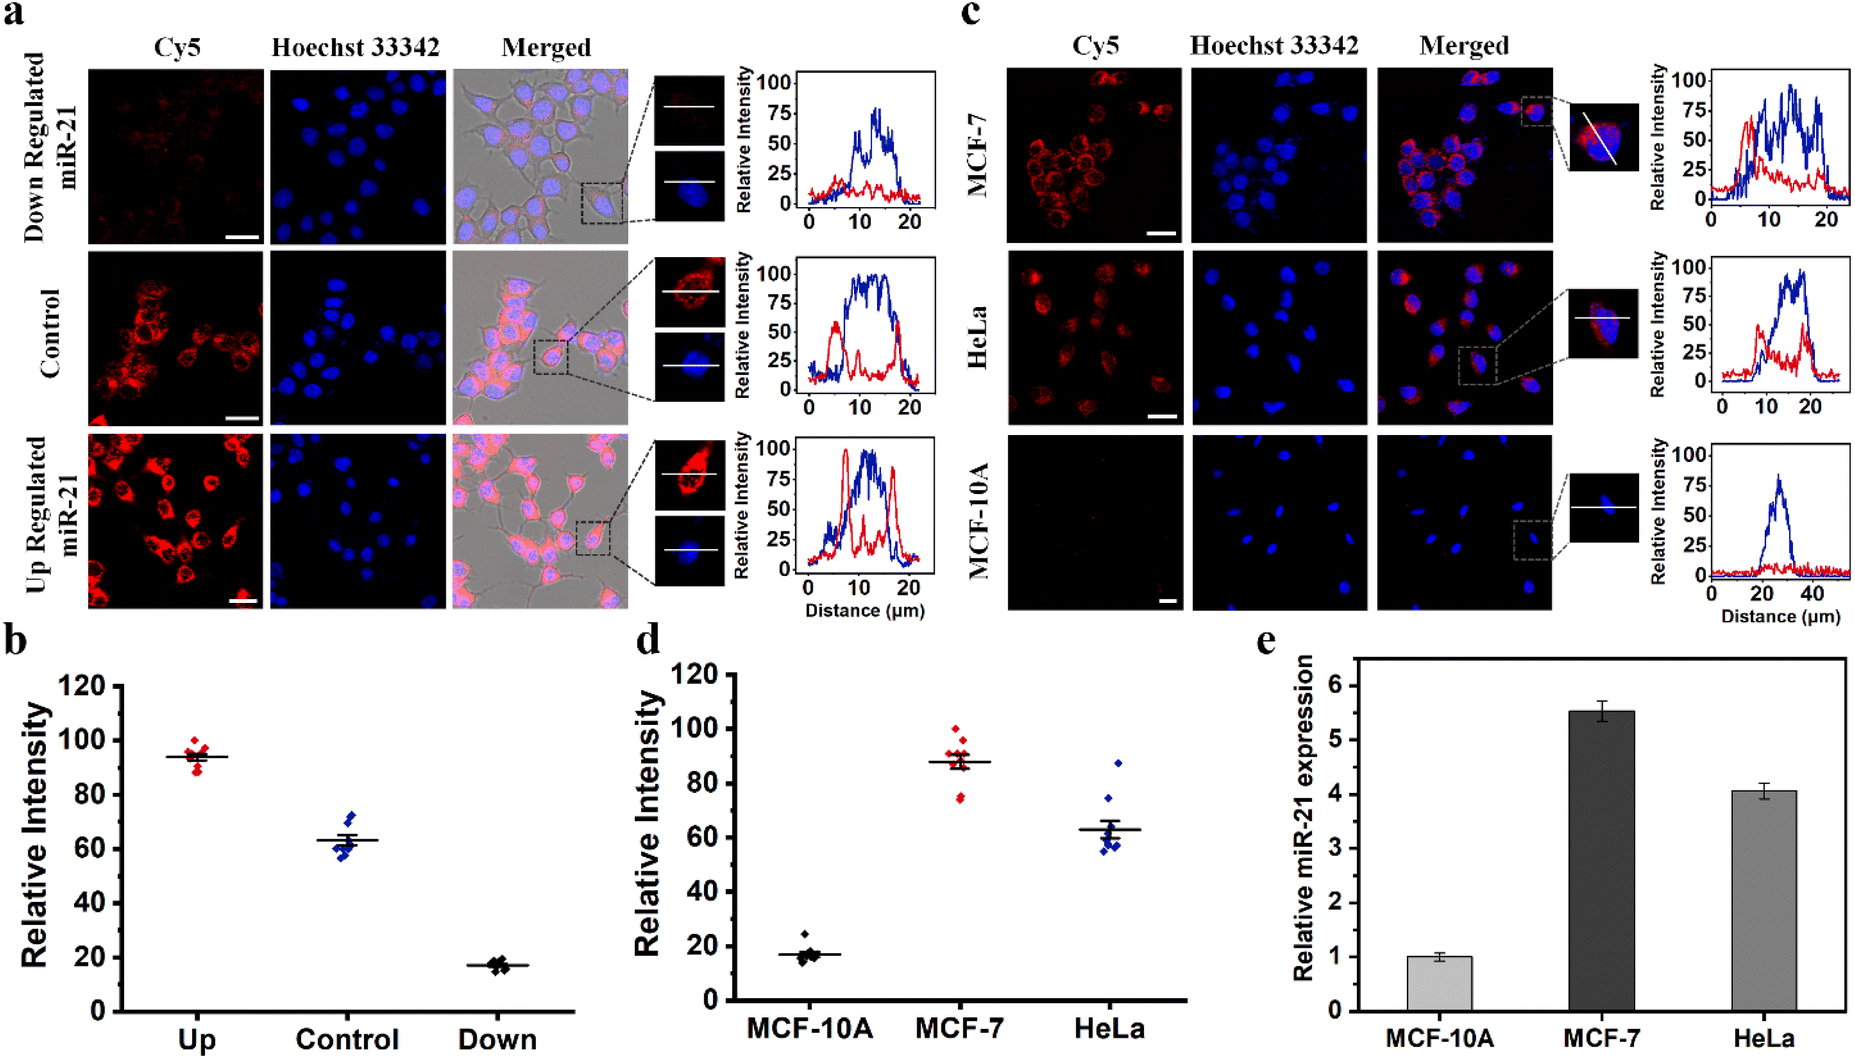 | ||
| Fig. 6 TP-SFH nanomachines were used to image intracellular miR-21. (a) CLSM images for MCF-7 cells treated with miR-21 inhibitors, RPMI-1640, and miR-21 mimics and then incubated with TP-SFH (100 nM). (b) The corresponding fluorescence intensity of 10 cells randomly selected from each experimental group in (a). (c) TP-SFH (100 nM)-enabled intracellular detection of miR-21 in MCF-7, HeLa, and MCF-10A cells. (d) The corresponding fluorescence intensity of 10 cells randomly selected from each experimental group in (c). (e) qRT-PCR analysis of the expression of miR-21 in MCF-7, HeLa and MCF-10A cells. Scale bars: 25 μm. | ||
According to previous literature reports, miR-21 is an oncogene widely present in cancer cells, and its expression is upregulated in a variety of cancer cells.37,38 We selected two cancer cell lines (MCF-7 and HeLa) and one kind of normal cell (MCF-10A) for observation. As a control, the same concentration of TP-SFH was incubated under the same conditions. As shown in Fig. 6c, both cancer cell lines showed strong red fluorescence signals associated with miR-21, while in MCF-10A cells, almost no fluorescence signal was observed, suggesting that our nanomachines can differentiate between normal and tumor cells. In addition, we observed that the fluorescence intensity in HeLa cells was lower than that in MCF-7 cells, because the expression level of miR-21 in MCF-7 cells was higher than that in HeLa cells, which was consistent with the results reported in the previous literature.39,40 We collected the fluorescence intensity of a single cell, and the results are shown in Fig. 6d. Meanwhile, the average fluorescence intensity of the three groups of parallel experiments was extracted, and is shown in Fig. S20b†. The detection results of TP-SFH were basically consistent with the traditional qRT-PCR (Fig. 6e), which verified the ability of our TP-SFH to detect miR-21 in different cells.
Conclusion
In summary, we have successfully constructed an intracellular activated nanomachine, which realized sensitive and precise sensing of intracellular biomolecules based on AND logic. With the EDR as the core, the signal amplification of trace miRNA is realized. The DNA nanoswitch with an adjustable pH response window was introduced to block the fuel strand of the EDR, preventing the non-specific activation during assembly and delivery. The pH nanoswitch would undergo structural transformation when the nanomachine passed through the acid lysosome, and realize the pH response activation of TP-SFH, so as to specifically capture the target in the cell. The DNA framework is used as the carrier to achieve accurate positioning of goods assembly. Besides providing better cell permeability and biological stability, the DNA TP significantly improves the signal amplification speed and reaction efficiency of the EDR due to its spatial-confinement effect. According to the evaluation, the TP-SFH nanomachine realized the integration of delivery-sensing-computing-output functions, which can specifically detect miRNA in living cells, with satisfactory response speed and sensitivity. This hierarchically integrated circuit improves the fidelity of the output signal through multiple recognition responses, which provides a promising tool for the construction of DNA molecular machines in the future.Data availability
All experimental or computational data associated with this article have been provided in the ESI.†Author contributions
X. L. and J. X. conceived the system. X. L. performed the main experiment. Y. J. and Y. Z. conducted part of the cell experiment. X. L. and J. X. wrote the paper. All authors participated in the discussion of the experimental results and commented on the manuscript.Conflicts of interest
The authors declare no competing financial interest.Acknowledgements
This work was supported by the National Key R&D Program of China (Grant No. 2021YFA0910003), the National Natural Science Foundation (Grant 21991080) of China, the Excellent Research Program of Nanjing University (ZYJH004), and the State Key Laboratory of Analytical Chemistry for Life Science (5431ZZXM2203).Notes and references
- A. Chamorro-Garcia, C. Parolo, G. Ortega, A. Idili, J. Green, F. Ricci and K. W. Plaxco, Chem. Sci., 2022, 13, 12219–12228 RSC.
- R. Li, Y. Zhu, X. Gong, Y. Zhang, C. Hong, Y. Wan, X. Liu and F. Wang, J. Am. Chem. Soc., 2023, 145, 2999–3007 CrossRef CAS PubMed.
- Q. Zhang, Y. Wang, W. Wang, Q. Min, J.-R. Zhang and J.-J. Zhu, Angew. Chem., Int. Ed., 2023, 62, e202213884 CrossRef CAS PubMed.
- Y. Gao, X. Chen, T. Tian, T. Zhang, S. Gao, X. Zhang, Y. Yao, Y. Lin and X. Cai, Adv. Mater., 2022, 34, 2201731 CrossRef CAS.
- L. Ceze, J. Nivala and K. Strauss, Nat. Rev. Genet., 2019, 20, 456–466 CrossRef CAS PubMed.
- J. Zhang, P. Zhao, W. Li, L. Ye, L. Li, Z. Li and M. Li, Angew. Chem., Int. Ed., 2022, 61, e202117562 CAS.
- J. Zhao, H. Chu, Y. Zhao, Y. Lu and L. Li, J. Am. Chem. Soc., 2019, 141, 7056–7062 CrossRef CAS.
- J. Zhao, Z. Di and L. Li, Angew. Chem., Int. Ed., 2022, 61, e202204277 CAS.
- Q. Wang, K. Tan, H. Wang, J. Shang, Y. Wan, X. Liu, X. Weng and F. Wang, J. Am. Chem. Soc., 2021, 143, 6895–6904 CrossRef CAS PubMed.
- D. Yi, J. Zhao and L. Li, Angew. Chem., Int. Ed., 2021, 60, 6300–6304 CrossRef CAS.
- Y. Chen, X. Gong, Y. Gao, Y. Shang, J. Shang, S. Yu, R. Li, S. He, X. Liu and F. Wang, Chem. Sci., 2021, 12, 15710–15718 RSC.
- S. He, S. Yu, R. Li, Y. Chen, Q. Wang, Y. He, X. Liu and F. Wang, Angew. Chem., Int. Ed., 2022, 61, e2022065 Search PubMed.
- S. Yu, J. Shang, S. He, Q. Wang, R. Li, Y. Chen, X. Liu and F. Wang, Small, 2022, 18, 2203341 CrossRef CAS PubMed.
- Y. Dong, F. Li, Z. Lv, S. Li, M. Yuan, N. Song, J. Liu and D. Yang, Angew. Chem., Int. Ed., 2022, 61, e202207770 CAS.
- F. Li, Y. Liu, Y. Dong, Y. Chu, N. Song and D. Yang, J. Am. Chem. Soc., 2022, 144, 4667–4677 CrossRef CAS PubMed.
- T. Li and M. Famulok, J. Am. Chem. Soc., 2013, 135, 1593–1599 CrossRef CAS.
- Y. Hu, S. Gao, H. Lu and J. Y. Ying, J. Am. Chem. Soc., 2022, 144, 5461–5470 CrossRef CAS PubMed.
- M.-R. Cui, Y. Chen, D. Zhu and J. Chao, Anal. Chem., 2022, 94, 10874–10884 CrossRef CAS PubMed.
- X.-Q. Li, X.-N. Liu, Y.-L. Jia, X.-L. Luo, H.-Y. Chen and J.-J. Xu, Anal. Chem., 2021, 93, 14892–14899 CrossRef CAS PubMed.
- A. Idili, A. Vallée-Bélisle and F. Ricci, J. Am. Chem. Soc., 2014, 136, 5836–5839 CrossRef CAS.
- W. Fu, L. Tang, G. Wei, L. Fang, J. Zeng, R. Zhan, X. Liu, H. Zuo, C. Z. Huang and C. Mao, Angew. Chem., Int. Ed., 2019, 58, 16405–16410 CrossRef CAS PubMed.
- S. Zeng, D. Liu, C. Li, F. Yu, L. Fan, C. Lei, Y. Huang, Z. Nie and S. Yao, Anal. Chem., 2018, 90, 13459–13466 CrossRef CAS PubMed.
- D. Wang, S. Li, Z. Zhao, X. Zhang and W. Tan, Angew. Chem., Int. Ed., 2021, 60, 15816–15820 CrossRef CAS PubMed.
- K. E. Bujold, J. C. C. Hsu and H. F. Sleiman, J. Am. Chem. Soc., 2016, 138, 14030–14038 CrossRef CAS PubMed.
- X. Fu, G. Ke, F. Peng, X. Hu, J. Li, Y. Shi, G. Kong, X.-B. Zhang and W. Tan, Nat. Commun., 2020, 11, 1518 CrossRef CAS PubMed.
- Z. Guo, L. Zhang, Q. Yang, R. Peng, X. Yuan, L. Xu, Z. Wang, F. Chen, H. Huang, Q. Liu and W. Tan, Angew. Chem., Int. Ed., 2022, 61, e202111151 CAS.
- Y. Wan, G. Li, L. Zou, H. Wang, Q. Wang, K. Tan, X. Liu and F. Wang, Anal. Chem., 2021, 93, 11052–11059 CrossRef CAS PubMed.
- Z. Yang, B. Liu, T. Huang, B.-P. Xie, W.-J. Duan, M.-M. Li, J.-X. Chen, J. Chen and Z. Dai, Anal. Chem., 2022, 94, 8014–8023 CrossRef CAS PubMed.
- X.-Q. Li, D. Luo, J. Song, Y.-L. Jia, J. Song, H.-Y. Chen and J.-J. Xu, Chem. Commun., 2022, 58, 8210–8213 RSC.
- X. Mao, M. Liu, L. Yan, M. Deng, F. Li, M. Li, F. Wang, J. Li, L. Wang, Y. Tian, C. Fan and X. Zuo, ACS Nano, 2020, 14, 8776–8783 CrossRef CAS PubMed.
- Y. Zhang, Y. Deng, C. Wang, L. Li, L. Xu, Y. Yu and X. Su, Chem. Sci., 2019, 10, 5959–5966 RSC.
- Z. Qing, J. Hu, J. Xu, Z. Zou, Y. Lei, T. Qing and R. Yang, Chem. Sci., 2020, 11, 1985–1990 RSC.
- D. Y. Zhang, A. J. Turberfield, B. Yurke and E. Winfree, Science, 2007, 318, 1121–1125 CrossRef CAS PubMed.
- L. He, D. Lu, H. Liang, S. Xie, X. Zhang, Q. Liu, Q. Yuan and W. Tan, J. Am. Chem. Soc., 2018, 140, 258–263 CrossRef CAS PubMed.
- H. Bui, V. Miao, S. Garg, R. Mokhtar, T. Song and J. Reif, Small, 2017, 13, 1602983 CrossRef PubMed.
- B. Zhang, T. Tian, D. Xiao, S. Gao, X. Cai and Y. Lin, Adv. Funct. Mater., 2022, 32, 2109728 CrossRef CAS.
- Y. Wang, Y. Li, Y. Zhang, K. Ren, H. Ju and Y. Liu, Sci. China: Chem., 2020, 63, 731–740 CrossRef CAS.
- M.-R. Cui, X.-L. Li, H.-Y. Chen and J.-J. Xu, CCS Chem., 2021, 3, 2063–2073 CrossRef CAS.
- Z. Yang, X. Peng, P. Yang, Y. Zhuo, Y.-Q. Chai, W. Liang and R. Yuan, Chem. Sci., 2020, 11, 8482–8488 RSC.
- X. Wang, H. Sun, B. Liu, K. Jiang, Z. Li and H.-M. Meng, Anal. Chem., 2022, 94, 17232–17239 CrossRef CAS PubMed.
Footnote |
| † Electronic supplementary information (ESI) available. See DOI: https://doi.org/10.1039/d3sc01162c |
| This journal is © The Royal Society of Chemistry 2023 |