 Open Access Article
Chemiresistive sensor for breath frequency and ammonia concentration in exhaled gas over a PVA/PANI/CC composite film†
Sandeep
Kumar
ab,
Chandra Shekhar
Kushwaha
b,
Pratibha
Singh
b,
Kritika
Kanojia
b and
Saroj Kr
Shukla
 *b
*b
aDepartment of Chemistry, University of Delhi, Delhi-110007, India
bDepartment of Polymer Science, Bhaskaracharya College of Applied Sciences, University of Delhi, Delhi-110075, India. E-mail: sarojshukla2003@yahoo.co.in; Tel: +91 11 25087597
First published on 27th June 2023
Abstract
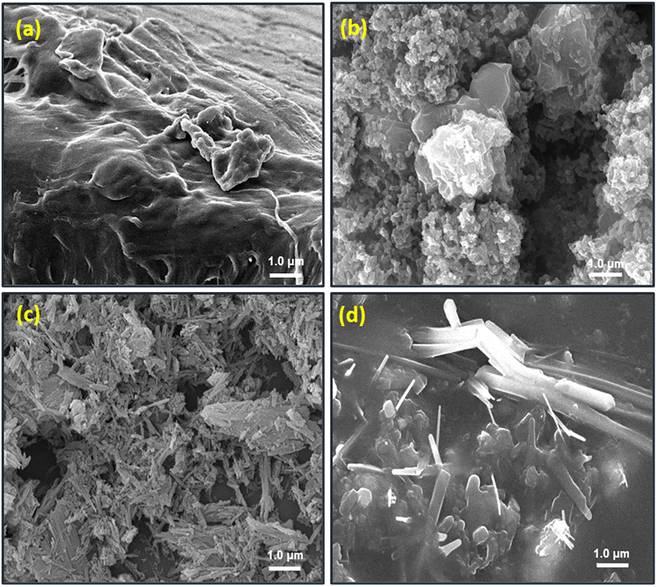
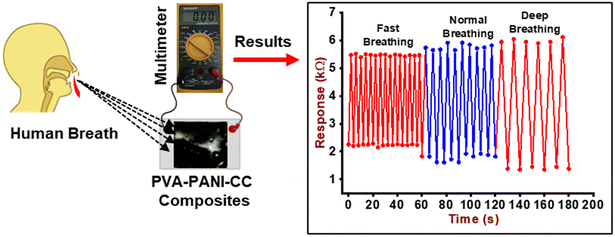
The present study demonstrates the chemiresistive monitoring of respiratory frequency and ammonia gas in breath-out gases over a solution blended, electrically conducting, and humidity-responsive composite film of polyvinyl alcohol, polyaniline, and china clay (PVA/PANI/CC) over a commercial mask. The chemical structure, morphology, and relevant properties of the composite were investigated by Fourier transform infrared spectrometer (FT-IR), X-ray diffraction (XRD), scanning electron microscope (SEM), a two probe method, and other suitable standard methods. The analytical response performance results reveal the synergistic evolution of electrical conductivity, and the humidity-responsive nature in the PVA/PANI/CC composite in the range of 5 to 95% RH along with promising sensing parameters, i.e., 0.09144 kΩ RH−1 sensitivity, response time 6 s, recovery time 10 s, stability for 80 days, and V2 flame retardant nature. Further, the resistance of the composite film coated on a commercial mask was measured after exposure to inhaled and exhaled human breath air and was further used to monitor the breath frequency and presence of ammonia concentration in breath-out gas to screen the kidney function. Further, a mechanism for humidity-mediated breath monitoring has been proposed based on the dissociative surface adsorption of water molecules and competitive adsorption of ammonia molecules, along with parameters and technical details.
1. Introduction
In general, breath monitoring (BM) is an integrated medical practice to evaluate respiratory frequency (Rf), breathing pattern, inspiration/expiration ratio, and exhaled gas composition. The extrapolated applications of BM depict the physiological status as a vital indicator for different body conditions, i.e., adverse cardiac events, pneumonia, stress, cognitive load, body temperature, and deterioration of body organs.1,2 Monitoring and control of breathing is an old practice by medical practitioners to cure and improve the health conditions of both casual and chronic diseases, but in current times its importance has been certified as a non-invasiveness technique for screening illicit practices, like drug abuse, drinking, environmental stress, and bio-feedback, apart from the physical status of body.3 In general, human breath-out gas consists of nitrogen, oxygen, carbon dioxide, humidity, and approximately 870 residual gases, such as ammonia, methane, nitric oxide, sulfur dioxide, hydrogen sulfide, and volatile organic compounds. These gases are by-products of the metabolic activity of different body organs and work as a biomarker for malfunctioning body functioning and several diseases.4–7 For example, the presence of hydrogen and methane for bacterial tolerance, carbon dioxide for anesthesia, acetone for ketosis, ethanol for law enforcement, and ammonia for protein metabolism and kidney function. The presence of ammonia in exhaled gas is an indicator of the ammonia level in blood and is controlled by the functioning of different body organs.8 It is reported that patients suffering from malfunctioning kidneys exhale a higher ammonia content, i.e., 1.5 ppm (1500 ppb) of gas, while its concentration in the breath out gas of a healthy person is 0.5 to 0.8 ppm (500–800 ppb).9In this regard, several contact and noncontact methods are reported for BM and ammonia sensing in breath samples using acoustic, air flow, carbon transcutaneous, oxygen saturation, and electrocardiogram for the mechanical vibration of the lungs.10 Among the different BM methods, humidity-induced electrochemical sensing is significantly highlighted due to its efficient repetitive change in the electrical properties of sensing materials due to the adsorption-induced interaction of water molecules present in exhaled and inhaled gases.11–15 The use of humidity sensors for breath monitoring has been reported as a wrapped tilted fiber grating, capacitive sensor, paper-based wearable non-invasive sensing devices for non-smokers, and diagnostic tools for pneumonia, pulmonary disease, and a person's respiratory frequency.16,17 The basic strategy for humidity sensing is monitoring surface induced properties of materials such as resistance, optical permeability, and mechanical.18 The surface interaction of humidity also generates voltage and current to use the materials as self-fueled materials as well as in the form of hydroelectric cell to generates energy.19–21 For this purpose, several polymers, non-polymers, nano structure materials and their composite humidity sensing materials are explored with limited features like processability, selectivity, and sensing parameters.22 Among the different humidity-sensitive materials, polyaniline (PANI) is an intrinsically conducting polymer with heterogeneous benzenoid and quinoid structures with a limited interactive nature with water molecules. Further, the hybrid structure of PANI exhibits a better interaction towards H2O molecules for sensing along with the scope for improvement in processability and conductivity after blending, grafting, and encapsulating a transition metal oxide.23 Shukla et al. reported improved humidity sensing properties of PANI after making its composite with metal oxides due to the synergistic crystallinity, hydrophilicity, porosity, and electrical conductivity.24,25 In another development, the electroactive blend of polyvinyl alcohol (PVA) and PANI have been reported with a humidity responsive nature between 15 and 95% RH after lowering the resistance to between 60 and 75% due to the hydrophilic nature of PVA, improved glass transition temperature and restricted movement of PVA chains.26 The presence of clay in the polymer matrix yields improved properties, i.e., ion formation to use as a solid electrolyte with a triggering effect to use as humidity-induced galvanic potential sensors with good linearity, a high sensing response, long-term stability, and cost-effectiveness.27–29 Among the different clays, china clay is an easily available clay with a composition of 38.5% silica, 47.5% Alumina and 14% water. The CC exhibits a high surface area, better dielectric strength, and large water molecule retaining capacity. The CC is a suitable clay to use as a filler, coating pigment, and for making ceramics.29,30 The high water retaining capacity of CC also initiates a dissociative adsorption along with a change in the electrical resistance because of the formation of hydroxyl and hydronium ions. However, the insulating nature of CC restricts its application but it may be used for electrochemical humidity sensing after optimizing the electrical responsiveness.22 In this regard, chemical modifications, like coating with a conducting polymer, are reported to optimize the hydrophobicity and conductivity for sensing applications.31 Furthermore, like the water molecule, ammonia is another covalent molecule with a good electron donating ability, and its presence with water molecules significantly interferes with the sensing properties due to a competitive interaction and water mediated ionization for an effective sensing and process compensation.15,32 This quantitative presence of ammonia has been frequently explored for medical diagnostic and BM in the form of wearable sensing devices after using different adsorptive and catalytic sensing substrate, like silver-platinum decorated tin oxide film with variable conditions.33 This competitive adsorption of ammonia in humid condition promises a huge potential to measure the relative composition of both the gases, i.e., ammonia and water molecules, for different applications, which include medical techniques for chronic diseases, covid infection, and nephropathy diagnosis, but neither were systematically studied or commercialized for the betterment of medical diagnosis, as per our observation.14,34,35
In the context of the above discussion, the present work reports the synergistic evolution of the humidity-responsive nature and hydrophilicity in an electrically conducting PVA/PANI/CC composite. Further, the composite coated on a commercial mask was used for the monitoring of respiratory frequency and ammonia concentration in breath-out gases to screen the kidney condition of a healthy and an ill person.
2. Experimental
2.1. Materials
Aniline (99.0%) was purchased from Rankem Chemicals India, while china clay (98%), formic acid (85.0%), PVA (89.0%), and liquid ammonia were procured from CDH Chemicals Pvt Ltd and used without any purifications. The other used chemicals were of analytical grade and double distilled water was used in the entire investigation.2.2. Preparation of PANI and composites
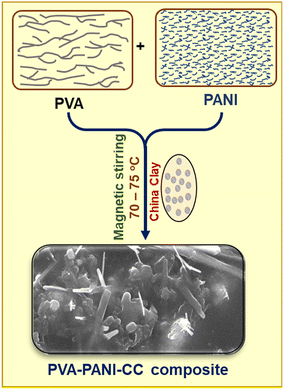
Initially, PANI was prepared after polymerizing the acidified aqueous aniline solution with 0.1 M ammonium per sulfate solution after maintaining the temperature between 0 and 5 °C using an ice bath. Finally, the blue-black precipitate was obtained with a 79% yield efficiency in 120 min.Further, to prepare the PVA/PANI/CC, the PVA solution was prepared after dissolving 2.0 g of PVA in 20 mL of hot distilled water by stirring on a magnetic stirrer for 30 min at 80 °C. In this solution, 200 mg of PANI and 100 mg of china clay (CC) were dispersed after further stirring of the mixture on the same magnetic stirrer for 120 h. Finally, the black-colored viscous solution was obtained, and poured into a Petri dish. The solution was allowed to dry, peeled out, and stored in a glass container. The pictorial presentation of the experimental setup used for the preparation of the composite is shown in Fig. 1.
2.3. Characterization
Spectroscopic analyses of the composite and its constituents were performed using a Bruker, alpha model, Fourier transform infrared spectrometer (FT-IR). The spectra were recorded in the ATR mode after the accumulation of 16 scans at a resolution of 2 cm−1 in the range of 4000 to 500 cm−1. The particle phase and structure of the produced materials were studied using a Bruker D-8 X-ray diffractometer (XRD) with Cu Kα1 (λ = 1.5405) radiation generated at 30 kV and 50 mA and a 2° min−1 scanning rate. However, the surface morphology was investigated using a JEOL JSM-6610 scanning electron microscope at a working voltage of 30 kV and a current of 20 mA. The samples were also sputter coated with a thin layer of gold to prevent charge collection before taking the SEM photographs. Thermal behavior was investigated by a HITACHI STA7300 thermo-gravimetric analyzer (TGA) under a consistent nitrogen flow of 50 mL min−1 and a heating rate of 10 °C min−1.2.4. Electrical conductivity
The electrical conductivity of the prepared composite was determined using the two-probe method. Initially, the voltages were applied against the prepared composite film (1 cm × 1 cm), with the help of a 32 V Aplab DC power supply, and the respective current was measured using a Scientech Digital Multimeter DM-97. The conductivity calculation was done using eqn (1) and (2)36 | (1) |
 | (2) |
2.5. Physio-mechanical properties
The physio-mechanical properties, i.e., swelling index, porosity, and biodegradability, were evaluated by the reported standard weight monitoring method using solvent-cast film in the dimensions 1 cm × 1 cm × 0.02 cm.37 However, the soil burial test was used to assess the biodegradability of PVA–PANI–CC composites. This test was carried out after using a composite film with dimensions of 1.4 cm × 1.4 cm × 0.025 cm. Initially, the films were placed in moist soil and kept in an earthen pot for a set period below a 2.0 cm depth. The regular weight loss of the film was periodically monitored using a Sartorius chemical balance with the least count of 0.1 mg.38 Further, the under-writer laboratory test (UL 94) was used to measure the burning behavior of the constituent polymer and PVA–PANI–CC composites.39 Initially, wooden strips were coated with the PVA–PANI–CC composite, and then a flame retardancy test was performed for UL 94. The five specimens for each sample with a length of 5 cm, thickness 2.19 mm, and width 1 cm were tested in the vertical mode and their mean reported.2.6. Humidity sensing and breath monitoring
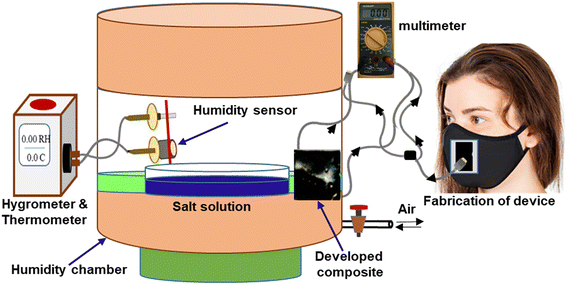
The humidity-sensing nature of PVA–PANI–CC was measured after monitoring the resistance of the composite film under the influence of different humidity levels. For this purpose, the film composite was cast on the ITO-coated glass plate with dimensions of 1 cm × 1 cm × 0.5 mm. Further, the film was placed in a 10 L humidity-controlled chamber containing two holes, one for the electrical connection and the other for the vacuum creation as well as to purge the gas. The film was connected with a multimeter through a silver contact made on the edges by silver pastes. The humidity level inside the chamber was maintained after keeping the different saturated salt solutions, i.e., LiCl for 11%, MgCl2 for 32%, K2CO3 for 43%, NaBr for 57%, KI for 69%, NaCl for 75%, KCl for 85%, and K2SO4 for 97%. After that, the resistance of the film was measured using a multimeter.40,41 The other sensing properties, i.e., response time, recovery time, and interference, were also measured after using standard procedures and protocols.42Further, for monitoring the RF, a thin film of composite was made on a commercial face mask after screen painting and both its ends were connected with the Multimeter through a contact of silver paste. Finally, the mask was worn by the person who was asked to breathe in a slow, normal, and fast manner along with a continuous measurement of the resistance of the film. The measurement was performed in triplicate and its mean reported. The fabrication steps of the humidity sensors and the complete breath monitoring setup are shown in Fig. 2, while the absolute physical photograph is shown in Fig. S1.†
The concentration of ammonia in the range of 50 ppb to 5000 ppb was maintained in a sensing chamber containing a fixed humidity after adding the requisite liquid ammonia with a syringe, and was allowed to disperse. After that, the induced resistance change was measured after using the same setup under ambient conditions. The trend in the change of resistance against the relative ammonia concentration and the humidity level was made to use as a calibration curve. Further, the values were used to screen the ammonia concentration in a real breath-out gas after a comparison to predict the kidney condition.
3. Results and discussion
3.1. Preparation of composite
The observed parameters, i.e., color sequence, temperature, pH, and viscosity during the solution blending are listed in Table 1. The parameters indicate a gradual interaction among the constituents PVA, PANI, and CC due to an increase in the viscosity, which evolves the formation of the composite matrix after intercalation of CC in the PVA and PANI chains after the formation of hydrogen bonding between PANI and hydroxyl groups of PVA. However, the hydrophilic nature of CC towards the hydroxyl group allows intercalation between the hybrid polymer chain of PVA and PANI, which was further verified by spectrochemical results.| S. n. | Temperature (°C) | Time (min) | Viscosity (cp) | Observation |
|---|---|---|---|---|
| 1. | 25 | 0.0 | 70 | PVA solution is colorless while its mixed solution with PANI is a dark blue-green color |
| 2. | 45 | 30 | 75 | Dark green color solution found |
| 3. | 75 | 60 | 80 | Dark green color, non-uniform solution found |
| 4. | 75 | 120 | 90 | Dark green color becomes viscous with a uniformly dispersed solution found |
3.2. Chemical characterization
![[double bond, length as m-dash]](https://www.rsc.org/images/entities/char_e001.gif) Q
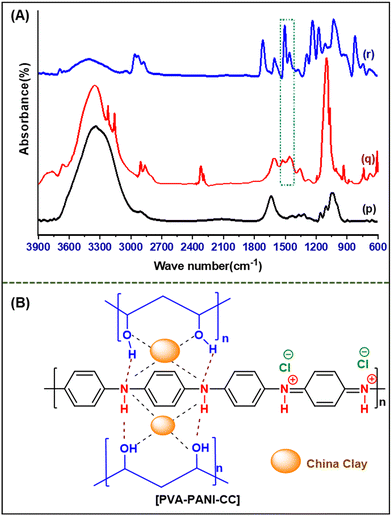
Q![[double bond, length as m-dash]](https://www.rsc.org/images/entities/char_e001.gif) N/δ(C–H) vibrations, B–NH–B/δ(C–H) vibrations, and C–H bending, respectively.44 Further, the spectrum of PVA–PANI–CC demonstrates the presence of characteristic peaks of PVA, PANI, and CC with considerable changes in their position, intensity, and shape than those of their pristine spectrum (Table S1†). Further, the shift in the positions and nature of the constituent with composite confirms the interactions between PVA, PANI, and CC. The comparison of characteristic benzenoid and quinoid peaks of PANI indicates a significant improvement in the peak intensity of quinoid peaks in the composite than in the pristine PANI. Thus, the evolution of the quinoid enriched composite structure supports the effective interaction with a molecule bearing a lone pair, like ammonia and water. Similarly, the strong peak evolved in the composite at 1716 cm−1 reveals the generation of a residual carbonyl group in the PVA chain during solution blending. Based on the above discussion, the probable synergistic structure is depicted in Fig. 3B.45,46
N/δ(C–H) vibrations, B–NH–B/δ(C–H) vibrations, and C–H bending, respectively.44 Further, the spectrum of PVA–PANI–CC demonstrates the presence of characteristic peaks of PVA, PANI, and CC with considerable changes in their position, intensity, and shape than those of their pristine spectrum (Table S1†). Further, the shift in the positions and nature of the constituent with composite confirms the interactions between PVA, PANI, and CC. The comparison of characteristic benzenoid and quinoid peaks of PANI indicates a significant improvement in the peak intensity of quinoid peaks in the composite than in the pristine PANI. Thus, the evolution of the quinoid enriched composite structure supports the effective interaction with a molecule bearing a lone pair, like ammonia and water. Similarly, the strong peak evolved in the composite at 1716 cm−1 reveals the generation of a residual carbonyl group in the PVA chain during solution blending. Based on the above discussion, the probable synergistic structure is depicted in Fig. 3B.45,46
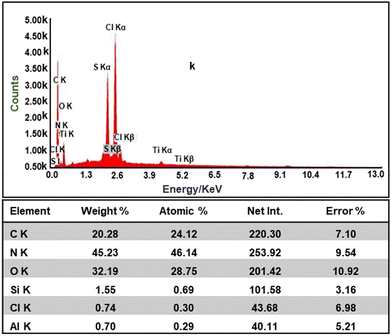
Further, the EDAX results of the composite shown in Fig. 6 confirms the presence of all the constituent elements, i.e., C, Cl, N, Mg, Al, Si, and O, due to the presence of constituents' materials.
| Sample | Conductivity (S cm−1) | Biodegradability (%) | Degree of swelling (%) | Porosity (%) |
|---|---|---|---|---|
| PVA | 00 | 17.24 | 19.8 | 17.8 |
| PANI | 39.80 × 10⁻³ | 13.79 | 16.0 | 20.4 |
| PVA–PANI–CC | 17.70 × 10⁻³ | 44.82 | 20.6 | 28.5 |
The increase in conductivity of the composite is due to the presence of PANI in the chain of the composite polymer matrix, while the multi-component structure with a flexible PVA and PANI chain and encapsulated clay is responsible for improved swelling index and porosity. Further, the improved porosity and hydrophilicity support a better hydrophilic degradation of composite and faster biodegradability due to the high water retaining nature.48 The optical photograph and result of the biodegradability of a PVA–PANI–CC film are shown in Fig. S2,† while the results are listed in Table 3 and confirms the better biodegradability of the composite. The improvement in biodegradability is due to the effective growth of a microbial colony on the prepared composite with a porous and hydrophilic structure and biocompatible nature.
| S. n. | Samples | Burial time (days) | Initial weight (g) | Final weight (g) | Weight loss (g) |
|---|---|---|---|---|---|
| 1. | PVA | 2 | 0.029 | 0.016 | 0.013 |
| 2. | PANI | 2 | 0.029 | 0.029 | 0.000 |
| 3. | PVA–PANI–CC | 2 | 0.029 | 0.019 | 0.021 |
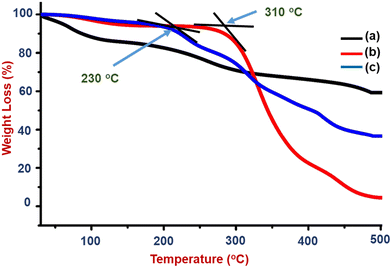
Thus, the better hydrophilic and thermally stable properties of the composite support a sensing application with a flame retardant nature in the prepared polymer matrix (S1). The burning nature and observation of the PVA–PANI–CC composite coated wooden specimen are shown in Fig. S3 and Table S4.† The flame retardancy is an additional feature of the prepared PVA–PANI–CC composite and promises to make the sensors safer from fire hazards.
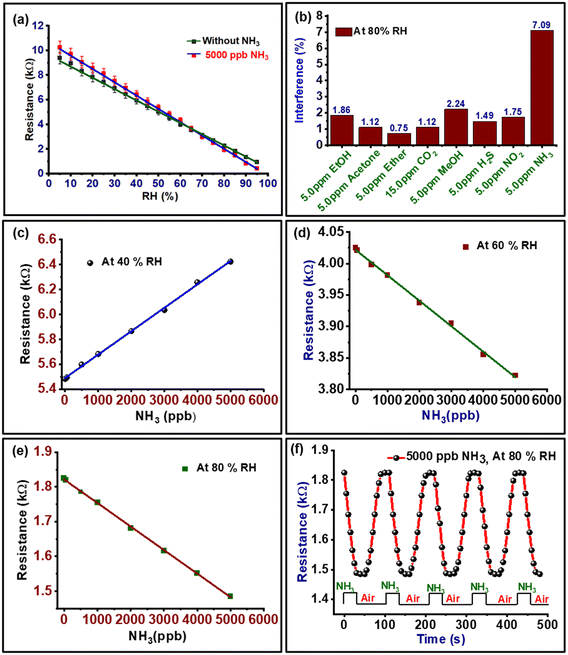
3.3. Humidity sensing properties
The changes in resistance of PVA–PANI–CC against different relative humidity levels between 5 and 95% RH is shown in Fig. 8(a). The curve reveals a continuous decrease in the resistance with an increase in RH, which confirms the suitability of the composite for sensing humidity. Further, the slope of the curve was calculated to determine the sensitivity, which was found to be 0.09144 kΩ RH−1. Further, the change in resistance at a fixed humidity with time is shown in Fig. S4b.† The curve confirms the repetitive use of materials for humidity sensing along with a response time of 6 s, and recovery time of 10 s for 80 days. The lifetime of the PVA–PANI–CC based humidity sensor was evaluated by measuring the responsive resistance up to 80 days at regular intervals of 10 days (Fig. S5†). The results depict a loss of sensing efficiency of the sensor by only ≤3.0% after 80 days.The interference behavior of the composite against different common interferents is shown in Fig. 8(b), which exhibits a significant interference for ammonia of 7.0%. The basic mechanism interference for NH3 towards the resistance of the sensing film is based on the competitive interaction of ammonia molecules in the presence of water molecules. The nature of the NH3 molecule varies with the presence of water molecules. In general, the higher reactivity of the ammonia molecules restricts the movement of the water molecules, which reduces their ionization. However, at a higher relative humidity, the ammonia molecules dissolve and produce ions for electron conduction and a lowering of resistance. This decrease in the resistance of the composite is due to the dissociative ionization of the adsorbed water and ammonia molecules on the composite surface after the first layer of surface adsorption.22,41 The possible dissociative ionization reaction that took place at the sensor surface is shown in eqn (3)–(5).
| H2O(ads) + H2O(ads) ⇌ H3O⊕ + OH⊖ | (3) |
| NH3(ads) + H2O(ads) ⇌ NH4⊕ + OH⊖ | (4) |
| R–OH + NH3(ads) ⇌ NH4⊕ + R–O⊖ | (5) |
The ammonia-interfering behavior of the developed composite at 40% RH, 60% RH, and 80% RH are shown in Fig. 8(c–e). The curves reveal that the sensor exhibits a linear sensing response from a concentration of 50 ppb to 5000 ppb NH3. Thus, the difference in resistance at a particular humidity in the presence of ammonia can be used as a calibration curve to estimate the concentration of ammonia in humid air. At a lower humidity, i.e., 40% RH, when the ammonia concentration increases, the conductivity of the sensor film decreases because the increase in ammonia molecules on the surface of the composite film decreases the presence of H2O molecules. Further, when the humidity increases the conductivity of the sensor film increases and also the sensitivity toward NH3 increases. At 80% RH, the sensing response and conductivity of the film was significantly enhanced (Fig. 8e), because at a high RH the generation of many protons transition inside the sensitive film results. Further, the resistance of the composite in the dry and at 80% RH was monitored with time with a 5000 ppb NH3 sensor. The curve is shown in Fig. 8f, which confirms the 30 s responses and 35 s recovery times, while in the absence of ammonia the sensor response was quicker, i.e., 6 s and 10 s, respectively (Fig. S4†). Further, the developed PVA–PANI–CC composite based humidity-activated ammonia sensor exhibits a response against NH3 in the concentration range 50 ppb to 5000 ppb due to its selectivity toward NH3 at a high RH. These properties of PVA–PANI–CC composite make them suitable for use in RF monitoring along with sensing the ammonia concentration in human breath to screen healthy humans or persons with kidney problems.
3.4. Breathing monitoring and kidney screening
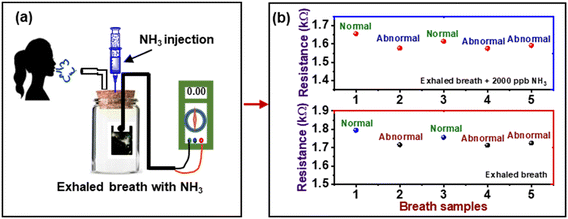
The change in the resistance of the composite layer cast on the mask was also measured after the exposure of it to breath-out air. The pattern of resistance against breathing air is shown in Fig. 9. The curve reveals the periodical decrease in resistance of the composite due to the high humidity contents in the exhaled breath, i.e., 80–85% RH, while the inhaled breath is relatively dry. This continuous increase and decrease in resistance can be used to count the number of breaths (RF) taken by a person in a particular time, i.e., 1 min under different body conditions, i.e., normal (6 s pulse rate), fast (4 s pulse rate), and deep breath (10 s pulse rate).Further, in order to investigate the potential application of the PVA–PANI–CC sensor for ammonia concentration in the exhaled breath of humans, the gas sampling bags were used to collect the exhaled gas of 5 healthy people and injected along with 2000 ppb NH3 in the sensing gas chambers. The experimental setup is given in Fig. 10(a), and the observed response of the sensor is shown in Fig. 10(b).
The resistance of the sensor reaches beyond the prescribed lower value when exposed to the exhaled breath containing 2000 ppb NH3 to screen the kidney status of a person. Thus, from the above results, the PVA–PANI–CC sensor can be a suitable device for inferring the ammonia level in an exhaled breath environment, which contains a variety of gases in a high-humidity environment (Table 4). Further, the quantitative difference indicates the value of ammonia in the exhaled gas beyond a limit to infer the health conditions of a person, as given in Table 4.
| Breath sample | Response without NH3 (kΩ) | Ammonia level (ppb) | Response with 2000 ppb NH3 (kΩ) | Ammonia level (ppb) | Remark |
|---|---|---|---|---|---|
| 1 | 1.795 | 355 | 1.656 | 2400 | Normal |
| 2 | 1.716 | 1566 | 1.577 | 3570 | Abnormal |
| 3 | 1.756 | 982 | 1.615 | 2990 | Normal |
| 4 | 1.713 | 1613 | 1.576 | 3615 | Abnormal |
| 5 | 1.725 | 1402 | 1.592 | 3400 | Abnormal |
4. Conclusion
In conclusion, we present, the synthesis of a humidity-responsive composite comprised of PVA, PANI, china clay and demonstrated its use in monitoring respiration frequency and ammonia concentration in breath-out gas. The synergistic evolution of the humidity responsiveness nature and electrical conductivity has been established by spectroscopy and microscopic results along with basic properties, i.e., porosity, swelling index, and water uptake capacity. Finally, the humidity sensing properties of the composite have been reported along with its use for measuring RF and ammonia concentration in breath-out to screen the kidney condition in a functional mask after coating it with a layer of the composite. The observed humidity sensing parameters are a sensitivity of 0.09144 kΩ RH−1, response time of 6 s, recovery time of 10 s, and stability of 80 days. The sensing mechanism is explained based on competitive interaction, cooperative solubility, and ionization between the ammonia and water molecules.Conflicts of interest
Authors have no conflict of interest to declare.Acknowledgements
The authors are thankful to the Principal, Bhaskaracharya College of Applied Sciences, University of Delhi, Delhi-110075, for encouragement and permission to work in the college laboratory. Mr Sandeep Kumar is also thankful to the Ministry of Tribal Affairs, Government of India, for granting a research fellowship with award number 202122-NFST-BIH-00019.References
- A. T. Güntner, S. Abegg, K. Königstein, P. A. Gerber, A. Schmidt-Trucksäss and S. E. Pratsinis, Breath Sensors for Health Monitoring, ACS Sens., 2019, 4, 268–280 CrossRef PubMed.
- M. Alonso and J. M. Sanchez, Analytical Challenges in Breath Analysis and Its Application to Exposure Monitoring, TrAC, Trends Anal. Chem., 2013, 44, 78–89 CrossRef CAS.
- T. He, F. Wen, Y. Yang, X. Le, W. Liu and C. Lee, Emerging Wearable Chemical Sensors Enabling Advanced Integrated Systems toward Personalized and Preventive Medicine, Anal. Chem., 2023, 95, 490–514 CrossRef CAS PubMed.
- X. Li, Z. An, Y. Lu, J. Shan, H. Xing, G. Liu, Z. Shi, Y. He, Q. Chen, R. P. S. Han, D. Wang, J. Jiang, F. Zhang and Q. Liu, Room Temperature VOCs Sensing with Termination-Modified Ti3C2Tx MXene for Wearable Exhaled Breath Monitoring, Adv. Mater. Technol., 2022, 7, 2100872 CrossRef CAS.
- L. Sun, S. S. Park, D. Sheberla and M. Dincǎ, Measuring and Reporting Electrical Conductivity in Metal-Organic Frameworks: Cd2(TTFTB) as a Case Study, J. Am. Chem. Soc., 2016, 138, 14772–14782 CrossRef CAS.
- L. Yang, G. Zheng, Y. Cao, C. Meng, Y. Li, H. Ji, X. Chen, G. Niu, J. Yan, Y. Xue and H. Cheng, Moisture-Resistant, Stretchable NOx Gas Sensors Based on Laser-Induced Graphene for Environmental Monitoring and Breath Analysis, Microsyst. Nanoeng., 2022, 8, 1–12 CrossRef.
- E. N. Vasina, P. Greer, D. Thwaites, T. Kron and J. Lehmann, A System for Real-Time Monitoring of Breath-Hold via Assessment of Internal Anatomy in Tangential Breast Radiotherapy, J. Appl. Clin. Med. Phys., 2022, 23, e13473 CrossRef PubMed.
- M. Righettoni, A. Ragnoni, A. T. Güntner, C. Loccioni, S. E. Pratsinis and T. H. Risby, Monitoring breath markers under controlled conditions, J. Breath Res., 2015, 9(4), 047101 CrossRef PubMed.
- L. Liu, T. Fei, X. Guan, H. Zhao and T. Zhang, Humidity-Activated Ammonia Sensor with Excellent Selectivity for Exhaled Breath Analysis, Sens. Actuators, B, 2021, 334, 129625 CrossRef CAS.
- F. Q. Al-Khalidi, R. Saatchi, D. Burke, H. Elphick and S. Tan, Respiration Rate Monitoring Methods: A Review, Pediatr. Pulmonol., 2011, 46, 523–529 CrossRef CAS.
- H. Liu, C. Wang, C. Li, Y. Qin, Z. Wang, F. Yang, Z. Li and J. Wang, A Functional Chitosan-Based Hydrogel as a Wound Dressing and Drug Delivery System in the Treatment of Wound Healing, RSC Adv., 2018, 8, 7533–7549 RSC.
- S. Chen, H. Xia and Q. Q. Ni, Continuously Expandable, Wearable Breath Moisture-Induced Electricity Generator, Carbon, 2022, 194, 104–113 CrossRef CAS.
- S. Zou, L. Q. Tao, G. Wang, C. Zhu, Z. Peng, H. Sun, Y. Li, Y. Wei and T. L. Ren, Humidity-Based Human-Machine Interaction System for Healthcare Applications, ACS Appl. Mater. Interfaces, 2022, 14, 12606–12616 CrossRef CAS.
- M. Zhang, K. Liu, J. Xu, P. Wang, J. Sun, W. Ding, C. Wang and K. Zhang, Porous Oxide-Functionalized Seaweed Fabric as a Flexible Breath Sensor for Noninvasive Nephropathy Diagnosis, ACS Sens., 2022, 7, 2634–2644 CrossRef CAS PubMed.
- C. Liu, Z. Duan, B. Zhang, Y. Zhao, Z. Yuan, Y. Zhang, Y. Wu, Y. Jiang and H. Tai, Local Gaussian Process Regression with Small Sample Data for Temperature and Humidity Compensation of Polyaniline-Cerium Dioxide NH3 Sensor, Sens. Actuators, B, 2023, 378, 133113 CrossRef CAS.
- İ. Solak, S. Gençer, B. Yıldırım, E. Öznur, D. Hah and K. Icoz, Respiration Monitoring Using a Paper-Based Wearable Humidity Sensor, a Step Forward to Clinical Tests, Sens. Actuators, A, 2023, 355, 114316 CrossRef.
- D. Feng, H. Zheng, H. Sun, J. Li, J. Xi, L. Deng, Y. Guo, B. Jiang and J. Zhao, SnO2/Polyvinyl Alcohol Nanofibers Wrapped Tilted Fiber Grating for High-Sensitive Humidity Sensing and Fast Human Breath Monitoring, Sens. Actuators, B, 2023, 388, 133807 CrossRef CAS.
- N. S. Abbas and S. K. Shukla, Contemporary Advances in Humidity Sensing Materials, Methods, and Performances, Adv. Mater. Lett., 2021, 12, 1–13 CrossRef.
- C. S. Kushwaha, P. Singh, S. K. Shukla and G. C. Dubey, Humidity-Mediated Conversion of Hydration Energy into Electricity Over Copper Oxide Nanorods and Polyaniline Metal–Organic Framework, J. Electron. Mater., 2023, 52, 1785–1793 CrossRef CAS.
- Z. Duan, Z. Yuan, Y. Jiang, Q. Zhao, Q. Huang, Y. Zhang, B. Liu and H. Tai, Power Generation Humidity Sensor Based on Primary Battery Structure, Chem. Eng. J., 2022, 446, 136910 CrossRef CAS.
- Q. Zhao, Z. Duan, Y. Wu, B. Liu, Z. Yuan, Y. Jiang and H. Tai, Facile Primary Battery-Based Humidity Sensor for Multifunctional Application, Sens. Actuators, B, 2022, 370, 132369 CrossRef CAS.
- Y. Zhang, Y. Wu, Z. Duan, B. Liu, Q. Zhao, Z. Yuan, S. Li, J. Liang, Y. Jiang and H. Tai, High Performance Humidity Sensor Based on 3D Mesoporous Co3O4 Hollow Polyhedron for Multifunctional Applications, Appl. Surf. Sci., 2022, 585, 152698 CrossRef CAS.
- S. K. Shukla, Synthesis and Characterization of Polypyrrole Grafted Cellulose for Humidity Sensing, Int. J. Biol. Macromol., 2013, 62, 531–536 CrossRef CAS PubMed.
- S. K. Shukla, S. K. Shukla, P. P. Govender and E. S. Agorku, A Resistive Type Humidity Sensor Based on Crystalline Tin Oxide Nanoparticles Encapsulated in Polyaniline Matrix, Microchim. Acta, 2016, 183, 573–580 CrossRef CAS.
- P. Singh and S. K. Shukla, Structurally Optimized Cupric Oxide/Polyaniline Nanocomposites for Efficient Humidity Sensing, Surf. Interfaces, 2020, 18, 100410 CrossRef CAS.
- B. Deshkulkarni, L. R. Viannie, S. V. Ganachari, N. R. Banapurmath and A. Shettar, Humidity Sensing Using Polyaniline/Polyvinyl Alcohol Nanocomposite Blend, in IOP Conference Series: Materials Science and Engineering, 2018, vol. 376 Search PubMed.
- B. Chen, J. R. G. Evans, H. C. Greenwell, P. Boulet, P. V. Coveney, A. A. Bowden and A. Whiting, A Critical Appraisal of Polymer–Clay Nanocomposite, Chem. Soc. Rev., 2008, 37, 568–594 RSC.
- K. Miyazaki, M. Hieda and T. Kato, Development of a Novel Manganese Oxide−Clay Humidity Sensor, Ind. Eng. Chem. Res., 1997, 36, 88–91 CrossRef CAS.
- Z. Duan, Q. Zhao, S. Wang, Q. Huang, Z. Yuan, Y. Zhang, Y. Jiang and H. Tai, Halloysite Nanotubes: Natural, Environmental-Friendly and Low-Cost Nanomaterials for High-Performance Humidity Sensor, Sens. Actuators, B, 2020, 317, 128204 CrossRef CAS.
- R. Rothon, China Clay or Kaolin, in Fillers for Polymer Applications. Polymers and Polymeric Composites: A Reference Series, ed. R. Rothon, Springer, Cham, 2017, pp. 161–175 Search PubMed.
- M. Günay, M. K. Erdoğan, M. Karakışla and M. Saçak, Hydrophobic Modification of Kaolinite by Coating with the Conductive Polythiophene and Investigation of the Usability as the Environmental-Based Sensors, Chem. Pap., 2021, 75, 123–137 CrossRef.
- X. Duan, Z. Duan, Y. Zhang, B. Liu, X. Li, Q. Zhao, Z. Yuan, Y. Jiang and H. Tai, Enhanced NH3 Sensing Performance of Polyaniline via a Facile Morphology Modification Strategy, Sens. Actuators, B, 2022, 369, 132302 CrossRef CAS.
- N. Van Duy, D. T. T. Trang, D. T. T. Le, C. M. Hung, M. Tonezzer, H. Nguyen and N. D. Hoa, Enhancement of NH3 Gas Sensing with Ag-Pt Co-Catalyst on SnO2 Nanofilm towards Medical Diagnosis, Thin Solid Films, 2023, 767, 139682 CrossRef CAS.
- M. Kamalabadi, A. Ghoorchian, K. Derakhshandeh, M. Gholyaf and M. Ravan, Design and Fabrication of a Gas Sensor Based on a Polypyrrole/Silver Nanoparticle Film for the Detection of Ammonia in Exhaled Breath of COVID-19 Patients Suffering from Acute Kidney Injury, Anal. Chem., 2022, 94, 16290–16298 CrossRef CAS PubMed.
- H. Wu, X. Gong, W. Tao, L. Zhao, T. Wang, F. Liu, X. Yan, P. Sun and G. Lu, Humidity-Activated Ammonia Sensor Based on Mesoporous AlOOH towards Breath Diagnosis, Sens. Actuators, B, 2023, 380, 133322 CrossRef CAS.
- S. K. Shukla, C. S. Kushwaha, A. Shukla and G. C. Dubey, Integrated Approach for Efficient Humidity Sensing over Zinc Oxide and Polypyrole Composite, Mater. Sci. Eng., C, 2018, 90, 325–332 CrossRef CAS PubMed.
- V. K. Singh, C. S. Kushwaha and S. K. Shukla, Potentiometric Detection of Copper Ion Using Chitin Grafted Polyaniline Electrode, Int. J. Biol. Macromol., 2020, 147, 250–257 CrossRef CAS PubMed.
- S. K. Shukla and Others, Preparation and Characterization of Rice Husk Derived Cellulose and Polyvinyl Alcohol Blended Heat Sealable Packaging Film, Indian J. Chem. Technol., 2022, 28, 453–459 Search PubMed.
- S. Kumar and S. K. Shukla, Synergistic Evolution of Flame-Retardant Hybrid Structure of Poly Vinyl Alcohol, Starch and Kaolin for Coating on Wooden Substrate, J. Polym. Res., 2023, 30, 1–11 CrossRef.
- S. K. Shukla, Vamakshi, Minakshi, A. Bharadavaja, A. Shekhar and A. Tiwari, Fabrication of electro-chemical humidity sensor based on zinc oxide/polyaniline nano composite, Adv. Mater. Lett., 2012, 3(5), 421–425 CrossRef.
- P. Singh, C. S. Kushwaha, S. K. Shukla and G. C. Dubey, Synthesis and Humidity Sensing Properties of NiO Intercalated Polyaniline Nanocomposite, Polym.-Plast. Technol. Mater., 2019, 58, 139–147 CAS.
- S. K. Shukla, A. Bharadvaja, A. Tiwari, G. K. Parashar and G. C. Dubey, Synthesis and Characterization of Highly Crystalline Polyaniline Film Promising for Humid Sensor, Adv. Mater. Lett., 2010, 1, 129–134 CrossRef CAS.
- H. S. Mansur, C. M. Sadahira, A. N. Souza and A. A. P. Mansur, FTIR Spectroscopy Characterization of Poly (Vinyl Alcohol) Hydrogel with Different Hydrolysis Degree and Chemically Crosslinked with Glutaraldehyde, Mater. Sci. Eng., C, 2008, 28, 539–548 CrossRef CAS.
- M. Trchová and J. Stejskal, Polyaniline: The Infrared Spectroscopy of Conducting Polymer Nanotubes (IUPAC Technical Report), Pure Appl. Chem., 2011, 83, 1803–1817 CrossRef.
- J. M. Guerrero, A. Carrillo, M. L. Mota, R. C. Ambrosio and F. S. Aguirre, Purification and Glutaraldehyde Activation Study on HCl-Doped PVA–PANI Copolymers with Different Aniline Concentrations, Molecules, 2018, 24, 63 CrossRef PubMed.
- A. Tironi, M. A. Trezza, E. F. Irassar and A. N. Scian, Thermal Treatment of Kaolin: Effect on the Pozzolanic Activity, Procedia Mater. Sci., 2012, 1, 343–350 CrossRef CAS.
- C. S. Kushwaha, N. S. Abbas and S. K. Shukla, Chemically Functionalized CuO/Sodium Alginate Grafted Polyaniline for Nonenzymatic Potentiometric Detection of Chlorpyrifos, Int. J. Biol. Macromol., 2022, 217, 902–909 CrossRef CAS.
- D. Sharma, M. K. Varshney, S. Prasad, Bhawana and S. K. Shukla, Preparation and Characterization of Rice Husk Derived Cellulose and Polyvinyl Alcohol Blended Heat Sealable Packaging Film, Indian J. Chem. Technol., 2021, 28, 453–459 CAS.
- N. Agmon, The Grotthuss Mechanism, Chem. Phys. Lett., 1995, 244, 456–462 CrossRef CAS.
- B. A. J. Lechner, Y. Kim, P. J. Feibelman, G. Henkelman, H. Kang and M. Salmeron, Solvation and Reaction of Ammonia in Molecularly Thin Water Films, J. Phys. Chem. C, 2015, 119, 23052–23058 CrossRef CAS.
- H. Farahani, R. Wagiran and M. N. Hamidon, Humidity Sensors Principle, Mechanism, and Fabrication Technologies: A Comprehensive Review, Sensors, 2014, 14, 7881–7939 CrossRef.
Footnote |
| † Electronic supplementary information (ESI) available. See DOI: https://doi.org/10.1039/d3sd00067b |
| This journal is © The Royal Society of Chemistry 2023 |

