
 Open Access Article
 This Open Access Article is licensed under a Creative Commons Attribution-Non Commercial 3.0 Unported Licence
Integrated microfluidic devices for point-of-care detection of bio-analytes and disease
Prateechee Padma
Behera†
a,
Natish
Kumar†
b,
Monika
Kumari
b,
Sumit
Kumar
 c,
Pranab Kumar
Mondal
a and
Ravi Kumar
Arun
*b
c,
Pranab Kumar
Mondal
a and
Ravi Kumar
Arun
*b
aDepartment of Mechanical Engineering, Indian Institute of Technology, Kamrup, Guwahati, Assam 783019, India
bDepartment of Chemical Engineering, Indian Institute of Technology, Jagti, NH-44, Jammu-181221, India. E-mail: ravi.arun@iitjammu.ac.in
cFaculty of Mechanical Engineering, Technion-Israel Institute of Technology, Haifa-3200003, Israel
First published on 12th October 2023
Abstract
Micro- and nanofluidics have enabled the possibility of miniaturized analytical systems, which are commonly known as lab-on-a-chip (LOC) devices. One of the clear benefits of these microfluidic devices is the ‘sample-in-answer-out’ system, in which the input is a whole/minimally processed biological sample, and the output is a qualitative or quantitative diagnosis of biomarkers of disease or bio-analyte of interest. All the clinical protocols could be integrated into a well-designed LOC device, such as sample pre-treatment, sample/reagent manipulation, separation, reaction, and detection. Microfluidics and nanofluidics interactions revolutionize lab-on-a-chip diagnostics, offering cost-effective alternatives to clinical setups. This article looks at bioanalysis that uses fully integrated microfluidic devices and optical and electrochemical methods like amperometry, potentiometry, cyclic voltammetry, and electrical impedance spectroscopy. These technologies diagnose autoimmune diseases (rheumatoid arthritis, multiple sclerosis, type 1 diabetes, and Addison's disease), acute nutritional deficiencies (iron, vitamin A, D, B12, C, and K), and pharmacological response biomarkers. The purpose of this review is to examine the utility of microfluidics in the detection of biomarkers. Our analysis highlights the potential of microfluidic technologies to transform diagnostics and personalized healthcare by addressing existing issues and proposing new solutions. These systems address sensitive, rapid, and sample volume limits with their sophisticated design and accuracy in managing micro fluid volumes. The present review thoroughly summarizes the qualitative and quantitative characteristics of the diagnostic assay, enabling the biomarker to be found at the appropriate sensitivity levels with a modest analysis time and cost. The study presents an interdisciplinary perspective on modern diagnostics, which could revolutionize healthcare by enabling precise disease identification and management.
1. Introduction
The integration of microfluidics and diagnostics in recent years has led to an era of innovation in healthcare, transforming bioanalysis and disease detection.1 Microfluidics has been widely recognized as the main driving force for the paradigm shift in four key domains: molecular analysis, biodefense, molecular biology, and microelectronics. The incorporation of microfluidic elements onto a singular chip has resulted in the emergence of lab-on-a-chip (LOC), micro total analysis systems (μTAS), and point-of-care (POC) diagnostic devices.2 Integrated microfluidic devices are powerful tools for rapid, sensitive, and portable point-of-care (POC) detection of bio-analytes and disease biomarkers.3,4The chemical and biological processes occur on a much larger scale in conventional laboratories. To scale down the equipment to the length of the reaction was a wise thing to do. On such a small scale, flow physics works differently. This needs to scale down the processes, thus paving the way for microfluidics and nanofluidics.5,6 Recent technology has achieved analytical/antigen detection, drug delivery, bio-synthesis, food safety, etc. The property of paper to wick fluids has been exploited to detect various biomarkers of diseases and nutrient deficiencies.7,8 The introduction of POC testing into the healthcare system has helped in the early detection of diseases, regular monitoring, and blocking many redundant practices. POC devices help analyze minimal volumes of bodily fluids, like whole blood, saliva, and urine.9 The smaller size aids in proper disposal of the device after use in cases of contagious diseases. With the help of electrochemical methods, the sensor's sensitivity can be improved to the range of pg mL−1.10–12 Further addition of nanotubes, nanowires, nanofluids, and nanorods enhances the quantification of the signal from POC devices. Most POC devices have the potential to meet the clinical requirements at the global level, but the challenge of standardization remains a problem.13–15
Analytes like proteins, DNA/RNA, antibodies, antigens, or other metabolic compounds in the body could be examined as biomarkers to provide information about diseases or the physiological status of the patient. Monitoring, diagnosis, and risk assessments of diseases are made possible by recognizing and measuring these biomarkers.4,15 In research, detecting biomarkers is the gold standard for identifying various diseases, from acute nutritional deficiencies to pathogenic infections, including cancer. Commonly used methods include polymerase chain reaction (PCR), western blotting, immunofluorescence, and enzyme-linked immunosorbent assay (ELISA).16,17 However, such analyses are tedious, time-consuming, need large amounts of samples and reagents, and depend on costly, heavy equipment.18 One major issue that earlier researchers pointed out is the need for more research in multiplexing or the simultaneous detection of multiple biomarkers. Multiple biomarkers can be analyzed simultaneously to provide a deeper understanding of diseases and enable more precise medical diagnosis.19 These limitations restricted affordable healthcare approaches, particularly in rural and developing regions. Therefore, there is an urgent need for simple, cost-effective, portable diagnostic solutions, especially microfluidics-based point-of-care (POC) devices, which have the potential to detect and monitor disease biomarkers, even in limited resource settings.17,20,21
This multidisciplinary microfluidics approach has resulted in groundbreaking findings with the potential to transform conventional diagnostic techniques and enhance patient care on a worldwide scale.15,22 This advancement has opened the way for the design and manufacture of highly efficient miniaturized systems capable of carrying out complex analytical tasks with small sample quantities, including pretreatment, dilution, mixing, chemical reactions, separation, detection, and product extraction of samples, while also significantly cutting down on the time required compared to traditional laboratory techniques.23–25 These capabilities are promising for point-of-care applications and lab-on-a-chip technologies, especially in the quick and sensitive identification of disease-specific biomarkers.6,21
In recent years, Song et al. presented a microfluidic approach to investigate the effect of macrophages on tumor cell invasion into the surrounding stroma in the presence of interstitial flow. This device has four parallel connected microchannels and could be flexibly used to build a more biomimetic breast cancer microenvironment, containing tumor aggregates, monocytes, macrophages and endothelial cells cultured in a 3D collagen matrix.26 Further, a group of researchers has developed a high-throughput nucleic acid isothermal amplification system that can detect 19 common respiratory viruses (including SARS-CoV-2) from 16 clinical samples in 90 min.27
Using biomarkers for early identification of diseases and monitoring progression is difficult due to low biomarker concentration that affect downstream analysis. To enhance the extraction of biomarkers from biological matrices, novel techniques need to be developed. Liquid biopsies, which utilize physiological fluids like blood, saliva, and urine and are less invasive than solid tissue samples, are currently used in clinical procedures for early disease identification.15 However, the complex composition and limited presence of these biomarkers in samples can lead to analysis errors, requiring enrichment protocols to improve the sensing capabilities of analytical techniques.28,29 Microfluidic devices enable on-chip point-of-care diagnosis and real-time monitoring, detecting biomarkers for conditions like autoimmune disorders and acute nutrient deficiencies.30
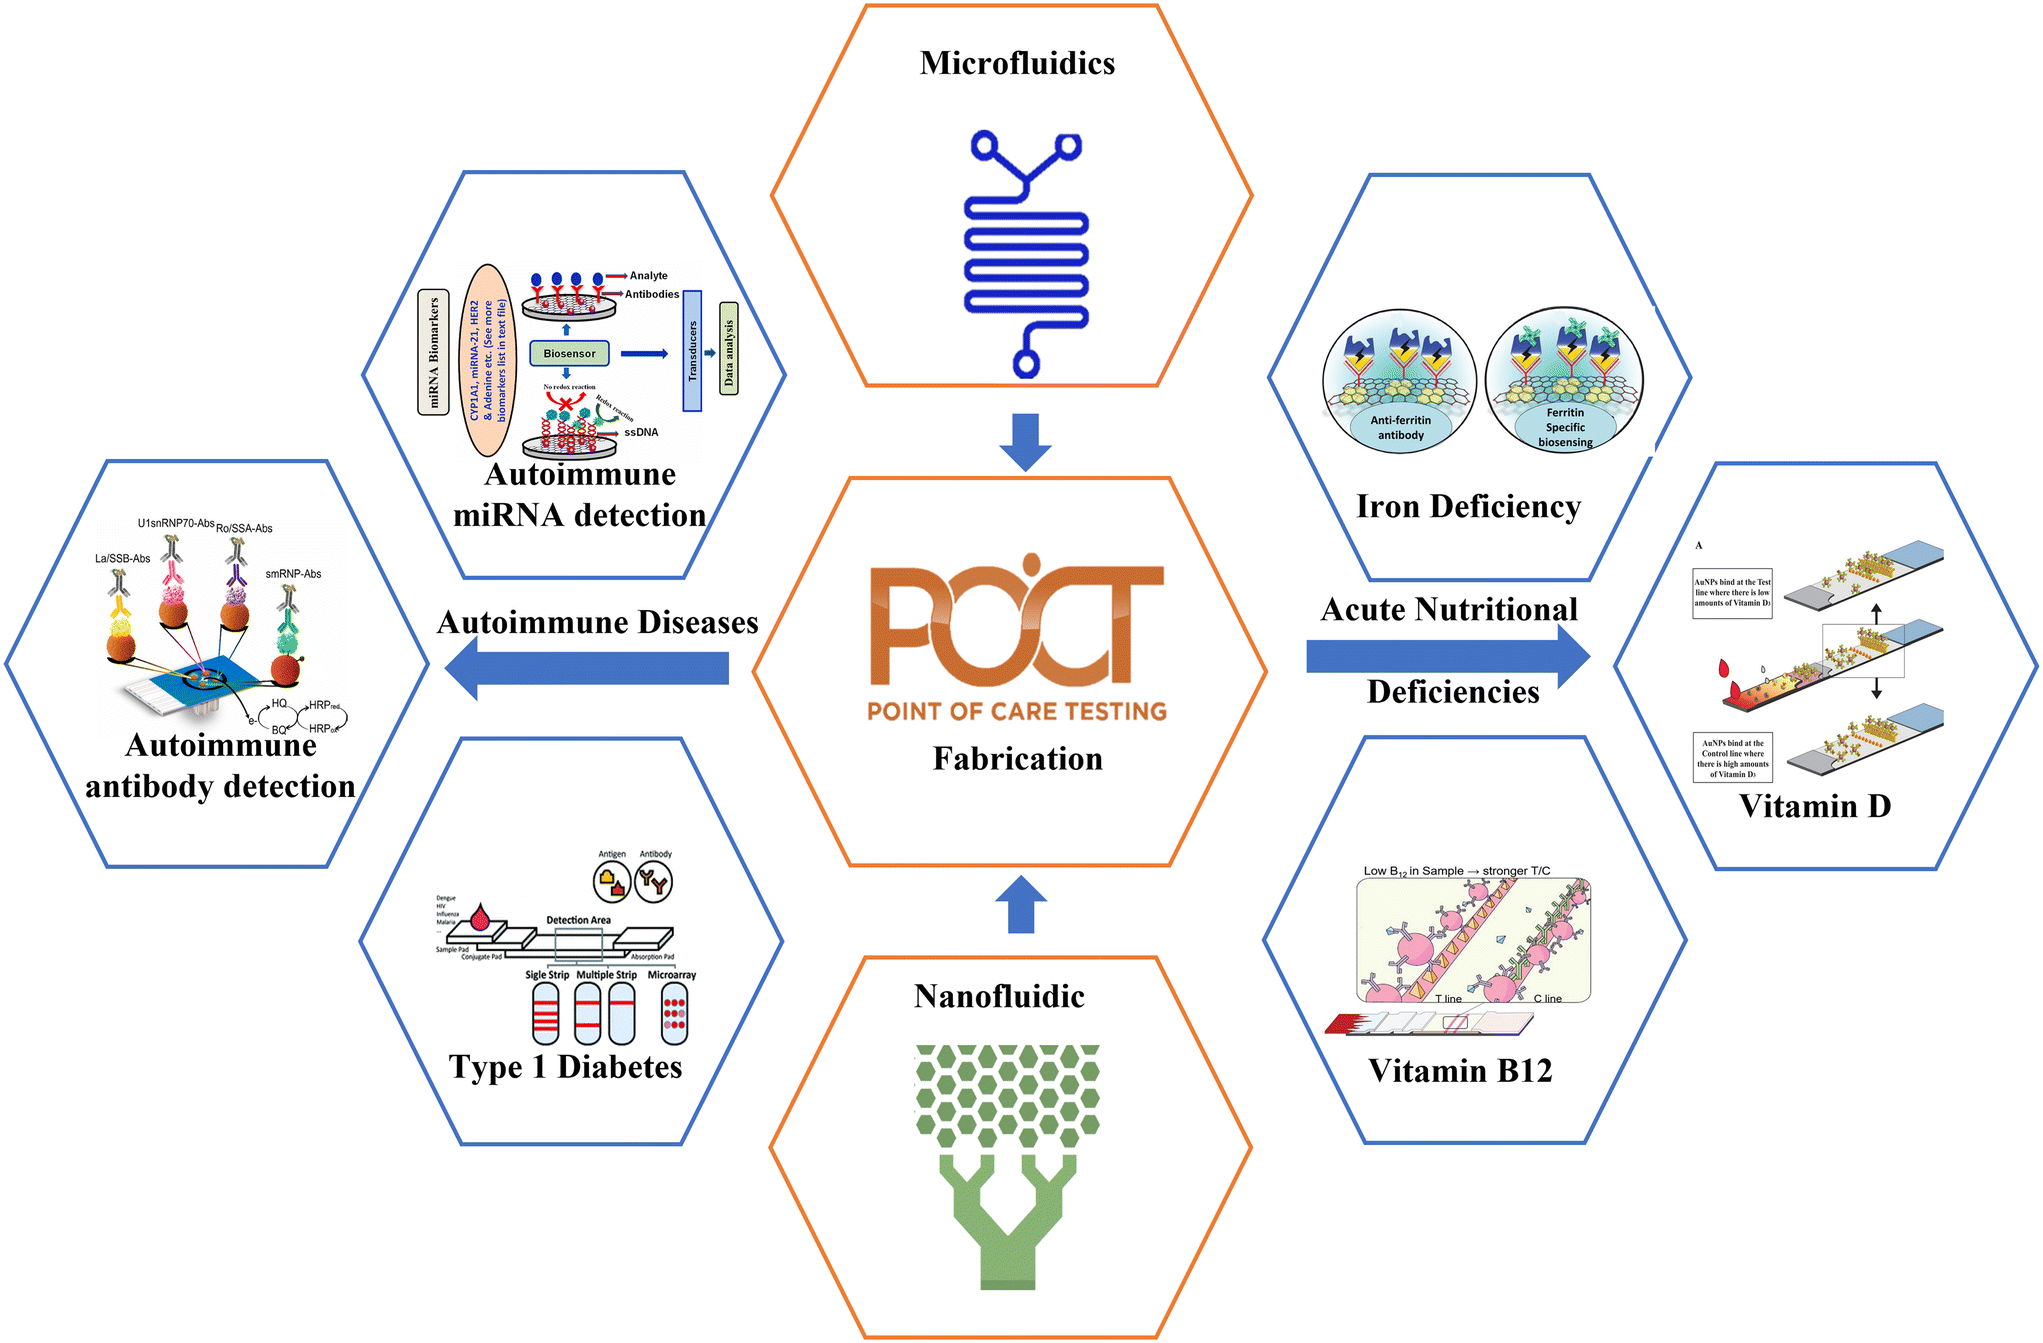
This study provides an in-depth review of integrated microfluidic devices for bioanalysis, emphasizing their potential uses in point-of-care (POC) diagnostics. The paper contributes significantly to the ongoing development of healthcare diagnostics, paving the way for better patient care and outcomes by thoroughly investigating optical and electrochemical methods, amperometry, potentiometry, cyclic voltammetry, and electrical impedance spectroscopy analysis. Microfluidic devices for POC diagnostics enhance understanding and promote translational research. This study focuses on integrated point-of-care microfluidics platforms to diagnose autoimmune diseases (including rheumatoid arthritis, multiple sclerosis, type 1 diabetes, and Addison's disease), acute nutritional deficiencies (like iron, vitamins A, D, B12, C, and K), and pharmacological response biomarkers. Additionally, this paper summarizes about the recent advancement in microfluidic devices for POC diagnostics to drive future research. Integrated microfluidics improves patient outcomes by detecting diseases at the early stage. Health benefits are visible when biomarkers are identified and diagnosed at the point of care so that quick decisions can be made and personalized treatments can be administered.
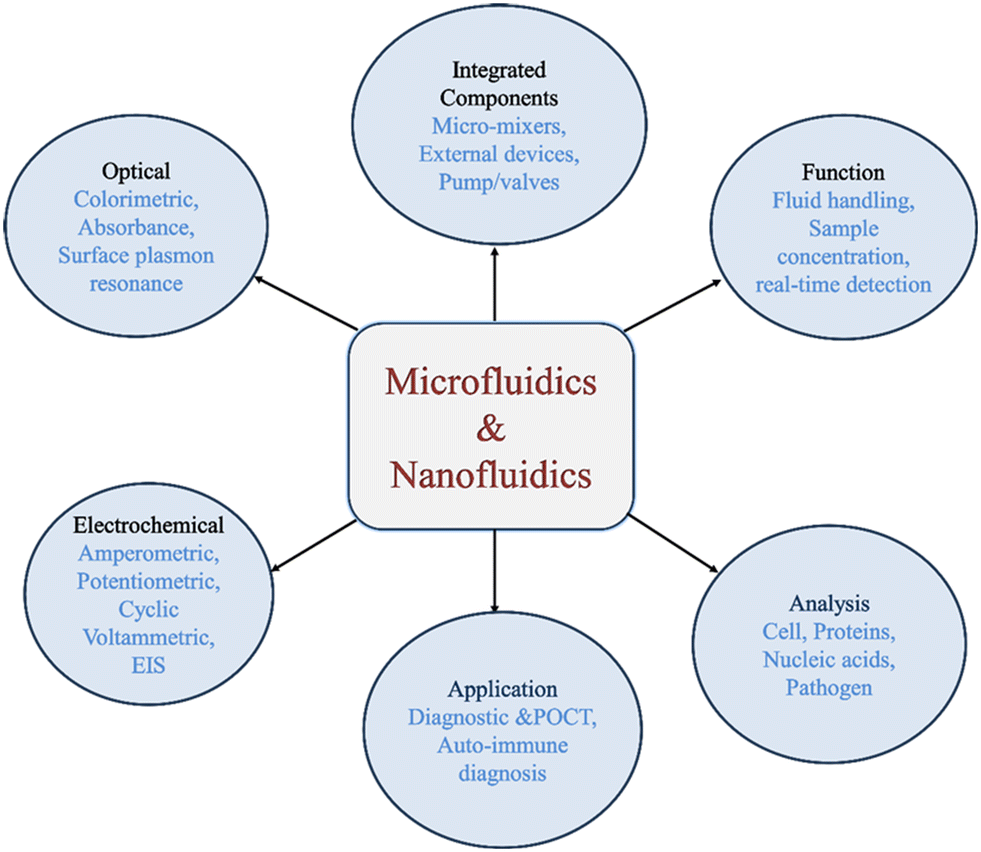
2. Microfluidics and nanofluidics: next-gen point-of-care lab-on-a-chip devices
2.1. Microfluidics
1950s saw the rise in miniaturization with integrated circuits and photolithography (yes, it is way older than microfluidics). Jay Andrus patented the technique of photoengraving to create finer details that allowed for semiconductor devices.31 Further, this process was widely used and known as photolithography. Inkjet printing has a significant influence on the microfluidics industry. In 1879, Lord Rayleigh explained how a falling, continuous fluid stream breaks into droplets to minimize surface area.32 Later, many researchers used the phenomena to fabricate an array of inkjet nozzles over an individual silicon wafer. As time progressed, researchers turned their attention to molecular analysis. The late 20th century saw the rise of polydimethylsiloxane (PDMS) as the base material for the fabrication of microchannels. A wide range of microfluidic platforms gave rise to many new functionalities – droplet microfluidics,33 paper analytical devices,34 organ-on-a-chip,35 and open microfluidics.20 Technology has scaled to the microscale to facilitate molecular biology, molecular analysis, and microelectronics.36 Microfluidics helps in achieving a high surface area-to-volume ratio. This makes the microchannel feasible to handle and process only a small volume of liquid i.e., a few microliters. Using microscale, fluid can be relatively easily manipulated using many kinds of external fields (electric, magnetic, pressure, capillary, and so on). Several microfluidic channels can be integrated into a single chip, and parallel observations and analyses can be performed simultaneously. These channels are made of PDMS, acrylic, glass, etc., and can be easily visualized under a microscope owing to the transparency of the materials.37 This technology has gained enormous attention on account of rapid developments in biotechnology and medicine as detection and manipulation at a cellular length scale with minimum reagent volume is advantageous. Advancements in bio-analyte and disease biomarker identification are explained in Fig. 1. The ease of going micro helps in the fundamental studies of physical, chemical, and biological processes and makes the system portable and inexpensive.38,39 Fluids, especially liquids, can be considered continuous in tiny devices and geometries and well-established continuum approaches can be used for flow analysis. To obtain the required governing equations – the fluid flow, heat transfer, and other related physical phenomena in any system are modeled by applying conservation laws of mass, momentum, energy, and species.40 These equations, usually in the form of partial differential equations, define the physics of the problem. The detailed approach has been mentioned in various fluid mechanics textbooks.41,42 Dimensionless numbers are often used to characterize fluid regimes in fluidics. Reynolds number (Re) is the ratio of inertial forces to viscous forces,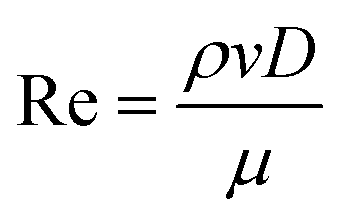 , where v is the velocity in the microchannel (m s−1), D is the characteristic dimension of the microchannel (m) and ρ is the density of the fluid (kg m−3). In microfluidics, Re < 2300 and is typically laminar.37 The low Re flow regime of microsystems is called creeping flow or Stokes flow.
 | ||
| Fig. 1 Schematic illustration of quantitative and qualitative identification of bio-analytes and disease biomarkers; these innovative devices revolutionize diagnostic capabilities, enhancing accessibility and efficiency in healthcare settings. | ||
This term describes the behavior of fluids in microsystems, where viscosity plays a more significant role than inertia. In macroscopic fluids, mixing occurs convectively, where inertia dominates over viscosity. However, in microsystems, when two fluid streams meet in a microchannel, they flow in parallel without any eddies or turbulence. In such a scenario, mixing happens due to the diffusion of molecules across the interface between the two fluids. This phenomenon plays a crucial role in microfluidics, where precise control over mixing is essential for various applications. By understanding the behavior of fluids in microsystems, researchers and engineers can design and optimize microfluidic devices for various applications. Microscale systems require special machines or attachments to mix two fluids. In micro/nano-fluidics, the surface area-associated quantities are of utmost importance. Specifically, pressure and shear forces become dominant due to the small scale of the system.43 Additionally, the capillary effect, a surface effect, is particularly prominent in microchannels with a bore diameter equal to or less than 50 μm. This effect is a result of the smaller size of the channels and the high surface-to-volume ratio of the components. As a result of this ratio, heat transfer occurs rapidly, facilitated by the low thermal mass of the system.44
2.2. Exploring nanofluidics and its contrast from microfluidics
Nanofluidics deals with nanometric scale fluid flow behavior where one characteristic length is at least 1–800 nm.15 This is the most miniature possible length scale in which fluid flow can be manipulated and visualized owing to the state-of-the-art technologies.45 New and unusual physical phenomena and mechanisms are observed at the nanoscale which is different from micro-and macroscale physics. The extra-large surface area to volume ratio (compared to microfluidics) causes a challenge as the wall's proximity and surface characteristics pose a problem in describing accurately the fluid flow and particle dynamics. While most gaseous and liquid microflows are described by continuum mechanics theory (or quasi-continuum, adding velocity slip and temperature jump models), nanofluidics exhibits anomalous behavior.46 As a result, the surface characteristics are amplified, and fluid properties such as density and viscosity may fluctuate over interatomic distances. Although microscale material properties are the same as macro scale, the same nanomaterial may exhibit different thermal and electric conduction, optical behavior, and surface reactions, often due to rearranged lattice atoms or molecules.43 Like microfluidics, nanofluidics systems also include supply reservoirs, flow conduits, passive or active pumps, actuators, valves, sensors, heaters, etc.47Microfluidics and nanofluidics are interconnected fields focused on manipulating fluids at small scales. Microfluidics operates at the micrometer level and is associated with lab-on-a-chip devices, enabling precise control and rapid assays for applications like point-of-care diagnostics (Fig. 2).48–50 Nanofluidics takes this further, working at the nanometer scale (less than 100 nm) to manipulate molecules and explore molecular interactions.51 Despite their scale differences, both fields share foundational principles and techniques. Microfluidics serves as a basis for nanofluidics, allowing for the development of intricate nanostructures and the exploration of complex fluidic phenomena.52 The relationship between microfluidics and nanofluidics is characterized by their shared focus on fluid behavior at micro/nano scales, the increasing significance of surface effects, and their applications in various fields.53 The relationship leads to innovative applications, particularly in point-of-care diagnosis, where microfluidic and nanofluidic lab-on-a-chip devices are advancing healthcare and diagnostics.
 | ||
| Fig. 2 The amalgamation of nanofluidics and microfluidics has ushered in a new era of possibilities in healthcare. Through their innovative capabilities, these technologies drive advancements that promise enhanced precision, accessibility, and efficacy in diagnostics, treatments, and overall patient care. | ||
Because millifluidics, microfluidics, and nanofluidics are distinguished in different length scales, the dominating interactions in millifluidics and microfluidics include viscous drag, inertial force, interfacial tension, and capillary force, whereas electrostatic force, van der Waals attraction, hydrogen bonding, and steric repulsion become dominant in nanofluidics.48
DNA sequencing using nanofabrication, superhydrophobic surfaces, and carbon nanotubes are some of the revolutionary applications of nanofluidics. The application can be seen in a much more comprehensive range of nanometric objects, e.g., nanoparticles, DNAs, viruses, exosomes, lipid vesicles, and polymers.54,55 The advent of nanofluids and the suspension of nano-sized particles in a base fluid led to an increased reach of nanofluidics. These days, nanorods, nanofibers, nanowires, etc. can be seen as important constituents in various devices such as those used in water purification, biomedical applications, electronics, photonics, mechanics, etc.56,57 However, nanofluidics is in its infancy compared to microfluidics; nanochannels are ultrasmall confined spaces and most standard tools used in microfluidics are challenging to apply to the field of nanofluidics. This is anticipated as the phenomenon experienced at the nanoscale has yet to be understood entirely. To evaluate the underlying physics at the nanoscale, there should be a proper understanding of device dimensions, surface properties, ionic strength, etc.58,59
2.3. Point-of-care diagnosis
Advancements in microfluidics, nanotechnology, microelectromechanical systems (MEMS) technology, data analytics, and 3D printing have opened the doors for significant developments in diagnostics in resource-limited places. In such low-resource settings, testing the mass for diseases or infections can be achieved by emerging POC technologies. Strengthening the healthcare system is the best way to keep the population healthy and productive for a country's best interest.60 A large portion of the people in developing countries have no or very little access to appropriate healthcare. Tests that are performed at the decentralized level at the point of need or near the patient are called POC diagnoses. These require minimal training of the health care workers and are affordable and rapid in generating results. Although central clinical labs provide more accurate and sensitive results, they are labor-intensive, expensive, require specialized equipment, and have long patient wait times.61 With the help of POC test kits, preliminary screening can be done by a caregiver or the frontline nursing staff, reducing the burden on hospitals, and giving more time to focus on treatment. Rapid diagnosis will help in specific and effective treatment and contain the spread of infectious diseases.34,62 According to the World Health Organization (WHO), POC tests that address infectious disease control needs, especially for developing countries, should follow “ASSURED” criteria: 1) affordable, 2) sensitive, 3) specific, 4) user-friendly, 5) rapid and robust, 6) equipment-free and 7) deliverable to end-users.63 POC device settings include 1) a sample collection kit, 2) portable instrumentation with ready-to-use reagents to process the sample collected, 3) a reader to quantify the results, for example – a smartphone, and 4) minimally trained personnel.64 Lab-on-a-chip/disc (LOC/LOD) devices, lateral flow devices, microfluidic paper-based analytical devices (μPADS), etc., are the many types of POC devices.65,66 This sector has contributed to blood glucose level detection and cardiological analysis. Blood glucose monitoring POC devices have proved efficient in diabetes control and management among the vast population.67,68 Other high-end POC devices include blood pressure and oxygen measuring devices. Fig. 3 shows the current trends of POC.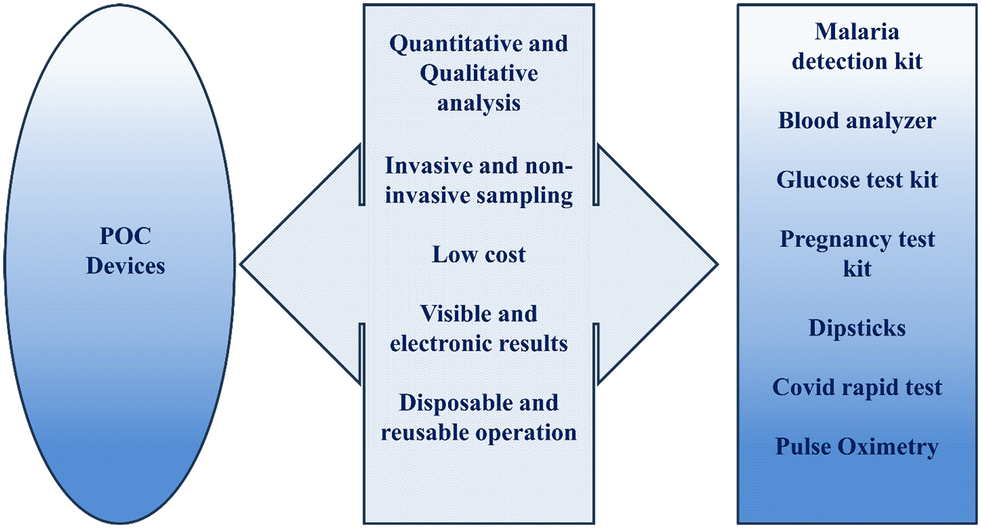 | ||
| Fig. 3 Current status of point-of-care diagnostic devices in the healthcare system with an update on the COVID-19 pandemic. POC devices are allocated according to the need and usage in different fields.68 | ||
Gou et al. developed a compact and affordable smartphone-integrated dPCR (digital polymerase chain reaction) device, coupled with a self-priming dPCR chip, which offers precise DNA quantification down to 10 copies and single-molecule detection, showing promise for POC applications.69 Cao et al. established a portable digital loop-mediated isothermal amplification (dLAMP) platform that integrates microscale hydrogel arrays for simplified DNA sample partitioning, enabling cost-effective and user-friendly absolute DNA quantification for potential point-of-care nucleic acid testing.70 Advances in miniaturized nucleic acid testing (NAT) are propelling the development of fully integrated, simplified, and high-sensitivity point-of-care NAT devices with digital readouts, showing potential for MARCHED (miniaturized, automatic, reagent-preloaded, commercialized, high-throughput, environment-independent, and disposable) applications.23 Recently, Gupta et al. introduced a novel spiral-shaped microfluidic device with a reduced graphene oxide-modified nanohybrid membrane for efficient urea filtration, mimicking the kidney's Glomerulus and showcasing the potential for organ-on-a-chip applications.71 POC devices that detect biological analytes offer rapid diagnostics even in resource-limited or remote healthcare settings. The seamless integration of POC devices with advanced technologies like fifth-generation wireless communications (5G) and the internet-of-things (IoT) can enable efficient healthcare solutions. The next-generation healthcare approach could become more patient-friendly and cost-effective with fast, low-latency internet connectivity, high bandwidth, cloud-based storage, and real-time computing capabilities. By combining microfluidic POC devices with mobile connectivity and cloud computing, remote disease monitoring and improved doctor-patient communication can be achieved.72
2.4. Lab-on-a-chip (LOC) devices
LOC is a small, integrated analytical platform that can perform multiple tasks in a single platform of only a few square millimeters up to centimeters in size. Combining fluidic channels and chambers with these platforms can achieve the miniaturization, integration, automation, and parallelization of a wide range of biochemical processes. Researchers have explored various enzyme-based biosensor technologies for biomolecule detection, motivated by advancements in analytical methodologies and the need for efficient, accurate, and economically viable alternatives.73 This means that multiple tests can be performed simultaneously, with each test providing reliable and accurate results. In addition, the LOC platform is designed to function as its full-scale counterpart, making it a highly efficient and cost-effective solution for various laboratory needs.74,75 Lateral flow assays (LFA) are an excellent modern-day example of lab-on-a-chip technology that brings sample preparation and analysis to a single platform. This technology combines the convenience of an analytical test strip with the versatility of a microfluidic device. The test strip is either enclosed in a cassette or can be made as a dipstick tube. On-chip storage of dry reagents is well-developed on an LFA. The signal detection of an LFA is either optically interpreted (HIV test kit, pregnancy test kit) or read out by a reader.76 These devices typically comprise a membrane, a sample pad, an absorbent pad, a conjugate pad, and a wicking pad. The sample is applied to the sample pad and then spread onto the absorbent pad by capillary action. When the sample meets the conjugate pad, a reaction takes place between the analyte and the antibody labeled with a dye or a marker. The reaction mixture then moves forward to the wicking pad, and the presence or absence of the analyte is detected by a visual signal. LFA technology has revolutionized the diagnostic field by providing precise, rapid, and low-cost results.76,773. Microfluidics: from clinical setups to lab-on-a-chip
3.1. Scaling down for qualitative and quantitative analysis
Scaling down clinical tests and processes is a breakthrough in diagnostics. Qualitative and quantitative analysis at the point-of-care setting can cut long hospital waiting times and lets professionals focus on serious patients first.78 The major limitation of laboratory tests is the long turn-around time. The patient must travel to the lab/hospital to have the blood drawn. The specimen is sent to specialized labs for testing and after that, the results are provided to the doctor. In such cases, the patient has to wait for a day or more for the results.79 In addition to this limitation, high cost, low test speed, complicated assay procedures, and requirement of skilled personnel prove that the lab-based test is not suitable for point-of-care settings or limited-resource settings.80The POCT technology can be divided into two categories: a) a small hand-held biosensor or an LFA (lateral flow assay) for the qualitative or quantitative determination of several analytes.81 For example – glucose biosensor strips82 and lateral flow strips to determine cardiac markers.82 b) Bench-top devices, which are essentially the instruments that are used in labs but are reduced in size and complexity. For example – the use of PCR to provide infectious disease testing in a sufficiently small device at the POC.83,84
3.2. Micro- and nanofluidic technology for a cost-effective accessible platform
Biosensors and point-of-care testing (POCT) technologies have become increasingly important in medical diagnostics. Fluidic systems are widely found across various scientific domains owing to their benefits in scaling down, creating distinctive instruments for disease detection, and isolating biomolecules.85 One of the key factors in achieving these objectives is using robust reagents and consumables in storage and usage. This can be accomplished through micro- and nanofluidics, which provide efficient throughput processing and enhance control of transport. By handling minimal volumes of reagents, biosensors and POCT technologies can be made more reliable and user-friendly. The ease of integration of detection on the same stage has also led to multiplexing on-site detection of different analytes from a single sample.86 The design and fabrication of a microfluidic platform are carefully addressed in the literature, taking its dimension, material, and method of fabrication into consideration which will, in turn, improve the biocompatibility of the device. In the early stages of a disease, biomarkers are found in lower concentrations, making it difficult to diagnose using conventional techniques. Here, using the present technology, ultra-sensitive modules can be fabricated.64 Movement of fluid on a micron-scale or less has a wide range of applications such as biomedicine, cell biology, bio-sensing, and chemical synthesis. Previously, only valves and pumps were used to drive working fluid into the microchannel, categorized as an enclosed microfluidic system. Later, they were categorized as continuous flow and droplet flow systems. The emerging digital microfluidics could achieve discrete droplet movement under electrical potential and a magnetic field could be achieved. Photolithographic fabrication of channels in a cleanroom increases the overall fabrication cost and contradicts the promise of lower experimental prices.40 To control the cost and bulky techniques, paper-based microfluidics involving open channels and capillary forces for liquid flow is gaining popularity. For mass detection in resource-limited settings, the target application for paper-based devices has been an inexpensive POCT technology.87 Martin and Synge used paper as a diagnostic platform to access chromatographic techniques which was later recognized for Nobel Prize in 1952.88,894. Bioanalysis by a fully integrated microfluidic device
4.1. Optical analysis
Optical analysis offers unique advantages to traditional analytical techniques in providing real-time detection and non-labeling of biological and chemical substances in a more sensitive, precise, and less expensive way. Optical biosensors are based on detecting visual signals produced by biological recognition by an analyte or biocatalytic or bio-affinitive reactions. These visual aids can be used to absorb light, appearance, light, Raman scattering (RS), and refractive index (RI) changes in the eye area that are known to occur due to specific biomolecular interactions.90 Optical biosensors are used in health care, environmental analysis, and biotechnology. These applications benefit from a wide range of applications, including low concentration and the required number of analyses, faster analysis termination, and reusable sensor chips.91 In general, two diagnostic procedures can be used for optical biosensing: fluorescence-based detection and label-free detection. In fluorescence-based detection, targeted molecules or biorecognition molecules are labeled with fluorescent markers, such as dyes; fluorescence intensity indicates the presence of targeted molecules and the potential for interaction between targeted molecules and biorecognition elements.92 There are a few studies done in the field of medicine and the environment. In one of the studies, gold nanoparticles (AuNPs) were attached to the tetanus antigen and taken from an experimental line-up with the structure of an AuNP-labelled tetanus antigen, tetanus antibody, and tetanus antigen.93This study employed an AuNP-based testing platform to detect tetanus antibody values. The test and control lines were prepared with human tetanus and antibodies for routine human tetanus. Then, samples containing tetanus antibodies were added to the sample pad, and subsequently, a red band with a mark can be seen in the test site in Fig. 4 due to the accumulation of AuNPs. The red band can also be seen in the control area, indicating the feasibility of the test line.93
 | ||
| Fig. 4 Schematic of AuNP-based lateral flow assay to detect tetanus antibodies. The illustration shows the migration of the AuNP–tetanus–tetanus antibody complex towards the test zone for colorimetric detection of tetanus antibody.93 | ||
4.2. Electrochemical analysis
For electrochemical analysis, the biosensor has an electrochemical transducer (Fig. 5A). The electrochemical transducer is classified as a chemical-modified-electrode (CME)93,94 as an electronic conducting, ionic conducting, or semi-conducting material treated with a bio-recognition element.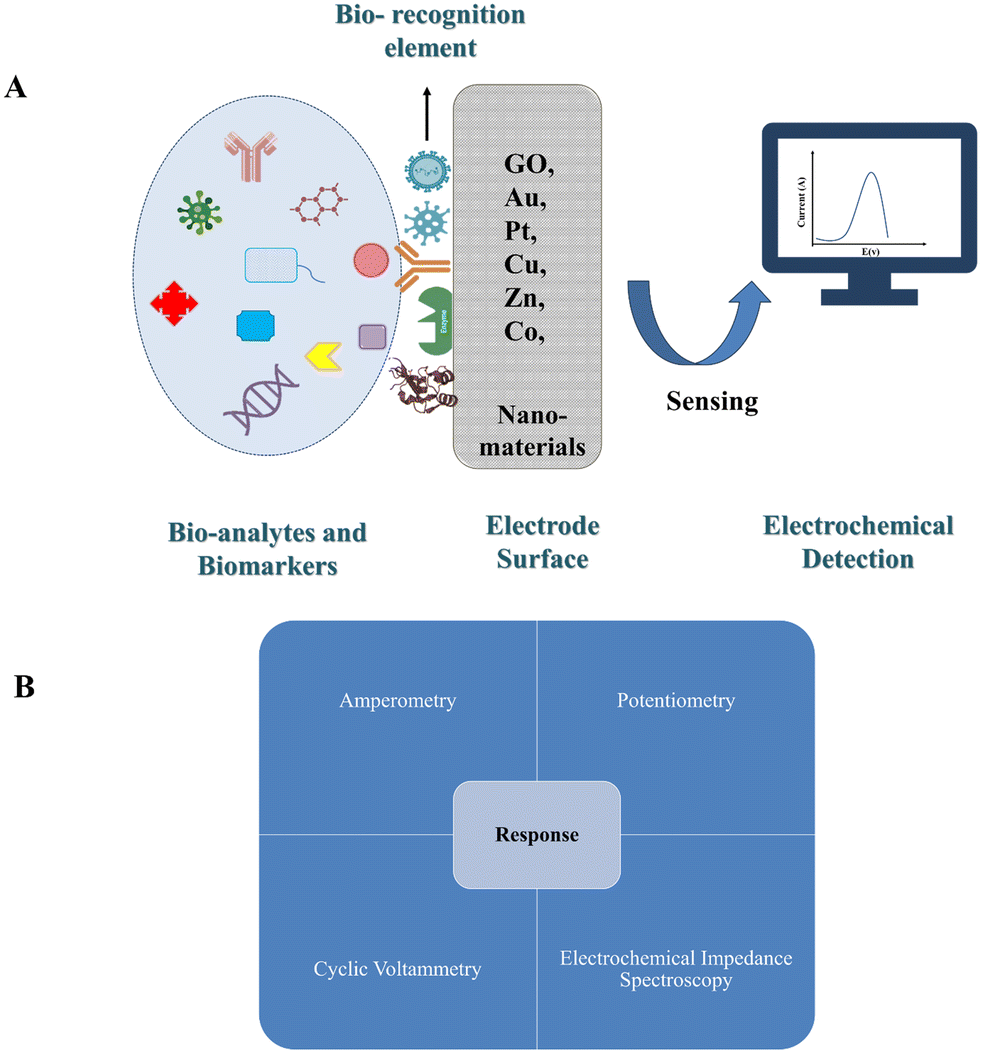 | ||
| Fig. 5 Schematic representation of (A) electrochemical biosensors and their components – bio-analytes and biomarkers, electrode surface which is modified with various nanomaterials and the sensing platform. (B) Type of electrochemical response: the various responses help in quantitative analysis by processing the response signals. | ||
Electrochemical analysis is the chemical sensory phase, where the electrode is used as the transducer element in which the analyte is located. The current generated from the response is monitored and used to calculate important data such as the concentration of the analyte. Electrochemical techniques have great potential for easy miniatured use of portable devices in various applications such as medical diagnostics and environmental monitoring. In the electrochemical biosensor due to the direct transformation of the biological event to the electronic signal, this provides an attractive way to analyze the biological sample.94 The sensory pathway of electrochemical sensors is categorized in Fig. 5B according to the method used.95
Ecell = E0 cell − RT/nF![[thin space (1/6-em)]](https://www.rsc.org/images/entities/char_2009.gif) lnQ lnQ | (1) |
Potentiometric sensors are suitable for measuring low concentrations in small sample volumes, as they offer the advantage of not exposing the sample to chemicals. Varieties of ions, which may not be able to achieve low limits, are currently limited and do not have significant solvents such as nickel, manganese, mercury, and arsenate ions.100
Almehizia et al. presented a potentiometric PAD coupled with an myoglobin (Mb) imprinting polymer/MWCNTs composite for Mb detection (Fig. 6A). In this method, the appropriate MIP particles were added to a polymeric membrane to act as an Mb receptor. The presented sensors showed a linear range of 5.0 × 10⁻⁸ to 1.0 × 10⁻⁴ M with a potentiometric slope of −57.1 ± 0.3 mV per decade (R2 = 0.9998) and a detection limit of 28 nM at pH 4. This approach offers a reliable and sensitive method for Mb detection, which can be used in various applications. The Mb imprinting polymer/MWCNTs composite used in this study provides an effective way to detect Mb in biological samples. Therefore, this method can be used as a potential tool for clinical diagnosis and therapeutic monitoring of various diseases.101 Moreover, Akl et al.'s research paper discusses the production of a nano-Cu-complex (N1) through a Schiff base ligand (A1) reaction with copper chloride. The nano Cu complex (N1) has been utilized to develop a potentiometric membrane biosensor specifically designed for the early detection of prostate-specific antigen (PSA). The results of the study indicate that the electrode exhibits a stable Nernstian response of 29.26 ± 0.87 mV per decade for PSA within a linear dynamic range of 5.0 pg mL−1 to 10.0 ng mL−1. The pH range for this response is between 6.5 and 9.2, with a rapid response time of 25 ± 5 s. The lifespan of the sensor is yet to be determined, but the results from the study provide a promising foundation for further research into the development of a reliable and efficient PSA detection method.102
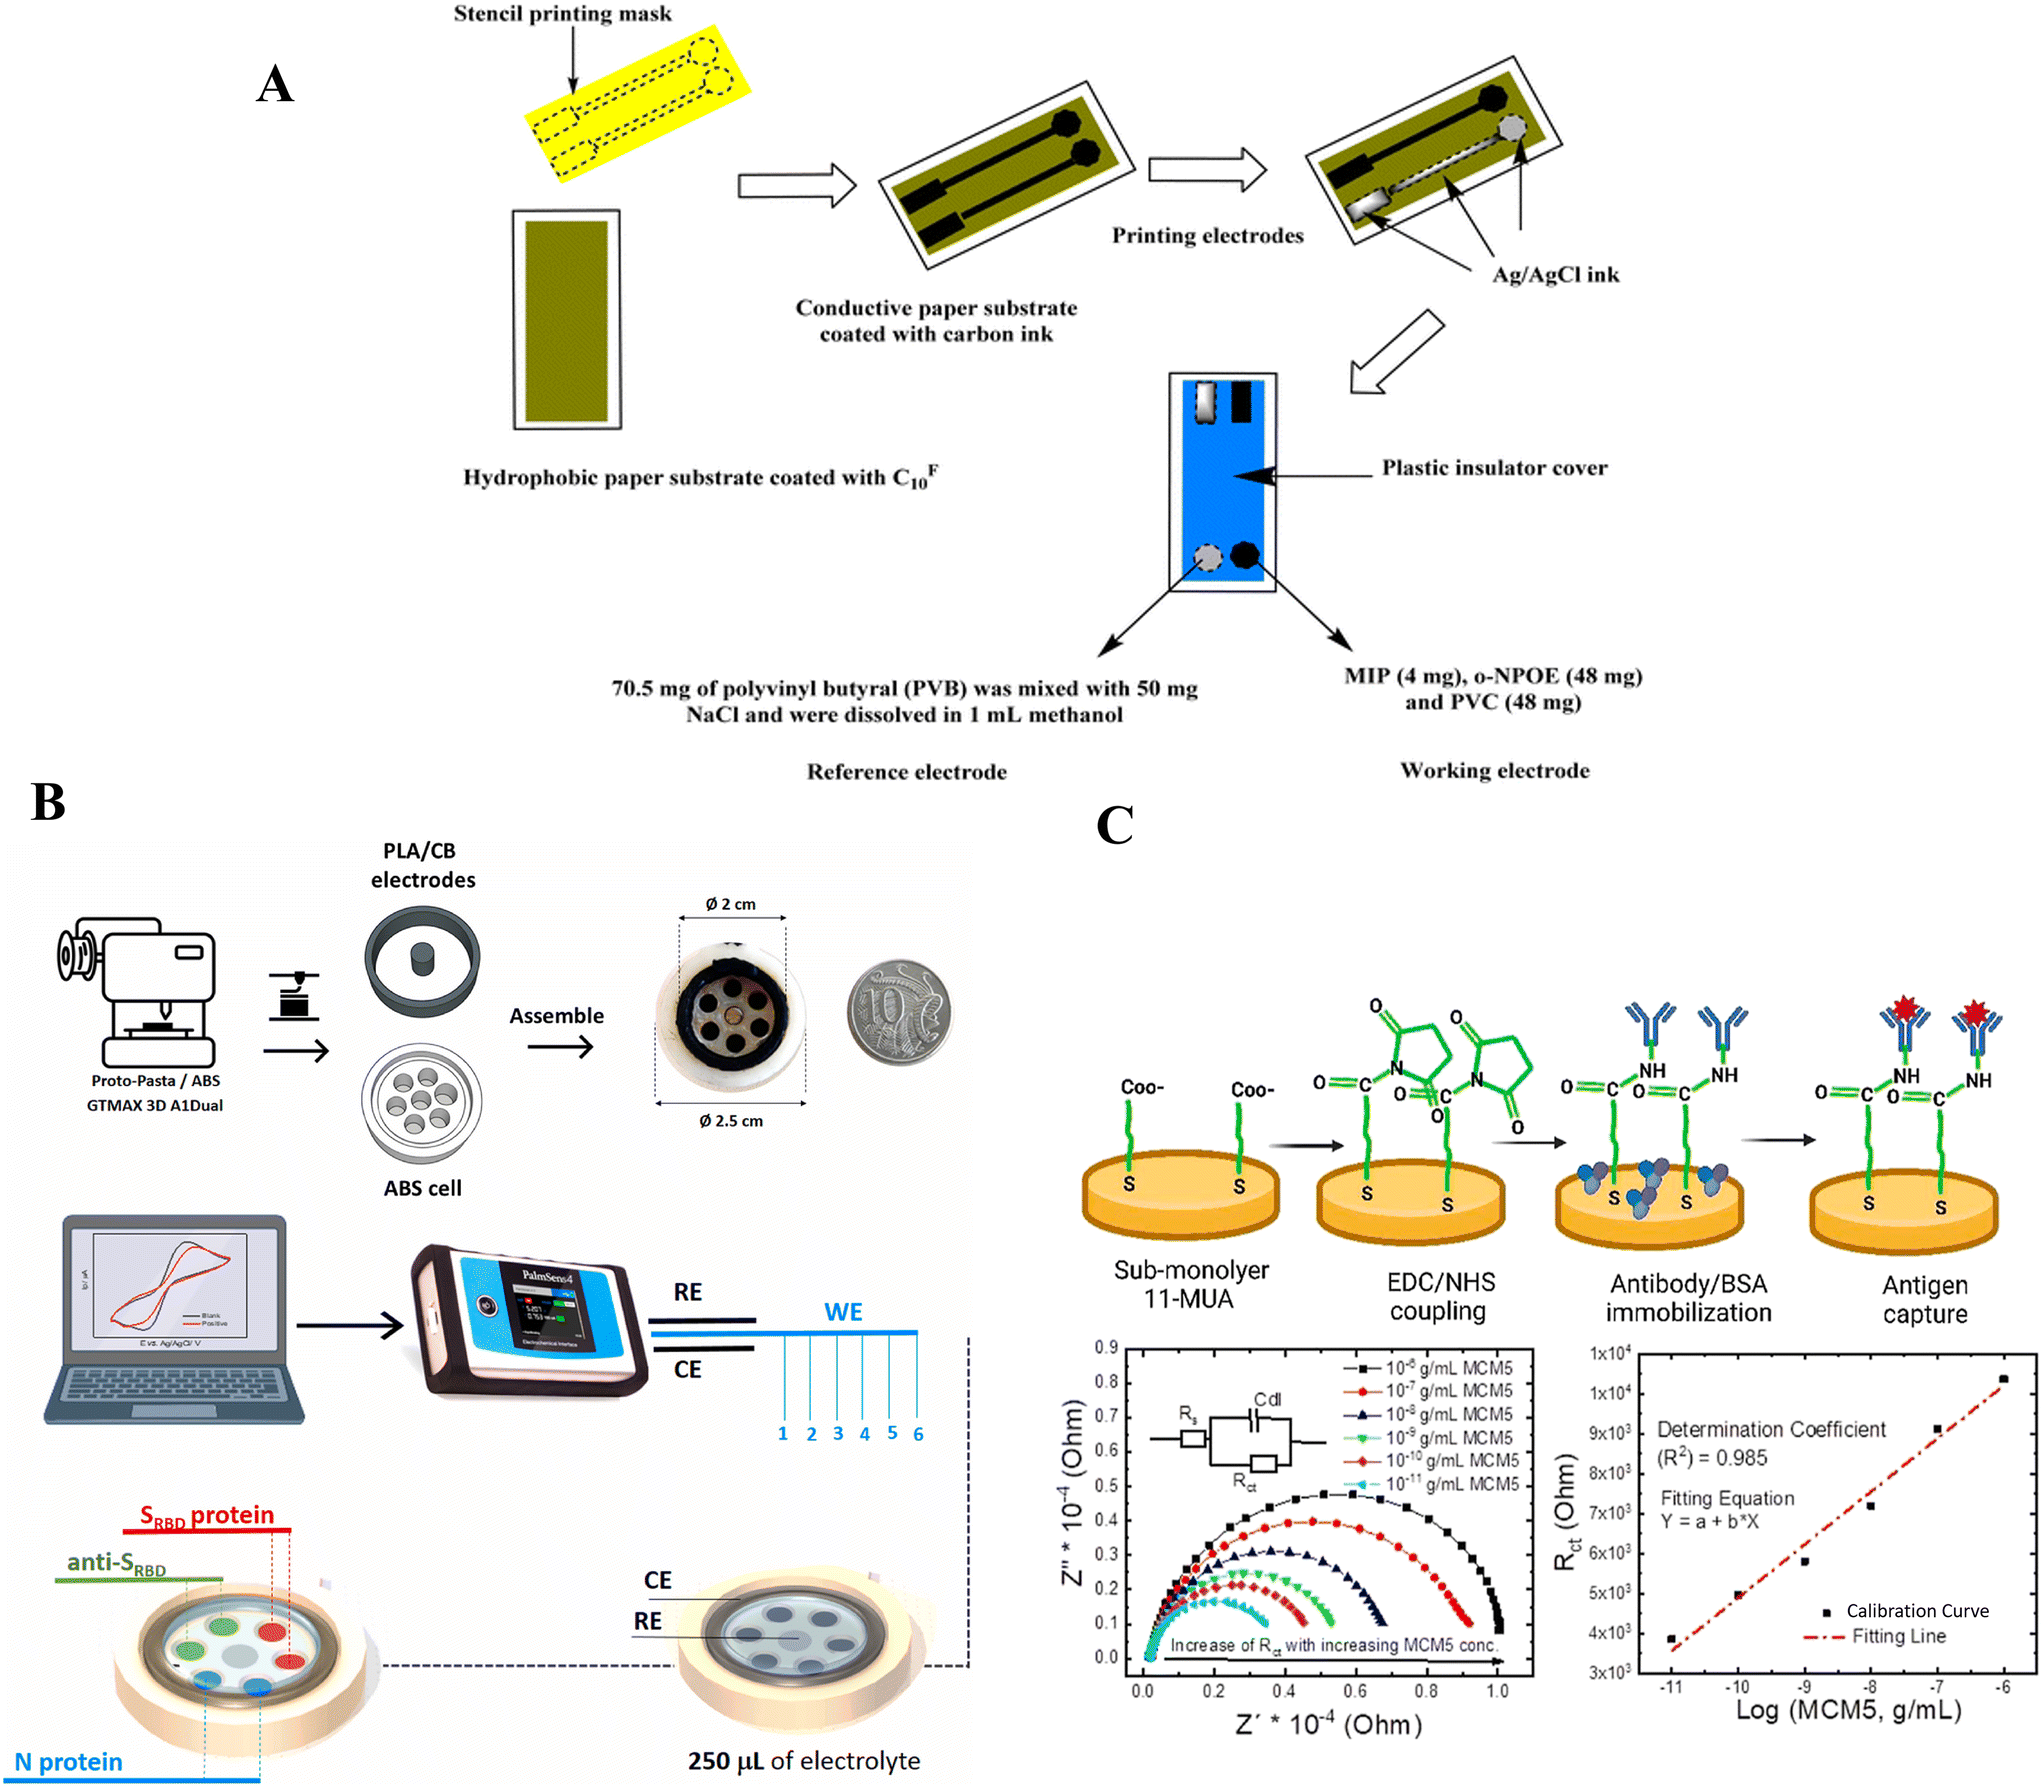 | ||
| Fig. 6 Schematic illustration showing (A) development of a paper-based analytical biosensor for potentiometric sensing of myoglobin, a cardiac vascular disease biomarker. A hydrophobic paper substrate that has been coated with fluorinated alkyl silane, specifically (CF3 (CF2)7CH2CH2SiCl3, CF10) for potentiometric sensing. (B) 3D-printed cell and electrochemical set-up for detection of three Covid biomarkers. The combination of polylactic acid and carbon black in fabricating the working electrodes ensures reliable and sensitive detection of N protein, SRBD, and anti-SRBD. (C) Electrochemical immunosensor for cervical cancer biomarker MCM5 on a gold disk electrode. MCM5 involves the formation of sub-monolayer capping layers of 11-MUA, activation of the terminal –COOH groups, coupling of MCM5 antibodies and subsequent blocking with BSA, MCM5 antigen-binding at various concentrations, and electrochemical readout for quantification. | ||
Various studies have been conducted using CV, and a novel 3D-printed cell has been applied for multiplex voltammetric detection of three main COVID-19 biomarkers: N protein, SRBD protein, and anti-SRBD in saliva and serum samples (see Fig. 6B). The multiple sensors demonstrated a wide linear range, with detection limits of 5, 1, and 1 pg mL−1 for N protein, SRBD-protein, and anti-SRBD, respectively. Similarly, Bakhsh et al. presented a newly developed electrochemical sensor that has several attractive features. The sensor is capable of simultaneous determination of vitamin C and vitamin B6 with high sensitivity, selectivity, and rapidity. The SnO2/GCE-based modified electrode has been found to exhibit remarkable electrochemical properties for the oxidation of both vitamin C and vitamin B6. After optimizing the parameters, including the amplitude, pulse width, and pH level at 0.05 V, 0.045 s, and 0.1 M PBS pH 7, respectively, the modified electrode demonstrated enhanced sensitivity over a broad linear dynamic range from 10 to 140 μM. The limit of detection for vitamin C was measured at 0.067 μM, while for vitamin B6 it was found to be 0.048 μM. These results suggest that the SnO2/GCE-based modified electrode is a promising tool for the detection and quantification of both vitamins in various samples.105
An immunosensor for label-free electrochemical detection of Mini Chromosome Maintenance Protein 5 (MCM5) has been developed in Fig. 6C. MCM5 is a protein that is overexpressed in cervical cancer, which makes it a promising biomarker for early detection of the disease. The electrode surface was modified by creating a sub-monolayer of 11-mercaptoundecanoic acid (11-MUA) as a capture layer. The next step involved activating the electrode with N-(3-dimethylaminopropyl)-N-ethylcarbodiimide hydrochloride (EDC) and N-hydroxysuccinimide (NHS) to immobilize the capture antibody. During the formation of the 11-MUA layers, the change in the electrode surface properties, specifically its wettability, was determined using the static water contact angle method. The binding of MCM5 antigens to the capture antibody can be effectively monitored using cyclic voltammetry (CV) and electrochemical impedance spectroscopy (EIS) techniques. The results of exposing the antibody-functionalized surface to MCM5 antigens show a linear increase in reticulocyte count test (Rct) with the logarithmic value of MCM5 antigen concentration. The linear dynamic range of this increase is between 10−6 and 10−11 g mL−1, with a high correlation coefficient of 0.99 and the detection limit for this assay was 2.9 pM (10−11 g mL−1).108 Similarly Aydin et al.'s study focuses on the fabrication of an electrochemical impedance spectroscopy (EIS)-based immunosensor that enables the quantification of calreticulin (CALR), a new biomarker of breast carcinoma. The immunosensor is fabricated using a reduced graphene oxide/amino substituted polypyrrole polymer (rGO–PPyNH2) nanocomposite modified disposable electrode. The development of a highly sensitive electrochemical biosensor for the detection of calreticulin (CALR) antigens has been achieved using anti-CALR antibodies attached to a rGO–PPyNH2 nanocomposite-coated electrode. The resulting immunocomplex induces a considerably larger interfacial electron transport resistance (Rct) which increases the sensitivity and accuracy of the biosensor. The Rct variation has been found to exhibit a linear relationship with CALR levels in the detection range of 0.025 to 75 pg mL−1. This relationship has been established using a suggested biosensor highly selective to CALR with a detection limit of 10.4 fg mL−1. The biosensor has also demonstrated good storage stability and reproducibility.109
5. Diseases, acute nutritional deficiencies, biomarkers
Diseases are frequently defined as medical disorders characterized by distinct signs and symptoms. External causes such as infections or internal dysfunctions can both cause illness. Internal immune system malfunction, for example, can result in various conditions such as immunodeficiency, hypersensitivity, allergies, and autoimmune disorders. A disease is a specific aberrant state that negatively impacts the structure or function of all or part of an organism and is not caused by external harm.110 Nutrient deficiency illnesses are developed when critical nutrients for growth and health are deficient. These illnesses are caused by a lack of food, which results in malnutrition or hunger. A structural or biological imbalance in the individual's metabolic system might also cause a deficient condition, nutritional shortage, or illness, whether currently treated or untreated. Protein energy malnutrition (PEM), scurvy, rickets, beriberi, hypocalcaemia, osteomalacia, vitamin K deficiency, pellagra, xerophthalmia, and iron deficiency are a few examples.110 Biomarkers are molecular traits that offer information on biological states, whether regular, diseased, or medically changed. They can help in diagnosis and prognosis, monitor illness, and measure medication success. While several biomarkers are widely used in therapeutic settings, they represent just a small fraction of all biomarkers found. Various variables contribute to the sluggish adoption of these novel biomarkers, including difficulties encountered along the biomarker development process.111,112 Microfluidics provides the field of biomarkers with two critical opportunities: first, it can address some of these developmental challenges, and second, it can provide the precise and complex platform required to bridge the gap between biomarker research and the biomarker-based analytical device market (see Fig. 7C). Indeed, microfluidics has opened up a new path for progress, boosting the clinical use of biomarkers and associated analytical platforms.4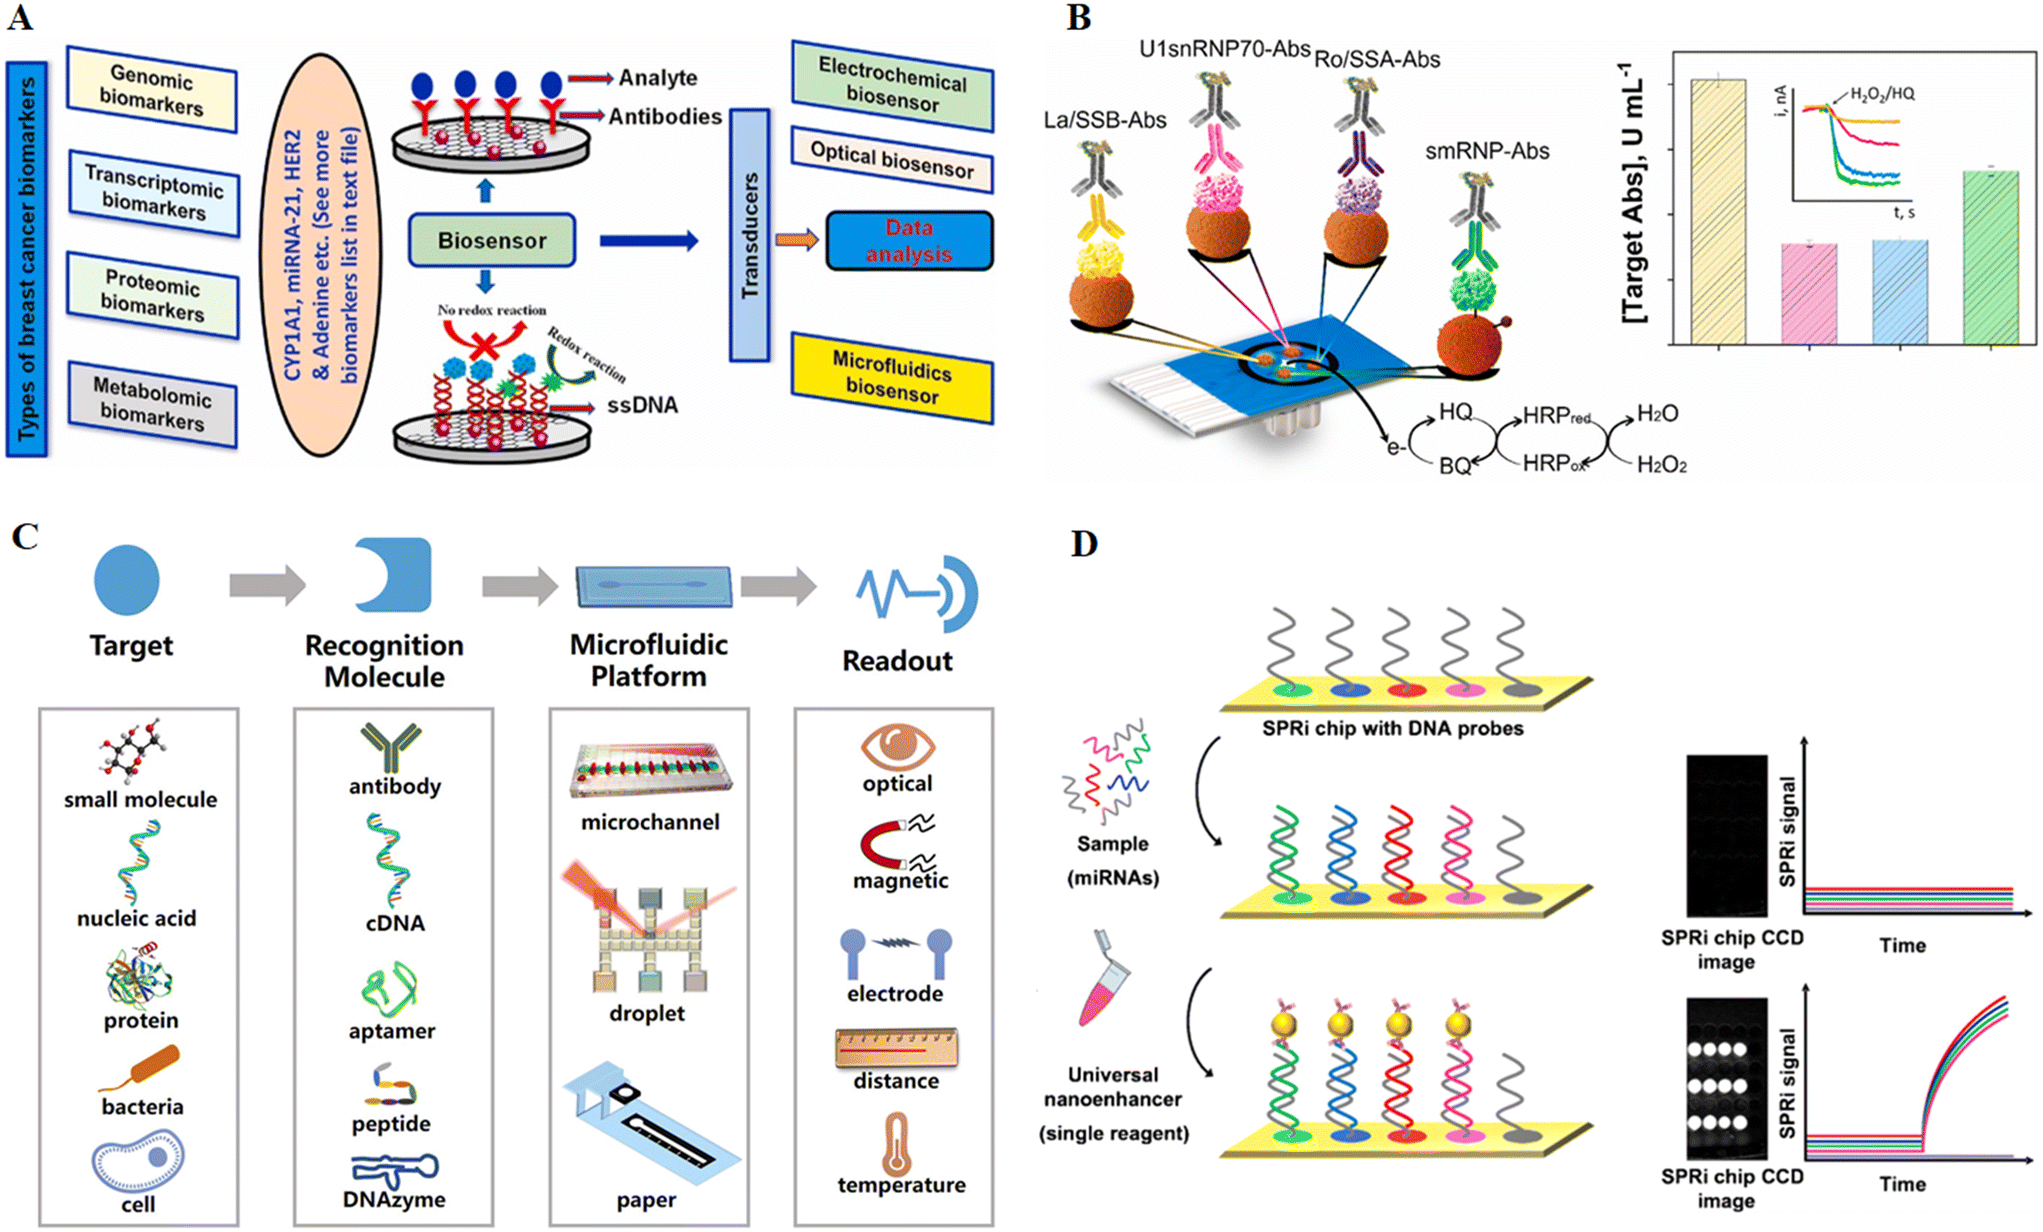 | ||
| Fig. 7 Innovative approaches for autoimmune disorder detection. (A) Designing and implementing point-of-care biosensors for detecting autoimmune disorders by analysing genetic, gene expression, protein, and metabolic biomarkers. Reproduced from ref. 113 with permission from Elsevier, copyright 2020. (B) Multiplexed electrochemical platforms for the early and precise diagnosis of autoimmune conditions. Reproduced from ref. 114 with permission from Elsevier, copyright 2023. (C) An illustration of a microfluidics-based biosensor with a biological detection element, a microfluidic device, and a signal reading device. Reproduced from ref. 115 with permission from American Chemical Society, copyright 2018. (D) Strategy for simultaneously detecting multiple microRNAs in MS patients using a single nanostructured enhancer of surface plasmon resonance imaging (SPRi). Reproduced from ref. 116 with permission from Springer Nature, copyright 2019. | ||
5.1. Autoimmune diseases
Autoimmune diseases occur when the immune system defects and misidentifies self-tissues as foreign. Autoimmune illnesses are a group of chronic diseases that are either organ-specific (e.g., thyroid diseases, Graves' disease, type 1 diabetes, and primary biliary cirrhosis) or systemic (e.g., antiphospholipid syndrome, rheumatoid arthritis, and systemic lupus erythematosus).117,118 These illnesses are typically caused by a lack of normal immunological self-tolerance, which results in the development of high-affinity autoantibodies that erroneously target the body's cells, tissues, and organs. Only around 8% of the population may be affected by autoimmune illnesses. They are, nevertheless, one of the leading causes of severe disability, organ failure, and fatality, resulting in substantial medical costs. As a result, early detection of these illnesses is critical for enhancing patients' quality of life. Autoantibodies (AAbs) in clinical samples are the greatest diagnostic biomarkers for predicting autoimmune illnesses' beginning, progression, and severity because they may be discovered years before clinical signs and irreparable damage appear.119 It is essential to identify biomarkers associated with these disorders. Recent advances in biosensor-based diagnostic techniques have enabled the identification (shown in Fig. 7A) of various genomic, transcriptomic, proteomic, and metabolomic biomarkers to diagnose autoimmune diseases. These biosensors can detect biomarkers in patient samples and provide accurate diagnoses. Furthermore, these biosensors detect multiple biomarkers associated with different autoimmune disorders, allowing for a more comprehensive diagnosis. Understanding the various biomarkers associated with autoimmune diseases makes it possible to develop more targeted treatments and therapies. This will enable better outcomes for patients with autoimmune disorders, and improve their quality of life.120 Arévalo, Beatriz et al. have presented pioneering research on the simultaneous detection of autoantibodies associated with autoimmune diseases. Their innovative approach utilizes modified magnetic microparticles (MBs) specific to the antigens. These MBs employ His-tag or carbodiimide/hydroxysuccinimide (EDC/NHS) chemistries to capture the corresponding autoantibodies (IgGs). The captured autoantibodies are then enzymatically labeled with HRP-conjugated secondary antibodies. The detection is achieved through amperometric transduction using the H2O2/HQ system on disposable platforms, enabling quadruple detection, Fig. 7B. The performance of this platform is suitable for clinical applications. It demonstrates the potential to differentiate between healthy individuals and patients diagnosed with autoimmune diseases. This differentiation is accomplished by determining the levels of the four autoantibodies in serum within a quick and reliable 45-minute timeframe.114Furthermore, due to their specificity and durability during diseases, autoantibodies are beneficial and essential indicators. Currently, the most prevalent conventional techniques for AAbs detection in autoimmune illnesses include enzyme-linked immunosorbent assay (ELISA), indirect immunofluorescence (IIF), and western blotting. However, these approaches are costly, time-consuming, and inconvenient since they require complex tools. Because of their potential to detect disease-related biomarkers in real time, biosensors are among the most promising technologies for detecting disease-related biomarkers.121 A biosensor is a device with an integrated receptor – a transducer that may be used for quantitative or semi-quantitative analytical detection based on the signal transducer used. The biosensors are classified as optical, electrochemical, or piezoelectric devices. Nanomaterials (NMs) are prospective candidates for biosensor manufacture to boost sensitivity and decrease detection limits (LOD). Aside from AAbs, several proteins, chemokines, cytokines, cells, and ions have been identified as prospective biomarkers for diagnosing or monitoring autoimmune diseases.122 Current biomarker finding efforts are centered on three types of proteins that represent the autoimmune disease process: (1) degradation products resulting from tissue damage, (2) enzymes involved in tissue degradation, and (3) cytokines and other proteins related to immune activation.120
000 person-years in women (95 percent CI 3.0, 4.2) and 2.0 (95 percent CI 1.5, 2.4) in males.128 Apoptosis of oligodendrocytes, the cells responsible for the formation and maintenance of myelin, causes additional neuronal disintegration and function loss. The Food and Drug Administration (FDA) has authorized over a dozen medications with distinct mechanisms of action to treat MS attacks (e.g., dimethyl fumarate, interferon (IFN), fingolimod, teriflunomide, ocrelizumab, etc.).129 At the moment, known biomarkers can aid with MS diagnosis and prognosis, as well as monitoring therapy response and assessing the risk of adverse effects. These include oligoclonal bands and the IgG index, anti-AQP-4 antibodies, IFN- and natalizumab neutralizing antibodies, and anti-JCV and anti-VZV antibodies. Furthermore, promising biomarkers such as NFL and CHI3L must be validated in additional studies.130 Given the significance of demyelination in MS, Kerman et al. used stem cell biology and microfluidic technology to convert mouse embryonic stem cells into myelinating oligodendrocytes, then assessed and quantified myelin development over several days. According to live imaging and confocal analyses, the oligodendrocytes anchor to the naked axons before wrapping them and producing the myelin sheets. This model is an excellent tool for better understanding the myelination process and developing innovative therapies for demyelinating illnesses like MS.131
000 persons, with a prevalence of 9.5 percent (95 percent CI: 0.07 to 0.12), which was statistically significant.132 The technique employs a microchip and sensor to detect blood indicators that can pinpoint the early loss of beta cells, which persons with type 1 diabetes cannot create. Researchers have already produced a proof-of-concept sensor coated with unique nanoparticles. The sensor can detect the presence of specific biomarkers in the blood, changing color if the molecule is present. Electrochemical measurements are reported more frequently in the literature than other approaches. As a result, they are the primary focus of our investigation. Biosensors remain the primary focus of most teams due to their excellent selectivity for glucose measurement.133
5.2. Acute nutritional deficiencies
000 children are born blind. The deficiency in vitamin A will deliver stunted growth, difficulty in reproduction, and difficulty in fighting infections.135 Progress is made globally in controlling child deaths and blindness through effective oral supplementation in early childhood but it is also population dependent. Due to ambiguous findings, the WHO continues to recommend high supplement doses for children and infants; frequency and effective doses have not yet been determined. A close monitoring is highly required to determine the supplementation needs and when to stop it. For VAD diagnostics, different RBP cut-offs are proposed – 14.5 μg mL−1 (0.69 μmol L−1), 14.7 μg mL−1 (0.70 μmol L−1), and 17.4 μg mL−1 (0.83 μmol L−1) as the molar ratio between retinol and RBP depends on a lot of factors.136
Keratomalacia and Bitot's spots are among the non-invasive indicators of clinical vitamin A deficiency (VAD). Though better biochemical indicators are always explored for better evaluation of VAD with minimal invasion. Vitamin A status can be monitored by determining the serum retinol concentration of an individual.137 Retinol binding protein (RBP) is present in 1:1:1 M concentration with retinol and transthyretin. As serum RBP is present in a 1:1 M complex with retinol, it can be chosen as a surrogate biomarker for serum retinol concentration.138 It is easier to access serum RBP than serum retinol. Serum RBP is more stable with reference to light and temperature. Also, analysis of serum RBP requires finger prick blood i.e., 10–20 μl.139 However, acute infection and inflammation in the human body affect the serum retinol and serum RBP levels. So, it is always wise to measure C-reactive protein (CRP, a biomarker for infection) along with serum RBP.137
A third of the population is affected by VAD and it is the need of the hour to carry out mass testing for close monitoring and administration of doses. Though clinical results are accurate, it takes at least one day, and the patient must travel to the laboratory for blood tests. So, it is challenging to do mass testing at the clinical level in resource-limited settings.140,141 Lu et al. have developed a test strip to quantitate ferritin (a biomarker for iron deficiency), RBP, and CRP. It is a multiplexed test strip with a reusable stand-alone reader. To read the concentration of the markers in the sample, fluorescence tags are bound on the test line. The intensity is measured with the help of fluorescence imaging mode and the concentration of the marker is read out.136
Estimating iron deficiency anemia based on hemoglobin concentration alone fails to account for nutritional deficiencies, infectious disorders, etc. A combination of indicators best assesses iron status. However, ferritin is primarily accepted as the iron-storage molecule and an increase in iron supplies in cells increases the production of serum ferritin. So, serum ferritin is a significant biomarker for iron status as it correlates with relative total body iron reserve. Nevertheless, the concentration of ferritin elevates in the presence of infection or inflammation. The normal range of ferritin in serum is between 15 ng mL−1 (32 pmol L−1) and 150 ng mL−1 (316 pmol L−1) for females or 200 ng mL−1 (421 pmol L−1) for males, while the cut-off for depleted iron storage in children less than 5 years old is <12 ng mL−1 (26 pmol L−1) and <30 ng mL−1 (63 pmol L−1) if inflammation is present.136 In Fig. 8 graphene-based field-effect transistor (GFET) biosensors are developed in a step-by-step process as a ferritin specific biosensing platform. To start, a GFET device is fabricated using standard lithography and etching techniques. Then, a polydimethylsiloxane (PDMS) well is placed on top of the GFET device to secure an electrolyte. After that, the graphene layer is functionalized with pyrene-butanoic acid, succinimidyl ester (PASE) (Fig. 8A). This enables the anti-ferritin antibody to attach to the graphene, which is the next step in the process. Finally, the GFET-based biosensor is capable of ferritin-specific biosensing after the completion of these steps.145
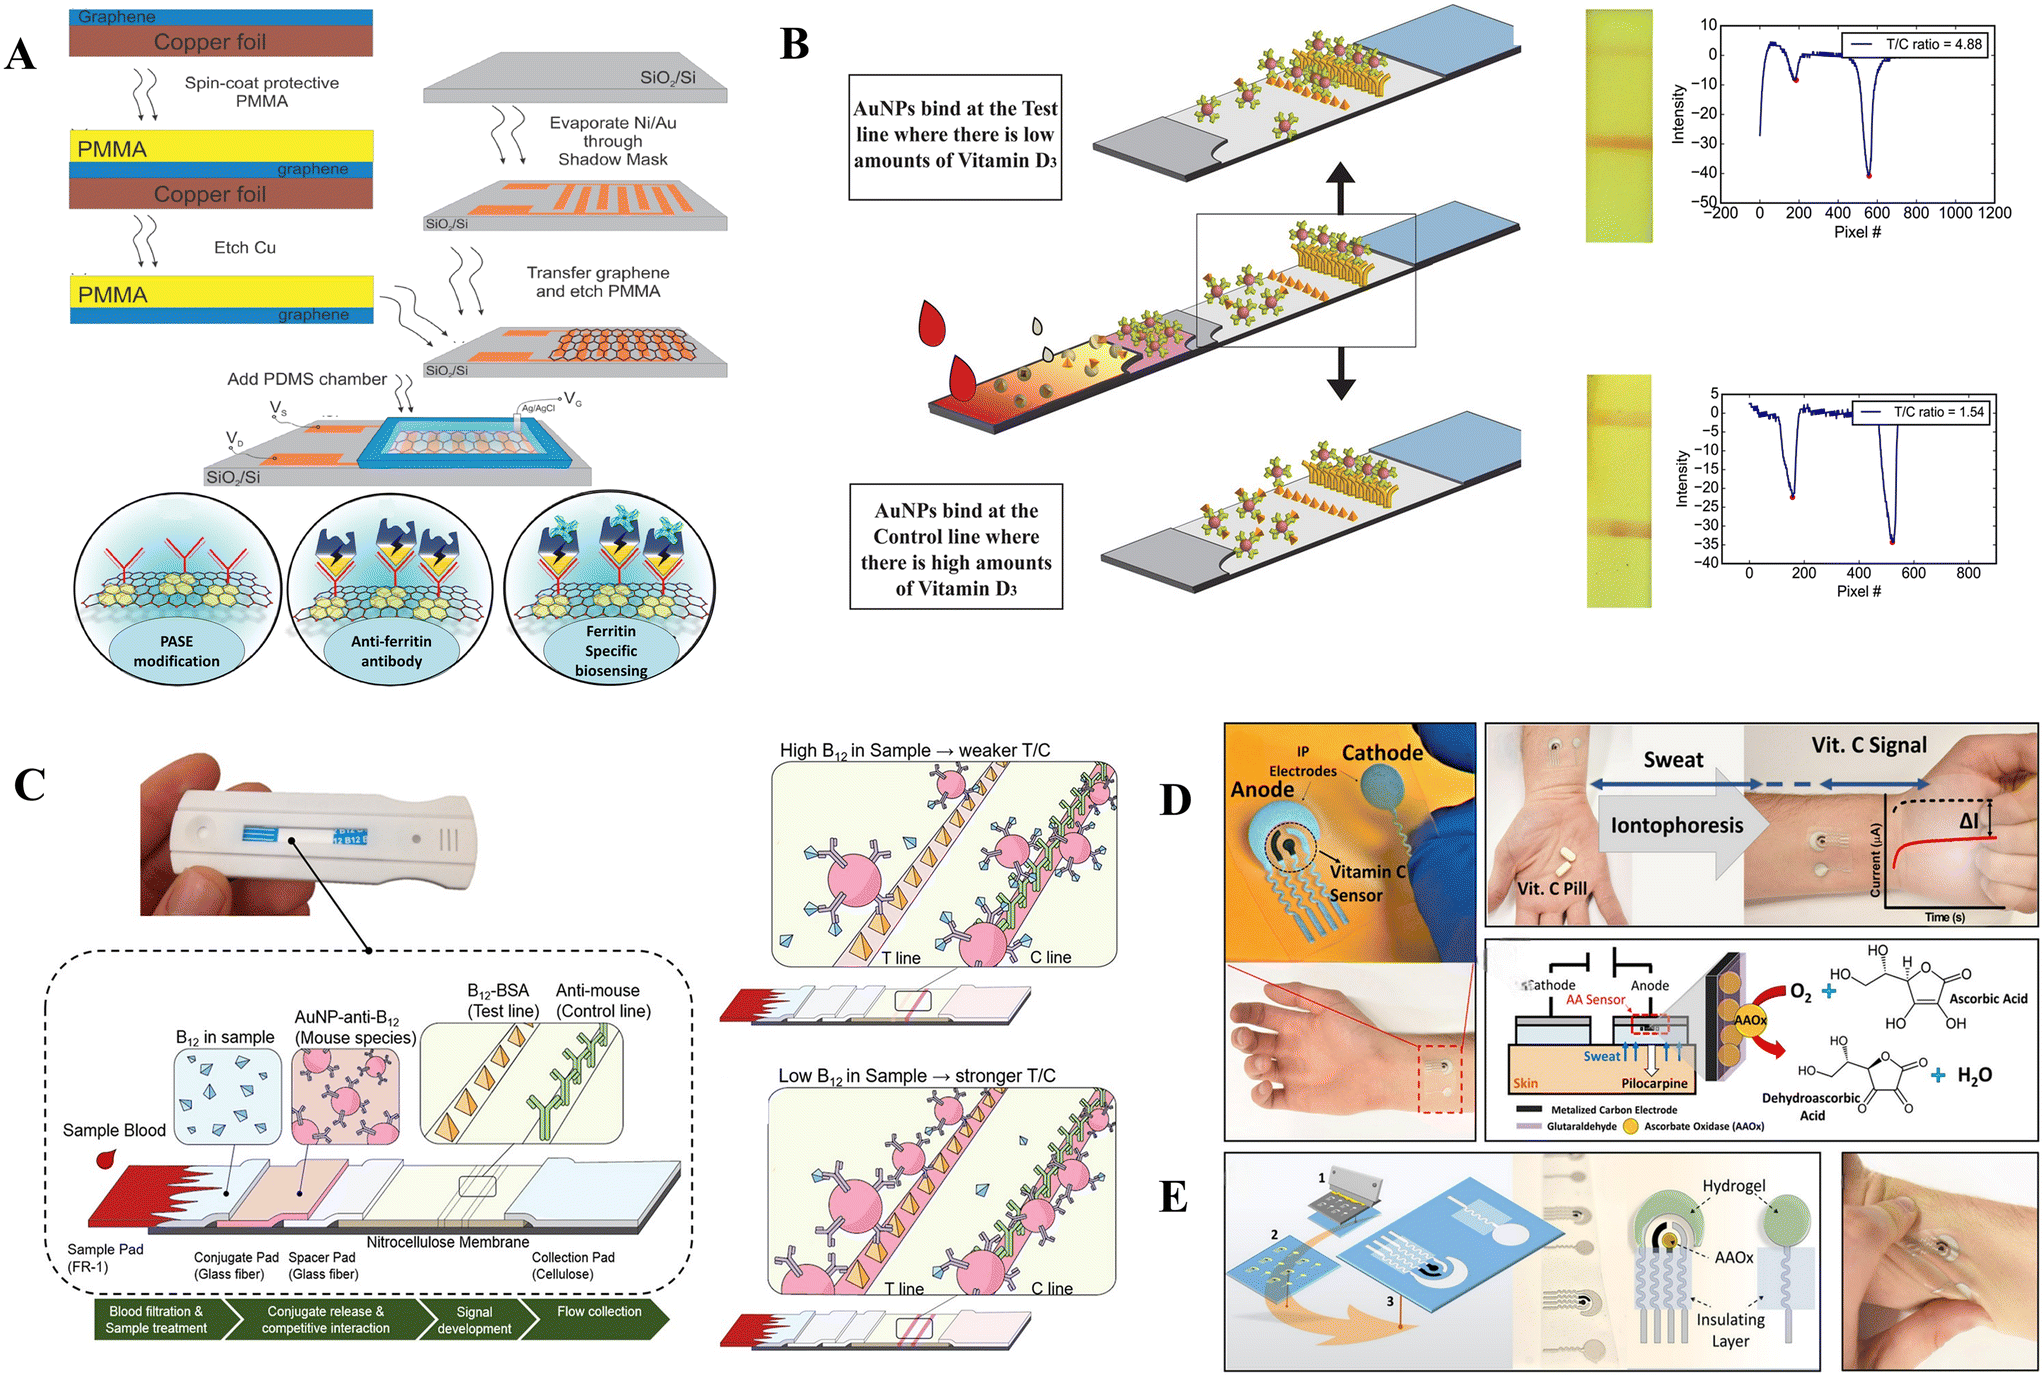 | ||
| Fig. 8 Advancing point-of-care techniques. (A) Developing a complete strategy for detecting ferritin involves a combination of modern methods. This includes using GFET technology to improve graphene-based biosensors, a sequential fabrication process, encapsulating the sensor with PDMS, and a multi-step functionalization strategy. Reproduced from ref. 145 with permission from MDPI, copyright 2020. (B) Comprehensive visualization of the vitamin D3 lateral flow assay includes the strip design and a participant's intensity profile indicating low vitamin D3 and elevated T/C ratio. Reproduced from ref. 146 with permission from Nature, copyright 2017. (C) Visual depiction of the vitamin B12 lateral flow assay, showcasing the specialized test strip design, competitive interactions at the test line, and signal intensity variations indicating high and low B12 levels. Reproduced from ref. 147 with permission from Nature, copyright 2016. (D) Detection of vitamin C in sweat through a three-electrode system, involving simultaneous stimulation and detection, a biosensing protocol based on sweat stimulation before and after vitamin C intake, and a sweat-based enzymatic reaction for accurate vitamin C measurement. (E) Development of a vitamin C biosensor featuring hydrogel and enzyme layers, and visualization of the epidermal sensor's mechanical strain response (twisting). Reproduced from ref. 148 with permission from American Chemical Society, copyright 2020. | ||
Lu et al.136 have reported a rapid diagnostic test for quantifying ferritin, RBP, and CRP simultaneously. It detects ferritin concentrations as low as 15 ng mL−1. Oshin et al.145 demonstrated a graphene-based biosensor with a ferritin detection range of 5.3 ng L−1 to 0.5 μg L−1.
25-Hydroxyvitamin D or 25(OH)D is a pro-hormone produced in the liver and is a biologically inert form of vitamin D that is produced in the skin. 25(OH)D is a major circulating form of vitamin D, and it can be considered as the best indicator of vitamin D status.146 Total 25(OH)D is a measure of 25(OH)D2 (ergocalciferol) and 25(OH)D3 (cholecalciferol). However, studies suggest that 25(OH)D3 supplementation alone can lead to an overall increase in vitamin D status in the body.151
Vemulapati, S. et al. have created a fast diagnostic test designed for precise and quantitative evaluation of vitamin D levels. The test specifically targets the measurement of 25(OH)D3, which is the primary component of circulating 25(OH)D and is particularly significant in the deficient range (<50 nmol L−1), Fig. 8C. This range is essential as it represents the area with the highest demand for accurate assessment.
Peter et al.152 developed a fully automated microfluidic assay along with a readout for measuring vitamin D levels. The lab-on-a-chip used a microarray-based competitive immunoassay to detect 25(OH)D3. Lee et al.147 presented the vitaAID – vitamin AuNP-based immunoassay device – a system for rapid quantitation of vitamin D levels on a smartphone. The device compares the differences in brightness between the detection area and the reference area and estimates the concentration of 25(OH)D independent of the exposure setting. A rapid diagnostic test integrated as a lateral flow assay was developed by Vemulapati et al.146 incorporating competitive type architecture capable of processing blood on the strip and quantifying 25(OH)D3 in the deficient range.
Lee et al.147 developed a Nutriphone which consists of a smartphone accessory and a lateral flow test strip (Fig. 8C) that quantifies deficiency of vitamin B12. Silver enhancement of the initial colorimetric signal and quantification with the app and smartphone detected the lower range of clinical serum vitamin B12 levels.
Vitamin K is the most lipophilic and least abundant vitamin. Measurement is a challenging task in human samples. Uncarboxylated vitamin K proteins, factor VII, uncarboxylated osteocalcin, and urinary concentration of Gla residues are some of the markers for vitamin K depletion.162
Li et al. developed an eco-friendly, rapid, and sensitive detection of anticoagulant rodenticides (ARs) in emergency clinics and food samples with a point-of-care assay. The developed QNs were prepared by encapsulating Cd-free InP/ZnS QDs into PS nanospheres. The obtained QNs have good potential in clinical diagnosis and food safety monitoring.163
5.3. Novel biomarker as a pharmacological response to diseases
Capturing target genes in microwells with a small sample volume can improve sensitivity. Furthermore, gene quantification is now attainable with the advancement of considerable sample volume minimization employing droplet technology. These cost, automation, usability, and portability advancements have enabled point-of-care applications to decentralize testing platforms from laboratory-based settings to field usage against infections.164 Biosensors are critical for illness diagnosis at the point of care or bedside. The key to effective illness therapy is early detection mainly in infectious diseases, cardiovascular disease, neurological disorders, and so on which are as important in this regard as these diseases are responsible for a high incidence of morbidity and death globally.165 In the case of biosensors electrochemical, optical, piezoelectric, or nucleic acid biosensors have been developed. Most biosensors function as immunosensors, detecting immunological markers in biological samples. These ultrasensitive instruments eliminate the time-consuming and arduous stages of traditional sample processing and analysis. Biosensors provide an accurate diagnosis with high specificity and sensitivity and a better prognosis.166 Transcriptome, metabolomic, and proteomic (including miRNA and single-cell T cell) profiling yield new biomarkers. To analyze and integrate big datasets and guide data interpretation, advanced computational approaches are necessary. Longitudinal sample analysis will be critical in future studies, first for identification and, more crucially, validation of chosen sets of putative biomarkers.167 Wu, Tsung-Hsien, et al. demonstrated an extensive microfluidic-based dual-target detection method for RF and anti-CCP. This research explores practical parallel processing and prospective uses for point-of-care rheumatoid arthritis diagnosis and monitoring. This study lays the path for improved rapid diagnostic capabilities in the management of rheumatoid arthritis by combining cutting-edge microfluidic technology with sensitive ELISA tests.3 Lin, Xiaodong, et al. incorporated a lanthanide-based ratiometric fluorescent probe within a self-designed Fermat spiral microfluidic chip that enables rapid and sensitive automated determination of bacterial endospore biomarker, dipicolinic acid (DPA), emphasizing the potential for streamlined and efficient point-of-care testing applications.168 Pt–Pd bimetallic nanoclusters are used by Chen, Chaozhan, et al. in a novel microfluidic device with mass-producible micropillar array electrodes for enhanced biomarker detection sensitivity, as demonstrated by notable improvements in H2O2 detection and high-sensitivity biosensing of glucose, uric acid, and sarcosine in human serum.169 A novel technique for early clinical sepsis detection was developed by Yin, Binfeng, et al., using commercially available 3M tapes inside a proprietary microfluidic device for automated and sensitive analysis of sepsis-related biomarkers in serum. As a promising platform for accurate clinical and field diagnostics, the tape-based microfluidic chip exhibits high sensitivity and selectivity in detecting C-reactive protein (CRP) with a limit of detection (LOD) of 0.23 g mL−1, procalcitonin (PCT) at 0.14 ng mL−1, and interleukin-6 (IL-6) at 12.53 pg mL−1.170 The study introduces an innovative microfluidic system capable of automatically detecting alpha defensin HNP-1 and C-reactive protein biomarkers from synovial fluid, demonstrating high specificity and accurate diagnosis potential for post-arthroplasty periprosthetic joint infections.171 This section focuses on improvements in microfluidic-based biosensors for point-of-care diagnosis and monitoring of various diseases. It illustrates cutting-edge methods like dual-target detection, lanthanide-based fluorescent probes, bimetallic nanoclusters, and commercially available tapes, all of which show enhanced sensitivity and specificity in detecting biomarkers, particularly in sepsis and post-arthroplasty periprosthetic joint infections.6. Evolution of POCT devices
6.1. How it started
Dr. Kost began researching biosensors and measuring pH changes in vivo during cardiac stress and shock in 1972. In innovative visual logistics depicting clinical pathophysiology, he conceived the new area of patient-focused testing.172 Earlier in 1955, hematological testing instructions in England described on-site patient treatment. The phrase “point-of-care testing” was created by Dr. Kost in the early 1980s while doing biosensor-based serial measurements of ionized calcium in whole blood at the bedside of patients undergoing liver transplantation at the University of California, Davis Medical Center.173 Dr. Kost personally performed a whole-blood analysis at the patient's side in the operating room and instantly conveyed the results to the anesthesia and surgical teams, who acted on them. The pathologic dissociation of ionized calcium from total calcium due to the chelating effects of extensive blood transfusion required to sustain patient vascular volume in the early days of liver transplantation was an important finding at the time.1746.2. New platforms
The recently faced global pandemic has made everyone realize the importance of patient-oriented technology which reduces and distributes the burden on hospitals. Care and treatment can be given to those who are ill or critically ill.175 Over the last few decades, point-of-care testing has shown itself in epidemics, disasters, crises, hospital surgical practice, critical care, bedside decision-making, personal health maintenance, and self-testing. POCT technology briefly has two essential parts – one gives a visual conclusion for qualitative data and the other includes a physicochemical component for quantitative inference.176 Going for only a visual inference such as in LFA gives us a quick result but it cannot be favorable for continuous monitoring in near-patient situations. Conversely, a read-out modality attached to the POCT device gives a better interpretation of the illness and keeps the patient in check. For example, a patient who monitors his/her glucose level at home using a glucose meter can check the blood glucose levels and consult a doctor in case of urgency.177Recent developments have also led to multiplexing of analyte testing on a single platform using the same specimen. Point-of-careology results from the evolution of POCT and the POC specialists that do it across the world. In each environment and nation, point-of-careologists will create standards of care, the test reference values, and best practices.178 The development of point-of-careology reflects improvements in contemporary medical, technology, and social expectations in general, mostly in tandem with the introduction of cell phones and other convenient gadgets that individuals may quickly obtain. There are improvements in the marginal value of testing and time savings in proportion to the severity of the medical crisis. New testing modalities on ambulances, airplanes, ships, and other mobile carriers provide simplicity and speed. Reliable results eliminate specimen time obsolescence when transported or stored.178,179
7. Conclusion
The future of personalized medicine will depend heavily on biomarkers because of their enormous potential to benefit society and the healthcare field. The biomarkers can provide valuable information about the state of our health, aid in early disease detection, guide treatment decisions, and monitor the effectiveness of therapies. Several microfluidic platforms including different sample detection optical and electrochemical techniques have been developed for rapid detection of biomarkers of various diseases (Table 1). Microfluidics technology provides a great ability to execute and analyze complex operations which include detection, drug delivery, synthesis, etc. The high surface-to-volume ratio can improve reliability and result in shorter trial times. The use of this state-of-the-art technology has provided the opportunity to perform experiments using small volumes which results in a reduction of reagent volume and low energy consumption. The advent of biomarkers to help detect diseases and deficiencies has led us to a path where we can stop future pandemics. Different response-analyses such as optical analysis, electrochemical analysis, etc. aid the POCT technology for faster and more accurate results.| Disease name | Biomarker | Sensitivity and specificity | LOD | Remark | Ref. |
|---|---|---|---|---|---|
| Rheumatoid arthritis | Rheumatoid factor (RF), anti-citrullinated peptide antibody (ACPA), and the newly developed anti-mutated citrullinated vimentin (anti-MCV) | Anti-MCV POCT – 64% and 97% | — | 180 | |
| RF POCT – 51% and 95% | |||||
| Graves' disease | Hormone thyroxin (T4)/L-thyroxine | — | 3.0 × 10⁻⁹ mol L−1 | 181 | |
| Multiple sclerosis | Anti-myelin basic protein (MBP) autoantibody | — | Gelatin MBP biosensor – 0.1528 ng mL−1 | 182 | |
| Gelatin TiO2 MBP – 0.1495 ng mL−1 | |||||
| Multiple sclerosis | Matrix metalloproteinase 9 (MMP-9) | — | 15 ng mL−1 | 183 | |
| Type 1 diabetes | Glucose and lactate | Glucose biosensor – 0.33 μA cm−2 mM−1 | Glucose biosensor – 0.18 mM | 118 | |
| Lactate biosensor – 0.78 μA cm−2 mM−1 | Lactate biosensor – 0.12 mM | ||||
| Type 1 diabetes | Glucose | — | Fluorescence spectroscopy – 0.14 μM | 184 | |
| UV-vis spectroscopy – 3.26 μM | |||||
| Addison's disease | Cortisol – a glucocorticoid hormone | 0.25 ohm ng−1 mL−1 | 1 pg mL−1 | 185 | |
| Addison's disease | Cortisol | — | 0.87 ± 0.12 pg mL−1 | Electrochemical-digital immunosensor – revealed an accuracy of 96.3% in comparison with ELISA | 186 |
| Acute nutritional deficiencies | |||||
| Vitamin A deficiency | Retinol binding protein | Sensitivity – 100% | 2.2 μg mL−1 | Multiplexed fluorescence test strip and mobile enable platform as reader | 136 |
| Specificity – 100% | |||||
| Iron deficiency (ID) | Soluble transferrin receptor (sTfr) | Sensitivity – 100% | 6 μg mL−1 | An immunochromatographic assay-based POC screening device | 187 |
| Specificity – 83.3% | |||||
| Serum ferritin | Sensitivity – 90% | 18 μg L−1 | 188 | ||
| Specificity – 100% | |||||
| Vitamin D deficiency | 25(OH)D3 (vitamin D3) | Sensitivity – 0.90 Ω nM−1 mm−2 | 0.28 ng mL−1 | Response time <1 min | 189 |
| Label-free immunosensor | — | 2.36 ng mL−1 | 190 | ||
| Vitamin B12 deficiency | Vitamin B12 | Sensitivity – 87% | 258 pmol L−1 | 147 | |
| Specificity – 100% | |||||
| Vitamin B12 | — | 0.109 nM | 191 | ||
| Vitamin K deficiency | Anticoagulant rodenticides (ARs) | 163 | |||
Although there are many challenges, integrating biomarkers with microfluidics technology has great potential. Encouraging multidisciplinary collaboration among biologists, engineers, and doctors to build and improve microfluidic devices is the main problem. Another challenge is ensuring the durability and robustness of these devices in practical applications, which requires careful testing and validation. For wider acceptance, it is essential to address the problem of the low throughput that microfluidic devices have under the complex channel design. A possible solution, enhancing the capabilities of microfluidics and allowing additional functionalities, is the merging of microfluidics with 3D printing. Additionally, despite significant efforts, only a few biomarkers find therapeutic use, making identifying and using them challenging. The abilities of a suitable, functional POC device must meet the “ASSURED” criteria, which calls for the device to have fast detection, high accuracy, a low detection limit, low cost, good repeatability and stability, and user-friendly characteristics. Microfluidic technology may overcome these difficulties, especially when resolving challenges associated with biomarker specificity, sensitivity, and validation methods. Microfluidics' ability to multiplex allows the technology to increase accuracy by combining several indicators for different biomarkers' analysis. Consequently, even though biomarker-integrated microfluidics has incredible promise, it requires a collaborative effort to overcome its challenges and fully achieve the benefits in real-world applications.
The study investigates a state-of-the-art bioanalytical method that integrates microfluidic devices with advanced optical and electrochemical methods. Precise diagnoses are made possible by this ground-breaking combination of scientific techniques, including electrical impedance spectroscopy, cyclic voltammetry, and amperometry. By correctly identifying autoimmune conditions such as rheumatoid arthritis, multiple sclerosis, type 1 diabetes, and Addison's disease, the approach establishes its importance and enables earlier treatments and better management. Evaluating iron and essential vitamins also plays a crucial part in recognizing acute nutritional shortages and allowing targeted therapies. The method also provides insights into indicators of pharmacological response, increasing personalized treatments and accelerating pharmaceutical research. As we reflect on the evolution of point-of-care testing devices, it is evident that we stand at the threshold of a transformative era in healthcare diagnostics characterized by innovation, accessibility, and improved patient care.
In the future of healthcare, the rapidly emerging science of bioanalysis has enormous potential. The potential for changing diagnoses and treatments has been demonstrated with the development of miniaturized diagnostic tools, wearable microfluidics devices, multi-analyte detection systems, AI integration, improved sensor materials, smartphone-enabled diagnostics, and standardized platforms.
The growing number of novel applications and advancements has facilitated the integration of enhanced health monitoring capabilities into cell phones. Several smartphones can now conduct sophisticated immunoassays, similar to those often performed in laboratory settings, frequently using additional accessories. The integration of advancements in smartphone technology with microfluidic devices has the potential to significantly revolutionize the healthcare field, particularly in mobile health (mHealth) and disease monitoring. This innovation has the potential to enhance accessibility by enabling smartphone users to access laboratory-like diagnostic capabilities. These developments enable people to take control of their health by providing real-time information, early diagnosis, and personalized therapies. Precision, accessibility, and better medical outcomes will be at the forefront of healthcare in the future as these technologies continue to develop and integrate.
The next phase of microfluidic devices involves novel methodologies for sample collection and preparation, reagent storage, and the development of complete lab-on-a-chip systems. The significance of on-chip sample preparation is often disregarded since most devices available on the market have partial on-chip analysis capabilities. To achieve widespread acceptance among healthcare professionals, it is essential for microfluidic platforms to effectively tackle real-world challenges and substantiate the durability and benefits of microfluidic biochips compared to conventional approaches. Anticipated advancements are foreseen due to the collaborative efforts of the microfluidic lab-on-a-chip community, specialists in biology, and clinical practitioners.
Conflicts of interest
The authors declare that they have no known competing financial interests or personal relationships that could have appeared to influence this paper.Acknowledgements
The CSIR-UGC Junior Research Fellowship greatly assisted NK in his research endeavors, for which we acknowledge and are deeply grateful. We sincerely thank DBT-BIRAC for their invaluable assistance and contributions to MK academic endeavor. PPB is thankful for the fellowship provided by the MHRD and IIT Guwahati.References
- S. Preetam, B. K. Nahak, S. Patra, D. C. Toncu, S. Park, M. Syväjärvi, G. Orive and A. Tiwari, Biosens. Bioelectron.: X, 2022, 10, 100–106 Search PubMed.
- N. T. Nguyen, M. Hejazian, C. H. Ooi and N. Kashaninejad, Micromachines, 2017, 8, 186 CrossRef.
- T. H. Wu, Y. C. Tsai, F. C. Kuo, M. S. Lee, C. C. Hu and G. Bin Lee, Sens. Actuators, B, 2023, 383, 133587 CrossRef CAS.
- S. Nahavandi, S. Baratchi, R. Soffe, S. Y. Tang, S. Nahavandi, A. Mitchell and K. Khoshmanesh, Lab Chip, 2014, 14, 1496–1514 RSC.
- K. Yamamoto, N. Ota and Y. Tanaka, Anal. Chem., 2021, 93, 332–349 CrossRef CAS PubMed.
- J. Hong, J. B. Edel and A. J. deMello, Drug Discovery Today, 2009, 14, 134–146 CrossRef CAS PubMed.
- P. Wang, L. Ge, M. Yan, X. Song, S. Ge and J. Yu, Biosens. Bioelectron., 2012, 32, 238–243 CrossRef CAS PubMed.
- N. Kumar, M. Kumari and R. K. Arun, in Miniaturized Biosensing Devices, Springer Nature Singapore, Singapore, 2022, pp. 99–122 Search PubMed.
- A. Sharma, M. Badea, S. Tiwari and J. L. Marty, Molecules, 2021, 26, 1–32 Search PubMed.
- H. Lee, T. K. Choi, Y. B. Lee, H. R. Cho, R. Ghaffari, L. Wang, H. J. Choi, T. D. Chung, N. Lu, T. Hyeon, S. H. Choi and D. H. Kim, Nat. Nanotechnol., 2016, 11, 566–572 CrossRef CAS PubMed.
- N. P. Shetti, S. D. Bukkitgar, K. R. Reddy, C. V. Reddy and T. M. Aminabhavi, Colloids Surf., B, 2019, 178, 385–394 CrossRef CAS PubMed.
- I. R. Suhito, K. M. Koo and T. H. Kim, Biomedicines, 2021, 9, 1–20 Search PubMed.
- Y. Xiang, C. Hu, G. Wu, S. Xu and Y. Li, TrAC, Trends Anal. Chem., 2023, 158, 116835 CrossRef CAS.
- P. Malik, V. Katyal, V. Malik, A. Asatkar, G. Inwati and T. K. Mukherjee, ISRN Nanomater., 2013, 2013, 1–9 CrossRef.
- M. Kumari, V. Gupta, N. Kumar and R. Kumar, Mol. Biotechnol., 2023, 1–24 CAS.
- X. L. Sanjay, T. Sharma, G. Fu, M. Dou, F. Xu, R. Liu and H. Qi, Analyst, 2015, 140, 7062–7081 RSC.
- B. Yin, X. Wan, A. S. M. M. F. Sohan and L. Xiaodong, Micromachines, 2022, 13(8), 12–38 CrossRef PubMed.
- A. Ganguli, A. Mostafa, J. Berger, M. Y. Aydin, F. Sun, S. A. Stewart de Ramirez, E. Valera, B. T. Cunningham, W. P. King and R. Bashir, Proc. Natl. Acad. Sci. U. S. A., 2020, 117, 22727–22735 CrossRef CAS PubMed.
- K. R. Mitchell, J. E. Esene and A. T. Woolley, Anal. Bioanal. Chem., 2022, 414, 167–180 CrossRef CAS PubMed.
- J. Berthier, Tech. Proc. 2013 NSTI Nanotechnol. Conf. Expo, NSTI-Nanotech 2013, 2013, 2, pp. 342–345.
- E. K. Sackmann, A. L. Fulton and D. J. Beebe, Nature, 2014, 507, 181–189 CrossRef CAS PubMed.
- G. Luka, A. Ahmadi, H. Najjaran, E. Alocilja, M. Derosa, K. Wolthers, A. Malki, H. Aziz, A. Althani and M. Hoorfar, Sensors, 2015, 15, 30011–30031 CrossRef CAS PubMed.
- Z. Li, Y. Bai, M. You, J. Hu, C. Yao, L. Cao and F. Xu, Biosens. Bioelectron., 2021, 177, 112952 CrossRef CAS PubMed.
- W. Su, X. Gao, L. Jiang and J. Qin, J. Chromatogr. A, 2015, 1377, 13–26 CrossRef CAS PubMed.
- D. Migliozzi, B. Pelz, D. G. Dupouy, A. L. Leblond, A. Soltermann and M. A. M. Gijs, Microsyst. Nanoeng., 2019, 5, 59 CrossRef CAS PubMed.
- C. Song, D. Gao, T. Yuan, Y. Chen, L. Liu, X. Chen and Y. Jiang, Chin. Chem. Lett., 2019, 30, 1038–1042 CrossRef CAS.
- W. Xing, Y. Liu, H. Wang, S. Li, Y. Lin, L. Chen, Y. Zhao, S. Chao, X. Huang, S. Ge, T. Deng, T. Zhao, B. Li, H. Wang, L. Wang, Y. Song, R. Jin, J. He, X. Zhao, P. Liu, W. Li and J. Cheng, Engineering, 2020, 6, 1130–1140 CrossRef CAS PubMed.
- P. D. Sinawang, F. Soto, M. O. Ozen, D. Akin and U. Demirci, Prog. Biomed. Eng., 2021, 3, 043001 CrossRef.
- A. M. Urdea, L. A. Penny, S. S. Olmsted, M. Y. Giovanni, P. Kaspar, A. Shepherd, P. Wilson, C. A. Dahl, S. Buchsbaum, G. Moeller and D. C. H. Burgess, Nature, 2006, 444, 73–79 CrossRef PubMed.
- S. Gupta, A. Venkatesh, S. Ray and S. Srivastava, Biochim. Biophys. Acta, Proteins Proteomics, 2014, 1844, 899–908 CrossRef CAS PubMed.
- J. Andrus, Fabrication of semiconductor devices, US Pat., 3122817, 1964 Search PubMed.
- L. Rayleigh, Proc. R. Soc. London, 1879, 29, 71–97 CrossRef.
- M. G. Pollack, A. D. Shenderov and R. B. Fair, Lab Chip, 2002, 2, 96–101 RSC.
- Y. Hou, C. C. Lv, Y. L. Guo, X. H. Ma, W. Liu, Y. Jin, B. X. Li, M. Yang and S. Y. Yao, J. Anal. Test., 2022, 6, 247–273 CrossRef PubMed.
- S. N. Bhatia and D. E. Ingber, Nat. Biotechnol., 2014, 32, 760–772 CrossRef CAS PubMed.
- G. M. Whitesides, Nature, 2006, 442, 368–373 CrossRef CAS PubMed.
- J. Cottet and P. Renaud, in Drug Delivery Devices and Therapeutic Systems, Elsevier, 2021, pp. 3–17 Search PubMed.
- Z. Liao, J. Wang, P. Zhang, Y. Zhang, Y. Miao, S. Gao, Y. Deng and L. Geng, Biosens. Bioelectron., 2018, 121, 272–280 CrossRef CAS PubMed.
- D. Rodrigues, A. I. Barbosa, R. Rebelo, I. K. Kwon, R. L. Reis and V. M. Correlo, Biosensors, 2020, 10, 79 CrossRef PubMed.
- Y. Abbas, J. Miwa, R. Zengerle and F. von Stetten, Micromachines, 2013, 4, 80–89 CrossRef.
- H. Bruus, Theoretical Microfluidics, 1st edn, 2008 Search PubMed.
- R. W. Fox and A. T. McDonald, Introduction to Fluid Mechanics, Wiley, New York, 1985 Search PubMed.
- C. Kleinstreuer, Microfluidics and Nanofluidics: Theory and Selected Applications, Wiley, 2014, vol. 7 Search PubMed.
- S. K. Mitra and S. Chakraborty, Microfluidics and Nanofluidics Handbook-Fabrication, Implementation, and Applications, 2012 Search PubMed.
- L. Lin, Micro/Nano fluidics Enabled Single-Cell Biochemical Analysis, 2019 Search PubMed.
- E. O. Ige, R. K. Arun, P. Singh, M. Gope, R. Saha, N. Chanda and S. Chakraborty, Microfluid. Nanofluid., 2019, 23, 1–8 CrossRef CAS.
- C. Carrell, A. Kava, M. Nguyen, R. Menger, Z. Munshi, Z. Call, M. Nussbaum and C. Henry, Microelectron. Eng., 2019, 206, 45–54 CrossRef CAS.
- L. Chen, C. Yang, Y. Xiao, X. Yan, L. Hu, M. Eggersdorfer, D. Chen, D. A. Weitz and F. Ye, Mater. Today Nano, 2021, 16, 100136 CrossRef CAS.
- L. Chen, C. Yang, Y. Xiao, X. Yan, L. Hu, M. Eggersdorfer, D. Chen, D. A. Weitz and F. Ye, Mater. Today Nano, 2021, 16, 100–136 Search PubMed.
- S. Kumar, S. Kumar, M. A. Ali, P. Anand, V. V. Agrawal, R. John, S. Maji and B. D. Malhotra, Biotechnol. J., 2013, 11, 1267–1279 CrossRef PubMed.
- W. Sparreboom, A. Van Den Berg and J. C. T. Eijkel, Nat. Nanotechnol., 2009, 4, 713–720 CrossRef CAS PubMed.
- S. Bayda, M. Adeel, T. Tuccinardi, M. Cordani and F. Rizzolio, Molecules, 2019, 25, 112 CrossRef PubMed.
- D. G. Haywood, A. Saha-shah, L. A. Baker and S. C. Jacobson, Anal. Chem., 2014, 87, 172–187 CrossRef PubMed.
- H. Foster, M. Wade, J. England, J. Greenman and V. Green, Organs-on-a-Chip, 2021, 3, 100011 CrossRef CAS.
- Y. Ai, R. Xie, J. Xiong and Q. Liang, Small, 2020, 16, 1–24 Search PubMed.
- B. Y. Xia, P. Yang, Y. Sun, Y. Wu, B. Mayers, B. Gates, Y. Yin, F. Kim and H. Yan, Adv. Mater., 2003, 15, 353–389 CrossRef.
- D. Zhang, S. Wei and Z. Guo, MRS Online Proc. Libr., 2009, 1240, 1006 Search PubMed.
- K. E. Bates and H. Lu, Biophys. J., 2016, 110, 1684–1697 CrossRef CAS PubMed.
- K. Y. Lien, C. J. Liu, Y. C. Lin, P. L. Kuo and G. Bin Lee, Microfluid. Nanofluid., 2009, 6, 539–555 CrossRef CAS.
- O. M. Ikumapayi, E. T. Akinlabi, A. O. M. Adeoye and S. O. Fatoba, Mater. Today: Proc., 2021, 44, 1154–1162 CrossRef.
- K. S. Prasad, X. Cao, N. Gao, Q. Jin, S. T. Sanjay, G. Henao-Pabon and X. J. Li, Sens. Actuators, B, 2020, 305, 127516 CrossRef CAS PubMed.
- Y. T. Chen, Y. C. Lee, Y. H. Lai, J. C. Lim, N. T. Huang, C. T. Lin and J. J. Huang, Biosensors, 2020, 10, 1–22 Search PubMed.
- A. Tay, A. Pavesi, S. R. Yazdi, C. T. Lim and M. E. Warkiani, Biotechnol. Adv., 2016, 34, 404–421 CrossRef PubMed.
- K. Mahato, A. Srivastava and P. Chandra, Biosens. Bioelectron., 2017, 96, 246–259 CrossRef CAS PubMed.
- M. Xiao, F. Tian, X. Liu, Q. Zhou, J. Pan, Z. Luo and M. Yang, Adv. Sci., 2022, 9, 2105904 CrossRef CAS PubMed.
- B. Nasseri, N. Soleimani, N. Rabiee, A. Kalbasi, M. Karimi and M. R. Hamblin, Biosens. Bioelectron., 2018, 117, 112–128 CrossRef CAS PubMed.
- R. Rajendran and G. Rayman, J. Diabetes Sci. Technol., 2014, 8, 1081–1090 CrossRef PubMed.
- A. N. Konwar and V. Borse, Sens. Int., 2020, 1, 100015 CrossRef PubMed.
- T. Gou, J. Hu, W. Wu, X. Ding, S. Zhou, W. Fang and Y. Mu, Biosens. Bioelectron., 2018, 120, 144–152 CrossRef CAS PubMed.
- L. Cao, X. Guo, P. Mao, Y. Ren, Z. Li, M. You, J. Hu, M. Tian, C. Yao, F. Li and F. Xu, ACS Sens., 2021, 6, 3564–3574 CrossRef CAS PubMed.
- U. Gupta, N. Kumar, A. Lata, P. Singh and R. K. Arun, Int. J. Biol. Macromol., 2023, 241, 124614 CrossRef CAS PubMed.
- J. R. Mejía-Salazar, K. R. Cruz, E. M. M. Vásques and O. N. de Oliveira, Sensors, 2020, 20, 1–19 CrossRef PubMed.
- U. Gupta, V. Gupta, R. K. Arun and N. Chanda, Biotechnol. Bioeng., 2022, 119, 3393–3407 CrossRef CAS PubMed.
- G. P. Nikoleli, C. G. Siontorou, D. P. Nikolelis, S. Bratakou, S. Karapetis and N. Tzamtzis, Nanotechnol. Biosens., 2018, 375–394 CAS.
- R. Augustine, A. Hasan, S. Das, R. Ahmed, Y. Mori, T. Notomi, B. D. Kevadiya and A. S. Thakor, Biology, 2020, 9, 1–17 CrossRef PubMed.
- E. B. Bahadir and M. K. Sezgintürk, Anal. Biochem., 2015, 478, 107–120 CrossRef CAS PubMed.
- S. K. Sia, V. Linder, B. A. Parviz, A. Siegel and G. M. Whitesides, Angew. Chem., Int. Ed., 2004, 43, 498–502 CrossRef CAS PubMed.
- A. J. Rodriguez-Morales, J. A. Cardona-Ospina, E. Gutiérrez-Ocampo, R. Villamizar-Peña, Y. Holguin-Rivera, J. P. Escalera-Antezana, L. E. Alvarado-Arnez, D. K. Bonilla-Aldana, C. Franco-Paredes, A. F. Henao-Martinez, A. Paniz-Mondolfi, G. J. Lagos-Grisales, E. Ramírez-Vallejo, J. A. Suárez, L. I. Zambrano, W. E. Villamil-Gómez, G. J. Balbin-Ramon, A. A. Rabaan, H. Harapan, K. Dhama, H. Nishiura, H. Kataoka, T. Ahmad and R. Sah, Travel Med. Infect. Dis., 2020, 34, 101623 CrossRef PubMed.
- M. H. Nawaz, A. Hayat, G. Catanante, U. Latif and J. L. Marty, Anal. Chim. Acta, 2018, 1026, 1–7 CrossRef CAS PubMed.
- D. N. D'Ambrosio, R. D. Clugston and W. S. Blaner, Nutrients, 2011, 3, 63–103 CrossRef PubMed.
- J. Yang, K. Wang, H. Xu, W. Yan, Q. Jin and D. Cui, Talanta, 2019, 202, 96–110 CrossRef CAS PubMed.
- Q. Ma, H. Ma, F. Xu, X. Wang and W. Sun, Microsyst. Nanoeng., 2021, 7, 19 CrossRef CAS PubMed.
- A. S. John and C. P. Price, Clin. Biochem. Rev., 2014, 35, 155–167 Search PubMed.
- A. W. Martinez, S. T. Phillips, E. Carrilho, S. W. Thomas, H. Sindi and G. M. Whitesides, Anal. Chem., 2008, 80, 3699–3707 CrossRef CAS PubMed.
- A. Pandya and V. Singh, Micro/Nanofluidics and Lab-on-Chip Based Emerging Technologies for Biomedical and Translational Research Applications - Part A, 1st edn, 2022 Search PubMed.
- C. Dincer, R. Bruch, A. Kling, P. S. Dittrich and G. A. Urban, Trends Biotechnol., 2017, 35, 728–742 CrossRef CAS PubMed.
- S. Chen and M. H. Shamsi, J. Micromech. Microeng., 2017, 27, 083001 CrossRef.
- A. J. P. Martin and R. L. M. Synge, Biochem. J., 1941, 35(12), 1358 CrossRef CAS PubMed.
- F. A. Robinson, R. L. M. Synge, K. A. Williams and F. R. Cropper, Analyst, 1946, 71(843), 251b–267 RSC.
- G. Alarcón-Angeles, G. Arturo, G. Álvarez-Romero, G. Rosati, C. Parolo and A. Merkoçi, Reference module in biomedical sciences, 2022, pp. 772–788 Search PubMed.
- P. Damborský and J. Katrlík, Essays Biochem., 2016, 60(1), 91–100 CrossRef PubMed.
- X. Fan, I. M. White, S. I. Shopova, H. Zhu, J. D. Suter and Y. Sun, Anal. Chim. Acta, 2008, 620, 8–26 CrossRef CAS PubMed.
- J. Liu, J. Wang, Z. Li, H. Meng, L. Zhang, H. Wang, J. Li and L. Qu, Microchim. Acta, 2018, 185, 110 CrossRef PubMed.
- Y. Wang, H. Xu, J. Zhang and G. Li, Sensors, 2008, 8, 2043–2081 CrossRef CAS PubMed.
- W. Jin and G. Maduraiveeran, J. Anal. Sci. Technol., 2018, 9, 18 CrossRef.
- M. Pohanka, Int. J. Anal. Chem., 2021, 1–9 CrossRef.
- J. L. Hammond, N. Formisano, P. Estrela, S. Carrara and J. Tkac, Essays Biochem., 2016, 60(1), 69–80 CrossRef PubMed.
- S. Teanphonkrang, A. Ernst, S. Janke, P. Chaiyen, J. Sucharitakul, W. Suginta, P. Khunkaewla, W. Schuhmann, A. Schulte and A. Ruff, ACS Sens., 2019, 4, 1270–1278 CrossRef CAS PubMed.
- M. Pohanka and P. Skladal, J. Appl. Biomed., 2008, 6, 57–64 CrossRef CAS.
- D. Grieshaber, R. MacKenzie, J. Vörös and E. Reimhult, Sensors, 2008, 8, 1400–1458 CrossRef CAS PubMed.
- A. A. Almehizia, A. M. Naglah, L. S. Alrasheed, M. G. Alanazi, A. E.-G. E. Amr and A. H. Kamel, RSC Adv., 2023, 13, 15199–15207 RSC.
- M. A. Akl, E. S. R. El-Gharkawy, N. A. El-Mahdy, S. M. El-Sheikh and S. M. Sheta, Dalton Trans., 2020, 49, 15769–15778 RSC.
- H. Karimi-Maleh, Y. Orooji, F. Karimi, M. Alizadeh, M. Baghayeri, J. Rouhi, S. Tajik, H. Beitollahi, S. Agarwal, V. K. Gupta, S. Rajendran, A. Ayati, L. Fu, A. L. Sanati, B. Tanhaei, F. Sen, M. Shabani-nooshabadi, P. N. Asrami and A. Al-Othman, Biosens. Bioelectron., 2021, 184, 113252 CrossRef CAS PubMed.
- V. Climent and J. M. Feliu, in Encyclopedia of Interfacial Chemistry, Elsevier, 2018, pp. 48–74 Search PubMed.
- H. Bakhsh, I. M. Palabiyik, R. Kumar Oad, N. Qambrani, J. A. Buledi, A. R. Solangi, S. Tufail and H. Sherazi, J. Electroanal. Chem., 2022, 9, 116181 CrossRef.
- P. Singh, S. Mandal, D. Roy and N. Chanda, ACS Biomater. Sci. Eng., 2021, 7, 3446–3458 CrossRef CAS PubMed.
- M. Grossi and B. Riccò, J. Sens. Sens. Syst., 2017, 6, 303–325 CrossRef.
- A. Barhoum and R. J. Forster, Anal. Chim. Acta, 2022, 1225, 340226 CrossRef CAS PubMed.
- E. B. Aydın, M. Aydın and M. K. Sezgintürk, Macromol. Biosci., 2023, 23, 1–13 CrossRef PubMed.
- H. Oz, Nutrients, 2017, 9, 1085 CrossRef PubMed.
- S. Prasad, Nanobiosens. Dis. Diagn., 2014, 1 Search PubMed.
- Y. Li, D. Li, P. Zhao, K. Nandakumar, L. Wang and Y. Song, Micromachines, 2020, 11, 1–18 Search PubMed.
- P. Ranjan, A. Parihar, S. Jain, N. Kumar, C. Dhand, S. Murali, D. Mishra, S. K. Sanghi, J. P. Chaurasia, A. K. Srivastava and R. Khan, Anal. Biochem., 2020, 610, 113996 CrossRef CAS PubMed.
- B. Arévalo, V. Serafín, M. Garranzo-Asensio, R. Barderas, P. Yáñez-Sedeño, S. Campuzano and J. M. Pingarrón, Biosens. Bioelectron.: X, 2023, 13, 100325 Search PubMed.
- Y. Song, B. Lin, T. Tian, X. Xu, W. Wang, Q. Ruan, J. Guo, Z. Zhu and C. Yang, Anal. Chem., 2019, 91, 388–404 CrossRef CAS PubMed.
- A. Sguassero, Á. Artiga, C. Morasso, R. R. Jimenez, R. M. Rapún, R. Mancuso, S. Agostini, A. Hernis, A. Abols, A. Linē, A. Gualerzi, S. Picciolini, M. Bedoni, M. Rovaris, F. Gramatica, J. M. de la Fuente and R. Vanna, Anal. Bioanal. Chem., 2019, 411, 1873–1885 CrossRef CAS PubMed.
- L. Zhang, G. Masetti, G. Colucci, M. Salvi, D. Covelli, A. Eckstein, U. Kaiser, M. S. Draman, I. Muller, M. Ludgate, L. Lucini and F. Biscarini, Sci. Rep., 2018, 8, 1–14 Search PubMed.
- A. Márquez, J. Aymerich, M. Dei, R. Rodríguez-Rodríguez, M. Vázquez-Carrera, J. Pizarro-Delgado, P. Giménez-Gómez, Á. Merlos, L. Terés, F. Serra-Graells, C. Jiménez-Jorquera, C. Domínguez and X. Muñoz-Berbel, Biosens. Bioelectron., 2019, 136, 38–46 CrossRef PubMed.
- A. L. Mitchell and S. H. S. Pearce, Nat. Rev. Endocrinol., 2012, 8, 306–316 CrossRef CAS PubMed.
- H. E. Prince, Biomarkers, 2005, 10(Suppl 1), 44–49 Search PubMed.
- F. Ghorbani, H. Abbaszadeh, A. Mehdizadeh, M. Ebrahimi-Warkiani, M. R. Rashidi and M. Yousefi, Microchim. Acta, 2019, 186, 1–11 CrossRef PubMed.
- A. T. Giannitsis, Est. J. Eng., 2011, 17, 109–139 CrossRef CAS.
- R. Villela and R. Correa, Clin. Thyroidol., 2022, 34, 147–149 CrossRef PubMed.
- S. E. Gabriel and C. S. Crowson, Up to Date, 2018, p. 20181.
- A. Mobed, S. Dolati, S. K. Shakouri, B. Eftekharsadat and B. Izadseresht, Sens. Actuators, A, 2021, 331, 112975 CrossRef CAS.
- R. F. Standard, HEUMATOID FACTOR (RF) ImmunoTurbidimetry 3rd Generation, https://www.sdi-fz.com/wp- content/uploads/2021/12/Rheumatoid-Factor-RF-Immunoturbidimetry.pdf, (accessed October 2021) Search PubMed.
- U. G. Longo, V. Candela, A. Berton, S. De Salvatore, S. Fioravanti, L. Giannone, A. Marchetti, M. G. De Marinis and V. Denaro, Biosensors, 2021, 11, 31 CrossRef CAS PubMed.
- A. Alonso and M. A. Hernán, Neurology, 2008, 71, 129–135 CrossRef PubMed.
- M. I. Teixeira, M. H. Amaral, P. C. Costa, C. M. Lopes and D. A. Lamprou, Pharmaceutics, 2020, 12, 1–37 Search PubMed.
- T. Ziemssen, K. Akgün and W. Brück, J. Neuroinflammation, 2019, 16, 1–11 CrossRef PubMed.
- B. E. Kerman, H. J. Kim, K. Padmanabhan, A. Mei, S. Georges, M. S. Joens, J. A. J. Fitzpatrick, R. Jappelli, K. J. Chandross, P. August and F. H. Gage, Development, 2015, 142, 2213–2225 CrossRef CAS PubMed.
- M. Mobasseri, M. Shirmohammadi, T. Amiri, N. Vahed, H. H. Fard and M. Ghojazadeh, Health Promot. Perspect., 2020, 10, 98–115 CrossRef PubMed.
- C. Chen, X. L. Zhao, Z. H. Li, Z. G. Zhu, S. H. Qian and A. J. Flewitt, Sensors, 2017, 17, 1–19 Search PubMed.
- S. S. Poudyal, PhD thesis, South Dakota State University, 2017, p. 2156 Search PubMed.
- S. A. Tanumihardjo, J. Nutr., 2016, 146, 1816S–1848S CrossRef CAS PubMed.
- Z. Lu, D. O'Dell, B. Srinivasan, E. Rey, R. Wang, S. Vemulapati, S. Mehta, D. Erickson and A. Sommer, Proc. Natl. Acad. Sci. U. S. A., 2017, 114, 13513–13518 CrossRef CAS PubMed.
- J. Hix, C. Martinez, I. Buchanan, J. Morgan, M. Tam and A. Shankar, Am. J. Clin. Nutr., 2004, 79, 93–98 CrossRef CAS PubMed.
- M. V. Gamble, R. Ramakrishnan, N. A. Palafox, K. Briand, L. Berglund and W. S. Blaner, Am. J. Clin. Nutr., 2001, 73, 594–601 CrossRef CAS PubMed.
- S. de Pee and O. Dary, J. Nutr., 2002, 132, 2895S–2901S CrossRef CAS PubMed.
- N. I. Krinsky, J. Nutr., 2004, 134, 290–293 CrossRef PubMed.
- V. P. Prakashan, G. Gejo, M. S. Sanu, M. S. Sajna, T. Subin, P. R. Biju and J. Cyriac, Appl. Surf. Sci., 2019, 484, 219–227 CrossRef CAS.
- World Health Organization, Evaluating the public health significance of micronutrient malnutrition, WHO, Geneva, Switzerland, 2009 Search PubMed.
- M. B. Zimmermann and R. F. Hurrell, Lancet, 2007, 370, 511–520 CrossRef CAS PubMed.
- W. P. Goddard, I. Murray, R. G. Long, B. Scott, R. Barton, M. Salman, R. Frewin, D. Provan and A. Henson, BMJ, 1997, 314, 1759 CrossRef CAS PubMed.
- O. Oshin, D. Kireev, H. Hlukhova, F. Idachaba, D. Akinwande and A. Atayero, Sensors, 2020, 20, 3688 CrossRef CAS PubMed.
- S. Vemulapati, E. Rey, D. O'Dell, S. Mehta and D. Erickson, Sci. Rep., 2017, 7, 14142 CrossRef CAS PubMed.
- S. Lee, D. O'Dell, J. Hohenstein, S. Colt, S. Mehta and D. Erickson, Sci. Rep., 2016, 6, 1–8 CrossRef CAS PubMed.
- J. R. Sempionatto, A. A. Khorshed, A. Ahmed, A. N. De Loyola, E. Silva, A. Barfidokht, L. Yin, K. Y. Goud, M. A. Mohamed, E. Bailey, J. May, C. Aebischer, C. Chatelle and J. Wang, ACS Sens., 2020, 5, 1804–1813 CrossRef CAS PubMed.
- V. Ganji, C. Milone, M. M. Cody, F. McCarty and Y. T. Wang, Int. Arch. Med., 2010, 3, 29 CrossRef PubMed.
- P. Knekt, A. Kilkkinen, H. Rissanen, J. Marniemi, K. Sääksjärvi and M. Heliövaara, Arch. Neurol., 2010, 67, 808–811 CrossRef PubMed.
- L. R. Wilson, L. Tripkovic, K. H. Hart and S. A. Lanham-New, Proc. Nutr. Soc., 2017, 76, 392–399 CrossRef PubMed.
- H. Peter, N. Bistolas, S. Schumacher, C. Laurisch, P. C. Guest, U. Höller and F. F. Bier, Methods Mol. Biol., 2018, 1735, 477–486 CrossRef CAS PubMed.
- F. Wokes, J. Badenoch and H. M. Sinclair, Am. J. Clin. Nutr., 1955, 3, 375–382 CrossRef CAS PubMed.
- E. Moore, A. Mander, D. Ames, R. Carne, K. Sanders and D. Watters, Int. Psychogeriatr., 2012, 24, 541–556 CrossRef PubMed.
- S. P. Stabler and R. H. Allen, Annu. Rev. Nutr., 2004, 24, 299–326 CrossRef CAS PubMed.
- M. A. O. Dawood and S. Koshio, Rev. Aquac., 2018, 10, 334–350 CrossRef.
- C. M. Nam, K. W. Oh, K. H. Lee, I. Suh, S. Y. Cho, W. H. Shim and S. H. Jee, J. Am. Coll. Nutr., 2003, 22, 372–378 CrossRef CAS PubMed.
- P. C. Calder, A. C. Carr, A. F. Gombart and M. Eggersdorfer, Nutrients, 2020, 12, 1–3 Search PubMed.
- I. Cirilli, P. Orlando, S. Silvestri, F. Marcheggiani, P. V. Dludla, N. Kaesler and L. Tiano, BioFactors, 2022, 48, 1129–1136 CrossRef CAS PubMed.
- D. Neutze and J. Roque, Am. Fam. Physician, 2016, 93, 279–286 Search PubMed.
- R. E. Taylor and P. M. Blatt, J. Am. Acad. Dermatol., 1981, 4, 348–368 CrossRef CAS PubMed.
- P. Mladěnka, K. Macáková, L. Kujovská Krčmová, L. Javorská, K. Mrštná, A. Carazo, M. Protti, F. Remião and L. Nováková, Nutr. Rev., 2022, 80, 677–698 CrossRef PubMed.
- H. Li, B. Dong, L. Dou, W. Yu, X. Yu, K. Wen, Y. Ke, J. Shen and Z. Wang, Sens. Actuators, B, 2020, 324, 128771 CrossRef CAS.
- A. I. Kathrada, S. C. Wei, Y. Xu, L. F. Cheow and C. H. Chen, Biomicrofluidics, 2020, 14, 1–10 CrossRef PubMed.
- X. Huang, Y. Zhu and E. Kianfar, J. Mater. Res. Technol., 2021, 12, 1649–1672 CrossRef CAS.
- A. Parihar, S. Jain, D. S. Parihar, P. Ranjan and R. Khan, Biosensor Based Advanced Cancer Diagnostics, Academic Press, 2022, pp. 47–57 Search PubMed.
- C. Mathieu, R. Lahesmaa, E. Bonifacio, P. Achenbach and T. Tree, Diabetologia, 2018, 61, 2252–2258 CrossRef CAS PubMed.
- X. Lin, H. Wu, S. Zeng, T. Peng, P. Zhang, X. Wan, Y. Lang, B. Zhang, Y. Jia, R. Shen and B. Yin, Biosens. Bioelectron., 2023, 230, 115283 CrossRef CAS PubMed.
- C. Chen, B. Ran, B. Liu, X. Liu, Z. Zhang, Y. Li, H. Li, M. Lan and Y. Zhu, Anal. Chim. Acta, 2023, 1272, 341450 CrossRef CAS PubMed.
- B. Yin, C. Qian, X. Wan, A. S. M. Muhtasim Fuad Sohan and X. Lin, Biosens. Bioelectron., 2022, 212, 114429 CrossRef CAS PubMed.
- T. W. Chen, R. Gandotra, H. Y. Chang, M. S. Lee, F. C. Kuo and G. Bin Lee, Anal. Chem., 2023, 95, 7693–7701 CrossRef CAS PubMed.
- G. J. Kost, Proceedings of the San Diego Biomedical Symposium, Academic Press, 1977, vol. 16, pp. 25–33 Search PubMed.
- K. Hyde, S. M. Lewis, I. J. Mackie, R. M. Rowan, B. J. Bain, E. M. Matutes, M. F. Murphy, K. Shinton, A. Stephens, J. K. Wood, B. T. Colvin, S. J. Machin, T. Baglin, T. W. Barrowcliffe, M. Greaves, C. A. Ludlam, F. E. Preston, P. E. Rose and I. D. Walker, Clin. Lab. Haematol., 1995, 17, 301–310 Search PubMed.
- G. J. Kost, M. A. Jammal, R. E. Ward and A. M. Safwat, Am. J. Clin. Pathol., 1986, 86, 61–70 CrossRef CAS PubMed.
- T. Nguyen, D. Duong Bang and A. Wolff, Micromachines, 2019, 1–7 Search PubMed.
- N. Rabiee, M. Bagherzadeh, A. Ghasemi and H. Zare, Int. J. Mol. Sci., 2020, 21, 5126 CrossRef CAS PubMed.
- F. Di Nardo, M. Chiarello, S. Cavalera, C. Baggiani and L. Anfossi, Sensors, 2021, 21, 5185 CrossRef CAS PubMed.
- X. Liu, X. Zhu, G. J. Kost, J. Liu, J. Huang and X. Liu, Point Care, 2019, 18, 77–84 CrossRef.
- G. J. Kost, Front. Public Health, 2019, 7, 329 CrossRef PubMed.
- P. Rojanasantikul, P. Pattrapornpisut, K. Anuruckparadorn and W. Katchamart, Clin. Rheumatol., 2014, 33, 919–923 CrossRef PubMed.
- L. Mardani, M. T. Vardini, M. Es'Haghi and E. Ghorbani Kalhor, Anal. Methods, 2020, 12, 333–344 RSC.
- B. Derkus, E. Emregul, C. Yucesan and K. Cebesoy Emregul, Biosens. Bioelectron., 2013, 46, 53–60 CrossRef CAS PubMed.
- A. Biela, M. Watkinson, U. C. Meier, D. Baker, G. Giovannoni, C. R. Becer and S. Krause, Biosens. Bioelectron., 2015, 68, 660–667 CrossRef CAS PubMed.
- T. Liu, S. Zhang, W. Liu, S. Zhao, Z. Lu, Y. Wang, G. Wang, P. Zou, X. Wang, Q. Zhao and H. Rao, Sens. Actuators, B, 2020, 305, 127524 CrossRef CAS.
- H. B. Lee, M. Meeseepong, T. Q. Trung, B. Y. Kim and N. E. Lee, Biosens. Bioelectron., 2020, 156, 112133 CrossRef CAS PubMed.
- M. S. Khan, K. Dighe, Z. Wang, I. Srivastava, A. S. Schwartz-Duval, S. K. Misra and D. Pan, Analyst, 2019, 144, 1448–1457 RSC.
- B. Srinivasan, J. L. Finkelstein, D. O'Dell, D. Erickson and S. Mehta, EBioMedicine, 2019, 42, 504–510 CrossRef PubMed.
- B. Srinivasan, D. O'Dell, J. L. Finkelstein, S. Lee, D. Erickson and S. Mehta, Biosens. Bioelectron., 2018, 99, 115–121 CrossRef CAS PubMed.
- S. Wadhwa, A. T. John, S. Nagabooshanam, A. Mathur and J. Narang, Appl. Surf. Sci., 2020, 521, 146427 CrossRef CAS.
- F. Polli, C. D'Agostino, R. Zumpano, V. De Martino, G. Favero, L. Colangelo, S. Minisola and F. Mazzei, Talanta, 2023, 251, 123755 CrossRef CAS PubMed.
- M. Bhaiyya, P. K. Pattnaik and S. Goel, Sens. Actuators, A, 2021, 331, 112831 CrossRef CAS.
Footnote |
| † These authors contributed equally. |
| This journal is © The Royal Society of Chemistry 2023 |