A comprehensive analysis of library preparation methods shows high heterogeneity of extrachromosomal circular DNA but distinct chromosomal amount levels reflecting different cell states†
Wenxiang
Lu
 a,
Fuyu
Li
a,
Yunfei
Ouyang
a,
Yali
Jiang
b,
Weizhong
Zhang
*c and
Yunfei
Bai
a,
Fuyu
Li
a,
Yunfei
Ouyang
a,
Yali
Jiang
b,
Weizhong
Zhang
*c and
Yunfei
Bai
 *a
*a
aState Key Laboratory of Digital Medical Engineering, School of Biological Science and Medical Engineering, Southeast University, Nanjing, Jiangsu 210096, China. E-mail: whitecf@seu.edu.cn
bThe Friendship Hospital of Ili Kazakh Autonomous Prefecture, Ili & Jiangsu Joint Institute of Health, Yining, Xinjiang Uygur Autonomous Region 835000, China
cDepartment of Ophthalmology, First Affiliated Hospital of Nanjing Medical University, Nanjing, Jiangsu 210029, China
First published on 15th November 2023
Abstract
Extrachromosomal circular DNA (eccDNA) was discovered several decades ago, but little is known about its function. With the development of sequencing technology, several library preparation methods have been developed to elucidate the biogenesis and function of eccDNA. However, different treatment methods have certain biases that can lead to their erroneous interpretation. To address these issues, we compared the performance of different library preparation methods. Our investigation revealed that the utilization of rolling-circle amplification (RCA) and restriction enzyme linearization of mitochondrial DNA (mtDNA) significantly enhanced the efficiency of enriching extrachromosomal circular DNA (eccDNA). However, it also introduced certain biases, such as an unclear peak in ∼160–200 bp periodicity and the absence of a typical motif pattern. Furthermore, given that RCA can lead to a disproportionate change in copy numbers, eccDNA quantification using split and discordant reads should be avoided. Analysis of the genomic and elements distribution of the overall population of eccDNA molecules revealed a high correlation between the replicates, and provided a possible stability signature for eccDNA, which could potentially reflect different cell lines or cell states. However, we found only a few eccDNA with identical junction sites in each replicate, showing a high degree of heterogeneity of eccDNA. The emergence of different motif patterns flanking junctional sites in eccDNAs of varying sizes suggests the involvement of multiple potential mechanisms in eccDNA generation. This study comprehensively compares and discusses various essential approaches for eccDNA library preparation, offering valuable insights and practical advice to researchers involved in characterizing eccDNA.
1. Introduction
Extrachromosomal circular DNA (eccDNA) is a type of circular DNA that has been found in both normal and tumor cells.1 In recent years, research on eccDNA has advanced significantly, largely relying on sequencing-based technologies. These powerful methods have undergone technological advancements and allow for comprehensive sequence characterization of these DNA elements. eccDNA can vary in size, ranging from a few dozen base pairs, and recent studies have discovered their ability to regulate gene expression and immune response.2,3 Furthermore, some eccDNA molecules are long enough to contain entire gene bodies, thereby promoting tumor progression.4 Owing to the covalently closed circular structure of eccDNA, cell-free eccDNA is also been explored as a novel biomarker in liquid biopsies.5 The most commonly used approach for identifying eccDNA of all sizes on a genome scale is called Circle-Seq.6 This method involves isolating crude circular DNAs from linear DNA through alkaline lysis, followed by the use of an exonuclease to digest any remaining linear contaminating DNA from free ends. An effective protocol involves the utilization of a specific restriction enzyme to create additional accessible DNA ends or linearize mitochondrial DNA (mtDNA), facilitating exonuclease digestion. Finally, the purified circular DNA undergoes rolling-circle amplification (RCA) for enrichment before sequencing.Despite the widespread use of this approach in eccDNA research and other fields,7–11 there are still several fundamental technical questions that need to be addressed. First, caution must be exercised regarding the specificity and efficacy of the endonuclease used, as it could potentially lead to the loss of eccDNA if the cutting site is present within these structures. For example, the restriction enzyme PacI has been used to isolate eccDNA,3 but the PacI cutting site is present multiple times within the human EGFR gene body, which is an important oncogene and frequently forms eccDNA in cancer. Second, rolling-circle amplification exhibits a bias towards amplifying smaller eccDNA molecules and can generate chimeras through branching and template switching, thereby limiting the accuracy of determining copy numbers and structures of eccDNAs.12–14 Furthermore, different library preparation strategies can result in the reconstruction of different contents of eccDNA. In the case of the transposase-based tagmentation method, Tn5 insertion sites exhibit a bias towards sequences containing guanosine (G) and cytidine (C).15 Additionally, single-stranded eccDNA can be lost without in vitro RCA amplification, as Tn5 transposon can only tagment and amplify double-stranded DNA.16 These considerations are particularly relevant when aiming to achieve accurate and comprehensive characterization of eccDNA, given its inherent heterogeneity and low abundance.17,18 Therefore, conducting a detailed analysis of the nature of these biases is essential for both the careful interpretation of eccDNA characterization and the discovery of early diagnostic biomarkers.
Here, we designed a study to evaluate the performance of various library preparation methods using a comprehensive set of metrics. To achieve this, we began with a single sample of crude eccDNA from a human cell line. Subsequently, we constructed a set of libraries for each treatment and subjected them to sequencing. By analyzing metrics such as enrichment efficiency, size distribution, and the percentage of eccDNAs present in different chromosomes and genomic elements, we have generated valuable scientific insights and recommendations regarding the use of different protocols for eccDNA characterization and explore of eccDNA as a potential biomarker.
2. Experimental
2.1 Cell cultures
The HEK-293T cell line was used to assess the performance of different library preparation methods. The HepG2, MDA-MB-453, MCF-12A, GES-1, and HL7702 cell lines were used to examine the clustering of genomic elements. HEK-293T and MCF-12A cell lines were purchased from Procell Life Science & Technology Co., Ltd (Wuhan, China). HepG2, MDA-MB-453, GES-1, and HL7702 cell lines were obtained from the cell resource center of Shanghai Institutes for Biological Sciences, Chinese Academy of Sciences. HEK-293T, HepG2, and MDA-MB-453 cells were cultured in Dulbecco's Modified Eagle Medium (DMEM) (Gibco), while MCF-12A, GES-1, and HL7702 cells were cultured in Roswell Park Memorial Institute (RPMI) 1640 medium (Gibco). Both media were supplemented with 10% fetal bovine serum (HyClone), 100 units per mL penicillin (Thermo Fisher), and 100 μg mL−1 streptomycin (Thermo Fisher). The cells were incubated at 37 °C in a humidified incubator with 5% CO2.2.2 Purification and enrichment of eccDNA
Crude circular DNA from HEK-293T cell line was purified using the Plasmid Mini AX Kit (A&A Biotechnology). All the replicates were derived from the same crude circular DNA. The crude circular DNA was treated with FastDigest MssI (Thermo Fisher), PacI (New England Biolabs), or NotI (New England Biolabs) at 37 °C for 16 h to generate additional accessible DNA ends for exonuclease digestion. As a non-digestion control, some samples proceeded directly to the subsequent step without digestion. To remove the remaining linear DNA, Plasmid-Safe ATP-dependent DNase (Epicentre) was used at 37 °C for 5 days, with the addition of ATP and DNase every 24 h. To confirm the elimination of linear chromosomal DNA, a quantitative polymerase chain reaction (qPCR) was performed to amplify a chromosomal marker, enabling the evaluation of linear chromosomal DNA following exonuclease digestion.19 Subsequently, the exonuclease solution was heat inactivated at 70 °C for 30 min and purified using AMPure XP beads (Beckman).2.3 Library preparation and sequencing
For the RCA group, the purified eccDNAs were subjected to rolling circle amplification using the REPLI-g Mini Kit (Qiagen), and the amplified product was purified using AMPure XP beads. In the sonication-based approach, the amplified DNA was sheared using Covaris M220 sonicators, and the NEBNext Ultra II DNA Library Prep Kit for Illumina (New England Biolabs) was used to prepare the library. This method was used to prepare libraries for the cell lines used in the clustering analysis. In the segmentation-based approach, the TruePrep DNA Library Pre Kit V2 for Illumina (Vazyme) was used to fragment the RCA products and construct libraries according to the manufacturer's instructions. For the non-RCA group, the TruePrep DNA Library Prep Kit V2 for Illumina (Vazyme) was used to directly tagment pure eccDNAs from the exonuclease digestion products, followed by PCR amplification with Illumina sequencing adaptors. Sequencing of these libraries was performed on the Illumina Novaseq 6000 platform in 150 bp paired-end mode.For the nanopore sequencing library preparation, the high branch structure of the RCA products was debranched using T7 Endonuclease I (NEB), followed by the Ligation Sequencing Kit (Oxford Nanopore) to prepare the library. The library was sequenced on the MinION device according to the manufacturer's instructions.
2.4 eccDNA sequencing data analysis
Paired-end reads were filtered using FastQC20 and aligned to the human reference genome (GRCh38) using the default settings of BWA-MEM.21 The detection of eccDNA was performed using Circle_finder22 with an argument of minNonOverlap between two split reads equal to 10. Mitochondrial eccDNA and eccDNA longer than 5 Mb were filtered out. Clusters of circles within a distance smaller than 10 bp were merged. In the RCA group, circles with less than junctional tag = 2 split reads at the junction were filtered out, while in the non-RCA group, eccDNA with junctional tag ≥ 1 were retained for further analysis. For nanopore sequencing data, eccDNA identification was performed using Flec23 with default parameters. Genomic element annotation of eccDNA was conducted by downloading genomic annotation data from UCSC and using BedTools (v2.30.0)24 software for annotation. The normalized genomic coverage of eccDNA in each class of genomic element was calculated using the following formula:25 divide the percentage of DNA molecules mapped to that class of genomic elements by the percentage of the genome covered by that class of elements. Hierarchical cluster analysis was performed using the Pheatmap package in R. For motif analysis of eccDNA junctional sites, Bedtools (v2.30.0)24 software was used to extract 10 bp up- and down-stream DNA sequences of each eccDNA junction site. The motif signature of the eccDNA fragment junction site was visualized using the ggseqlogo (v0.1)26 software. Pearson's correlation test was used for correlation analysis. Comparisons between groups were conducted using Student's t-test. Data were presented as mean ± standard error of the mean.3. Results
3.1 Sample preparation for sequencing
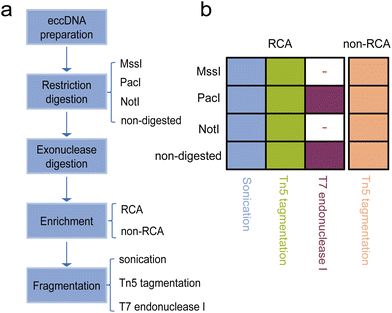
We evaluated different treatment approaches focusing on three important steps in the eccDNA library preparation process. Firstly, we performed the restriction digestion step using three different restriction enzymes that have been used in different protocols.3,27 The purpose of this step was to create additionally accessible DNA ends or linearize mtDNA (Fig. 1a). Among the enzymes tested, the NotI site was absent in human mtDNA, MssI could cut human mtDNA once, and the PacI recognition site was present three times in human mtDNA. Additionally, as a control, we prepared non-restriction digestion samples for sequencing. For the enrichment step, we employed different strategies with or without RCA to enrich eccDNA populations. Based on previous studies,3,25 we utilized the transposase-based library preparation method for non-RCA samples as it is better suited for low amounts of starting material. Furthermore, we performed sonication and transposase-based tagmentation to fragment the RCA products, followed by the corresponding next generation sequencing (NGS) library preparation. Additionally, we tested a full-length eccDNA sequencing technique that combined RCA amplification with nanopore sequencing. This technique allowed us to identify eccDNA not only based on breakpoints but also by intact tandem multiple copies of the template eccDNA sequences. Overall, we prepared a total of 28 sequencing libraries, encompassing 14 different combinations of the restriction digestion stage, enrichment stage, and library preparation protocol. Each combination was repeated twice (Fig. 1b).3.2 Comparison of enrichment efficiency of eccDNA
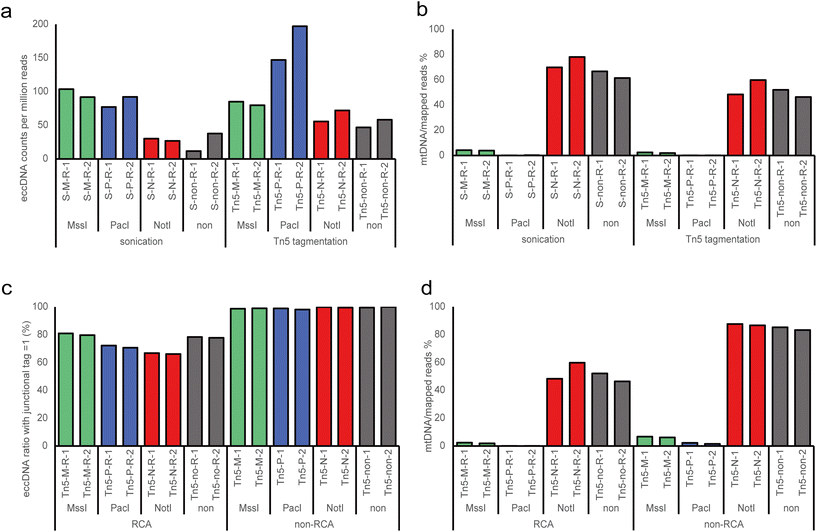
High-throughput sequencing revealed more than 35 million clean reads in each individual replicates (Table S1†). Meanwhile, significantly variations in mtDNA contents were observed, ranging from 0.13% to 87.70% across different treatments. We identified eccDNAs using the Circle_finder software, which is effective for both RCA and non-RCA data,22,28,29 allowing us to use the same analysis method to screen eccDNAs from different treatments. The eccDNA counts of each sample were normalized as eccDNA per million mapped reads. To assess the enrichment efficiency of eccDNA, we first evaluated the normalized eccDNA counts using RCA data (Fig. 2a). We observed that MssI and PacI digestion exhibited significant enrichment efficiency for eccDNA molecules, despite exonuclease being used to digest linear DNA in all conditions. In the sonication group, the MssI and PacI digested samples demonstrated considerable enrichment efficiency with a more than 2-fold increase compared to the NotI and non-digested groups. In the Tn5 tagmentation group, the PacI-treated samples displayed the highest enrichment efficiency, showing nearly a 2-fold increase compared to the other groups. Again, the NotI and non-digested groups exhibited the least enrichment efficiency, although there was an improvement compared to the corresponding treatment in the sonication group. Considering that NotI cannot cut human mtDNA, we believe that the mtDNA content is an important factor influencing the enrichment efficiency of eccDNA of genomic origin. Next, we assessed the fraction of reads aligning to mtDNA and observed that over 50% of reads mapped to mtDNA in the NotI and non-digested groups (Fig. 2b), while the ratio was less than 5% in the MssI group and nearly negligible in the PacI group. In summary, endonucleases with restriction sites in mtDNA cleave the mtDNA, while Tn5 tagmentation amplifies the yield of eccDNA.3.3 Effects of rolling-circle amplification on eccDNA detection
The identification of eccDNA relies on the detection of circular DNA breakpoints, and nearly all short read-based detection tools filter eccDNA-producing loci based on the number of split and discordant reads to improve accuracy.30,31 RCA is a common method used to enrich eccDNA by increasing the copy number of eccDNAs, thereby enhancing the signal of split and discordant reads. However, RCA may introduce biases in the identification and amount of different eccDNAs detected. When applying the same filter parameters as the RCA group (junctional tag > 1), we found a very small amount of eccDNAs in the non-RCA group, even after treatment with MssI and PacI (Table S1†). Considering that eccDNAs are typically present in low copy numbers and are small in size,32 we utilized junctional tag ≥ 1 to filter eccDNA. We observed a very high ratio of eccDNA with a junctional tag = 1 in the non-RCA group (approximately 99%), which dramatically decreased in the RCA group (about 70–80%) (Fig. 2c). Furthermore, we compared the mtDNA content between the non-RCA and RCA groups and found a significantly higher ratio in the non-RCA group (Fig. 2d). Importantly, we noticed that the mtDNA content remained relatively stable (85.79 ± 1.62%) in NotI and non-digested samples in the non-RCA group, whereas the ratio was about 3-fold higher in the MssI group (6.46 ± 0.29%) compared to the PacI group (1.93 ± 0.40%) in non-RCA samples. Interestingly, MssI cuts human mtDNA once, while PacI cuts human mtDNA three times, corresponding to the observed difference in residual mtDNA content. Therefore, we infer that there is minimal bias in the non-RCA groups, and about 85% of mtDNA was present in the original samples. In summary, RCA improves the detection of eccDNA by more efficiently enriching eccDNA compared to mtDNA, possibly due to the smaller size of most eccDNAs and RCA's bias towards the amplification of smaller molecules. Given that RCA can lead to a disproportionate change in copy numbers, researchers should avoid it when performing eccDNA quantification.3.4 Size distributions and GC content of eccDNA
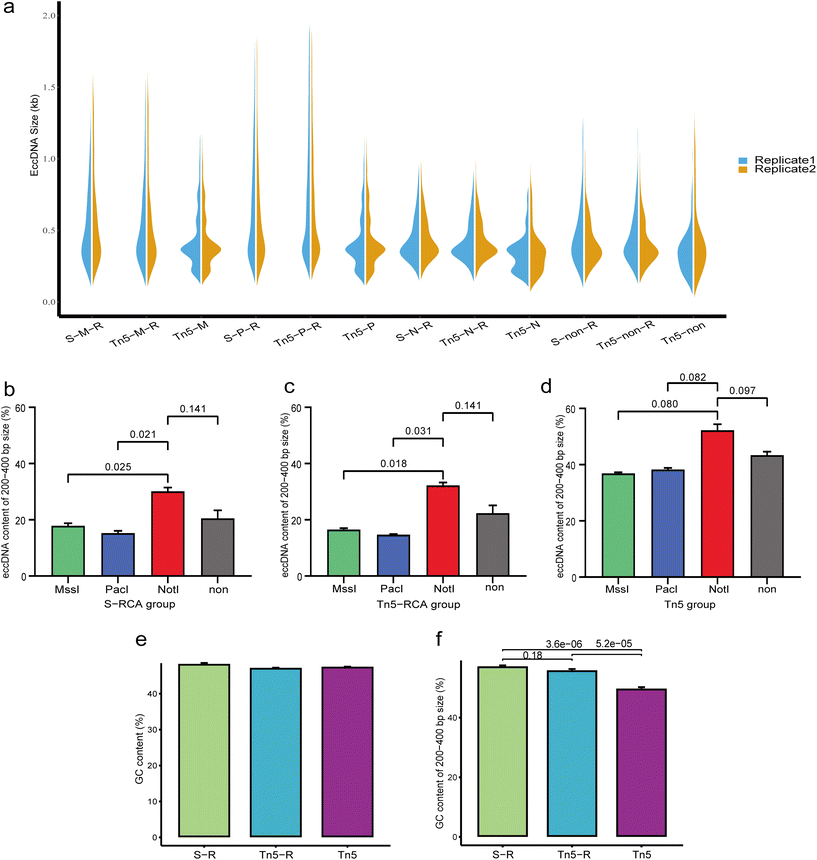
Analysis of the size distribution of eccDNA revealed that the majority of eccDNAs were concentrated between 0.1 kb and 1 kb in each treatment group (Fig. 3a). Interestingly, a similar size distribution was observed in the same restriction enzyme that was used to treat samples in the RCA group, particularly with noticeable changes in the 200–400 bp peak patterns. In the non-RCA group, we observed distinct enrichment of eccDNAs in four characteristic peaks at approximately 200, 400, 550, and 700 bp, with a periodicity of ∼160–200 bp. However, the 200 bp peak appeared less prominent in the RCA group. In both the RCA and non-RCA groups, the 400 bp peak was consistently the most pronounced. This suggests that the reduced visibility of the 200 bp peak in the RCA group may be attributed to the RCA progress. To further examine the abundance of eccDNAs in the 200–400 bp size range, we calculated the percentage of these molecules (Fig. 3b and c). In the RCA group, eccDNAs of this size detected by NotI digestion exhibited higher abundance (30.10 ± 1.36% for the sonication group and 32.20 ± 1.05% for the Tn5 tagmentation group) compared to those detected by other digestion methods (17.86 ± 0.94% for MssI digestion and 15.26 ± 0.82% for PacI digestion in the sonication group, and 16.54 ± 0.49% for MssI digestion and 14.73 ± 0.22% for PacI digestion in the Tn5 tagmentation group). Similarly in the non-RCA group, eccDNAs of this size were most abundant in the NotI digestion samples (Fig. 3d).Furthermore, we analyzed the GC content of eccDNAs. Overall, the eccDNAs exhibited considerable GC content in each group, but the 200–400 bp size range showed significant differences (Fig. 3e and f). The GC content of eccDNAs in the 200–400 bp range was 44.3 ± 1.85% for the non-RCA group, which was lower than the values of 51.05 ± 1.45% for the sonication-RCA group and 49.84 ± 1.76% for the Tn5 tagmentation-RCA group. In summary, the RCA and enzyme digestion steps influenced the size distribution and GC content of eccDNAs.
3.5 Genomic distribution of eccDNA
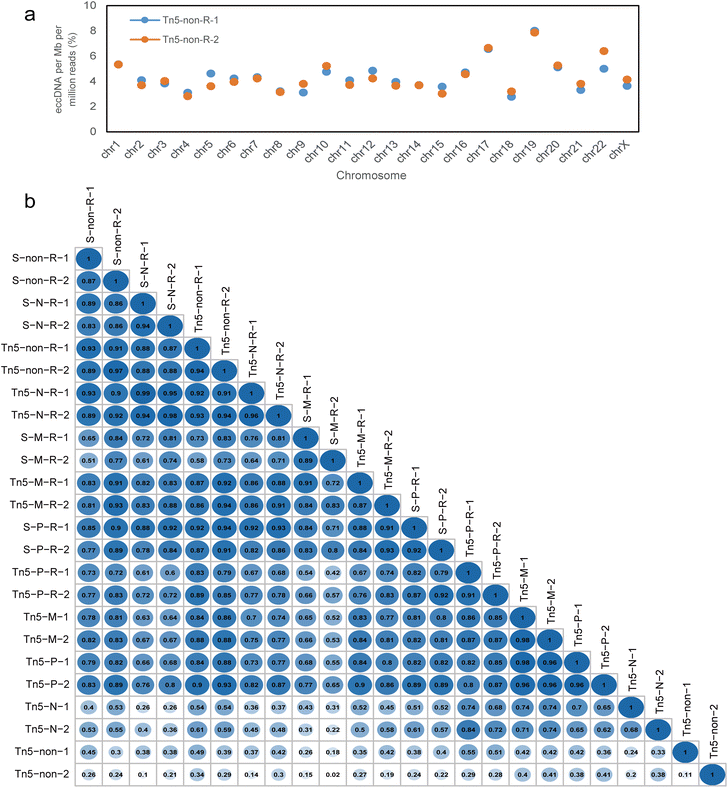
We further compared the genomic distribution of eccDNA among our libraries (Fig. S6†). However, since the length of each chromosome varied widely, using the absolute number of eccDNA in each chromosome for statistical analysis cannot accurately reflect its preference. Therefore, we calculated the eccDNA counts for each chromosome by dividing the number of eccDNAs falling within a specific chromosome by the total mapped reads and the length of the chromosome. Despite the high degree of heterogeneity in eccDNAs, even within each replicate,17,33 we observed a certain correlation in the distribution of normalized eccDNAs counts across the chromosomes in each treatment group. Specifically, within a set of replicates, the gene-rich chromosome 19 hosted a greater number of eccDNAs compared to other chromosomes, while chromosome 4 exhibited a lower number (Fig. 4a).To assess the similarity of the distribution of eccDNAs on each chromosome across all treatment conditions, we computed the Pearson correlation coefficient for every combination of methods (Fig. 4b). Overall, the Pearson correlation coefficient is greater than 0.8 between most samples. This result indicates that normalized amounts of eccDNAs recovered from the same chromosome in the same cell line could be similar even when different protocols were used. Furthermore, there was almost no difference between the MssI and PacI samples in the non-RCA group, resulting in a correlation coefficient above 0.95. Among the RCA groups, the similarity values were also very high for NotI and non-digested samples independent of the fragmentation methods, with a slight decrease observed in the MssI and PacI digestion samples. However, a low correlation coefficient was observed in the NotI and non-digested samples in the non-RCA group. Since very few eccDNAs were identified in these two groups, which were more than 10 times lower than the others (Table S1†), we infer that there were not enough eccDNAs allocated to each chromosome, resulting in a poor correlation.
3.6 Genomic annotation of eccDNA
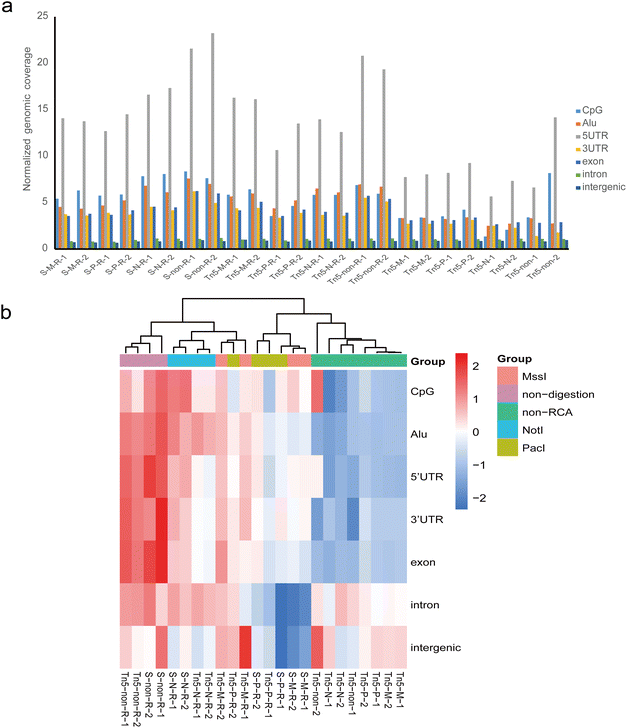
All eccDNAs were further mapped to seven major classes of genomic elements: CpG islands (CpG), 5′-untranslated regions (5′-UTR), 3′-untranslated regions (3′-UTR), Alu repeat regions, exons, introns, and intergenic regions. The normalized genomic coverage was used to evaluate the impact of different methods on the functional annotation of eccDNAs.25 Overall, the eccDNA molecules in each group showed similarity and were predominantly enriched in 5′-UTR regions, with relatively rare distribution in introns and intergenic regions (Fig. 5a). We further assessed the distribution of genomic elements in eccDNA using hierarchical clustering for each sample (Fig. 5b). As expected, the genomic element distribution of eccDNA from the same conditions exhibited similarity and tended to cluster together. In the non-RCA group, which clustered together, there was relatively low coverage in UTR regions, CpG islands, and Alu repeat regions, while intergenic regions showed a slight enrichment. Conversely, the non-digestion accompanying RCA group showed a relatively high coverage in UTR regions, exon regions, and Alu repeat regions, regardless of the fragment method. NotI digestion accompanying RCA samples also clustered together and exhibited high enrichment in CpG islands. Most MssI and PacI digestion samples appeared to cluster together based on the fragment method. Overall, although different treatment methods did not alter the distribution trend of eccDNA across each element as a whole and showed a high correlation (Fig. S1†), the relative genomic coverage level of eccDNA on each element was influenced by the experimental method. Although preliminary evidence indicates that a specific eccDNA ring can serve as a biomarker, the high heterogeneity of eccDNAs caused the number of overlapping eccDNAs to be very small in the replicates (Table S1†), making it difficult to develop a specific eccDNA as a biomarker. By comparing the distribution characterization of eccDNA in chromosomes and genomic elements between the different treatment methods, we found that the global distribution pattern of eccDNA has a relatively stable characterization in replicates. Hence, analyzing the distribution pattern of eccDNA in various cells or different cellular states could provide insights into cell types or alterations within the cells.We further investigated the percentage of eccDNAs annotated to protein-coding regions in each sample (Fig. S2†). There was a slightly higher proportion of eccDNA-annotated genes observed in the NotI and non-digested groups compared to the MssI and PacI digested groups. To gain insight in eccDNA function, we investigated the number of genes in eccDNA (Table S2†). In RCA samples, the Tn5 tagmentation group exhibits a higher count of genes entirely contained within eccDNA compared to the sonication group. However, the number of genes that are identical across replicates is minimal.
3.7 Motif analysis of the flanking eccDNA junctions
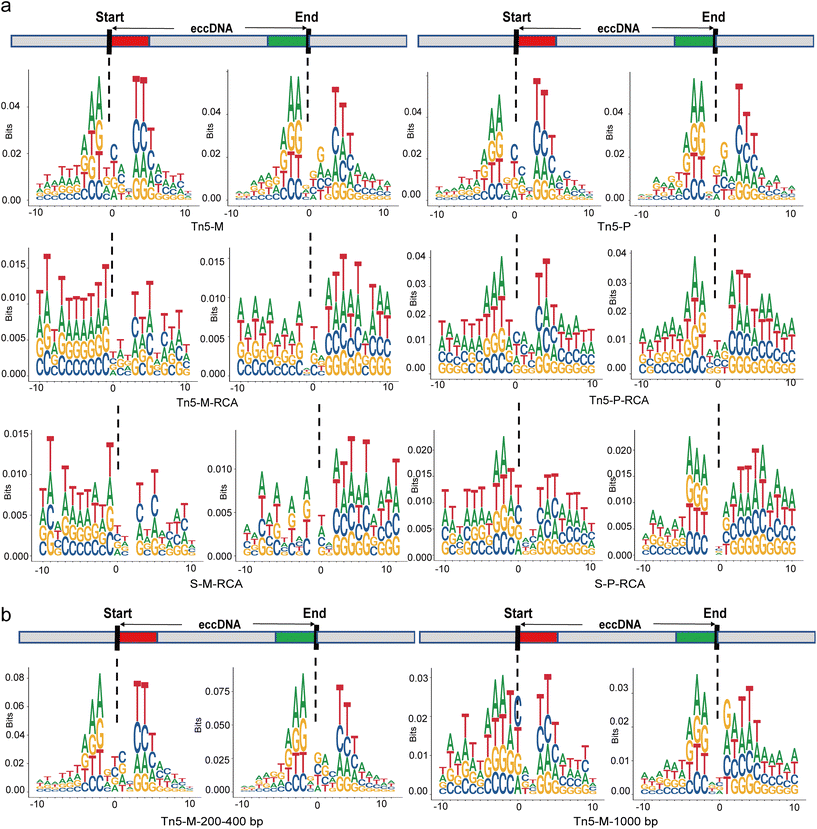
To investigate the mechanism of eccDNA origin, the sequence pattern near the breakpoint has attracted significant research attention.34,35 Therefore, we examined the DNA sequences flanking the start and end sites of eccDNAs within a 10 bp region to compare the nucleotide composition resulting from different protocols (Fig. 6a and S3†). The relative size of bases at each position indicates their frequency. While adenine (A) and thymine (T) were more frequent in the flanking regions of eccDNA junctional sites across all protocols, the characteristic pattern of a pair of high-frequency trinucleotid segments with 4 bp “spacers” was observed prominently only in the non-RCA group. In the RCA group, the 4 bp “spacers” tended to become 3 bp “spacers” and the frequency of the high-frequency trinucleotid segments decreased, approaching that of other flanking sequences. This atypical motif signature is consistent with findings from tissue research involving the RCA step.36 Indeed, a typical model was previously proposed in plasma cell-free eccDNA using the tagmentation method without the RCA step.25 Furthermore, the characteristics of the motif signature appeared to vary with the size of eccDNAs in our non-RCA group. When we specifically screened eccDNAs with a length greater than 1000 bp, the typical motif signature was not observed (Fig. 6b). However, for eccDNAs with a size of 200–400 bp, the frequency of trinucleotid segments showed a slight increase, suggesting that small eccDNAs are more likely to exhibit this typical motif signature.3.8 Detection of eccDNA using nanopore long reads
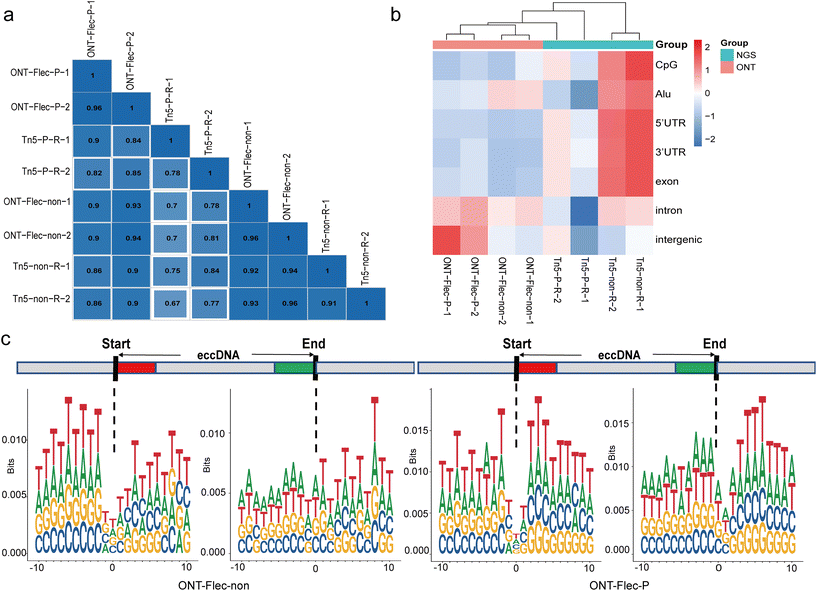
To obtain the full-length sequence of eccDNA, a long-read sequencing technology was developed by T7 endonuclease I debranching the RCA products. The nanopore sequencer generated long-reads with tandem multiple copies of the template eccDNA. With this method, we identified a comparable amount of eccDNAs using Flec tool to NGS (Table S3†) and observed the multiple tandem copies of individual eccDNA molecule (Table S4†). Importantly, the normalized eccDNA counts were dramatically increased, as the longer reads were more likely to contain breakpoints, thus enabling the identification of more eccDNA reads. Additionally, we observed that approximately 16.73 ± 0.05% and 5.29 ± 0.17% of eccDNAs in PacI and non-digestion samples, respectively, had multiple ligations of fragments from different genomic regions. We also compared the chromosome distribution of eccDNA between nanopore sequencing and NGS. For the same restriction enzyme digestion method, these two sequencing platforms exhibited a high degree of similarity (Pearson correlation coefficient above 0.8) (Fig. 7a). However, when we performed hierarchical clustering based on the normalized element coverage of eccDNAs, the libraries generated from nanopore sequencing formed a distinct cluster (Fig. 7b). Similar to the RCA groups in NGS, we did not observe the typical motif signature of a pair of high-frequency trinucleotid segments with 4 bp “spacers” in the nanopore group, as RCA was also used during nanopore sequencing (Fig. 7c).Subsequently, we analyzed the nanopore sequencing data using the CReSIL37 tool for further comparison. Results showed that the number of eccDNAs identified by the CReSIL tool was significantly increased (Table S5†). Additionally, in comparison to the Flec tool, a higher proportion of eccDNAs with multiple fragments were observed in both the PacI and non-digestion groups. Upon comparing eccDNAs with a 90% sequence overlap, it was revealed that the PacI group demonstrated nearly 55% overlapping eccDNAs, whereas the non-digestion group only showed 30% overlap (Table S6†). These findings highlight that distinct bioinformatic tools yield varying outcomes, the handling of samples can impact the performance of these tools, and the use of restriction enzyme digestion tends to enhance the stability of identification results.
4. Discussion
Most studies that have contributed to the understanding of eccDNA have relied on exonucleases for digesting linear DNA and RCA for enriching circular DNA, followed by sequencing.38,39 However, there have been a few exceptions.25,40 Due to the high heterogeneity and low abundance of eccDNA, the biases introduced by different experimental methods could lead to inaccurate results in studying the characterization and function of eccDNA. In this study, we performed a comprehensive and systematic assessment of the library preparation process, which involved three important steps.Previous studies have described the use of different restriction enzymes to deplete mtDNA to improve the efficiency of eccDNA enrichment.27 Conversely, some research has retained mtDNA as an internal control.13 In our study, we discovered that depleting mtDNA significantly increased the number of identified eccDNAs, particularly in non-RCA samples (Table S1†). Conversely, when there were numerous mtDNA present, only a small number of eccDNAs were identified, leading to bias that could affect the overall characterization of eccDNAs, such as producing a low correlation for genomic distribution (Fig. 4b). Additionally, we observed that samples treated with NotI restriction endonucleases produced more eccDNAs in the 200–400 bp size range, which was significantly different from samples treated with MssI and PacI restriction endonucleases (Fig. 3b). This finding suggests that there might be a higher occurrence of MssI and PacI recognition sites on smaller eccDNA molecules, resulting in a decrease in the number of smaller eccDNAs. Given that MssI and PcaI recognition sites are rich in adenine (A) and thymine (T), this is consistent with findings from the characteristics of motif which A and T were more frequent in the flanking regions.
One of the major distinctions between methods is whether rolling-circle amplification (RCA) is performed. RCA can increase the copy number of template eccDNAs, facilitating the identification of eccDNA based on split and discordant read counts. However, some studies have proposed that RCA may lead to the loss of significant information related to specific eccDNAs.18,41 In this study, we observed that about 99% of eccDNAs had a junctional tag = 1 in the non-RCA group (Fig. 2c). However, after RCA, only about 25% of eccDNAs had a junctional tag > 1, indicating uneven amplification of eccDNAs. Therefore, the high occurrence of split and discordant reads found in eccDNAs may originate from the unbalanced amplification caused by RCA, especially for eccDNAs characterized by a low copy number. Given that RCA can lead to a disproportionate amplification for eccDNAs, it should be avoided when studying eccDNA copy numbers unless there are highly reliable internal controls with various sizes. Consistent with previous studies,27,42 we observed a size distribution of eccDNAs with ∼200 bp periodicity (Fig. 3a), suggesting that eccDNA formation may involve DNA sequences wrapped around nucleosomes. However, this phenomenon is less evident in some studies17,43 that utilized RCA.
The characterization of heterogeneity and low copy numbers presents a challenge in eccDNA research. In this study, we observed only a few eccDNAs with identical junction sites in each replicate (Table S1†). Although the number of common eccDNA with 90% overlap of sequences has increased, there was still very little eccDNAs overlap in technical replicates. However, we observed a highly similar global distribution pattern of eccDNAs on chromosomes (Fig. S1 and S5†), which may serve as an important feature for eccDNA. Expanding upon previous research that focused solely on specific overlapped rings between different samples,8,9,44 we exploited this global feature as an eccDNA signature. Additionally, samples with the same treatment condition tended to cluster together based on the distribution of eccDNA across genomic elements. Considering the previously reported correlation between transcription, active promoters, and eccDNA production,39,45 we hypothesized that the genomic distribution of eccDNA, particularly in relation to transcription-related elements such as UTR regions or CpG islands, could potentially serve as a predictive biomarker of different cell lines or cell states. To test this hypothesis, we identified eccDNAs from five cell lines using the same library preparation methods and bioinformatics parameters (Table S7†). It was observed that the amount of eccDNAs identified by different cell lines varied greatly. Meanwhile, there was a small amount of eccDNA with 90% overlap of sequences between GES-1 and other cell lines. Circle size inspection revealed that the distribution of eccDNAs in different cell lines was both concentrated between 0.1 kb to 10 kb (Fig. S4†). When we analyzed the normalized genomic element coverage of eccDNA from the five cell lines, results showed that the eccDNA from two cancer cell lines clustered together, as did the eccDNA from three normal cell lines, suggesting that these two cancer cell lines may possess distinct states compared to the normal cell lines (Fig. 8). Based on the analysis of the genomic and elements distribution of eccDNA in different cell types, it was inferred that similar distribution patterns may reflect similar cell types or states. Therefore, the distribution pattern of eccDNA may be a promising biomarker.
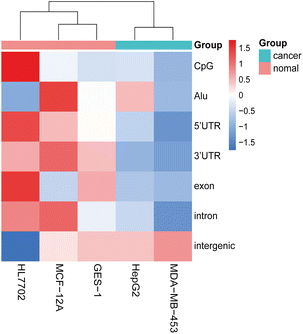 | ||
| Fig. 8 Hierarchical clustering was performed to classify different cell lines based on the distribution of eccDNAs across various genomic elements. | ||
The origin of eccDNA has been elucidated through several mechanistic models,46–48 often involving the identification of sequences flanking the junction sites. Through a comparison of different protocols, we observed that in the non-RCA group, the motif pattern was quite similar to that seen in circulating eccDNA patterns25,35 (Fig. 6a). However, the motif signal was masked in the RCA group. We speculated that the mechanisms involved in the formation of cell-free eccDNAs in circulation may be relatively uniform, resulting in less impact from RCA and enabling the detection of motif signals even when RCA is used.35 In cell lines, eccDNA may be produced through various mechanisms, which could disrupt the motif signal when RCA is performed. Additionally, we observed that the motif pattern is more pronounced in small-sized eccDNAs rather than in longer rings. Furthermore, we also analyzed the 200–400 bp-sized eccDNAs in the RCA group, but the typical motif signature was not identified. Unlike RCA, tagmentation operates on double-stranded DNAs, potentially leading to the loss of information regarding single-stranded eccDNAs in the non-RCA group. This could be another reason why the motif pattern differs between the RCA and non-RCA groups.
5. Conclusions
We conducted a comparative analysis of different eccDNA-library preparation methods and comprehensively described the features (e.g., size profiles, GC content, genomic distribution, and motif pattern) of eccDNAs resulting from these treatments. Rolling-circle amplification and the use of restriction enzymes to linearize mtDNA improved the efficiency of eccDNA enrichment. However, certain biases were observed in specific populations, such as an unclear periodicity peak and the absence of a typical motif pattern. When employing RCA in the library preparation process, it is advisable to refrain from eccDNA quantification. Conversely, for non-RCA library preparation methods, it is highly recommended to utilize a specific restriction enzyme to cleave mtDNA; otherwise, only a minimal amount of eccDNA will be detected. Additionally, one should exercise caution when selecting bioinformatics tools for eccDNA identification, as different tools may employ distinct analysis strategies, leading to discrepancies in the identified eccDNAs. The global distribution pattern of eccDNA appeared to be a stable characteristic, as different treatment conditions clustered together based on this pattern. These findings reveal the native characterization of eccDNA and provide important insights for further exploration of eccDNA as a potential nucleic acid biomarker.Data availability
Generated raw data were deposited in National Genomics Data Center with the accession number HRA004848.Author contributions
Wenxiang Lu: methodology, formal analysis, writing – original draft preparation. Fuyu Li: formal analysis, data curation, software. Yunfei Ouyang: formal analysis, software. Yali Jiang: formal analysis, investigation. Weizhong Zhang: conceptualization, resources, writing – review and editing. Yunfei Bai: conceptualization, resources, writing – review and editing.Conflicts of interest
The authors declare that they have no conflicts of interest with the contents of this article.Acknowledgements
This work was supported by the National Natural Science Foundation of China (grant number 61871121) and the Research Grant of Ili & Jiangsu Joint Institute of Health (grant number yl2021ms05).References
- T. Paulsen, P. Kumar, M. M. Koseoglu and A. Dutta, Trends Genet., 2018, 34, 270–278 CrossRef CAS PubMed.
- T. Paulsen, Y. Shibata, P. Kumar, L. Dillon and A. Dutta, Nucleic Acids Res., 2019, 47, 4586–4596 CrossRef CAS PubMed.
- Y. Wang, M. Wang, M. N. Djekidel, H. Chen, D. Liu, F. W. Alt and Y. Zhang, Nature, 2021, 599, 308–314 CrossRef CAS PubMed.
- H. Kim, N. P. Nguyen, K. Turner, S. H. Wu, A. D. Gujar, J. Luebeck, J. H. Liu, V. Deshpande, U. Rajkumar, S. Namburi, S. B. Amin, E. Yi, F. Menghi, J. H. Schulte, A. G. Henssen, H. Y. Chang, C. R. Beck, P. S. Mischel, V. Bafna and R. G. W. Verhaak, Nat. Genet., 2020, 52, 891–897 CrossRef CAS.
- J. Zhu, S. Chen, F. Zhang and L. Wang, Mol. Diagn. Ther., 2018, 22, 515–522 CrossRef CAS.
- H. D. Moller, L. Parsons, T. S. Jorgensen, D. Botstein and B. Regenberg, Proc. Natl. Acad. Sci. U. S. A., 2015, 112, E3114–E3122 Search PubMed.
- Y. X. Cen, Y. F. Fang, Y. Ren, S. Y. Hong, W. G. Lu and J. F. Xu, Cell Death Dis., 2022, 13, 342 CrossRef CAS PubMed.
- C. Lin, Y. Chen, F. Zhang, B. Liu, C. Xie and Y. Song, Cell Death Dis., 2022, 13, 171 CrossRef CAS.
- D. Gerovska and M. J. Arauzo-Bravo, Int. J. Mol. Sci., 2023, 24, 2736 CrossRef CAS PubMed.
- H. D. Moller, J. Ramos-Madrigal, I. Prada-Luengo, M. T. P. Gilbert and B. Regenberg, Genome Biol. Evol., 2020, 12, 3762–3777 CrossRef PubMed.
- P. Merkulov, E. Egorova and I. Kirov, Plants, 2023, 12, 2178 CrossRef CAS.
- M. G. Mohsen and E. T. Kool, Acc. Chem. Res., 2016, 49, 2540–2550 CrossRef CAS.
- L. Mouakkad-Montoya, M. M. Murata, A. Sulovari, R. Suzuki, B. Osia, A. Malkova, M. Katsumata, A. E. Giuliano, E. E. Eichler and H. Tanaka, Proc. Natl. Acad. Sci. U. S. A., 2021, 118, e2102842118 CrossRef CAS.
- R. S. Lasken and T. B. Stockwell, BMC Biotechnol., 2007, 7, 19 CrossRef PubMed.
- B. Green, C. Bouchier, C. Fairhead, N. L. Craig and B. P. Cormack, Mobile DNA, 2012, 3, 3 CrossRef CAS.
- A. Adey, H. G. Morrison, Asam, X. Xun, J. O. Kitzman, E. H. Turner, B. Stackhouse, A. P. MacKenzie, N. C. Caruccio, X. Zhang and J. Shendure, Genome Biol., 2010, 11, R119 CrossRef CAS.
- H. D. Moller, M. Mohiyuddin, I. Prada-Luengo, M. R. Sailani, J. F. Halling, P. Plomgaard, L. Maretty, A. J. Hansen, M. P. Snyder, H. Pilegaard, H. Y. K. Lam and B. Regenberg, Nat. Commun., 2018, 9, 1069 CrossRef PubMed.
- L. Yang, R. Jia, T. Ge, S. Ge, A. Zhuang, P. Chai and X. Fan, Signal Transduction Targeted Ther., 2022, 7, 342 CrossRef CAS PubMed.
- R. P. Koche, E. Rodriguez-Fos, K. Helmsauer, M. Burkert, I. C. MacArthur, J. Maag, R. Chamorro, N. Munoz-Perez, M. Puiggros, H. Dorado Garcia, Y. Bei, C. Roefzaad, V. Bardinet, A. Szymansky, A. Winkler, T. Thole, N. Timme, K. Kasack, S. Fuchs, F. Klironomos, N. Thiessen, E. Blanc, K. Schmelz, A. Kunkele, P. Hundsdorfer, C. Rosswog, J. Theissen, D. Beule, H. Deubzer, S. Sauer, J. Toedling, M. Fischer, F. Hertwig, R. F. Schwarz, A. Eggert, D. Torrents, J. H. Schulte and A. G. Henssen, Nat. Genet., 2020, 52, 29–34 CrossRef CAS PubMed.
- S. Andrews, FastQC A Quality Control tool for High Throughput Sequence Data, 2014.
- H. Li and R. Durbin, Bioinformatics, 2009, 25, 1754–1760 CrossRef CAS PubMed.
- P. Kumar, S. Kiran, S. Saha, Z. Su, T. Paulsen, A. Chatrath, Y. Shibata, E. Shibata and A. Dutta, Sci. Adv., 2020, 6, eaba2489 CrossRef CAS PubMed.
- Y. Wang, M. Wang and Y. Zhang, Nat. Protoc., 2023, 18, 683–699 CrossRef CAS PubMed.
- A. R. Quinlan and I. M. Hall, Bioinformatics, 2010, 26, 841–842 CrossRef CAS.
- S. T. K. Sin, P. Jiang, J. Deng, L. Ji, S. H. Cheng, A. Dutta, T. Y. Leung, K. C. A. Chan, R. W. K. Chiu and Y. M. D. Lo, Proc. Natl. Acad. Sci. U. S. A., 2020, 117, 1658–1665 CrossRef CAS.
- O. Wagih, Bioinformatics, 2017, 33, 3645–3647 CrossRef CAS PubMed.
- H. D. Moller, Methods Mol. Biol., 2020, 2119, 165–181 CrossRef.
- P. Kumar, L. W. Dillon, Y. Shibata, A. A. Jazaeri, D. R. Jones and A. Dutta, Mol. Cancer Res., 2017, 15, 1197–1205 CrossRef CAS.
- X. K. Zhao, P. Xing, X. Song, M. Zhao, L. Zhao, Y. Dang, L. L. Lei, R. H. Xu, W. L. Han, P. P. Wang, M. M. Yang, J. F. Hu, K. Zhong, F. Y. Zhou, X. N. Han, C. L. Meng, J. J. Ji, X. Chen and L. D. Wang, Nat. Commun., 2021, 12, 6489 CrossRef CAS.
- I. Prada-Luengo, A. Krogh, L. Maretty and B. Regenberg, BMC Bioinf., 2019, 20, 663 CrossRef CAS PubMed.
- P. Zhang, H. Peng, C. Llauro, E. Bucher and M. Mirouze, Front. Plant Sci., 2021, 12, 743742 CrossRef.
- K. L. Hung, P. S. Mischel and H. Y. Chang, Nat. Struct. Mol. Biol., 2022, 29, 736–744 CrossRef CAS PubMed.
- J. Zhu, F. Zhang, M. Du, P. Zhang, S. Fu and L. Wang, Sci. Rep., 2017, 7, 10968 CrossRef.
- J. Pang, X. Pan, L. Lin, L. Li, S. Yuan, P. Han, X. Ji, H. Li, C. Wang, Z. Chu, H. Wu, G. Fan, X. Du and A. Ji, Front. Genet., 2022, 13, 859513 CrossRef CAS.
- W. Lv, X. Pan, P. Han, Z. Wang, W. Feng, X. Xing, Q. Wang, K. Qu, Y. Zeng, C. Zhang, Z. Xu, Y. Li, T. Zheng, L. Lin, C. Liu, X. Liu, H. Li, R. A. Henriksen, L. Bolund, L. Lin, X. Jin, H. Yang, X. Zhang, T. Yin, B. Regenberg, F. He and Y. Luo, Clin. Transl. Med., 2022, 12, e817 CrossRef CAS.
- K. Wen, L. Zhang, Y. Cai, H. Teng, J. Liang, Y. Yue, Y. Li, Y. Huang, M. Liu, Y. Zhang, R. Wei and J. Sun, Epigenetics, 2023, 18, 2192324 CrossRef PubMed.
- V. Wanchai, P. Jenjaroenpun, T. Leangapichart, G. Arrey, C. M. Burnham, M. C. Tummler, J. Delgado-Calle, B. Regenberg and I. Nookaew, Briefings Bioinf., 2022, 23, bbac422 CrossRef.
- Y. Shibata, P. Kumar, R. Layer, S. Willcox, J. R. Gagan, J. D. Griffith and A. Dutta, Science, 2012, 336, 82–86 CrossRef CAS.
- L. W. Dillon, P. Kumar, Y. Shibata, Y. H. Wang, S. Willcox, J. D. Griffith, Y. Pommier, S. Takeda and A. Dutta, Cell Rep., 2015, 11, 1749–1759 CrossRef CAS PubMed.
- M. J. Shoura, I. Gabdank, L. Hansen, J. Merker, J. Gotlib, S. D. Levene and A. Z. Fire, G3: Genes, Genomes, Genet., 2017, 7, 3295–3303 CrossRef CAS.
- P. Song, L. R. Wu, Y. H. Yan, J. X. Zhang, T. Chu, L. N. Kwong, A. A. Patel and D. Y. Zhang, Nat. Biomed. Eng., 2022, 6, 232–245 CrossRef CAS.
- Z. Sun, N. Ji, R. Zhao, J. Liang, J. Jiang and H. Tian, Ann. Transl. Med., 2021, 9, 1464 CrossRef CAS.
- Z. Chen, Y. Qi, J. He, C. Xu, Q. Ge, W. Zhuo, J. Si and S. Chen, Mol. Biomed., 2022, 3, 38 CrossRef CAS PubMed.
- Y. Peng, Y. Li, W. Zhang, Y. ShangGuan, T. Xie, K. Wang, J. Qiu, W. Pu, B. Hu, X. Zhang, L. Yin, D. Tang and Y. Dai, Eur. J. Med. Res., 2023, 28, 134 CrossRef CAS PubMed.
- X. Chen, R. Kang, G. Kroemer and D. Tang, Nat. Rev. Clin Oncol., 2021, 18, 280–296 CrossRef CAS.
- T. Paulsen, P. Malapati, Y. Shibata, B. Wilson, R. Eki, M. Benamar, T. Abbas and A. Dutta, Nucleic Acids Res., 2021, 49, 11787–11799 CrossRef CAS PubMed.
- E. Weterings and D. J. Chen, Cell Res., 2008, 18, 114–124 CrossRef CAS.
- I. Prada-Luengo, H. D. Moller, R. A. Henriksen, Q. Gao, C. E. Larsen, S. Alizadeh, L. Maretty, J. Houseley and B. Regenberg, Nucleic Acids Res., 2020, 48, 7883–7898 CrossRef CAS.
Footnote |
| † Electronic supplementary information (ESI) available. See DOI: https://doi.org/10.1039/d3an01300f |
| This journal is © The Royal Society of Chemistry 2024 |

