Electrodeposition of paracetamol oxide for intelligent portable ratiometric detection of nicotine and ethyl vanillin β-D-glucoside†
Zhaohong
Su
 ab,
Shiyu
Hu
b,
Yuhang
Zhang
b,
Zhanning
Liang
b,
Yi
Peng
b,
Qinyi
Cao
b,
Xia
Yu
b,
Zhiyang
Zhu
*a,
Pei
He
*a and
Zhenjie
Li
*a
aYunnan Key Laboratory of Tobacco Chemistry R&D Center of China Tobacco Yunnan Industry Co., Ltd, 650231 Kunming, PR China. E-mail: fly10080704@163.com; hepeisuccess@163.com; kmlizhenjie@163.com
bCollege of Chemistry and Materials Science, College of Agronomy, Hunan Agricultural University, Changsha 410128, PR China
First published on 27th November 2023
Abstract
Herein, the electrodeposition of paracetamol oxide (PA ox) for the intelligent portable ratiometric detection of nicotine (NIC) and ethyl vanillin β-D-glucoside (EVG) is reported. PA ox electrodeposited on a screen-printed carbon electrode (SPCE) was used as a new fixed state ratiometric reference probe. A portable electrochemical workstation combined with a smart phone was applied as an intelligent portable electrochemical sensing platform. The sensor was studied by scanning electron microscopy (SEM), Fourier transform infrared spectrophotometry (FT-IR), ultraviolet-visible spectrophotometry (UV-vis), theoretical calculation, chronoamperometry, cyclic voltammetry (CV), electrochemical impedance spectroscopy (EIS) and square wave voltammetry (SWV). Under optimized conditions, the detection range of NIC is 10–200 μmol L−1, and the detection limit is 0.256 μmol L−1. The detection range of EVG was 10–180 μmol L−1, and the detection limit was 0.058 μmol L−1. The sensor can realize the real-time detection of NIC and EVG concentration in cigarette samples quickly and accurately, and has good anti-interference, repeatability and stability.
Introduction
Nicotine (NIC) is an alkaloid in the Solanaceae family and a member of the pyridine derivative family in cigarettes. It is toxic and addictive. NIC addiction is a global public health problem and has been receiving much attention.1–3 Based on a large number of smokers, the cigarette industry can generate high profits and has become the highest tax industry in China.4 Since the 1960s, due to strict restrictions on the tar content of tobacco products in various countries, low-tar cigarettes have been developed, which has led to a decrease in the aroma components in the smoke, and means that the overall aroma characteristics of cigarettes cannot be guaranteed. In the current development of low-tar cigarettes, it is necessary to develop tobacco flavors and fragrance compensation technology. The common free aroma components are volatile and are released unevenly, meaning that the purpose of enhancing the flavor of cigarettes cannot be achieved. Therefore, latent fragrance materials have attracted attention. Ethyl vanillin-β-D-glucoside (EVG) is a glycoside aroma active substance commonly used in cigarettes. It provides cigarettes with unique flavors through the release of active volatiles to achieve the purpose of enhancing the cigarette flavor.5 Therefore, the accurate and efficient detection of NIC and EVG is essential to reduce smoking-related illnesses and improve cigarette quality.There are many methods, such as fluorospectrophotometry,6 spectroscopy,7 capillary electrophoresis,8 chromatography,9 electroluminescence methods (ECL),10 surface enhanced Raman spectroscopy (SERS),11 electrochemical detection (EC)12etc. for detecting NIC and EVG, but traditional static detection requires a long process and is not economical. The development of a portable system has promoted the application of portable electrochemical workstations in different scenarios of point-of-care testing (POCT).13 The electrochemical method is more conducive to combination with screen printing electrodes for NIC detection of dynamic concentrations due to its simple operation, rapid response, cheap and portable instrumentation, and high sensitivity. Through efficient signal transmission, it has shown great potential in the real-time detection of dynamic concentrations, and the detection object is accurately identified.14 For example, Shehata et al. used a negative ion surfactant nano-TiO2 modified carbon paste sensor for the electrochemical detection of NIC.15 The results show that the sensor has good stability and sensitivity, but the traditional electrochemical sensor has a single signal output, which is easily affected by the detection environment, and its stability and robustness will be disturbed. However, with further research, there have been reports of the fluorescence and electrochemical dual-mode detection of NIC,16 which has improved the accuracy of NIC actual sample detection. In addition, AuNPs and AgNPs have been introduced in a ratiometric method for the detection of NIC using ultraviolet spectrophotometry, which increases the breadth of NIC methodology.17 In contrast, a ratiometric electrochemical sensor introduces an independent redox probe as an internal reference, providing a built-in correction for the detection object.18,19 The ratio of the two current signals is used to quantify the concentration of the detection object, and then replace the current response of the detection object as the output signal, which can significantly improve the reproducibility and reliability of the sensor.20 According to the literature, a ratiometric sensor has been used for the detection of a variety of compounds, but there are few studies on the intelligent portable simultaneous ratiometric detection of multiple substances. Therefore, it is of great significance and challenge to construct an intelligent portable ratiometric electrochemical sensor with dual biochemical analysis for the simultaneous detection of NIC and EVG.
Compared with traditional glassy carbon electrode, screen-printed electrode (SPCE) has received extensive attention in the field of electrochemistry because of its simplicity, portability, and low cost. In particular, with the increasing demand for the real-time detection of dynamic concentrations, the advantages of SPCE have become increasingly significant. SPCE provide more possibilities for the study of electrochemical sensors, and sensors with different detection effects can be obtained by modifying different materials.21–23 Paracetamol (PA) is one of the most commonly used antipyretic and analgesic drugs in the medical field, and it is also an excellent free state internal reference probe for constructing a ratiometric sensor in the electrochemical field.24 It has been reported that it can be synthesized using ultrasound.25 Interestingly, our group has found that PA ox (paracetamol oxide) can be electrodeposited on the surface of an SPCE, and the peak position is close to the peak position of free state PA during detection, which is completely separated from the response peaks of NIC and EVG.
In this work, a multifunctional ratiometric electrochemical sensor was fabricated for the simultaneous detection of NIC and EVG. As shown in Fig. 1, PA ox is deposited on the electrode surface as a reference molecule. The highest occupied molecular orbital (HOMO) and the lowest unoccupied molecular orbital (LUMO) of PA, PA oxide, NIC, and EVG were calculated using Gaussian09W software. Upon connection of a portable electrochemical workstation and a smartphone, the prepared multifunctional ratiometric sensor has accuracy and selectivity for the detection of NIC and EVG. The sensor is applied to the intelligent portable ratiometric determination of NIC and EVG in artificially manufactured cigarettes, which proves the practicability of the proposed sensor.
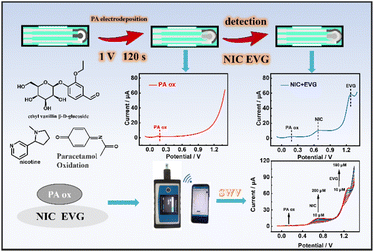 | ||
| Fig. 1 Construction of the PA ox/SPCE based smart portable ratiometric sensor for the simultaneous electrochemical detection of NIC and EVG. | ||
Experimental methods
Reagents and apparatus
Glucose, Na2CO3 and glycine were purchased from National Pharmaceutical Chemical Reagents Co., Ltd. Paracetamol (PA) was purchased from Shanghai Yuanye Biotechnology Co., Ltd. NIC and EVG were purchased from Aladdin (Shanghai, China). All chemicals were analytically pure and could be used directly without further purification. 0.1 mol L−1 phosphate buffered saline (PBS) was prepared by mixing 0.1 mol L−1 Na2HPO4, 0.1 mol L−1 NaH2PO4 and 0.1 mol L−1 NaCl, and the pH was adjusted using H3PO4 or NaOH. All experiments used ultrapure water.A PalmSens4 portable electrochemical workstation (Red Matrix China Limited), smart phone (OPPO), and SPCE (sinjeen200, Changsha Sunjun Electronic Technology Co., Ltd) were used for all electrochemical experiments (Fig. 1). The morphology and elemental analysis of the modified SPCE were analyzed using scanning electron microscopy (SEM, JEM-6700F field emission scanning electron microscopy) and energy dispersive X-ray analysis (EDX, Oxford ULTIM MAX40). The electrodeposition process of PA ox was characterized using an electrochemical quartz crystal microbalance (EQCM, Shanghai Chenhua Instrument Co., Ltd). Fourier transform infrared (FT-IR) spectra and UV-vis spectra were recorded on a Nicolet Nexus 670 FT-IR spectrophotometer and UV-vis spectrophotometer (Shanghai Jinghua Scientific Instrument Co., Ltd), respectively. Molecules and molecular orbitals (MO) were calculated by using GaussView6.0, and all calculations were carried out by using Gaussian09W.26 All molecules were fully optimized by using density functional theory/B3LYP method with 6-311G basis sets.
Electrode pretreatment
SPCE pretreatment is discussed in previous reports.27 The SPCE was first immersed in a saturated Na2CO3 solution at 1.2 V for 300 s. It was then rinsed with deionized water 5–6 times. The pretreated SPCE was immersed in 0.1 mol L−1 KCl + 5 mmol L−1 potassium ferrocyanide solution for cyclic voltammetry scanning. The scanning potential was −0.4–0.7 V, the scan rate was 100 mV s−1, and the potential difference between the redox peaks was less than 200 mV, which could be used for subsequent experiments. After the scanning was completed, the electrode was washed repeatedly with deionized water and dried naturally.Preparation of the PA ox/SPCE sensor
The experimental phenomenon of electrochemical detection by CV electrodeposition of PA has been reported previously.28 Based on this, our work was improved by using PA ox as a new fixed state ratiometric probe. A mixed solution of 150 μL of 0.05 mol L−1 PA + 0.01 mol L−1 KCl was removed using a pipette, then added dropwise to the surface of the activated SPCE, and then the potentiation method was used to run at 1 V for 120 s. After PA electrodeposition, the prepared PA ox/SPCE was cleaned with deionized water and finally dried with nitrogen for the subsequent simultaneous detection of NIC and EVG (Fig. 1).Intelligent portable ratiometric detection of NIC and EVG
All electrochemical experiments were carried out in 0.1 mol L−1 PBS (pH = 7.5), and NIC and EVG were detected using the intelligent portable ratiometric system by square wave voltammetry (SWV) at the PA ox/SPCE. The setting parameters of the SWV were as follows: the scanning potential was −0.1–1.4 V, the amplitude was 0.05 V, the frequency was 5 Hz, the potential increment was 0.01 V, and the enrichment time was 60 s. The optimized detection conditions included the PA deposition potential, PA deposition time, enrichment time and pH value of PBS.Preparation of actual samples
The paper wrapping a ‘Seven Wolf’ cigarette was removed, and then the whole cigarette was soaked in 30 mL of ethanol solution for 24 hours. After filtration and centrifugation, a solution containing NIC and EVG was obtained for detection and analysis.29Results and discussion
Characterization of the PA ox/SPCE sensor
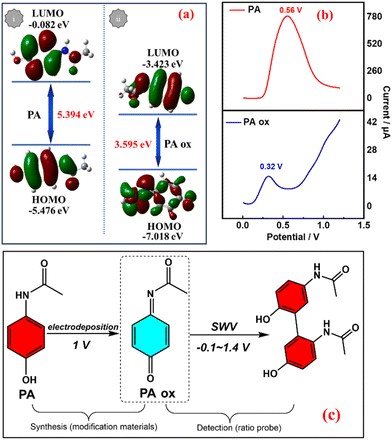
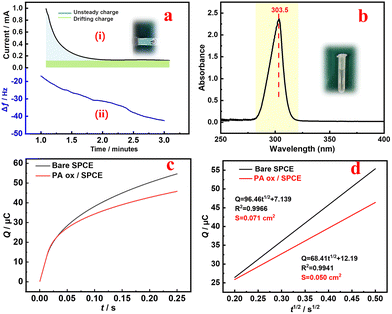
In order to clarify the possible mechanism of the PA oxidation process on the SPCE, a theoretical calculation method was used. The geometric structure, HOMO, LUMO and band gap were simulated before and after PA oxidation. The results are shown in Fig. 2a. During the oxidation process, the electron density distribution on the LUMO is different from that on the PA. In addition, the LUMO energy level in the PA oxide molecules is significantly lower than that of PA, indicating that the LUMO is more stable during oxidation. Interestingly, the HOMO–LUMO energy gap of the oxidized molecule is 3.595 eV, while the HOMO–LUMO energy gap of PA is 5.394 eV. The results strongly confirm the peak potential order of PA in the SWV curve before and after PA oxidation30 (Fig. 2b) due to the level of the LUMO during the oxidation process. The results show that PA ox/SPCE was successfully prepared.31Fig. 2c shows the oxidation process of PA. From the initial free state, it is oxidized to a fixed state PA ox by electrodeposition, and then it may be oxidized to a dimer by the SWV ratiometric detection process.32Fig. 3a(i) shows that PA ox is deposited on the SPCE by the potentiation method at 1 V for 120 s in 0.05 mol L−1 PA + 0.01 mol L−1 KCl. The blue part is related to the redox reaction (non-steady state charge) of the drift PA in the electrochemical process, and the green part is related to the fact that the current needs a certain time to reach the steady state (drift charge).33 For the chronoamperometry i–t curve, an increase means that the current density increases at a constant potential, indicating that the SPCE is still activated during the reaction process (e.g. the active phase is generated, or more active sites are exposed), and the performance is improved. Meanwhile, a decrease means that the active sites cannot provide as much current at the same voltage, and there may be a sample drop factor or an amorphous layer/dense layer may be formed, affecting the conductivity/mass transfer. This indicates that PA may form an oxide film after oxidation deposition, which will affect the conductivity of the SPCE.33 The deposition process of PA ox on the electrode surface was detected using a quartz crystal microbalance (QCM), as shown in Fig. 3a(ii). With the deposition of PA ox, Δf decreases significantly until the adsorption equilibrium, which indicates that the deposition of PA ox on the electrode surface causes a frequency change, which quantitatively represents the mass of PA ox. This can be calculated by the Sauerbrey equation:34,35
 | (1) |
Here, Δf0 is the resonant frequency shift (Hz), f0g is the fundamental mode resonant frequency of the piezoelectric quartz crystal in air (5 MHz), Δm is the mass change (g), and A is the geometric area of the electrode surface exposed to the solution (0.1256 cm2). It is calculated that there is 93.2 ng of PA ox loaded on the electrode after the electrodeposition.
| Q(t) = 2nFACD1/2t1/2/π1/2 + Qdl + Qads | (2) |
Here, n is the number of transferred electrons, F is the Faraday constant (96![[thin space (1/6-em)]](https://www.rsc.org/images/entities/char_2009.gif) 485 C mol−1), A is the active surface area of the electrode, and C and D represent the concentration and diffusion coefficient of [Fe(CN)6]3−/4−, respectively. Qdl and Qads represent the double layer charge and adsorption charge, respectively. The electroactive areas of the bare SPCE and PA ox/SPCE are calculated to be 0.71 cm2 and 0.50 cm2, respectively. The deposition of PA ox on the surface of the SPCE after PA oxidation reduces the exposed active sites of the SPCE, resulting in a decrease in the electroactive area. Subsequently, we compared the CV of the free state PA with the fixed state PA ox. See the ESI for detailed discussion (Fig. S2†).
485 C mol−1), A is the active surface area of the electrode, and C and D represent the concentration and diffusion coefficient of [Fe(CN)6]3−/4−, respectively. Qdl and Qads represent the double layer charge and adsorption charge, respectively. The electroactive areas of the bare SPCE and PA ox/SPCE are calculated to be 0.71 cm2 and 0.50 cm2, respectively. The deposition of PA ox on the surface of the SPCE after PA oxidation reduces the exposed active sites of the SPCE, resulting in a decrease in the electroactive area. Subsequently, we compared the CV of the free state PA with the fixed state PA ox. See the ESI for detailed discussion (Fig. S2†).
Bare SPCE and PA ox/SPCE were characterized by SEM38 and EDS. From the SEM images in Fig. 4, it can be seen that the electrodeposition of PA on the electrode surface has no significant effect on the morphology of the material. Comparing the EDS images in Fig. 4c and d, it is found that the content of C in Fig. 4d is increased, and it is speculated that a small amount of PA has been electrodeposited on the electrode surface. Additionally, PA is an excellent electroactive molecule, so it is feasible to use electrodeposited PA as an internal reference probe.
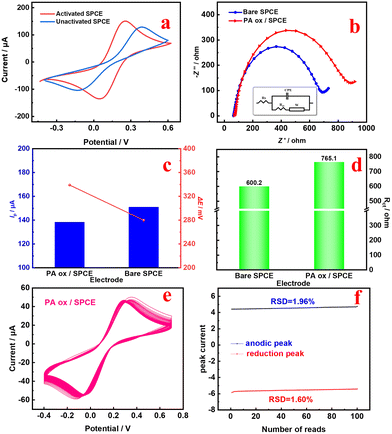
These results indicate that PA ox can be electrodeposited on the SPCE. An experiment to determine the stability and adhesion of the PA ox/SPCE was conducted, that is, 100 cycles of CV were repeated in 0.1 M KCl containing 5.0 mM [Fe(CN)6]3−/4− at a scan rate of 50 mV s−1 (Fig. 5e). The relative standard deviation (RSD) of the redox peak current of the PA ox/SPCE is 1.96% and 1.60% (Fig. 5f),40,41 respectively, so it is feasible to use electrodeposited PA ox as an internal reference probe.
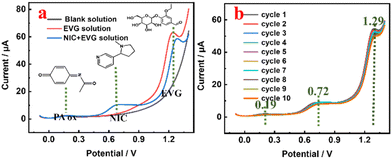
In order to investigate the repeatability and stability of the smart portable ratiometric sensor for the simultaneous detection of NIC and EVG, 10 repeated measurements were performed in a mixed solution containing 60 μmol L−1 NIC and 60 μmol L−1 EVG. As shown in Fig. 6b, the peak shapes of PA, NIC and EVG change only slightly after 10 measurements, indicating that the sensor has good repeatability and stability.
Molecular orbital theory is an important concept to describe the chemical behaviour of molecules in chemistry. The highest occupied molecular orbital (HOMO) and the lowest unoccupied molecular orbital (LUMO) are the most important molecular orbitals. The HOMO–LUMO gap was calculated according to Gaussian09W (Table 1). The results show that EVG has a larger HOMO–LUMO gap, which indicates that EVG has better kinetic stability and lower chemical reactivity, because the extraction of electrons from its HOMO is energetically unfavourable. In contrast, NIC, with a smaller HOMO–LUMO gap, has lower kinetic stability and higher chemical reactivity, because it is energy efficient to extract electrons from the HOMO.43,44 The results confirm the peak potential order of NIC and EVG in Fig. 6a.
Intelligent portable ratiometric detection of NIC and EVG by PA ox/SPCE
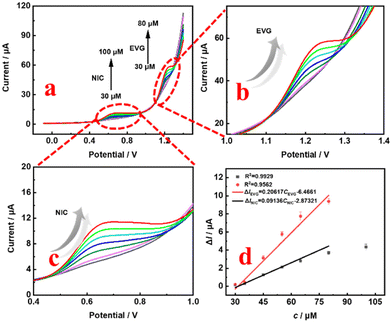
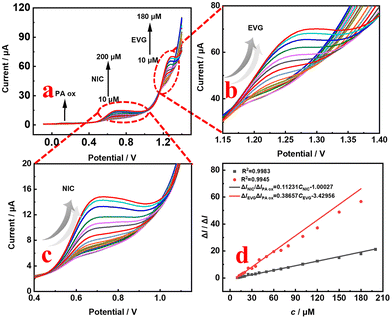
The optimization of the determination conditions of PA ox/SPCE, as shown in Fig. S3,† are discussed in detail in the ESI.†In order to further determine the advantages of the designed smart portable ratiometric sensor for the simultaneous detection of NIC and EVG, the SWV curves of different NIC concentrations from 10 μmol L−1 to 200 μmol L−1 in the presence of the internal reference probe PA are shown in Fig. 8a. The peak current ratio is linearly related to the concentration of NIC (Fig. 8d). The calculation formula of the detection limit is LOD = 3δ/S, where δ is the deviation of the response value, and S is the slope of the standard curve. The linear equation is ΔINIC/ΔIPA = 0.11231CNIC − 1.00027 (R2 = 0.9983), and the detection limit is 0.256 μmol L−1. Similarly, EVG shows a linear relationship in the concentration range of 10 μmol L−1 to 180 μmol L−1. The linear equation is ΔIEVG/ΔIPA = 0.38657CEVG − 3.42956 (R2 = 0.9945), and the detection limit is 0.058 μmol L−1. Fig. 7a shows the SWV curves of different NIC concentrations from 30 μmol L−1 to 80 μmol L−1, and the SWV curves of different EVG concentrations from 30 μmol L−1 to 80 μmol L−1 in the absence of the internal reference probe PA. As shown in Fig. 7d, linear regression equations are determined to describe the correlation: ΔINIC = 0.09022CNIC − 2.8286 (R2 = 0.9883) with a detection limit of 0.98 μmol L−1, and ΔIEVG = 0.0617CEVG − 6.4661 (R2 = 0.9562) with a detection limit of 0.088 μmol L−1. The experimental results (Table S1†) show that the calibration curve of the designed smart ratiometric sensor (Fig. 8) is more sensitive and linear than those of the non-ratiometric smart sensor (Fig. 7). Based on the smart, portable, simultaneous ratiometric measurement strategy, the sensing platform can provide a higher signal-to-noise ratio and better analysis performance. The detection limit of the ratiometric sensor is comparable to or better than that of some previously reported NIC individual detection (Table S2†) or simultaneous detection (Table S3†) systems.
The anti-interference, repeatability,45 and stability of the PA ox/SPCE sensor are shown in Fig. S4,† and discussed in detail in the ESI.†
Detection of NIC and EVG in real samples
It is necessary to prove the practical application value of the intelligent portable ratiometric sensor, and use the standard addition method46 to detect NIC and EVG in the ‘Seven Wolves’ cigarettes. It can be seen from Table 2 that the recovery rate is stable in the range 97.55%–103.82%, and the RSD is controlled within 2.65%. This shows that the intelligent portable ratiometric sensor can be applied to detection in actual tobacco samples.| Sample | Analyte | Added (μmol L−1) | Found (μmol L−1) | Recovery (%) | RSD (%) |
|---|---|---|---|---|---|
| 1 | NIC | 35 | 34.63 | 98.94 | 0.75 |
| EVG | 35 | 35.74 | 102.11 | 1.47 | |
| 2 | NIC | 40 | 39.02 | 97.55 | 1.75 |
| EVG | 40 | 40.73 | 101.82 | 1.28 | |
| 3 | NIC | 45 | 44.58 | 99.07 | 0.66 |
| EVG | 45 | 46.72 | 103.82 | 2.65 |
Conclusions
In this work, PA ox/SPCE was successfully prepared by PA electrodeposition at 1.0 V for 120 s. Electrodeposited PA ox was used as a new fixed state internal reference probe for the intelligent portable ratiometric detection of NIC and EVG. It is proved that PA ox/SPCE is successfully fabricated by theoretical calculation, SEM, EDS, FT-IR, UV-vis, chronoamperometry, CV, EIS and SWV. Under the optimized detection conditions, the detection limits for NIC and EVG are 0.256 μmol L−1 and 0.058 μmol L−1, respectively. A good recovery is obtained in the detection of ‘Seven Wolf’ cigarette samples. The preparation of the PA ox/SPCE intelligent portable ratiometric sensor allows the simultaneous determination of NIC and EVG, which is of value, and is likely to lead to the future development of more new electrochemical sensors for the simultaneous determination of more substances.Author contributions
Zhiyang Zhu, Pei He, and Zhenjie Li are the corresponding authors of this article and contributed to the development of this article. Shiyu Hu, Yuhang Zhang, Zhanning Liang, Yi Peng, and Xia Yu contributed to the development of the experimental part. Zhaohong Su, Shiyu Hu, Yuhang Zhang, Zhanning Liang, Yi Peng, and Qinyi Cao participated in the correction of the manuscript. Zhaohong Su, Shiyu Hu, and Yuhang Zhang contributed equally to this work.Conflicts of interest
The authors declare that they have no known competing financial interests or personal relationships that could have appeared to influence the work reported in this paper.Acknowledgements
This work was supported by the Foundation of Yunnan Key Laboratory of Tobacco Chemistry (2021539200340242), Natural Science Foundation of Hunan Province (2023JJ30285, 2020JJ4346), the Foundation of Department of Education of Hunan Province (20K063), the Foundation of Hunan Provincial Department of Agriculture and Rural Affairs (Advantage and Characteristic Industry Cluster and Industry Integration, Early Mature Rapeseed Industry Cluster), and the Postgraduate Scientific Research Innovation Project of Hunan Province (QL20230166). The authors would like to thank Shiyanjia Lab (https://www.shiyanjia.com) for SEM analyses.References
- X. Li, L. Liu, L. Guo, L. Xu, H. Kuang and C. Xu, J. Pharm. Biomed. Anal., 2023, 223, 115132 CrossRef CAS PubMed.
- T. Shao, X. Song, P. Li, S. Sun, D. Wang and W. Wei, Talanta, 2023, 259, 124539 CrossRef CAS PubMed.
- S. Veeralingam and S. Badhulika, ACS Appl. Nano Mater., 2020, 3, 12250–12259 CrossRef CAS.
- C. G. Toxvaerd, C. Pisinger, M. B. Lykke and C. J. Lau, Tob. Control, 2023, 32, 67–71 CrossRef.
- J. Heinonen, H. Niskakoski and T. Sainio, Sep. Purif. Technol., 2016, 169, 262–272 CrossRef CAS.
- X. Xu, Z. Chen, Q. Li, D. Meng, H. Jiang, Y. Zhou, S. Feng and Y. Yang, Microchem. J., 2021, 160, 105708 CrossRef CAS.
- Y. Tian, X. Tang, Y. Fu, S. Shang, G. Dong, T. Li, X. Huang and D. Zhu, Anal. Methods, 2021, 13, 5608–5616 RSC.
- Z. Li, Q. Wu, X. Zhang and G. Chen, Curr. Anal. Chem., 2023, 19, 77–99 CrossRef CAS.
- X. Peng, D. Giltrow, P. Bowdler and K. C. Honeychurch, Electroanalysis, 2017, 29, 374–379 CrossRef CAS.
- T. Shao, X. Song, P. Li, S. Sun, D. Wang and W. Wei, Talanta, 2023, 259, 124539 CrossRef CAS PubMed.
- Y. Tian, X. Tang, Y. Fu, S. Shang, G. Dong, T. Li, X. Huang and D. Zhu, Anal. Methods, 2021, 13, 5608–5616 RSC.
- J. Rajendran, A. K. Sundramoorthy, D. Ganapathy, R. Atchudan, M. A. Habila and D. Nallaswamy, J. Hazard. Mater., 2022, 440, 129705 CrossRef CAS PubMed.
- L. Fiore, B. De Lellis, V. Mazzaracchio, E. Suprun, R. Massoud, B. M. Goffredo, D. Moscone and F. Arduini, Talanta, 2022, 237, 122869 CrossRef CAS.
- Y. Zhou, H. Yin, W.-W. Zhao and S. Ai, Coord. Chem. Rev., 2020, 424, 213519 CrossRef CAS.
- M. Shehata, S. M. Azab, A. M. Fekry and M. A. Ameer, Biosens. Bioelectron., 2016, 79, 589–592 CrossRef CAS PubMed.
- T. Leelasree, S. Goel and H. Aggarwal, ACS Appl. Nano Mater., 2023, 6, 3138–3138 CrossRef CAS.
- Z. O. Erdogan and H. Balci, Spectrochim. Acta, Part A, 2023, 285, 121853 CrossRef CAS.
- Y. Hu, X. Wang, C. Wang, P. Hou, H. Dong, B. Luo and A. Li, RSC Adv., 2020, 10, 3115–3121 RSC.
- Z. Xu, P. Li, H. Chen, X. Zhu, Y. Zhang, M. Liu and S. Yao, J. Colloid Interface Sci., 2022, 628, 798–806 CrossRef CAS.
- J. Dong, J. Zheng, J. Hou, P. Zhao, Y. Liang, J. Lei, X. Luo, C. Hou and D. Huo, ACS Appl. Nano Mater., 2023, 6, 11630–11639 CrossRef CAS.
- W. Wu, N. Guo, Y. Zhang, G. Liu, L. Yu, X. Ma, W. Li and M. Chen, ACS Appl. Mater. Interfaces, 2023, 15, 14643–14653 CAS.
- J. Zhou, K. Pan, G. Qu, W. Ji, P. Ning, H. Tang and R. Xie, Chem. Eng. J., 2022, 449, 137853 CrossRef CAS.
- H. M. Mohamed, TrAC, Trends Anal. Chem., 2016, 82, 1–11 CrossRef CAS.
- Z. Wang, L. Gong, H. Zeng, T. Yang and X. Luo, Anal. Chim. Acta, 2021, 1146, 11–16 CrossRef CAS PubMed.
- S. N. Mane, S. M. Gadalkar and V. K. Rathod, Ultrason. Sonochem., 2018, 49, 106–110 CrossRef CAS.
- Y. Wu, F. Pei, S. Feng, Y. Zhang, F. Wang, Q. Hao, M. Xia and W. Lei, Colloids Surf., A, 2021, 628, 127291 CrossRef CAS.
- G. Cui, J. H. Yoo, J. S. Lee, J. Yoo, J. H. Uhm, G. S. Cha and H. Nam, Analyst, 2001, 126, 1399–1403 RSC.
- F. Chatraei and H. R. Zare, Analyst, 2011, 136, 4595–4602 RSC.
- K. J. Jackson, M. J. Schroeder, J. Ai, K. M. Taylor, O. Oniyide, L. C. Viray, C. Smith, B. Koszowski, J. M. Butler and W. B. Pickworth, Nicotine Tob. Res., 2023, 25, 1202–1206 CrossRef CAS PubMed.
- Y. Chen, X. Liu, T. Wu, W. Hou, M. Liu, Y. Zhang and S. Yao, Electrochim. Acta, 2018, 272, 212–220 CrossRef CAS.
- Z. Esmaeily, T. Madrakian, A. Afkhami, A. Ghoorchian and V. Ghasemzadeh-Mohammadi, Electrochim. Acta, 2021, 390, 138897 CrossRef CAS.
- E. Chiavazza, S. Berto, A. Giacomino, M. Malandrino, C. Barolo, E. Prenesti, D. Vione and O. Abollino, Electrochim. Acta, 2016, 192, 139–147 CrossRef CAS.
- Z. Sun, J. Fu, Y. Zhang, Y. Liu, S. Cheng, Y. Wu, Z. Shao, X. Cui and E. Xie, Adv. Funct. Mater., 2022, 32, 2106996 CrossRef CAS.
- X. Zhao, H. Gao, Y. Hou, L. Gbologah, X. Zeng and Y. Wang, J. Electroanal. Chem., 2022, 904, 115936 CrossRef CAS.
- X. Chen, Y. Ma, W. Li, Q. Gui, X. Zhan, Y. Lan, W. Pan, T. Zhou and Z. Su, ACS Appl. Polym. Mater., 2021, 3, 2553–2560 CrossRef CAS.
- K. S. Kokilambigai and K. S. Lakshmi, Green Chem. Lett. Rev., 2020, 14, 99–107 CrossRef.
- Y. Ge, M. Qu, L. Xu, X. Wang, J. Xin, X. Liao, M. Li, M. Li and Y. Wen, Microchim. Acta, 2019, 186, 836 CrossRef CAS PubMed.
- K. Barman, S. Luhar, R. Rane, D. N. Srivastava, S. K. Nema and S. Bhattacharjee, Plasma Processes Polym., 2023, 20, 2200161 CrossRef CAS.
- X. Wan, H. Du, D. Tuo, X. Qi, T. Wang, J. Wu and G. Li, ACS Appl. Nano Mater., 2023, 6, 19403–19413 CrossRef CAS.
- X. Zhou, Y. Kuang, J. Li, S. Hu, C. Cheng, J. Wang, X. Qin, L. Ou and Z. Su, ACS Appl. Polym. Mater., 2023, 5, 5609–5619 CrossRef CAS.
- Y. Zeng, M. B. Camarada, X. Lu, K. Tang, W. Li, D. Qiu, Y. Wen, G. Wu, Q. Luo and L. Bai, Food Chem., 2022, 370, 131024 CrossRef CAS PubMed.
- Z. Goodarzi, M. Maghrebi, A. F. Zavareh, Z.-B. Mokhtari-Hosseini, B. Ebrahimi-hoseinzadeh, A. H. Zarmi and M. Barshan-tashnizi, J. Nanostruct. Chem., 2015, 5, 237–242 CrossRef CAS.
- S. Bonyadi, K. Ghanbari and M. Ghiasi, New J. Chem., 2020, 44, 3412–3424 RSC.
- H. B. Suffredini, M. C. Santos, D. De Souza, L. Codognoto, P. Homem-de-Mello, K. M. Honório, A. B. F. da Silva, S. A. S. Machado and L. A. Avaca, Anal. Lett., 2005, 38, 1587–1599 CrossRef CAS.
- G. Li, X. Qi, J. Wu, X. Wan, T. Wang, Y. Liu, Y. Chen and Y. Xia, Food Chem., 2024, 436, 137753 CrossRef CAS PubMed.
- Y. Sha, J. Yu, J. Xiong, C. Yu, X. Zhu, B. Zhang, T. Fei and D. Wu, Anal. Methods, 2022, 14, 1579–1584 RSC.
Footnote |
| † Electronic supplementary information (ESI) available. See DOI: https://doi.org/10.1039/d3an01718d |
| This journal is © The Royal Society of Chemistry 2024 |

