Exploring the structural stability and electrochemical performance of B doped T-graphene nanotubes from first-principles calculations†
Ruyan
Zhang
a,
Yuhua
Hou
 *a,
Xialei
Guo
a,
Xinyu
Li
a,
Wei
Li
a,
Xiaoma
Tao
b and
Youlin
Huang
*a
aSchool of Materials and Engineering, Nanchang Hangkong University, Nanchang 330063, People's Republic of China. E-mail: hyhhyl@163.com; hyl1019_lin@163.com
bSchool of Physical Science and Technology, Guangxi University, Nanning 530004, People's Republic of China
First published on 29th November 2023
Abstract
The structural stability and electrochemical performance of intrinsic and B doped T-graphene nanotubes with different tube lengths are systematically studied by using first-principles calculations within the framework of density functional theory (DFT). The results show that with the increase of tube length, the adsorption energy of both intrinsic and B doped T-graphene nanotubes exhibits regular oscillations, and B doping is beneficial for elevating the adsorption ability of T-graphene nanotubes. The density of states show that intrinsic T-graphene nanotubes are zero band gap semiconductors, and the orbitals’ electronic states cross the Fermi level to form a p-type semiconductor, indicating that B doping greatly improves the conductivity of the system. The results of migration behavior demonstrate that B doping can effectively reduce the diffusion barrier of lithium ions on their surface, especially in B doped T-graphene nanotubes with a tube length of N = 1, resulting in more effective migration behavior and excellent rate performance. These findings provide a theoretical basis for the development and application of negative electrode materials for lithium-ion batteries.
1. Introduction
With the development of society and the continuous improvement of human life quality, the demand for energy is also increasing. Driven by the concept of green development, seeking new energy sources to reduce carbon emissions and optimize the energy structure has become one of the main ways to achieve sustainable development. Exploring sustainable new energy sources to replace traditional energy sources such as coal and oil that can cause certain environmental pollution has become a hot topic of concern. Li-ion batteries (LIBs) are among the industrially most widely used energy storage systems in the consumer electronics and electrified transport sectors, which have promoted the development of microelectronic devices. Compared with other rechargeable systems, lithium-ion batteries have the advantages of high energy density, light weight, long cycle life, no memory effect, good safety performance, and have broad application prospects in the fields, such as electronic products, electric vehicles, and energy storage.1,2 Lithium-ion batteries rely on lithium ions to “shuttle” between the positive and negative electrodes for power supply, so the charge and discharge performance of lithium ion battery anode materials is the key to their cycling stability.3,4 In order to keep up with advanced cathode materials, it is necessary to develop high capacity anode materials to improve the overall performance of lithium ion batteries.5–7Carbon is one of the most fascinating elements in nature, which can form many crystal structures with different properties, such as carbon clusters, carbon nanotubes, graphene, diamond, etc. Among them, graphene is one of the most remarkable two-dimensional (2D) carbon allotropes with special structure and properties,8–10 which makes it promising to be used in many new material/device applications, including solar cells, light emitting diodes and field-effect transistors, and has broad potential applications in electronics, photonics, optoelectronics, energy storage, etc. With the significant discoveries of graphene, people have begun to study graphene analogues, including T-graphene, R-graphene, S-graphene, pentagonal graphene, and patchwork graphene,11–17 which exhibit different properties due to their non-hexagonal structures. T-graphene has Dirac fermions and high Fermi velocity similar to graphene. It is a 2D thin sheet constructed by alternating carbon octagons and squares, and is also considered to be obtained by cutting adjacent two atomic layers along (001) from body-centered cubic (bcc) C8 or body-centered tetragonal (bct) C4. Due to its unique structural characteristics and excellent properties, it has attracted the research interest of many scholars. Liu et al.18 have proved that T-graphene is a homologous isomer of two-dimensional graphene, and is in a stable state in terms of thermodynamics and kinetics. It is found that although T-graphene does not have a honeycomb structure like graphene, it has similar Dirac fermions and high Fermi velocity, and there is a linear dispersion relationship in all directions near its Fermi surface. Subsequently, Kim et al.19 compared curled T-graphene with flat T-graphene through first-principles calculations, which showed that the spontaneous structural transformation had occurred from the curled T-graphene to the flat T-graphene, and the calculated lattice constant was 4.875 Å, which is very consistent with the results of Liu et al..18 Huang et al.20 compared the free energy of curled T-graphene with that of other homologous isomers of graphene, which found that curled T-graphene was more stable, and the phonon spectrum results showed that the phonon spectrum frequencies of T-graphene were positive, which also confirms its more stable structure.
Based on previous research results, two-dimensional T-graphene shows better performance than graphene, but few scholars have systematically studied the structural stability and electrochemical properties of one-dimensional T-graphene nanotubes (T-CNTs). Therefore, in order to explore the performance and advantages of T-graphene nanotubes as anode materials for lithium-ion batteries, flat T-graphene sheets were rolled up to form T-graphene nanotubes. The structural stability and electrochemical properties of intrinsic T-graphene nanotubes and B doped T-graphene nanotubes with a tube length of N = 1, 2, 3, and 4 were systematically studied using first principles calculations to clarify the effect of tube length N on their properties.
2. Method of calculations
2.1. Computational method
All calculations in the present study are performed using the Vienna Ab initio Simulation Package (VASP) within the frame of density functional theory (DFT).21–25 The projector augmented wave (PAW) method is utilized to solve the Kohn–Sham equations, while the electrons are described in the generalized gradient approximation (GGA) with the Perdew–Burke–Ernzerhof (PBE) exchange–correlation functional.26 The cutoff energy for the plane wave expansion is chosen to be 400 eV, and the Monkhorst–Pack scheme with 1 × 1 × 9 k-point mesh is used for the integration in the irreducible Brillouin zone. The total energy is converged within 10−6 eV. Structural optimization is considered converged when the final forces on all ions are less than 0.01 eV Å−1. The van der Waals interaction is based on Grimme's DFT-D3 approach.27 The migration paths and energy barriers of Li ions in the structures of T-graphene nanotubes and B doped systems with a tube length of N = 1, 2, 3, 4 are determined by using the climbing image nudged elastic band (CI-NEB) method.282.2. Crystal structures
The atomic structure of the periodic T-graphene plane composed of quadrilaterals and octagons is shown in Fig. 1. T-graphene nanotubes are formed by rolling a 2D T-graphene sheet in different directions, similar to ordinary carbon nanotubes, and the chirality vector is defined as follows:![[c with combining right harpoon above (vector)]](https://www.rsc.org/images/entities/i_char_0063_20d1.gif) h = n h = n![[a with combining right harpoon above (vector)]](https://www.rsc.org/images/entities/i_char_0061_20d1.gif) 1 + m 1 + m![[a with combining right harpoon above (vector)]](https://www.rsc.org/images/entities/i_char_0061_20d1.gif) 2 2 | (1) |
![[a with combining right harpoon above (vector)]](https://www.rsc.org/images/entities/i_char_0061_20d1.gif) 1 = a
1 = a![[x with combining circumflex]](https://www.rsc.org/images/entities/i_char_0078_0302.gif) and
and ![[a with combining right harpoon above (vector)]](https://www.rsc.org/images/entities/i_char_0061_20d1.gif) 2 = aŷ are the basis vectors of the T-graphene sheet, and n and m are integers. In this study, T-graphene nanotubes with (n,0) chirality are investigated, and the effects of changing the tube radius and doping B element on their structural stability and electrochemical performance are discussed.
2 = aŷ are the basis vectors of the T-graphene sheet, and n and m are integers. In this study, T-graphene nanotubes with (n,0) chirality are investigated, and the effects of changing the tube radius and doping B element on their structural stability and electrochemical performance are discussed.
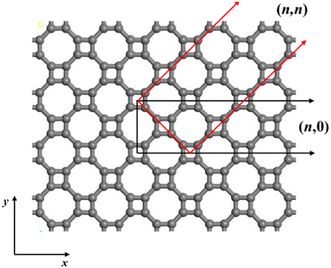 | ||
| Fig. 1 Atomic structure of the T-graphene sheet. (n,0) and (n,n) denote the different curving directions of the T-graphene sheet. | ||
3. Results and discussion
3.1. Structural stability
In all the considered structures, three high symmetry points are considered for the adsorption position, and the energies of adsorption position were also obtained, as shown in Fig. S1 and Table S1 of the ESI.† After testing, it is found that the adsorption energy of lithium ions is the lowest at the inside central vacancy of the hexagon (H1), as shown in Fig. S1 (ESI†), indicating that the adsorption structure of lithium ions at this position is the most stable. Therefore, in subsequent calculations, only the adsorption behavior and electrochemical properties at the H1 position are considered.In order to clarify the adsorption stability of lithium ions on T-graphene nanotubes with different diameters, the adsorption energy of lithium atoms in the (n,0) T-graphene nanotube structures was systematically studied, where n = 4, 5, 6, 7 and 8. The calculation formula for adsorption energy is as follows:
 | (2) |
![[thin space (1/6-em)]](https://www.rsc.org/images/entities/char_2009.gif) doped
doped![[thin space (1/6-em)]](https://www.rsc.org/images/entities/char_2009.gif) T-CNTs&Li/T-CNTs&Li is the energy of Li ions adsorbed on B doped T-CNTs or intrinsic T-CNTs of different lengths, ELi is the energy of a Li atom in bcc bulk, and EB
T-CNTs&Li/T-CNTs&Li is the energy of Li ions adsorbed on B doped T-CNTs or intrinsic T-CNTs of different lengths, ELi is the energy of a Li atom in bcc bulk, and EB![[thin space (1/6-em)]](https://www.rsc.org/images/entities/char_2009.gif) doped
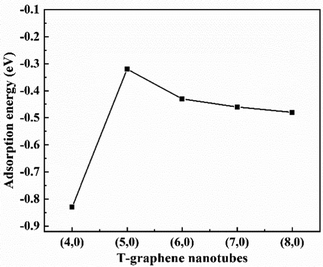
doped![[thin space (1/6-em)]](https://www.rsc.org/images/entities/char_2009.gif) T-CNTs/T-CNTs is the energy of B doped T-CNTs or intrinsic T-CNTs. The formation energies of (4,0), (5,0), (6,0), (7,0) and (8,0) T-graphene nanotubes and the adsorption energies of lithium ions on their surfaces are obtained, as shown in Table S2 (ESI†) and Fig. 2. It is found that the formation energies of T-graphene nanotubes with different tube diameters were negative, and with the increase of the diameter of the nanotubes, the adsorption energy of lithium ions first increases and then decreases. The adsorption energy on (4,0) T-graphene nanotubes is the lowest (−0.83 eV), indicating that the adsorption behavior of lithium ion on (4,0) T-graphene nanotubes is stronger than that on other diameter nanotubes.
T-CNTs/T-CNTs is the energy of B doped T-CNTs or intrinsic T-CNTs. The formation energies of (4,0), (5,0), (6,0), (7,0) and (8,0) T-graphene nanotubes and the adsorption energies of lithium ions on their surfaces are obtained, as shown in Table S2 (ESI†) and Fig. 2. It is found that the formation energies of T-graphene nanotubes with different tube diameters were negative, and with the increase of the diameter of the nanotubes, the adsorption energy of lithium ions first increases and then decreases. The adsorption energy on (4,0) T-graphene nanotubes is the lowest (−0.83 eV), indicating that the adsorption behavior of lithium ion on (4,0) T-graphene nanotubes is stronger than that on other diameter nanotubes.
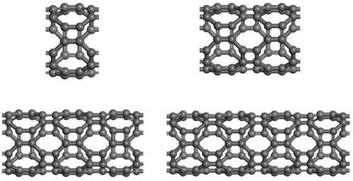
Considering the lowest adsorption energy of (4,0) T-graphene nanotubes compared to other diameter T-graphene nanotubes, (4,0) T-graphene nanotubes will be investigated in subsequent calculations, and the effects of different tube lengths and B doping on the performance will be considered. Fig. 3 and 4 respectively show the crystal models of (4,0) intrinsic T-graphene nanotubes and B doped T-graphene nanotubes with tube lengths N = 1, 2, 3 and 4.
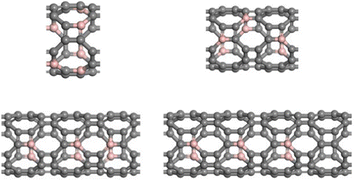 | ||
| Fig. 4 Crystal models of (4,0) T-CNTs with B doping and tube lengths N = 1, 2, 3, and 4. Gray and pink atoms represent C and B atoms, respectively. | ||
In order to determine whether B doped (4,0) T-graphene nanotubes with tube lengths N = 1, 2, 3 and 4 can exist stably, the formation energies (Ef) were calculated. The calculation formula is as follows:
Ef = [EB![[thin space (1/6-em)]](https://www.rsc.org/images/entities/char_2009.gif) doped doped![[thin space (1/6-em)]](https://www.rsc.org/images/entities/char_2009.gif) T-CNTs + x·EC − x·EB − ET-CNTs]/x T-CNTs + x·EC − x·EB − ET-CNTs]/x | (3) |
![[thin space (1/6-em)]](https://www.rsc.org/images/entities/char_2009.gif) doped
doped![[thin space (1/6-em)]](https://www.rsc.org/images/entities/char_2009.gif) T-CNTs and ET-CNTs are the total energies of B doped and intrinsic (4,0) T-graphene nanotubes with tube lengths N = 1, 2, 3 and 4, respectively. EC is the energy of one carbon atom of pristine graphene; EB is the energy of one B atom in its stable phase,29 and x is the number of B atoms, respectively. The formation energies of B doped (4,0) T-graphene nanotubes with different tube lengths are listed in Table 1.
T-CNTs and ET-CNTs are the total energies of B doped and intrinsic (4,0) T-graphene nanotubes with tube lengths N = 1, 2, 3 and 4, respectively. EC is the energy of one carbon atom of pristine graphene; EB is the energy of one B atom in its stable phase,29 and x is the number of B atoms, respectively. The formation energies of B doped (4,0) T-graphene nanotubes with different tube lengths are listed in Table 1.
| Tube lengths N | 1 | 2 | 3 | 4 |
|---|---|---|---|---|
| E f (eV) | −0.64 | −1.16 | −1.33 | −1.41 |
It can be seen that when B is doped into T-graphene nanotubes, the formation energy of the doped system is negative, indicating that the structure of B doped T-graphene nanotubes is stable. Meanwhile, it is found that the formation energy of B doped T-CNTs with different tube lengths varied from −1.41 eV to −0.64 eV, demonstrating that with the decrease of B doping concentration, the structure becomes more stable, and it is easier for B atoms to enter the longer T-graphene nanotubes to form a stable doping system. In order to study the stability of the structure, the B–C bond length in B-doped T-graphene nanotubes is also provided, as shown in Table S3 of the ESI.† There are two types of B–C bonds: (1) bonds that belong to the square (B-C1) and (2) the bonds connecting the square (B-C2). It can be seen that the B–C bond length varies slightly with the length of the tube, and the B–C bond length in the nanotube expands slightly compared to the original B–C bond (1.49 Å) in graphene.30
3.2. Adsorption behavior
In order to clarify the stability of lithium ions adsorbed on the surface of intrinsic T-CNTs and B doped T-CNTs with different lengths, the adsorption energies (Ead) were calculated using eqn (2). The adsorption energies of Li ions on the surfaces of intrinsic T-CNTs and B doped T-CNTs with different lengths are shown in Fig. 5.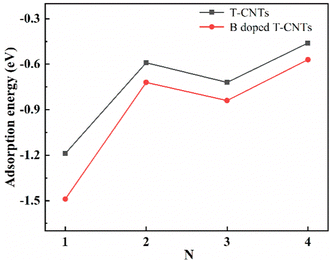 | ||
| Fig. 5 Adsorption energies of Li ions on the intrinsic T-CNTs and B doped T-CNTs with tube lengths N = 1, 2, 3 and 4. | ||
From Fig. 5, it can be seen that the adsorption energies of Li ions on the surfaces of intrinsic T-CNTs and B doped T-CNTs with different lengths are both negative, indicating that Li ions can stably adsorb on the surface and do not easily form clusters or lithium dendrites. With the increase of tube length, the adsorption energy of Li ions first increases and then decreases, showing a regular oscillation. Moreover, the adsorption energies of intrinsic and B doped T-graphene nanotubes with N = 1 are lower than those of other tube lengths, indicating that the interaction between T-graphene nanotubes with N = 1 and Li ions is stronger than that of other tube lengths. It can be concluded that when the tube length is N = 2n + 1 (n = 0, 1, 2…), the interaction between Li ions and T-CNTs is relatively strong, which is similar to the adsorption behavior of carbon nanotubes.31 Since T-CNTs are formed by connecting octagons and squares, which provides more capacity to accommodate Li ions both inside and outside the nanotubes, the lithium adsorption capacity is greatly increased. After B doping, the adsorption energies are found to be lower than those of the corresponding intrinsic T-CNTs, indicating that B doping can effectively improve lithium storage performance of T-CNTs.
3.3. Differential charge density
In order to further elucidate the interaction between the adsorbed Li ions and intrinsic T-CNTs and B doped T-CNTs, the differential charge densities are calculated according to the following formula:Δρ = ρLi+T-CNTs/B![[thin space (1/6-em)]](https://www.rsc.org/images/entities/char_2009.gif) doped doped![[thin space (1/6-em)]](https://www.rsc.org/images/entities/char_2009.gif) T-CNTs − ρT-CNTs/B T-CNTs − ρT-CNTs/B![[thin space (1/6-em)]](https://www.rsc.org/images/entities/char_2009.gif) doped doped![[thin space (1/6-em)]](https://www.rsc.org/images/entities/char_2009.gif) T-CNTs − ρLi T-CNTs − ρLi | (4) |
![[thin space (1/6-em)]](https://www.rsc.org/images/entities/char_2009.gif) doped
doped![[thin space (1/6-em)]](https://www.rsc.org/images/entities/char_2009.gif) T-CNTs represents the total charge density of adsorbed lithium ions of T-CNTs or B doped T-CNTs, ρT-CNTs/B
T-CNTs represents the total charge density of adsorbed lithium ions of T-CNTs or B doped T-CNTs, ρT-CNTs/B![[thin space (1/6-em)]](https://www.rsc.org/images/entities/char_2009.gif) doped
doped![[thin space (1/6-em)]](https://www.rsc.org/images/entities/char_2009.gif) T-CNTs denotes the charge density of intrinsic T-CNTs or B doped T-CNTs, and ρLi represents the charge density of a single Li atom.
T-CNTs denotes the charge density of intrinsic T-CNTs or B doped T-CNTs, and ρLi represents the charge density of a single Li atom.
Demonstrated in Fig. 6 are the differential charge densities of T-graphene nanotubes with different lengths of N = 1, 2, 3 and 4. The yellow electron cloud indicates the charge gain, while the blue indicates charge loss. It can be seen that the valence electrons of lithium are transferred to the area near the carbon atom, and the charge density between Li ions and C ions increases, and the electron density behind Li atoms decreases. By comparing the charge difference densities of T-graphene nanotubes of four lengths, it is found that the electron cloud distribution in T-graphene nanotubes with N = 1 is the most obvious, indicating that the interaction between Li ions and T-graphene nanotubes is the strongest. When the tube length of T-graphene nanotubes is N = 3 and N = 4, the electron cloud distribution of Li ion interaction with T-graphene nanotubes does not change significantly, manifesting that the electron transfer between Li ions and T-graphene nanotubes has little change with the continous increase of the tube length.
 | ||
| Fig. 6 The charge density distribution of T-CNTs with different tube lengths of N = 1, 2, 3 and 4, respectively. Brown and light green atoms represent C and Li atoms, respectively. | ||
Fig. 7 shows the differential charge density of B doped T-graphene nanotubes with different tube lengths of N = 1, 2, 3 and 4. It can be observed that the blue electron clouds mainly appear on one side of lithium ions, while the yellow electron clouds are mainly distributed on the other side of lithium ions adjacent to B doped T-graphene nanotubes. It is found that compared with the undoped system, the electron clouds of B doped T-graphene nanotubes increase significantly, and there is an obvious charge transfer between the nanotubes and B, Li ions. Moreover, the surface charge accumulation of B doped T-graphene nanotubes after adsorption of Li ions is much higher than that of intrinsic T-graphene nanotubes, indicating that B doping can effectively improve the lithium absorption capacity of T-graphene nanotubes.
 | ||
| Fig. 7 The charge density distribution of B doped T-CNTs with different lengths of N = 1, 2, 3 and 4, respectively. Brown, dark green and light green atoms represent C, B and Li atoms, respectively. | ||
3.4. Density of states
The density of states (DOS) were calculated and analyzed to investigate the effects of different tube lengths and B doping on the conductivity and adsorption properties of T-graphene nanotubes, respectively, as shown in Fig. S2 and Fig. S3 in the ESI.† Fig. S2(a)–(d) (ESI†) show the total density of states (TDOS) of intrinsic T-graphene nanotubes with N = 1, 2, 3 and 4, respectively, while Fig. S2(e)–(h) (ESI†) show the partial density of states (PDOS) of T-graphene nanotubes with N = 1, 2, 3 and 4 after lithium ion adsorption, respectively.From the TDOS data shown in Fig. S2 (ESI†), it can be inferred that all intrinsic T-graphene nanotubes with different lengths are zero bandgap semiconductors, similar to graphene. When lithium ions are adsorbed on the surface of T-graphene nanotubes, Li atoms will release an electron to T-graphene nanotubes, forming Li+ and C− pair. C atoms will share electrons to form a π-electron conjugated system, which makes the energy of electrons more compact and increases the conductivity. When more lithium ions are adsorbed, a layer of lithium ions forms around the surface of the nanotube, increasing the electron density and further improving the conductivity of the system.
In order to study the influence of B doping and lithium ion adsorption on the conductivity of T-graphene nanotubes with different lengths, the PDOS of B doped T-graphene nanotubes with N = 1, 2, 3 and 4 and the doped system after lithium ion adsorption was calculated, as shown in Fig. S3 (ESI†), where Cnear and Cfar represent the C atoms near and far away from the B atom, respectively.
As can be seen from Fig. S3 (ESI†), there are electron states passing through the Fermi level in the DOS of B doped T-graphene nanotubes with lengths of N = 1, 2, 3 and 4, indicating that B doping makes the system exhibit metallic characteristics from being a semiconductor. When B atoms are replaced with C atoms in the T-graphene nanotubes, the doped system will lack valence electrons, leading to the existence of a defect state energy level at the Fermi level, which makes it easier for the electrons in the valence band to occupy the defect energy level, thus forming a p-type semiconductor. It is also found that the overlap between Li-s and C-2p orbitals near the Fermi level is greater than that of intrinsic T-graphene nanotubes after adsorption of lithium ions, indicating that the interaction between Li ions and B doped T-graphene nanotubes is strengthened. During the adsorption of Li ions, significant charge transfer occurs, and the C-2p, B-2p, and Li-s orbital electrons play a dominant role in the conductivity of the system, suggesting that B doping promotes the interaction between C and Li.
3.5. Open circuit voltage and theoretical capacity
In order to clarify the effects of tube length and B doping on the open circuit voltage (OCV) of T-graphene nanotubes, the OCVs of T-graphene nanotubes with different tube lengths and B doping during lithium ion adsorption were investigated. The calculation method for the OCV is as follows: | (5) |
![[thin space (1/6-em)]](https://www.rsc.org/images/entities/char_2009.gif) doped
doped![[thin space (1/6-em)]](https://www.rsc.org/images/entities/char_2009.gif) T-CNTsLix1 and ET-CNTs/B
T-CNTsLix1 and ET-CNTs/B![[thin space (1/6-em)]](https://www.rsc.org/images/entities/char_2009.gif) doped
doped![[thin space (1/6-em)]](https://www.rsc.org/images/entities/char_2009.gif) T-CNTsLix2 represent the total energy of intrinsic or B doped T-graphene nanotubes with tube lengths N = 1, 2, 3, 4 when the lithium adsorption concentration is x1 and x2, respectively. x2-x1 denotes the amount of lithium adsorbed within each voltage platform range, and ELi represents the energy of a single Li atom.
T-CNTsLix2 represent the total energy of intrinsic or B doped T-graphene nanotubes with tube lengths N = 1, 2, 3, 4 when the lithium adsorption concentration is x1 and x2, respectively. x2-x1 denotes the amount of lithium adsorbed within each voltage platform range, and ELi represents the energy of a single Li atom.
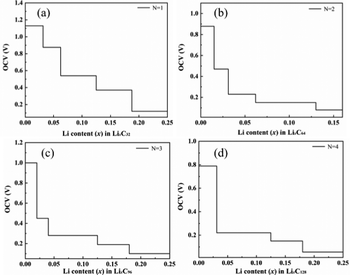
Demonstrated in Fig. 8 are the changes of the OCV during lithium ion adsorption for T-graphene nanotubes with different tube lengths, which shows that the OCV decreases with the gradual increase of Li ion concentration. When N = 1, the initial voltage platform of the OCV is the highest, reaching 1.13 V, which is mainly due to the high specific surface area and lithium capacity of T-graphene nanotubes with a small tube length. In addition, the end of the shorter T-graphene nanotubes is open, and Li ions can diffuse freely inside and outside the short tube during the charging and discharging process, enabling rapid charging of lithium ions in the battery electrode. It is noted that the initial voltage platform of T-graphene nanotubes after lithium adsorption exhibits a regular oscillatory relationship with tube length. Specifically, compared with N = 1, when N = 2, the initial voltage platform decreases, when N = 3, the initial voltage platform increases again, and when N = 4, the initial voltage platform continues to decrease, showing a similar trend to the adsorption energy of T-graphene nanotubes.
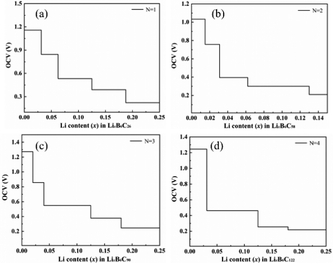
Fig. 9 shows the OCV of B doped T-graphene nanotubes with different lengths during lithium ion adsorption. It can be seen that the OCV of B doped T-graphene nanotubes shows the same change trend as that of the intrinsic T-graphene nanotubes. The initial voltage platform of lithium ion adsorption in B doped T-graphene nanotubes oscillates regularly with the increase of tube length. Compared with the intrinsic T-graphene nanotubes, the initial voltage platform of B doped T-graphene nanotubes with corresponding tube length is elevated due to the doping of B atoms. In general, when the OCV decreases monotonically with the increase of lithium ion concentration, the intercalation of lithium is close to ideal adsorption, and there is no surface phase transition during charge and discharge.32 However, if the formation energy curve of the lithium adsorption complex becomes convex and the OCV curve appears as a platform, the surface phase transition occurs in the platform region.33 As can be seen from Fig. 8 and 9, due to the coulomb repulsion between lithium ions, the OCV gradually decreases with the increase of lithium ion concentration, and there is no platform in the OCV curve (the amount of lithium adsorption (x2−x1) causes voltage stepping in the curve during each calculation). Therefore, the OCV curves of Li embedded T-CNTs and B doped T-CNTs belong to the former. When T-CNTs or B doped T-CNTs were used as negative electrodes, there was no surface phase transition during charging and discharging. It can be inferred from the above analysis that Li ions can be effectively adsorbed on the surface of B doped T-graphene nanotubes without forming metal clusters.34
The storage capacity of lithium ions determines whether the materials can be effectively used as lithium-ion battery materials. In order to investigate the effects of different tube lengths and B doping on the theoretical capacity of T-graphene nanotubes, the following formula was used to calculate the theoretical capacity.
 | (6) |
3.6. Migration behavior analysis
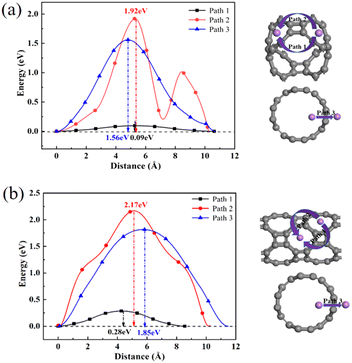
To further explore the adsorption behavior of Li ions on T-graphene nanotubes, a detailed study of the migration behavior of intrinsic and B doped T-graphene nanotubes with N = 1 and N = 2 was conducted. Excellent lithium storage materials require a faster diffusion rate during the Li ion adsorption process, which can be predicted from the migration barrier of lithium ions in the microscopic view. After adsorption of Li ions on T-graphene nanotubes, Li ions will migrate from one stable adsorption site to another one on the surface. The diffusion paths of Li ions on the surface of T-CNTs and migration barriers of Li ions were simulated and calculated using the CI-NEB method.Three pathways were considered, such as Path1, Path2, and Path3, which represent the energy barrier changes when Li ions migrate from one stable adsorption site to another stable absorption site in different repeating units through the inner, outer, and walls of the tube, respectively. The diffusion paths and corresponding diffusion energy barriers of T-graphene nanotubes with lengths of N = 1 and N = 2 are also shown in Fig. 10, respectively.
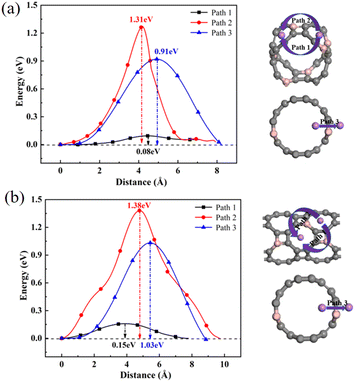 | ||
| Fig. 10 The diffusion paths and corresponding diffusion energy barriers of Li ions on T-CNTs with lengths of (a) N = 1 and (b) N = 2. Gray and purple atoms represent C and Li atoms, respectively. | ||
It can be seen from Fig. 10 that in the T-graphene nanotube with a length of N = 1, the migration energy barrier of lithium ions along Path1 is 0.09 eV, while the migration energy barriers along Path2 and Path3 are 1.92 eV and 1.56 eV, respectively, indicating that it is more difficult to move lithium ions outside the nanotubes and they tend to migrate inside the T-graphene nanotubes. It is also found that for the T-graphene nanotube with a length of N = 2, the energy barriers of lithium ion migration along Path1, Path2 and Path3 are 0.28 eV, 2.17 eV and 1.85 eV, respectively, which manifests that the longer the tube, the more unfavorable for lithium ion migration. Normally, only some large rings on the tube wall can allow lithium ions to pass through the tube wall, while T-graphene nanotubes are composed of octagons and squares, and small gaps in the squares make it difficult for lithium ions to pass through. Compared with carbon nanotubes,38 lithium ions have a smaller migration energy barrier when passing through T-graphene nanotubes, indicating that T-graphene nanotubes have a higher surface area, which enables lithium ions to migrate more effectively in the crystal structure. Although the nanotube wall is a barrier for lithium movement, the open end of the nanotube can attract more lithium ions, making it easier for lithium ions to migrate in the T-graphene nanotube with a length of N = 1.
Fig. 11 shows the diffusion paths and corresponding diffusion energy barriers of lithium ions in B doped T-graphene nanotubes with lengths of N = 1 and N = 2. It can be seen that the energy barriers of each diffusion path of lithium ions on the B doped T-graphene nanotubes are lower than those on the intrinsic T-graphene nanotubes. Especially for the Path1 of B doped T-graphene nanotube with the length N = 1, the migration energy barrier is only 0.08 eV. Meanwhile, B doping reduces the energy barrier of lithium ions migrating from the inside to the outside of the tube along Path3 to 0.91 eV, indicating that lithium ions may also migrate to the outside through the nanotube wall. The calculation results show that lithium ions can migrate more effectively in B doped T-graphene nanotubes with a length of N = 1, which indicates that it shows excellent rate performance. Therefore, B doping is an effective method to improve the charge and discharge rates of T-graphene nanotubes.
4. Conclusions
In this work, the structural stability, adsorption behavior, differential charge density, density of states, OCV, theoretical capacity and lithium ion migration behavior of intrinsic and B doped T-graphene nanotubes with lengths of N = 1, 2, 3 and 4 were systematically investigated using DFT calculations. The results show that the adsorption energies of lithium ion in intrinsic and B doped T-graphene nanotubes are low, and the adsorption energies exhibit regular oscillation with the increase of nanotube length. And B doping can effectively improve the conductivity of T-graphene nanotubes. The data of open circuit voltage and adsorption capacity show that the initial voltage platform of intrinsic and B doped T-graphene nanotubes after Li ion adsorption oscillates regularly with the change of tube length, and B doping greatly enhances the theoretical adsorption capacity of T-graphene nanotubes. The migration behavior results show that Li ions preferentially migrate within T-graphene nanotubes, and B doping effectively reduces the diffusion barrier of Li ions. Especially for Li ions in B doped T-graphene nanotubes with a length of N = 1, excellent rate performance is achieved, indicating that B doping can effectively improve the charge–discharge rate of T-graphene nanotubes. The results of this study provide theoretical guidance for the preparation of high-performance anode materials for lithium-ion batteries in the laboratory.Author contributions
Ruyan Zhang: methodology, investigation, and writing – original draft. Yuhua Hou: investigation – review. Xialei Guo: methodology, investigation, and writing – original draft. Xinyu Li: methodology and investigation. Wei Li: writing – review & editing and supervision. Xiaoma Tao: writing – review & editing. Youlin Huang: investigation.Conflicts of interest
No conflict of interest exits in the submission of this manuscript, and the manuscript is approved by all authors for publication. The corresponding author would like to declare on behalf of their co-authors that the work described is original research that has not been published previously, and not under consideration for publication elsewhere, in whole or in part. All the authors listed have approved the final version of this manuscript.Acknowledgements
This work is supported by the National Natural Science Foundation of China (Grant No. 52361034), the Jiangxi Provincial Key R&D Program (Grant No. 20192ACB50020), the Natural Science Foundation of Jiangxi Province (Grant No. 20202BABL204022) and the Jiangxi Postgraduate Innovation Fund (Grant No. YC2022-006).Notes and references
- J. Hassoun, P. Reale and B. J. Scrosati, J. Mater. Chem., 2007, 17, 3668–3677 RSC.
- M. S. Whittingham, MRS Bull., 2008, 33, 411–419 CrossRef CAS.
- Y. P. Wu, E. Rahm and R. Holze, J. Power Sources, 2003, 114, 228–236 CrossRef CAS.
- J. Arin, S. Thongtem, A. Phuruangrat, S. Thongtem, A. Phuruangrat and T. Thongtem, Mater. Lett., 2017, 193, 270–273 CrossRef CAS.
- G. Assat and J. M. Tarascon, Nat. Energy, 2018, 3, 373–386 CrossRef CAS.
- J. Lu, Z. W. Chen, F. Pan, Y. Cui and K. Amine, Electrochem. Energy Rev., 2018, 1, 35–53 CrossRef CAS.
- Y. Wen, K. He, Y. J. Zhu, F. D. Han, Y. H. Xu, I. Matsuda, Y. Ishii, J. Cumings and C. S. Wang, Nat. Commun., 2014, 5, 5033–5043 CrossRef.
- A. K. Geim and K. S. Novoselov, Nat. Mater., 2007, 6, 183–191 CrossRef CAS.
- C. Lee, X. Wei, J. W. Kysar and J. Hone, Science, 2008, 321, 385–388 CrossRef CAS.
- K. S. Novoselov, A. K. Geim, S. V. Morozov, D. Jiang, Y. Zhang, S. V. Dubonos and I. V. Grigorieva, Science, 2004, 306, 666–669 CrossRef CAS.
- R. H. Baughman, H. Eckhardt and M. Kertesz, J. Chem. Phys., 1987, 87, 6687–6699 CrossRef CAS.
- S. Nath, A. Bandyopadhyay, S. Datta, M. M. Uddin and D. Jana, Phys. E, 2020, 120, 114087–114095 CrossRef CAS.
- Z. H. Wang, X. F. Zhou, X. M. Zhang, Q. Zhu, H. F. Dong, M. W. Zhao and A. R. Oganov, Nano Lett., 2015, 15, 6182–6186 CrossRef CAS.
- S. H. Zhang, J. Zhou, Q. Wang, X. S. Chen, Y. Kawazoe and P. Jena, Proc. Natl. Acad. Sci. U. S. A., 2015, 112, 2372–2377 CrossRef CAS.
- R. Majidi and A. I. Ayesh, Mol. Simul., 2023, 49, 1044–1050 CrossRef.
- Y. X. Yu, J. Mater. Chem. A, 2013, 1, 13559–13566 RSC.
- Y. Ma, P. Ying, K. Luo, Y. J. Wu, B. Z. Li, Q. Y. Han and J. L. He, Phys. Chem. Chem. Phys., 2023, 25, 21573–21578 RSC.
- Y. Liu, G. Wang, Q. S. Huang, L. W. Guo and X. L. Chen, Phys. Rev. Lett., 2012, 108, 225505 CrossRef.
- B. G. Kim, J. Y. Jo and H. S. Sim, Phys. Rev. Lett., 2013, 110, 029601 CrossRef.
- H. Q. Huang, Y. C. Li, Z. R. Liu, J. Wu and W. H. Duan, Phys. Rev. Lett., 2013, 110, 029603 CrossRef.
- G. Kresse and J. Furthmüller, Phys. Rev. B: Condens. Matter Mater. Phys., 1996, 54, 11169–11186 CrossRef CAS PubMed.
- G. Kresse and J. Hafner, Phys. Rev. B: Condens. Matter Mater. Phys., 1993, 47, 558–561 CrossRef CAS.
- G. Kresse and J. Hafner, Phys. Rev. B: Condens. Matter Mater. Phys., 1994, 49, 14251–14269 CrossRef CAS.
- G. Kresse and J. Furthmüller, Comput. Mater. Sci., 1996, 6, 15–50 CrossRef CAS.
- G. Kresse and D. Joubert, Phys. Rev. B: Condens. Matter Mater. Phys., 1999, 59, 1758–1775 CrossRef CAS.
- J. P. Perdew, K. Burke and M. Ernzerhof, Phys. Rev. Lett., 1996, 77, 3865–3868 CrossRef CAS.
- S. Grimme, J. Comput. Chem., 2006, 27, 1787–1799 CrossRef CAS PubMed.
- B. Jang, J. Koo, M. Park, H. Lee, J. Nam, Y. Kwon and H. Lee, Appl. Phys. Lett., 2013, 103, 263904 CrossRef.
- N. Vast, S. Baroni, G. Zerah, J. M. Besson, A. Polian, M. Grimsditch and J. C. Chervin, Phys. Rev. Lett., 1997, 78, 693 CrossRef.
- R. Gholizadeh and Y. X. Yu, J. Phys. Chem. C, 2014, 118, 28274–28282 CrossRef CAS.
- G. Qi and T. Rabczuk, Carbon, 2019, 155, 727–733 CrossRef CAS.
- Y. X. Yu, Appl. Surf. Sci., 2021, 546, 149062 CrossRef CAS.
- Y. X. Yu and A. C. S. Appl, Energy Mater., 2023, 6, 10048–10060 CAS.
- X. Zhang, J. Hu, Y. Cheng, H. Y. Yang and Y. Yao, Nanoscale, 2016, 8, 15340–15347 RSC.
- K. Persson, V. A. Sethuraman, L. J. Hardwick, Y. Hinuma, Y. S. Meng, A. Ven and V. Srinivasan, J. Phys. Chem. Lett., 2010, 1, 1176–1180 CrossRef CAS.
- M. V. Koudriachova, N. M. Harrison and S. W. Deleeuw, Phys. Rev. Lett., 2001, 86, 1275–1278 CrossRef CAS PubMed.
- W. H. Wan, Q. F. Zhang, Y. Cui and E. Wang, J. Phys.: Condens. Matter, 2010, 22, 415501 CrossRef.
- X. Zhang, Z. Yu, S. S. Wang, S. Guan, H. Y. Yang, Y. G. Yao and S. Y. Yang, J. Mater. Chem. A, 2016, 4, 15224–15231 RSC.
Footnote |
| † Electronic supplementary information (ESI) available. See DOI: https://doi.org/10.1039/d3cp04143c |
| This journal is © the Owner Societies 2024 |

