Theoretical insights into surface-phase transition and ion competition during alkali ion intercalation on the Cu4Se4 nanosheet†
Yang-Xin
Yu
 *
*
Laboratory of Chemical Engineering Thermodynamics, Department of Chemical Engineering, Tsinghua University, Beijing 100084, P. R. China. E-mail: yangxyu@mail.tsinghua.edu.cn
First published on 21st November 2023
Abstract
The development of stable and efficient electrode materials is imperative and also indispensable for further commercialization of sodium/potassium-ion batteries (SIBs/PIBs) and new detrimental issues such as proton intercalation arise when utilizing aqueous electrolytes. Herein the electrochemical performance of the Cu4Se4 nanosheet was determined for both organic and aqueous SIBs and PIBs. By means of density functional theory calculation, Na+, K+ and H+ intercalations onto both sides of the Cu4Se4 nanosheet were revealed. The Cu4Se4 nanosheet well maintains its metallic electronic conductivity and the changes in lateral lattice parameters are within 4.66% during the whole Na+/K+ intercalation process for both SIBS and PIBs. The theoretical maximum Na/K storage capacity of 188.07 mA h g−1 can be achieved by stabilized second-layer adsorption of Na+/K+. The migration barriers of Na and K atoms on the Cu4Se4 nanosheet are 0.270 and 0.173 eV, respectively. It was discovered that Na/K- intercalation in the first layer is accompanied by a first-order surface phase transition, resulting in an intercalation voltage plateau of 0.659/0.756 V, respectively. The region of the two-surface phase coexistence for PIBs, is shifted toward a lower coverage when compared with that for SIBs. The partially protonated Cu4Se4 nanosheet (HxCu4Se4, x ≤ 10/9) was revealed to be structurally and thermodynamically stable. While the partially protonated Cu4Se4 nanosheet is favorable in acidic electrolytes (pH = 0) when protons and Na/K ions compete, we showed that Na+/K+ intercalated products may be preferred over H+ at low coverages in alkali electrolyte (pH = 14). However, the proton intercalation substantially decreases the battery capacity in aqueous SIBs and PIBs. Our work not only identifies the promising performance of Cu4Se4 nanosheets as an electrode material of SIBs and PIBs, but also provides a computational method for aqueous metal-ion batteries.
1. Introduction
In the area of electrochemical energy storage and conversion, lead acid and Ni–Cd batteries are gradually being superseded by lithium-ion batteries (LIBs) in portable electronic devices such as laptops and cell phones, convenient transport tools such as electric bicycles and large-scale applications due to the high energy density and long cycle life of LIBs.1 Sodium/potassium-ion batteries (SIBs/PIBs), on the other hand, are promising as alternatives to LIBs in many applications such as power grids in terms of the prices of lithium, sodium and potassium and the chemical similarity between sodium/potassium and lithium. Lithium resources are scarce and unevenly distributed in Latin America, resulting in the risk of an unstable supply and increase in the price of the lithium market. In contrast, sodium and potassium are the most abundant elements on Earth. More importantly, they do not electrochemically form an alloy with aluminium and thus aluminium foil can be used as the current collector of both electrodes.2 However, SIBs/PIBs are still confronted with huge challenges for practical use because of the large volume change, low ion capacity, slow ion diffusion and sluggish electrode kinetics resulting from the larger ionic diameter of Na+ (2.04 Å) and K+ (2.76 Å) compared to Li+ (1.52 Å). Some alternative electrode materials3–6 including carbonaceous materials, metal oxides, transition metal sulfides and selenides have been developed for SIBs and PIBs. Therefore, major obstacles of electrode materials for SIBs and PIBs include their low electrical conductivity and the structural instability related to the large volume change during the charge/discharge process. Comprehensive investigations on electrode materials are strongly required to realize practical SIBs and PIBs.Various materials with enormous spaces such as layered transition oxides,4,7,8 olivine FePO4,9 and Prussian blue frameworks10 have been explored as cathodes. On the other hand, the vast majority of anode materials for LIBs exhibit almost zero electrochemical activity for SIBs and PIBs. For instance, carbon-based electrode materials have a capacity of no more than 300 mA h g−1. Two-dimensional (2D) materials such as transition metal chalcogenides11,12 and oxychalcogenide monolayers,6 and MXenes13 can provide high capacities due to their large surface-to-volume ratios and stable structures. Multilayer adsorption of sodium on MXenes has the potential to enhance the ion capacity by more than a factor of two and Ti3C2O2 MXene exhibits a low diffusion barrier, high electronic conductivity and small lattice parameter changes.13 However, K+ diffuses slower than Na+ on MXenes. In order to achieve higher reactivity and a lower diffusion barrier, hetero-structured hybrid composites with a large interlayer space have to be developed. However, a method to halt the spontaneous aqueous oxidation of MXenes should be proposed before MXenes can be applied to batteries.14 Single-layered MoS2 is a promising anode material for SIBs and PIBs due to the isotropic ion transport paths and high specific capacity. Zhang et al.15 found that MoS2@C and Fe7S8@C in dimethyl ether (DME) electrolyte have promising potential for fast SIBs and PIBs with a higher initial coulombic efficiency and capacity when compared with those in ethylene carbonate/diethyl carbonate electrolyte. However, major challenges arise from its semiconductor nature and easy-agglomeration.
Ternary copper chalcogenides possess rich structural and compositional diversity.16 Some representatives, for instance, mixed-valent compounds, have attracted attention due to the high electrical conductivity and compelling structural relationship discovered in these materials. Ternary copper chalcogenides tend to crystallize in 2D structures in most cases with many identical structural units. They are often Cu-deficient, that is, only Cu+ is located in the chalcogenide network instead of Cu2+, and the mixed valency exists in the form of delocalized holes resulting in p-type metallic conductivity.17 Chen et al. reported a 2D metal NaCu4Se4 synthesized by using CuO as the starting precursor in a molten sodium polyselenide flux. The obtained NaCu4Se4 adopts a layered hexagonal structure with space group P63/mmc, which is composed of infinite 2D [Cu4Se4]− slabs separated by Na+. Electronic transport measurement18 indicated that NaCu4Se4 is a p-type metal with a carrier density of approximately 1021 cm−3 and a high hole mobility of approximately 808 cm2 V−1 s−1 at 2 K. In principle, KCu4Se4 should also be Cu-deficient and exhibit a p-type metallic nature that is strikingly analogous to the layered NaCu4Se4 compound explained above.
Considering the CuSe crystal with space group P63/mmc19 exhibits metallic conductivity, the Cu4Se4 layered material is supposed to be a possible anode material for SIBs and PIBs. As we know, there is no report on the possibility of using Cu4Se4 nanosheets as an electrode material for SIBs and PIBs. Therefore, to investigate this hypothesis, we carried out density functional theory (DFT) calculations to explore the stability and electrochemical performance of the Cu4Se4 nanosheet. The stability, electronic and mechanic properties of Cu4Se4 nanosheets are predicted using DFT. And then the kinetics of K/Na diffusion, the geometric structure, voltage and work function evolutions during K/Na intercalation on the Cu4Se4 nanosheet as well as the electronic characteristics of the intercalated system are obtained. Considering aqueous batteries have great potential with advantages of non-flammability, high safety, low cost and environmental friendliness,10,20 the K/Na competitive intercalation with protons is also determined to investigate the possibility of the Cu4Se4 nanosheet as an electrode material for aqueous SIBs and PIBs. Our objective is to explore the potential of using the Cu4Se4 nanosheet as an electrode of SIBs and PIBs and thereby to enhance the broader understanding of copper chalcogenide-based electrodes for the rational design of SIB and PIB electrodes with a high electrochemical performance.
2. Computational methods
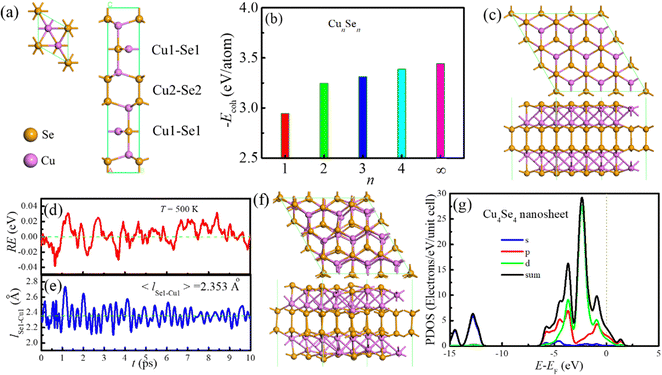
The hexagonal CuSe crystal in the P63/mmc space group19 was constructed (Fig. 1a) and then mono-, bi-, tri- and four-layer CuSe structures were obtained by cleaving the (001) plane of the bulk crystal. A 3 × 3 × 1 supercell with the length of 30 Å in the z-direction was used for geometric optimization of the pristine structure and one-surface layer adsorption, and a supercell length of 40 Å in the z-direction was adopted for two-surface adsorption to avoid imaging effects. All geometric optimization and unrestricted DFT energy calculations were carried out with the DMol3 package21,22 within the exchange–correlation energy modeled using the generalized gradient approximation (GGA) in the version of the Perdew–Burke–Ernzerhof (PBE) functional.23 The dispersion correction method proposed by Grimme24 was adopted to correct the dispersive contribution to the system energy. All Electron Relativistic core treatment with the basis set of DNP (file 4.4) was used. The global orbital cutoff is 5.6 Å. The Brillouin zone was sampled by using the Monkhorst–Pack grid of 8 × 8 × 1 k-points. The self-consistence field (SCF) tolerance was set to 1.4 × 10⁻⁵ eV. A smear parameter of 0.14 eV was applied to speed up SCF convergence. In the geometric optimization, an energy of 2.7 × 10⁻⁵ eV was set for the energy convergence and the maximum values for forces acting on each atom and displacements were within 5.4 × 10⁻³ eV Å−1 and 5.0 × 10⁻⁴ Å, respectively. The zero-point energy was neglected in this work due to its marginal effect on the adsorption of alkaline atoms. There are usually two methods for studying ion diffusion in electrode materials. One is to use ab initio molecular dynamics (AIMD) simulations and the diffusion coefficient is calculated as the averaged mean square displacement of alkali metal atoms over time.25 Another method is to search the diffusion transition state and the diffusion barrier is estimated by the energy difference between the transition and initial state. The latter method was selected in this work to evaluate ion diffusion. Similar to our previous work, the difference of energies between the Fermi level and the vacuum was used to determine the work function (WF)26 and the strain energies at a series of strains were recorded to calculate the mechanic properties of the nanosheet.6 A 10.0 ps AIMD simulation was carried out in a canonical ensemble at 500 K to identify the thermodynamic stability of the Cu4Se4 nanosheet. When a solvent was involved in the studied systems, the conductor-like screening model in the DMol3 package (DMol3/COSMO)27 was used to simulate the solvent environment with a specific dielectric constant.Adsorption energy was evaluated by
| Ead = EM–Cu4Se4 − ECu4Se4 − EM | (1) |
| ΔEf = EM2yCu4Se4 − (1 − y)ECu4Se4 − yEM2Cu4Se4 | (2) |
The intercalation voltage (Vint) can be computed with an increment of δ intercalated atoms, i.e.,
| Vint = (EMxCu4Se4 + δEM − EMx+δCu4Se4)/δe | (3) |
| q = xF/(3.6MCu4Se4) | (4) |
| OCV = (ECu4Se4 +xEM − EMxCu4Se4)/xe | (5) |
E0[Na+/Na] = −2.714 V![[thin space (1/6-em)]](https://www.rsc.org/images/entities/char_2009.gif) vs. vs.![[thin space (1/6-em)]](https://www.rsc.org/images/entities/char_2009.gif) E0[H+/H2] E0[H+/H2] | (6) |
E0[K+/K] = −2.928 V![[thin space (1/6-em)]](https://www.rsc.org/images/entities/char_2009.gif) vs. vs.![[thin space (1/6-em)]](https://www.rsc.org/images/entities/char_2009.gif) E0[H+/H2] E0[H+/H2] | (7) |
Therefore, the voltages of SIBs and PIBs can be represented by that of H+ reductions via
V![[thin space (1/6-em)]](https://www.rsc.org/images/entities/i_char_2009.gif) vs. vs.![[thin space (1/6-em)]](https://www.rsc.org/images/entities/char_2009.gif) (Na+/Na) = V (Na+/Na) = V![[thin space (1/6-em)]](https://www.rsc.org/images/entities/char_2009.gif) vs. vs.![[thin space (1/6-em)]](https://www.rsc.org/images/entities/char_2009.gif) (H+/H2) + 2.714 V (H+/H2) + 2.714 V | (8) |
V![[thin space (1/6-em)]](https://www.rsc.org/images/entities/i_char_2009.gif) vs. vs.![[thin space (1/6-em)]](https://www.rsc.org/images/entities/char_2009.gif) (K+/K) = V (K+/K) = V![[thin space (1/6-em)]](https://www.rsc.org/images/entities/i_char_2009.gif) vs. vs.![[thin space (1/6-em)]](https://www.rsc.org/images/entities/i_char_2009.gif) (H+/H2) + 2.928 V (H+/H2) + 2.928 V | (9) |
According to the Nernst equation, the voltage resulted from Na+, K+ and H+ intercalation into the Cu4Se4 nanosheet at different pHs and concentrations of Na+ and K+ can be written as
VH+![[thin space (1/6-em)]](https://www.rsc.org/images/entities/char_2009.gif) vs. vs.![[thin space (1/6-em)]](https://www.rsc.org/images/entities/char_2009.gif) (H+/H2) = Vint,H + (RT/F) ln (H+/H2) = Vint,H + (RT/F) ln![[thin space (1/6-em)]](https://www.rsc.org/images/entities/char_2009.gif) aH+ = Vint,H − (2.3026 aH+ = Vint,H − (2.3026![[thin space (1/6-em)]](https://www.rsc.org/images/entities/char_2009.gif) RT/F) × pH RT/F) × pH | (10) |
VH+![[thin space (1/6-em)]](https://www.rsc.org/images/entities/char_2009.gif) vs. vs.![[thin space (1/6-em)]](https://www.rsc.org/images/entities/char_2009.gif) (Na+/Na) = Vint,H + 2.714 − (2.3026 (Na+/Na) = Vint,H + 2.714 − (2.3026![[thin space (1/6-em)]](https://www.rsc.org/images/entities/char_2009.gif) RT/F) × pH RT/F) × pH | (11) |
VH+![[thin space (1/6-em)]](https://www.rsc.org/images/entities/char_2009.gif) vs. vs.![[thin space (1/6-em)]](https://www.rsc.org/images/entities/char_2009.gif) (K+/K) = Vint,H + 2.928 − (2.3026 (K+/K) = Vint,H + 2.928 − (2.3026![[thin space (1/6-em)]](https://www.rsc.org/images/entities/char_2009.gif) RT/F) × pH RT/F) × pH | (12) |
And the voltages of SIBs and PIBs can be derived from the Ernst equation as
VNa+![[thin space (1/6-em)]](https://www.rsc.org/images/entities/char_2009.gif) vs. vs.![[thin space (1/6-em)]](https://www.rsc.org/images/entities/char_2009.gif) (Na+/Na) = Vint,Na + (RT/F)ln (Na+/Na) = Vint,Na + (RT/F)ln![[thin space (1/6-em)]](https://www.rsc.org/images/entities/char_2009.gif) aNa+ aNa+ | (13) |
VK+![[thin space (1/6-em)]](https://www.rsc.org/images/entities/char_2009.gif) vs. vs.![[thin space (1/6-em)]](https://www.rsc.org/images/entities/char_2009.gif) (K+/K) = Vint,k+ + (RT/F)ln (K+/K) = Vint,k+ + (RT/F)ln![[thin space (1/6-em)]](https://www.rsc.org/images/entities/char_2009.gif) aK+ aK+ | (14) |
3. Results and discussion
3.1. Crystal structures of the CunSen monolayers
The bulk crystal structure of CuSe was fully relaxed using the hexagonal modification of CuSe crystallizing in the P63/mmc space group as the initial configuration. The optimized lattice parameters are a = b = 3.994 Å and c = 17.215 Å, which are in good agreement with the experimental data of a = b = 3.938 Å and c = 17.250 Å (see Fig. 1a and Table S1, ESI†). The calculated bond lengths of Se1–Cu1, Se2–Cu2, Se1–Cu2 and Se2–Se2 are 2.306, 2.394, 2.445 and 2.426 Å, respectively. The Na/K diffusion paths and barriers in an unexfoliated Cu4Se4 crystal were explored first and the obtained diffusion barriers for Na and K ions are 0.91 and 0.68 eV, respectively. Such high diffusion barriers are not conducive to the fast charging and discharging of the SIBs and PIBs. Therefore, it is essential to take measures to increase the distances between Cu4Se4 layers through large heteroatom-doping or exfoliating the crystal to the Cu4Se4 monolayer.When fully relaxing the CuSe monolayer resulted from cleaving the (001) plane of the bulk crystal, two different structures, the low-buckled phase (CuSe-a monolayer) and the planar phase (CuSe-b monolayer) were obtained (Fig. S1, ESI†). We found that the fully relaxed CuSe-a monolayer is more stable than the CuSe-b monolayer. For the free-standing bilayers, two different structures were also obtained and the one with the shorter lattice constant and both buckled surfaces is more thermodynamically stable than another structure with a longer lattice constant and both plane surfaces (Fig. S2, ESI†). In the two optimized tri-layer configurations (Fig. S3, ESI†), the Cu3Se3-a has lower energy than the Cu3Se3-b. However, Cu3Se3-a is a planar asymmetric structure and therefore it is easily aggregated into a thicker symmetrical structure at high temperature. In contrast, the nanosheet with a four-layer symmetrical structure is more thermodynamic stable than the unsymmetrical one (Fig. 1c and Fig. S4, ESI†). The cohesive energies of the CuSe nanosheets with different thickness and bulk crystal are displayed in Fig. 1b, and here the cohesive energy is defined as
| Ecoh = (ECunSen − nECu − nESe)/(2n) | (15) |
From Fig. 1b one can obtain the exfoliation energy, Eexf(CunSen), for the CunSen nanosheet from the difference in cohesive energy between the nanosheet and its bulk crystal.
| Eexf(CunSen) = Ecoh(CunSen) − Ecoh (bulk) | (16) |
The most preferred structure of the Cu4Se4 nanosheet is composed of two unique Cu atoms (Fig. 1c), where the Cu1 atom is coordinated by three Se1 atoms in a bent trigonal planar geometry and the Cu2 atom is coordinated by one Se1 atom and three Se2 atoms. The Cu4Se4 nanosheet contains [Se2]2− dimers with a Se–Se bond length of 2.425 Å (Table S1, ESI†). The Se1–Cu1, Se2–Cu2 and Se1–Cu2 distances in the Cu4Se4 nanosheet are 2.346, 2.412 and 2.453 Å, respectively, which are slightly larger than those in CuSe bulk crystal. All vibrational modes of the Cu4Se4 nanosheet were identified and listed in Table S2 (ESI†) according to their frequency and intensity. No negative frequencies (imaginary vibrations) were found, indicating the dynamics stability of the Cu4Se4 nanosheet. We have also carried out NVT AIMD simulation to further validate the thermodynamic stability of the Cu4Se4 nanosheet at 500 K. The AIMD simulation lasts 10.0 ps with a time step of 2.0 fs. The resulting energy and Se1–Cu1 bond length evolutions as well as the final geometric structures (Fig. 1d–f) identify that the Cu4Se4 nanosheet is thermodynamically stable at 500 K. Fig. 1g shows that there are plenty of electrons in the Fermi level which ensure that the Cu4Se4 has metal-like electronic conductivity. The d orbital of the Cu atom and p orbital of the Se atom have almost equal contribution at the Fermi level. The predicted work function of the Cu4Se4 nanosheet is 5.361 eV, which is higher than that of the graphene (4.49 eV).26
The mechanical properties and the fracture characteristics of the Cu4Se4 nanosheet were computed using DFT and the obtained elastic coefficients are C11 = C22 = 93.27 N m−1, C12 = 59.17 N m−1 and C66 = 20.08 N m−1. The calculated Young's modulus and Poisson's ratio are 55.73 N m−1 and 0.6344, respectively. The elastic coefficients meet the criterion of (C11C22)1/2 > C12 and C66 > 0, indicating the mechanic stability of the Cu4Se4 nanosheet.
Fig. 2 gives the stress (σ) and strain energy as a function of uni-axial and bi-axial strains (εx and εy) for the Cu4Se4 nanosheet at 0 K. The stress is defined by
 | (17) |
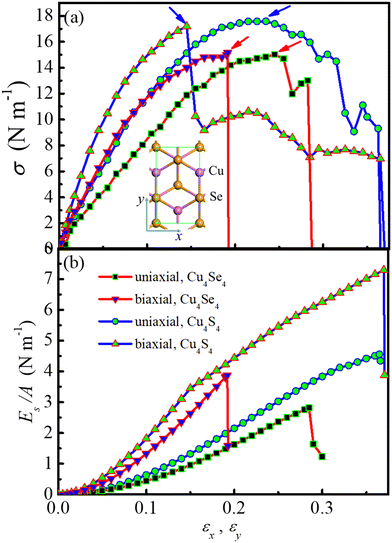 | ||
| Fig. 2 (a) Stress (σ) and (b) strain energy per area (Es/A) as a function of uni-axial and bi-axial strains (εx and εy) for the Cu4Se4 nanosheet at 0 K. | ||
From Fig. 2a one can see that the ultimate tensile strength (UTS) for the uni-axial and bi-axial strains of the Cu4Se4 nanosheet is 15.03 and 15.16 N m−1, respectively, and the strains at UTS are 24.5% and 19.2%, respectively. For comparison, we have also calculated the stress and strain energy as a function of strain for the Cu4S4 nanosheet and included the results in Fig. 2. It is shown that the UTS of the Cu4Se4 monolayer is slightly smaller than that of the Cu4S4 monolayer (17.58 and 17.19 N m−1 for uni-axial and bi-axial, respectively) while the corresponding strains at UTS are slightly larger than that of the Cu4S4 nanosheet (23.5% and 14.5%). The failure strains for the uni-axial and bi-axial strains of the Cu4Se4 nanosheet are 28.8% and 19.2% (Fig. 2b), respectively. These values are substantially smaller than those of the Cu4S4 nanosheet (36.5% and 37.0%).
3.2. Single atom adsorption and diffusion
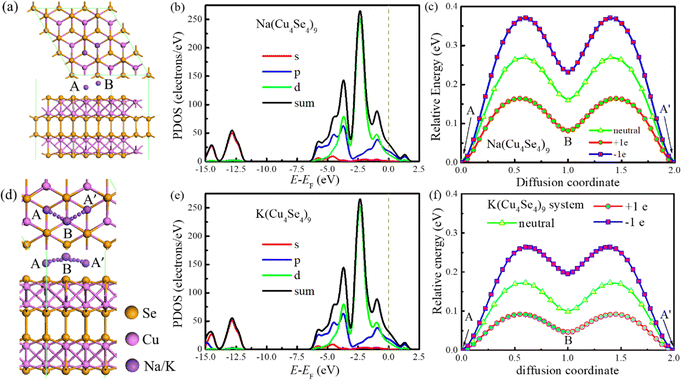
There are two distinguished adsorption sites (A and B) for Na/K adatoms on the Cu4Se4 nanosheet. The A site is located on top of a lower layer Se atom (hexagon site) and the B site on top of an outer layer Cu atom (see Fig. 3a). Table 1 lists the adsorption energy (Ead), charge transfer (Q), work function (WF), adsorption height (h) and the nearest distance (lM–Se) between the adatom and Se atoms for a sodium or potassium atom adsorbed on the Cu4Se4 nanosheet. Here h is defined as the perpendicular distance from the adatom to the surface of the Cu4Se4 nanosheet. Table 1 indicates that adsorption on the A site is thermodynamically preferred for both sodium and potassium atoms. Besides the stronger adsorption on the A site, the Q, h, lM–Se and work function drop upon adsorption on the A site and are smaller than those on the B site. The adsorption energy of a sodium atom is −1.716 eV while that of a potassium atom is −2.206 eV on the preferred adsorption site. The stronger adsorption of a potassium atom leads to more charge transfer and a greater work function drop. As it should be, the lK–Se and h for the adsorption of a potassium atom are longer than those for sodium adsorption due to the larger radius of a potassium atom. Fig. 3b indicates that the PDOS remains nearly unchanged upon sodium adsorption and therefore the electric conductivity of the nanosheet is still satisfactory enough to meet the requirement of an electrode.| Site | E ad (eV) | |Q| (e) | WF (eV) | l M–Se (Å) | h (Å) |
|---|---|---|---|---|---|
| Adsorption of a sodium atom | |||||
| A | −1.716 | 0.397 | 4.816 | 2.884 | 1.681 |
| B | −1.557 | 0.455 | 4.735 | 2.956 | 1.936 |
| Adsorption of a potassium atom | |||||
| A | −2.206 | 0.542 | 4.571 | 3.228 | 2.251 |
| B | −2.107 | 0.552 | 4.490 | 3.293 | 2.414 |
We have investigated the diffusion energy along the preferred path from the A site to B site and then to another A site (A′) (Fig. 3c and d). The migration energy barriers strongly depend on the surface charge density on the electrode. The diffusion barrier of a sodium atom on the neutral Cu4Se4 nanosheet is 0.270 eV. However, the barrier increases to 0.371 eV on the negatively charged Cu4Se4 nanosheet with a surface charge density of −0.0669 C m−2 (namely, one electron on the 3 × 3 × 1 supercell) and decreases to 0.164 eV on the positively charged nanosheet with a surface charge density of +0.0669 C m−2.
The adsorption of a potassium atom on the 3 × 3 × 1 Cu4Se4 supercell maintains the metallic characteristics just like that of a sodium atom as indicated from the PDOSs displayed in Fig. 3b and e. Also the same type of diffusion path was found for a potassium atom on the 3 × 3 × 1 Cu4Se4 supercell with lower migration barriers (Fig. 3c and f). As demonstrated in Fig. 3f, the diffusion barriers of a potassium atom on the negatively charged (surface charge of −0.0669 C m−2), neutral and positively charged (surface charge of +0.0669 C m−2) Cu4Se4 nanosheets are 0.264, 0.173 and 0.092 eV, respectively. It should be pointed out that we have considered the perturbation of surface charge densities of the Cu4Se4 nanosheet since the electrode may be positively or negatively charged during the charge/discharge process. The decrease in migration barrier on the positively charged nanosheet is due to the reduced adsorption energy resulting from the repulsion of positive charges to the alkali metal atoms like Na and K. The introduction of an electron or hole in the Na/K-Cu4Se4 systems involves the addition of a negative or positive charge to the system, respectively. It is reasonable for us to identify whether there is any dependence of the calculated diffusion barrier depicted in Fig. 3c and f on the thickness of the vacuum layer. We calculated the diffusion barriers of Na/K ions on the Cu4Se4 nanosheet with positive, negative and zero charge and different thicknesses of the vacuum layer. The results are presented in Fig. 4. It can be seen that all diffusion barriers decrease rapidly as the thickness of the vacuum layer is increased to 5.0 and 6.6 Å for Na and K atoms, respectively. And then they slowly increase to constant values. When the thickness of the vacuum layer is larger than 20 Å, the diffusion barriers remain almost unchanged, indicating a distance of z = 30 Å (vacuum layer thickness of 21.1 Å) between adjacent layers is adequately long to avoid the van der Waals (vdW) interactions caused by two nearest periodic units and thus, the calculated diffusion barriers depicted in Fig. 3c and f are independent of the thickness of the vacuum layer.
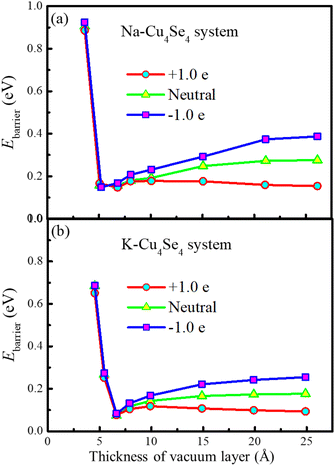 | ||
| Fig. 4 Na/K ion diffusion barriers as a function of the thickness of the vacuum layer: (a) Na and (b) K ion diffusion. | ||
The predicted diffusion barrier (0.270 eV) of a sodium atom on the neutral Cu4Se4 nanosheet is lower than that on two-dimensional Si3C (0.34 eV)33 and larger than that on Ti3C2O2 MXene (0.20 eV).13 The diffusion barrier of a potassium atom on the neutral Cu4Se4 nanosheet is lower than that on the V2Se2O monolayer (0.482 eV)6 and that through the one-dimensional tunnel of the α-MnO2 electrode (0.31 eV).34 All these values of migration barriers are adequately low enough to enable very fast ionic diffusion on the surface of the Cu4Se4 nanosheet at room temperature.
3.3. Sodium/potassium deintercalation mechanism
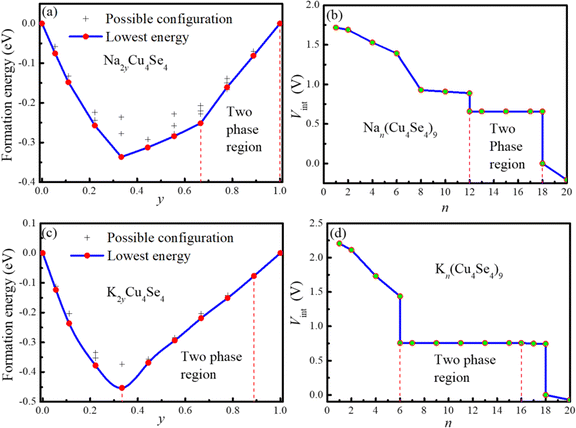
The sodium/potassium intercalation energies and geometric structures were determined by inserting two atoms each time to both sides of the 3 × 3 × 1 Cu4Se4 supercell. There are numerous possible electrode configurations for a given concentration of metal ions characterized by their diverse arrangements, making it challenging to determine the most energetically favorable one solely through an enumeration method followed by DFT calculations. Generally, the use of software such as the alloy theoretic automated toolkit (ATAT)35 can be more effective in addressing this issue. However, in the case studied in this work, the Na/K ion distribution on the surface of the Cu4Se4 nanosheet is two-dimensional and at most only nine Na/K atoms were involved. Considering there are only nine preferred adsorption sites on each surface of the Cu4Se4 nanosheet, the possible arrangement of intercalated ions is limited. In the calculation of formation energies of adsorption complexes, the lattice parameters and atomic coordinates of all possible configurations of Na/K ion adsorption were fully relaxed and their corresponding formation energies were estimated. The results with relative low energies are shown in Fig. S5–S20 (ESI†). The configuration with the lowest energy at each Na/K concentration was regarded as the stable intercalation state and used to obtain the intercalation voltage (Vint). The obtained formation energy and intercalation voltage profiles are shown in Fig. 5 as a function of Na/K intercalation concentration.The straightforward connection between the intercalation voltage and the formation energy means the occurrence and nature of surface-phase transitions due to the variations in Na/K intercalation have clear signatures in the formation energy curves and the Vint profiles as illustrated in Fig. 5. If the Cu4Se4 nanosheet adsorbs Na/K atoms in thermodynamic ideality, it would exhibit a concave formation energy curve and a smooth sloping Vint curve, just like the case of K-intercalation on V2Ch2O (Ch = S, Se and Te) monolayers. However, here the formation energy curves as demonstrated in Fig. 5a and c, reveal a local convex curve, indicating Na/K intercalations are accompanied by a first-order surface phase transition from an Na/K-poor surface phase to an Na/K-rich surface phase. The Na/K chemical potential inside the miscibility gap is constant, resulting in a Vint plateau in the two-phase region as shown in Fig. 5b and d. The Vint plateaus for Na- and K-intercalations are 0.659 and 0.756 V, respectively. This phenomenon is very similar to the process of Li-intercalation into FePO4, where a first-order phase transition accompanies the Li insertion.36
Fig. 6 shows the most favorable intercalation structures during the sodium insertion/extraction process on the 3 × 3 × 1 Cu4Se4 supercell at 0 K. When the sodium atom intercalation is within the concentration (y) range from 0 to 2/3, the formation energy curve is concave (Fig. 5a) and the Vint decreases monotonically (Fig. 5b). The most favorable intercalation structures can be found in the 3 × 3 × 1 supercell for each sodium concentration as illustrated in Fig. 6a–f. However, when the number of intercalated atoms (n) is between 12 and 18 (2/3 < y < 1), we can never find a structure in the 3 × 3 × 1 Cu4Se4 supercell with an energy lower than that of a linear combination between the structures shown in Fig. 6f and i. That is to say, the formation energy curve in the range of 2/3 < y < 1 obtained in the 3 × 3 × 1 supercell is convex, indicating coexistence of two-surface phases and resulting in a Vint plateau of 0.659 V in this region (Fig. 5b).
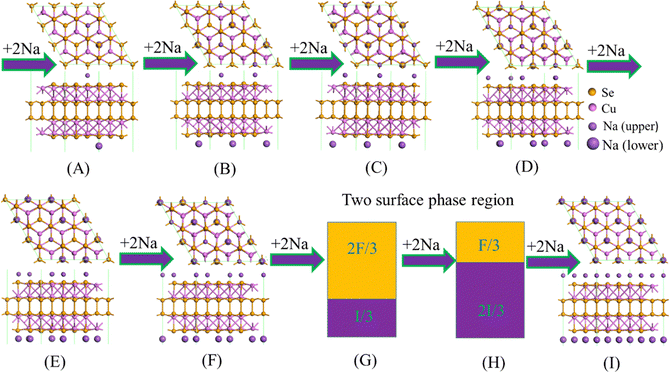 | ||
| Fig. 6 Structural evolution during the sodium atom insertion/extraction process on the 3 × 3 × 1 Cu4Se4 supercell at 0 K. | ||
The structural evolution during the K-intercalation on the 3 × 3 × 1 Cu4Se4 supercell at 0 K illustrated in Fig. 7 shows that the coexistence of two-surface phases is in the concentration range of 1/3 < y < 8/9 (Fig. 5c and d). In the K-poor surface phase, the potassium atoms in the same side of the 3 × 3 × 1 Cu4Se4 supercell maintain a maximum distance from each other. Just like the Na-intercalation, all the potassium atoms are adsorbed on the A sites of the Cu4Se4 nanosheet. Compared with the Na-intercalation, the region of two-surface phase coexistence during the K-intercalation is shifted toward a lower concentration due to the larger size of a potassium atom which results in a larger packing fraction on the Cu4Se4 nanosheet.
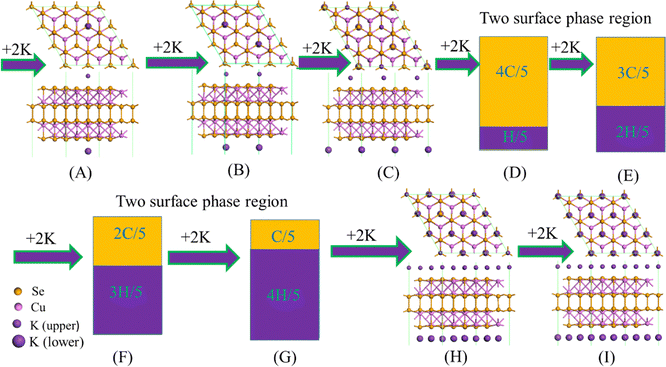 | ||
| Fig. 7 Structural evolution during the potassium atom insertion/extraction process on the 3 × 3 × 1 Cu4Se4 supercell at 0 K. | ||
The electronic conductivity of electrode materials can directly affect the charge/discharge performance of metal-ion batteries. Most transition metal dichalcogenides are semi-conductors and carbon-based materials have to be introduced to improve their electronic conductivity and decrease the internal resistance of the battery. In contrast, the pristine Cu4Se4 nanosheet has a metallic characteristic and its good electronic conductivity is maintained during the charge/discharge cycles of both SIBs and PIBs, as demonstrated by the project densities of states (PDOSs) in Fig. 8. At low concentrations of sodium/potassium intercalation, the copper d-orbitals and selenium p-orbitals contribute almost equally to the DOS at the Fermi level (Fig. 8a, b and d) and as the intercalation concentration is increased, the contribution of the selenium p-orbitals becomes larger than that of copper d-orbitals near Fermi level (Fig. 8b, e and f). Our calculated PDOSs are similar to that of NaCu4Se4 reported previously.18 Plenty of p- and d-electrons as well as a small number of s-electrons near the Fermi level ensure good conductivity of the intercalated Cu4Se4 nanosheet during all the charge/discharge cycles.
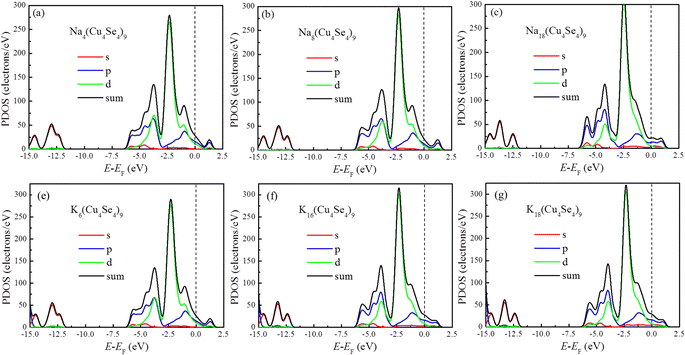 | ||
| Fig. 8 PDOSs of different intercalated systems at 0 K: (a) four, (b) eight and (c) eighteen sodium atoms, and (d) six, (e) sixteen and eighteen potassium atoms on the 3 × 3 × 1 Cu4Se4 supercells. | ||
The insertion/extraction of Na/K atoms can cause volume changes in the lattice of the electrode materials. Without exception, the lateral lattice parameter a of the Cu4Se4 nanosheet changes during the Na/K intercalation process. The percent changes of the lateral lattice parameter of the Cu4Se4 nanosheet is demonstrated in Fig. 9a. The lateral lattice parameter increases as the intercalated atom number is increased and the maximum lattice changes of 4.66% and 4.47% can be found at full monolayer adsorption of sodium and potassium atoms, respectively. The lateral lattice parameter changes for the K-intercalation are almost the same as those for sodium insertion. However, as the intercalation atom number becomes larger than six, the lattice parameter changes for sodium intercalation are obviously greater than those for potassium insertion. The energy variations of the pristine Cu4Se4 nanosheet and the full monolayer adsorption structures of sodium and potassium ions are demonstrated in Fig. 9b and c. It is illustrated that transverse tension or compression of the Cu4Se4 nanosheet results in a rapid increase in energy. This increase in energy becomes more pronounced for full monolayer adsorption structures of sodium and potassium atoms. The slope of strain energy variation with lateral lattice parameter is in the order: Cu4Se4 < Na2Cu4Se4 < K2Cu4Se4, as can be deduced from Fig. 9b and c. This means that to make same changes in the lattice parameter, the most energy would be consumed for the K2Cu4Se4 nanosheet. In turn, when the consumed energy is the same for the Na2Cu4Se4 and K2Cu4Se4 nanosheets, the lateral lattice parameter change for the former would be greater than the latter. Whatever happens, all these lattice changes are in a state where elastic deformation of the Cu4Se4 nanosheet can be restored and thus they do not affect the cycling performance of the batteries.
In order to identify the volume expansion along the c-direction, the geometric structures of Cu4Se4, NaCu4Se4 and KCu4Se4 crystals were optimized. The final geometric structures are shown in Fig. S21 (ESI†) and their lattice parameters are listed in Table S3 (ESI†). The calculated volume expansions for Na atoms intercalated into Cu4Se4 crystal are 9.8%. The lattice parameters along the c-direction are expanded by 2.8% for the formation of NaCu4Se4. These volume expansion values are substantially smaller than those of Na intercalation in MoS2 (a volume expansion of 27% at full concentration),37 indicating a better cycling stability of the Cu4Se4 nanosheet. The volume expansion of unexfoliated Cu4Se4 for K-ion intercalation can be evaluated from the crystal structures shown in Fig. S21a and c (ESI†) and the corresponding lattice parameters are also included in Table S3 (ESI†). The volume expansion along the c-direction for K ion intercalation to form KCu4Se4 crystal is 10.3% and the total volume expansion is 18.6%.
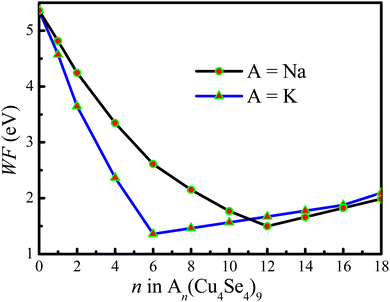
The work function reflects the kinetic energy of electrons to overcome the barrier and thus escape from the materials. Therefore, we calculated the work function of the electrode material as a function of the number of intercalated metal ions. Fig. 10 shows the calculated work function as a function of the number of intercalated atoms on the 3 × 3 × 1 Cu4Se4 supercell at 0 K. For sodium atoms adsorbed on the Cu4Se4 nanosheet, Fig. 10 shows initially a rapid lowering of work function, from 5.361 eV to a minimum of 1.361 eV at n = 12 (x = 4/3 in NaxCu4Se4), and subsequently a linear increase towards 2.095 eV at n = 18. The sodium concentration at which the work function is a minimum corresponds to the starting point of the first-order surface phase transition and the linear increase portion of the curve is the location of the two-surface phase coexistence region. In contrast, the minimum of the work function for the KxCu4Se4 nanosheet occurs at a lower concentration (x = 2/3) than that for the NaxCu4Se4 nanosheet due to the first-order surface phase transition of KxCu4Se4 at a lower concentration caused by the larger size of the potassium atom. The work function drop induced by Na/K adsorption on the Cu4Se4 nanosheet can be ascribed to the formation of an electric dipole at the surface which is antiparallel to that of the Cu4Se4 surface dipole layer. Initially the work function of KxCu4Se4 decreases more rapidly than that of NaxCu4Se4 due to the larger dipole moment of KxCu4Se4 resulting from the longer adsorption height and more electrons transferred from the potassium atoms to the Cu4Se4 nanosheet (Table 1). The decreases in the work function shown in Fig. 10 indicate that the introduction of intercalated Na/K ions indeed changes the electronic properties of the Cu4Se4 nanosheet although it maintains the structures with the same space group. The lower work function itself will contribute to fast interfacial charge migration and enhanced electron-transfer kinetics, thus leading to its better rate performance.
The final increase in work function has been attributed to a metallization of the alkali monolayer. We obtained a work function of 2.095 and 1.986 eV for Na2Cu4Se4 and K2Cu4Se4, respectively. At this coverage the saturation level has not yet been reached since the work function of Na(111) and K(111) surfaces is 2.68 ± 0.06 and 2.39 ± 0.02 eV,38 respectively. This is mainly because the distance between alkali atoms is elongated on the surface of the Cu4Se4 nanosheet when compared with those in their bulk crystals.
3.4. Bilayer adsorption
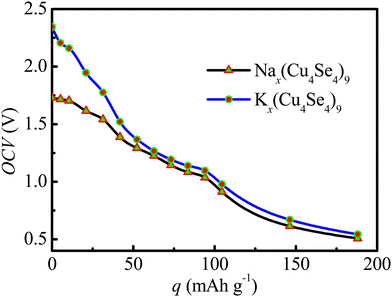
To explore the possibility of Na/K bilayer adsorption on the Cu4Se4 nanosheet, we calculated the second layer adsorption of the Na/K adatoms. In Fig. 11 we demonstrate the average OCV of the Cu4Se4 nanosheet as a function of the capacity for SIBs and PIBs. The average OCV of PIBs is obviously higher than that of SIBs. The Cu4Se4 nanosheet shows the highest capacity of 188.07 mA h g−1 for the full Na/K bilayer adsorption. The unique stable bilayer adsorption of Na/K atoms ensures the high Na/K storage capacity on the Cu4Se4 nanosheet if the overall kinetics are adequately fast and a suitable electrolyte is selected. As pointed out previously,3 the electrons are spread out in the first Na/K adsorption layer and metallic bonds are formed just like in their bulk counterparts. The formed metallic bonds can screen the repulsive Coulomb interaction between the positive Na/K ions, stabilizing the second-layer adsorption.In order to identify the effective screening argument, we compare the nearest distances between two Na/K layers adsorbed in different layers on the Cu4Se4 nanosheet (Fig. 12) with those in their bulk crystals. The calculated lattice parameters for bulk Na and K metal crystals (space group Im![[3 with combining macron]](https://www.rsc.org/images/entities/char_0033_0304.gif) m) are 4.023 and 5.161 Å, respectively. These values of lattice parameters correspond to a nearest distance of 3.848 and 4.470 Å between two atoms at different layers for bulk Na and K metal crystals, respectively. The stable structures in Fig. 12 show that the nearest distance of two atoms in different layers is 3.619 and 4.609 Å, for Na and K-intercalations, respectively. It is found that Na and K have a small distance difference of −6.6% and 3.1%, respectively, indicating a small repulsion between the positive Na/K ions resulting from the strong screening of Coulomb interactions. In addition, the perpendicular distances between the first adsorption layer and the surface of the Cu4Se4 nanosheet have been reduced by 6.3% and 3.9% for the full bilayer adsorption of Na and K atoms, respectively, when compared with the adsorption heights of a single Na and K atom (Table 1). These reductions in adsorption heights indicate that the second layer adatoms push the first layer ones shifting toward the surfaces of the Cu4Se4 nanosheet to stabilizing the bilayer adsorption structures. Therefore, the small nearest distance differences from the bulk counterparts validate the argument of metallic bond formation, which is the key factor for bilayer adsorption. The Cu4Se4 nanosheet electrode can be developed by considering bilayer Na/K adsorption on its two surfaces in terms of the screening of Coulomb repulsion between the positive Na/K ions.
m) are 4.023 and 5.161 Å, respectively. These values of lattice parameters correspond to a nearest distance of 3.848 and 4.470 Å between two atoms at different layers for bulk Na and K metal crystals, respectively. The stable structures in Fig. 12 show that the nearest distance of two atoms in different layers is 3.619 and 4.609 Å, for Na and K-intercalations, respectively. It is found that Na and K have a small distance difference of −6.6% and 3.1%, respectively, indicating a small repulsion between the positive Na/K ions resulting from the strong screening of Coulomb interactions. In addition, the perpendicular distances between the first adsorption layer and the surface of the Cu4Se4 nanosheet have been reduced by 6.3% and 3.9% for the full bilayer adsorption of Na and K atoms, respectively, when compared with the adsorption heights of a single Na and K atom (Table 1). These reductions in adsorption heights indicate that the second layer adatoms push the first layer ones shifting toward the surfaces of the Cu4Se4 nanosheet to stabilizing the bilayer adsorption structures. Therefore, the small nearest distance differences from the bulk counterparts validate the argument of metallic bond formation, which is the key factor for bilayer adsorption. The Cu4Se4 nanosheet electrode can be developed by considering bilayer Na/K adsorption on its two surfaces in terms of the screening of Coulomb repulsion between the positive Na/K ions.
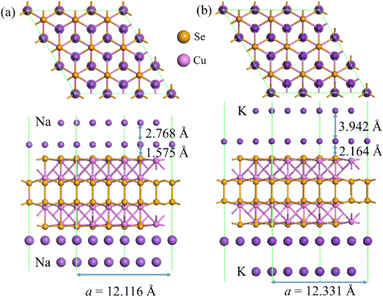 | ||
| Fig. 12 Adsorption geometries of bilayer adsorption of (a) Na and (b) K on both sides of the 3 × 3 × 1 Cu4Se4 supercell at 0 K. | ||
One can see from Fig. 11 that the Cu4Se4 nanosheet has a relatively large OCV (typically around 0.5–1.8 for SIBs and 0.5–2.4 for PIBs). These OCV values are comparable to the experimental results (0.5–1.9 V for SIBs and 0.3–2.7 V for PIBs) of the nanosheet-assembled CuSe crystal pillar reported by Lin et al.39 in the similar intercalation structures and concentrations. Furthermore, the Cu4Se4 nanosheet has several advantages as an electrode material. These include the metal-like electrical conductivity and accelerating electron transfer kinetics, and excellent mechanic properties which could retain the in-plane structures during the charge/discharge cycles. Compared to CuSe nanoparticles or crystal pillar, the irreversible conversion reactions were avoided during Na/K intercalation and de-intercalation on the Cu4Se4 nanosheet, resulting in a good reversible capacity, high-rate performance, high cycle stability and low polarization.
3.5. Influence of proton intercalation
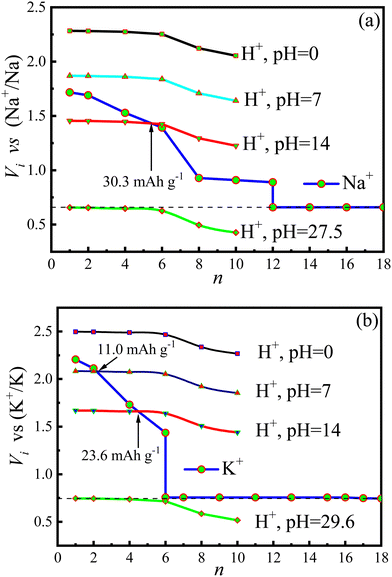
Considering the advantages of aqueous metal-ion batteries, we have evaluated the applicability of the Cu4Se4 nanosheet working in an aqueous electrolyte. The critical challenge is that protons, which are generated from water dissociation, deform the electrode structures through intercalation. Therefore, we calculated proton intercalation onto the Cu4Se4 nanosheet. And the obtained proton adsorption configurations can be found in Fig. S22–S26 (ESI†). We found that ten protons can be adsorbed on both sides of the Cu4Se4 nanosheet without deformation of the basic skeleton structure. However, when the intercalated proton number exceeds ten, the skeleton structure of the Cu4Se4 nanosheet is deformed seriously and tends toward a structure with the space group Cm (see Fig. S24d, ESI†). At last, the fully proton-intercalated Cu4Se4 nanosheet becomes a structure with the space group Cm (see Fig. S26, ESI†). On that basis, we identified the competitive intercalation between the Na/K adatom and proton in the case of an intercalated proton number n ≤ 10.The voltage (Vi) as a function of the intercalated ion number is demonstrated in Fig. 13. The voltages of protons (VH+) in Fig. 13a and b have been transformed to the corresponding reference potentials on the basis of the SIBs and PIBs, respectively. From the figure one can see that the proton voltages are strongly dependent on the pH values of electrolyte. In an acidic electrolyte (pH = 0), VH+ is higher than both VNa+ and Vk+, inferring that proton has the priority to intercalate onto the surfaces of the Cu4Se4 nanosheet. In contrast, an alkaline electrolyte (pH = 14) is able to weaken proton intercalation and makes VH+ lower than both VNa+ and VK+ at low intercalation concentrations. The aqueous SIBs and PIBs can be operated in the alkaline electrolyte (pH = 14) but the capacity reduces to 30.3 and 23.6 mA h g−1, respectively. Furthermore, it is extremely limited in improving the capacity of Cu4Se4 nanosheet based aqueous SIBs and PIBs by increasing the working ion concentration in aqueous electrolyte. To keep the batteries working with the maximum capacities, the aqueous SIBs and PIBs based on the Cu4Se4 nanosheet electrode should be operated using electrolytes with pH values of 27.5 and 29.6, respectively. Only organic electrolytes can achieve such large pH values. It is predicted that the Cu4Se4 nanosheet will reach its maximum capacity in an organic electrolyte.
4. Conclusions
The stability and electrochemical properties of sodium, potassium and proton intercalation on the Cu4Se4 nanosheet have been explored via DFT and AIMD simulations. It was found that the Na/K-intercalations are accompanied by a surface phase transition, resulting in a plateau in the intercalation voltage curves in the two-phase coexistence region. The two-surface phase coexistence for potassium is located at a lower ion concentration region that that for sodium. Meanwhile, the relatively low migration barriers of sodium and potassium atoms indicate fast kinetics during the charge/discharge process. The Cu4Se4 nanosheet electrode maintains its metallic character and little lattice parameter changes (within 4.66%) during the whole charge/discharge process. The full Na/K bilayer adsorption ensures a Na/K storage capacity of up to 188.07 mA h g−1. All these outstanding electrochemical properties guarantee that the Cu4Se4 nanosheet could be of great importance for the practical design and application in SIBs and PIBs.Proton intercalation on the Cu4Se4 nanosheet was also investigated in order to trace the usability to aqueous batteries. The structural stability of proton intercalated systems was obtained only at low coverage (i.e., for HxCu4Se4 with x ≤ 10/9). It was demonstrated that the proton intercalation voltage depends strongly on the pH values of electrolyte. Aqueous SIBs and PIBs can be operated in strong alkaline electrolyte (pH ≥ 14) but as low as 12–16% of the maximum specific capacity could be retained. Our work provides a quick and effective identification method for applicability of electrode materials in aqueous batteries.
Conflicts of interest
The author declares no competing financial interest.Acknowledgements
The financial support from the National Natural Science Foundation of China (grant no. 22178193) is greatly appreciated.References
- J. J. Xu, X. Y. Cai, S. M. Cai, Y. X. Shao, C. Hu, S. R. Lu and S. J. Ding, Energy Environ. Mater., 2023, 6, e12450 CrossRef CAS.
- K. Kubota, M. Gahbi, T. Hosaka, S. Kumakura and S. Komaba, Chem. Rec., 2018, 18, 459–479 CrossRef CAS PubMed.
- A. Buldum and G. Tetiker, J. Appl. Phys., 2013, 113, 154312 CrossRef.
- J.-H. Li, J. Wu and Y.-X. Yu, J. Phys. Chem. C, 2021, 125, 3725–3732 CrossRef CAS.
- H. Z. Lin, J. Y. Liu, M. L. Li, N. Chen, W. Xuan, L. N. Liu, S. Y. Yao and F. Du, ACS Appl. Mater. Interfaces, 2021, 13, 58763–58770 CrossRef CAS PubMed.
- Y.-X. Yu, Appl. Surf. Sci., 2021, 546, 149062 CrossRef CAS.
- J.-H. Li, J. Wu and Y.-X. Yu, J. Mater. Chem. A, 2021, 9, 10186–10198 RSC.
- D. Mikhailova, M. V. Gorbunov, H. B. A. Nguyen, B. Pohle, S. Maletti and C. Heubner, J. Mater. Chem. A, 2022, 11, 187–204 RSC.
- T. Zhang, M. Sotoudeh, A. Gross, R. M. McMeeking and M. Kamlah, J. Power Sources, 2023, 565, 232902 CrossRef CAS.
- X. Lamprecht, F. Speck, P. Marzak, S. Cherevko and A. S. Bandarenka, ACS Appl. Mater. Interfaces, 2022, 14, 3515–3525 CrossRef CAS PubMed.
- Q. G. Pan, Z. P. Tong, Y. Q. Su, S. Qin and Y. B. Tang, Adv. Funct. Mater., 2021, 31, 2103912 CrossRef CAS.
- Z. H. Pan, X. H. Zhang, S. T. Xu, M. Z. Gu, X. H. Rui and X. J. Zhang, J. Mater. Chem. A, 2023, 11, 4102–4110 RSC.
- Y.-X. Yu, J. Phys. Chem. C, 2016, 120, 5288–5296 CrossRef CAS.
- R. A. Soomro, P. Zhang, B. M. Fan, Y. Wei and B. Xu, Nano-Micro Lett., 2023, 15, 108 CrossRef CAS PubMed.
- C. Z. Zhang, F. Wang, F. Han, H. Wu, G. H. Zhang and J. S. Liu, Adv. Mater. Interfaces, 2020, 7, 2000486 CrossRef CAS.
- G. V. Vajenine and R. Hoffmann, Inorg. Chem., 1996, 45, 451–457 CrossRef PubMed.
- J. M. Hodges, Y. Xia, C. D. Malliakas, T. J. Slade, C. Wolverton and M. G. Kanatzidis, Chem. Mater., 2020, 32, 10146–10154 CrossRef CAS.
- H. J. Chen, J. N. B. Rodrigues, A. J. E. Rettie, T.-B. Song, D. G. Chica, X. L. Su, J.-K. Bao, D. Y. Chung, W.-K. Kwok, L. K. Wagner and M. G. Kanatzidis, J. Am. Chem. Soc., 2019, 141, 635–642 CrossRef CAS PubMed.
- V. Milman, Acta Crystallogr., Sect. B: Struct. Sci., 2002, 59, 437 CrossRef PubMed.
- W. Li, J. R. Dahn and D. S. Wainwright, Science, 1994, 264, 1115–1118 CrossRef CAS PubMed.
- B. Delley, J. Phys. Chem., 1996, 100, 6107–6110 CrossRef CAS.
- B. Delley, J. Chem. Phys., 2000, 113, 7756–7764 CrossRef CAS.
- J. P. Perdew, K. Burke and M. Ernzerhof, Phys. Rev. Lett., 1996, 77, 3865–3868 CrossRef CAS PubMed.
- S. Grimme, J. Comput. Chem., 2004, 25, 1463–1473 CrossRef CAS PubMed.
- Y. F. Mo, S. P. Ong and G. Ceder, Chem. Mater., 2012, 24, 15–17 CrossRef CAS.
- Y.-X. Yu, ACS Appl. Mater. Interfaces, 2014, 6, 16267–16275 CrossRef CAS PubMed.
- B. Delley, Mol. Simul., 2006, 32, 117–123 CrossRef CAS.
- Y.-X. Yu, ACS Appl. Energy Mater., 2023, 6, 10048–10060 CrossRef CAS.
- R. Zacharia, H. Ulbricht and T. Hertel, Phys. Rev. B: Condens. Matter Mater. Phys., 2004, 69, 155406 CrossRef.
- A. K. Singh, K. Mathew, H. L. Zhuang and R. G. Hennig, J. Phys. Chem. Lett., 2015, 6, 1087–1098 CrossRef CAS PubMed.
- J. Peng, J. J. Wu, X. T. Li, Y. Zhou, Z. Yu, Y. Q. Guo, J. C. Wu, Y. Lin, Z. J. Li, X. J. Wu, C. Z. Wu and Y. Xie, J. Am. Chem. Soc., 2017, 139, 9019–9025 CrossRef CAS PubMed.
- S. Stolen, H. Fjellvag, F. Gronvold, J. T. Sipowska and E. F. Westrum, J. Chem. Thermodyn., 1996, 28, 753–766 CrossRef.
- Y. Wang and Y. Li, J. Mater. Chem. A, 2020, 8, 4274–4282 RSC.
- B. Pandit, S. R. Rondiya, S. F. Shaikh, M. Ubaidullah, R. Amaral, N. Y. Dzade, E. S. Goda, A. S. Rana, H. S. Gill and T. Ahmad, J. Colloid Interface Sci., 2022, 633, 886–896 CrossRef PubMed.
- A. van de Walle, M. Asta and G. Ceder, Calphad, 2002, 26, 539–553 CrossRef CAS.
- F. Zhou, T. Maxisch and G. Ceder, Phys. Rev. Lett., 2006, 97, 155704 CrossRef PubMed.
- M. Mortazavi, C. Wang, J. Deng, V. B. Shenoy and N. V. Medhekar, J. Power Sources, 2014, 268, 279–286 CrossRef CAS.
- H. Kawano, Prog. Surf. Sci., 2022, 97, 100583 CrossRef CAS.
- H. Z. Lin, M. L. Li, X. Yang, D. X. Yu, Y. Zeng, C. Z. Wang, G. Chen and F. Du, Adv. Energy Mater., 2019, 9, 1900323 CrossRef.
Footnote |
| † Electronic supplementary information (ESI) available. See DOI: https://doi.org/10.1039/d3cp05423c |
| This journal is © the Owner Societies 2024 |

