 Open Access Article
Creative Commons Attribution 3.0 Unported Licence
Penetrant-induced plasticization in microporous polymer membranes
Katherine
Mizrahi Rodriguez†
 a,
Sharon
Lin†
 b,
Albert X.
Wu
 b,
Kayla R.
Storme
c,
Taigyu
Joo
 b,
Aristotle F.
Grosz
b,
Naksha
Roy
b,
Aristotle F.
Grosz
b,
Naksha
Roy
 b,
Duha
Syar
b,
Francesco M.
Benedetti
b,
Duha
Syar
b,
Francesco M.
Benedetti
 b and
Zachary P.
Smith
 *b
*b
aDepartment of Materials Science and Engineering, Massachusetts Institute of Technology, Cambridge, MA 02139, USA
bDepartment of Chemical Engineering, Massachusetts Institute of Technology, Cambridge, MA 02139, USA. E-mail: zpsmith@mit.edu
cDepartment of Chemistry, Massachusetts Institute of Technology, Cambridge, MA 02139, USA
First published on 31st January 2024
Abstract
Penetrant-induced plasticization has prevented the industrial deployment of many polymers for membrane-based gas separations. With the advent of microporous polymers, new structural design features and unprecedented property sets are now accessible under controlled laboratory conditions, but property sets can often deteriorate due to plasticization. Therefore, a critical understanding of the origins of plasticization in microporous polymers and the development of strategies to mitigate this effect are needed to advance this area of research. Herein, an integrative discussion is provided on seminal plasticization theory and gas transport models, and these theories and models are compared to an exhaustive database of plasticization characteristics of microporous polymers. Correlations between specific polymer properties and plasticization behavior are presented, including analyses of plasticization pressures from pure-gas permeation tests and mixed-gas permeation tests for pure polymers and composite films. Finally, an evaluation of common and current state-of-the-art strategies to mitigate plasticization is provided along with suggestions for future directions of fundamental and applied research on the topic.
1. Introduction
Separations of gas and vapor mixtures play a significant role in many chemical processes.1 To meet these demands, various unit operations can be used, but distillation is by far the most common. In fact, there are over 40![[thin space (1/6-em)]](https://www.rsc.org/images/entities/char_2009.gif) 000 distillation columns in the United States, which is a testament to their versatility.2 Distillation can operate over a wide range of pressures from 0.14 bar (e.g., ethylbenzene/styrene) to nearly 21 bar (e.g., propylene/propane) and is capable of separating feeds with high volumetric flowrates and various components that cover a range of relative volatilities from only 1.17 (o-xylene/m-xylene) to 81.2 (water/ethylene glycol).2 Distillation provides a convenient and time-tested solution to separate a diversity of chemicals in a continuous manner with high purity.
000 distillation columns in the United States, which is a testament to their versatility.2 Distillation can operate over a wide range of pressures from 0.14 bar (e.g., ethylbenzene/styrene) to nearly 21 bar (e.g., propylene/propane) and is capable of separating feeds with high volumetric flowrates and various components that cover a range of relative volatilities from only 1.17 (o-xylene/m-xylene) to 81.2 (water/ethylene glycol).2 Distillation provides a convenient and time-tested solution to separate a diversity of chemicals in a continuous manner with high purity.
However, distillation has an enormous environmental footprint, resulting in the consumption of approximately 25% of all industrial energy use.3 The key issue is that distillation operates based on phase changes, and this separation mechanism requires vast energy inputs. In 2021, the industrial sector consumed approximately 55% of energy use worldwide. In the United States, industrial energy consumption was fractionally smaller, but still substantial at 24% of total energy consumption.4 These percentages are projected to increase in coming years.5,6 In addition, the heat required to power thermally-driven separations often comes from natural gas and petroleum. For this reason, thermally-driven separations in the industrial sector in the United States produce about 20% of total carbon dioxide emissions.6 This number is projected to increase to 25% by 2050.6
As such, engineers and scientists have worked to find alternative technologies that achieve similar separation performance while simultaneously offering energy efficiency. Pressure swing adsorption (PSA) and thermal swing adsorption (TSA) are commonly practiced in industry, but they operate in a semi-continuous fashion, requiring pressurization–depressurization cycles that increase operational complexity. Absorption processes, like amine absorption, are another alternative. However, absorbents can degrade, thereby requiring a reclaimer to address contaminant buildup and volatility issues.7,8
The use of membranes provides an alternative separation strategy that avoids these limitations. Compared to other separation techniques, membrane-based separations offer reduced indirect CO2 emissions, modularity, low cost, and a continuous operation, while avoiding the need for toxic absorbents.9 If such non-thermally driven technology was adopted by the petroleum, chemical, and paper manufacturing industries, it is estimated that 100 million tons of CO2 emissions could be eliminated and 4 billion USD in energy savings could be recovered annually in the United States alone.3
Membrane-based gas separations have been implemented commercially in a wide range of applications such as hydrogen recovery, nitrogen and oxygen production, natural gas treatment, vapor recovery, and hydrocarbon separations.7,10 The gas separations market expanded from 0.150 billion USD in 2002 to approximately 1.5 billion USD in 2017, and it is projected to reach 2.61 billion USD by 2022.10–12 While this market growth indicates that membrane-based gas separations have successfully emerged as a promising platform technology, the technique still has significant limitations relative to conventional unit operations. Notably, a considerable number of studies have shown upper bound trade-off relationships between permeability and selectivity for membranes.13–18 From a materials perspective, permeability and selectivity property sets need to be improved under realistic conditions to displace legacy separation processes, and these efforts remain a primary barrier for deploying membrane technology.19–24
Polymers of intrinsic microporosity (PIMs) contain persistent intrinsic micropores smaller than 2 nm and have gained significant interest in the field.25,26 For example, PIM-1—the first microporous ladder polymer studied for gas separations—contains a ladder-type backbone that hinders chain rotation and a spirobisindane moiety that contorts polymer chains and introduces configurational free volume.25,26 Such features lead to high permeability while maintaining moderate selectivity. So far, many sub-classes of PIMs, including PIM-polyimides,27,28 Tröger's base PIMs,28–33 and triptycene-based PIMs,28,29,34 among others,35–39 have been developed with exceptional upper bound performance. Despite these many advancements, the operational stability of PIMs is still a key challenge. Of note, stability issues frequently manifest themselves in the form of physical aging and plasticization. Physical aging is the prolonged temporal relaxation of all solid-state non-equilibrium glassy polymers. More precisely, the specific volume of a polymer decreases as subtle macromolecular motions kinetically drive the polymer packing structure into a denser, lower energy state. This phenomenon results in decreased permeability.10,40,41 On the other hand, plasticization results in the increase of polymer chain translational motion in the presence of strongly sorbing gases resulting in decreased size-sieving ability and increased gas flux.42 Physical aging rates and plasticization generally increase with decreasing membrane thickness, making these phenomena especially challenging to control for industrial applications.43–47 Thus, stability remains a major hindrance for industries to implement membranes as their primary separation technique.
Developing a fundamental understanding of plasticization is critical to further advance membranes as a platform technology for energy-efficient gas separations. Strong plasticization resistance is required in many industrial separation processes, especially those involving highly condensable gases and vapors. For example, natural gas treatment constitutes a large portion of the current gas separation market. However, gas wells frequently reach pressures exceeding 50 bar and contain high levels of known plasticizers, including CO2 and H2S.48,49 Membranes for olefin/paraffin separations, such as ethylene/ethane and propylene/propane, are also susceptible to plasticization since these industrial gas feeds are usually at 8–11 bar and at temperatures that result in high gas-phase activities.11 Under these aggressive operating conditions, plasticization often leads to a substantial deterioration in gas selectivity.11,50,51
In addition to existing applications, there are many emerging applications for membranes beyond olefin/paraffin separations, but membrane materials need improved performance and stability to address these potential markets. For example, hydrogen recovery from steam methane reforming, in which CO2 is separated from syngas after a water–gas shift reaction, is known to be economically more favorable when the separation is performed at high reactor effluent pressures (usually about 50 bar).52,53 Vapor separations like dehydration of organic solvents are also attractive applications for membranes due to difficulties in separating azeotropic mixtures using traditional methods like distillation. However, strong interactions between polymers and penetrants like water and ethanol can plasticize membranes, causing reduced overall diffusion selectivity.54–56 To address plasticization issues in many of these industrial processes, various methods have been developed to reduce chain mobility in polymers, and thus, increase resistance toward plasticization. Some common approaches include crosslinking, increasing chain interactions through polymer functionalization, adding fillers, blending, grafting, and UV or thermal treatments.57
While the concept of penetrant-induced plasticization in polymers has been recognized since the earliest days of the polymer field and its appreciation in membrane applications can date back to at least the 1960s,58–60 developing a fundamental understanding of this phenomena for emerging materials is still an evolving theme in the literature. The timeline in Fig. 1 shows some of the major efforts and studies that have contributed to the understanding of penetrant-induced plasticization behavior for membrane materials. These are summarized in more detail in Table 1. Interestingly, early research efforts coincided closely with the first commercialization efforts of gas separation membranes in the late 1970s.61 Beginning in the 1980s, many membrane researchers made efforts to develop a fundamental understanding of penetrant-induced plasticization effects, especially by studying how changes in membrane transport relate to polymer mobility and chain dynamics. Based on these early studies, the general approach in recent years has transitioned to developing mitigation strategies, which have been bolstered by computational modeling and the synthesis and design of new types of plasticization-resistant polymers. Of note, a significant effort has been placed on studying the effects of plasticization on new, high-performance membrane materials.
 | ||
| Fig. 1 Abridged timeline highlighting some major studies on penetrant-induced plasticization behavior in the membrane field.28,39,45–47,61–91 | ||
| Year | Author | Highlights | Ref. | # of citations |
|---|---|---|---|---|
| 1978 | Koros | Observed hysteresis in sorption following high-pressure CO2 exposure in semi-crystalline glassy polymer | 61 | 244 |
| 1979 | Wonders | Observed membrane transport property changes after high-pressure CO2 exposure in glassy polymer | 62 | 169 |
| 1983 | Chern | Membrane materials with high Tg and rigid backbone structure will be more plasticization resistant | 63 | 124 |
| 1985 | Chiou | Suppression of Tg at high CO2 pressure | 64 | 304 |
| 1986 | Fleming | Glassy polymers show a markedly different response to external CO2 pressure compared to rubbery polymers | 65 | 271 |
| 1988 | Sanders | Plasticization of glassy polymer, indicated by sorption kinetics and Tg depression, does not necessarily increase permeability with higher CO2 feed pressure | 66 | 159 |
| 1989 | Zhou | Examination of plasticization effects using dual-mode sorption model with partial immobilization | 67 | 53 |
| 1989 | Puleo | High CO2 sorption swells cellulose acetate matrix, which disrupts interchain interactions and increases Langmuir sorption capacity | 68 | 239 |
| 1990 | Smith | Dissolved CO2 enhances penetrant mobility in glassy polymers | 69 | 20 |
| 1990 | Fleming | Comparison of hysteresis behavior of sorption and volume dilation at high CO2 pressure implies that polymers with high initial swelling exhibit more pronounced history-dependent behavior | 70 | 32 |
| 1991 | Chern | Glassy polymers with high Tg can still show a large plasticization effect | 71 | 20 |
| 1991 | Wessling | Sorption kinetics and dilation kinetics are different | 72 | 155 |
| 1992 | Petropoulos | Development of a model to describe the effect of plasticization on gas permeation | 73 | 21 |
| 1992 | Houde | Increase in CO2 permeability with pressure is caused by increased intersegmental spacing under high CO2 pressure | 74 | 51 |
| 1995 | Wessling | A new experimental method and model to study sorption induced dilation kinetics | 75 | 46 |
| 1998 | Bos | Stabilization of plasticization by high temperature thermal treatment | 76 | 275 |
| 1999 | Bos | Polymers under study plasticized at the same critical CO2 concentration of 36 ± 7 cm(STP)3 cm−3 | 42 | 461 |
| 1999 | Staudt-Bickel | Incorporation of polar groups and crosslinks can reduce plasticization effect | 78 | 349 |
| 2001 | Wessling | Plasticization effects are more pronounced for sub-micron thick polyimide films | 45 | 104 |
| 2002 | Wind | Diol chemical crosslinking strategy to mitigate plasticization | 79 | 233 |
| 2003 | Wind | Thermal annealing and covalent cross-linking reduce polymer swelling at high CO2 feed pressures | 80 | 154 |
| 2003 | Wind | Mitigation of plasticization by chemically crosslinking with various diol crosslinker sizes | 81 | 160 |
| 2003 | Wind | Thermal annealing and diol crosslinking to mitigate plasticization in gas mixtures | 82 | 318 |
| 2004 | Bos | Blending a less plasticizable polymer with a highly plasticizable polymer can suppress plasticization | 83 | 137 |
| 2005 | Visser | Introducing an inert gas to CO2 feed suppresses plasticization through competitive sorption | 84 | 129 |
| 2006 | Lin | When diffusion selectivity is undesired, strong plasticization can be beneficial to separation performance | 85 | 684 |
| 2007 | Visser | Polymers require different levels of CO2 concentrations to reach the plasticization point | 86 | 157 |
| 2007 | Visser | Any gas can exhibit non-Fickian diffusion and induce irreversible sorption relaxations once a critical level of volume dilation is reached | 87 | 71 |
| 2011 | Horn | The competing effects between plasticization and aging is balanced, with physical aging predominating in polymers with less CO2 sorption | 46 | 41 |
| 2011 | Qiu | Sub-Tg thermal crosslinking of copolyimide to mitigate plasticization | 88 | 217 |
| 2012 | Horn | Plasticization effects in glassy polymers depend on film thickness, especially for sub-micron thick films | 47 | 65 |
| 2013 | Minelli | Use of the Non-Equilibrium Lattice Fluid (NELF) model to predict permeability with plasticization effect | 89 | 75 |
| 2014 | Swaidan | Not only intrachain rigidity but also a balance between interchain rigidity and interchain spacing is important for reducing plasticization in PIMs | 90 | 87 |
| 2015 | Swaidan | Intrachain rigidity, crucial to PIM designs, does not solely mitigate plasticization | 28 | 232 |
| 2015 | Tiwari | Glassy perfluorinated polymers show higher plasticization resistance compared to other glassy polymers | 91 | 46 |
| 2019 | He | Development of exceptionally high plasticization resistant materials can be achieved using ladder side chains on flexible backbones | 39 | 51 |
Plasticization has been a focus of many experimental studies, but there are few reviews on this topic.49,57,92–99 Hence, this review focuses on plasticization studies in the membrane field with a particular emphasis on new microporous polymer membranes and experimental techniques used to mitigate these effects. It should be noted that there are some limited examples where plasticization is beneficial for a separation. These examples are briefly discussed in Section 5.1.4.85,100 However, this review primarily focuses on applications where it is undesirable. Section 2 of this review describes gas transport theory in microporous polymer membranes, as well as penetrant properties and their relationship to plasticization. Section 3 describes polymer chain mobility and translational cooperativity, their relation to plasticization, and methods to measure these parameters, while Section 4 discusses plasticization mitigation strategies in more detail. Section 5 reviews and discusses all plasticization data for microporous polymers that have been recorded to date, highlighting the best-performing polymers and discussing common characteristics that lead to enhanced plasticization resistance. Finally, Section 6 summarizes the current research progress and future directions for the understanding and development of microporous polymers that are plasticization-resistant.
2. Gas transport and plasticization phenomena
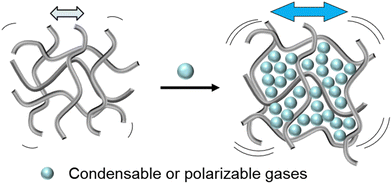
Glassy polymers are viscous metastable solids.101,102 Over time, contractive forces drive these non-equilibrium materials to a lower energy state, resulting in polymer chain reorganization to form denser polymer structures.103–105 Viewed another way, excess free volume in glassy polymers can be envisioned as a fluid trapped in a viscous polymer solid, which “bubbles” to the surface of a polymer film, analogously resulting in a denser polymer structure over time.106,107 Regardless of the physical picture, polymer chains are constantly in motion and intimately influenced by free volume.108Plasticization is broadly defined as the increase in polymer chain mobility in the presence of condensable diluents.10,109–111 Thus, this phenomenon correlates directly with a lowering of the glass transition temperature of the polymer.112–114 In the gas separations field, plasticization often refers to the observation of increased permeability when a polymer is subjected to high concentrations of certain gases (Fig. 2).7,64,72 The increase in permeability is not necessarily a result of increased free volume, but instead, lower activation energies of diffusion.72 Therefore, plasticization is often more severe for larger gases because these gases benefit more significantly from reduced activation energies and show more significant increases in stochastic diffusive jump steps.72,115 This section provides a short summary of (1) common penetrant properties, (2) transport metrics and models used to understand polymer–gas interactions and plasticization, and (3) common tests and principles used to evaluate plasticization in polymers.
2.1. Penetrant properties and their relation to plasticization
Heuristically, plasticization of polymer membranes correlates with condensability or polarizability of penetrants in a mixture. The more strongly sorbing the penetrant, the higher the expected degree of plasticization. Because this phenomenon relates to the interactions between polymer and penetrant, certain thermodynamic lattice models such as the Flory–Huggins, Sanchez-Lacombe, and non-equilibrium lattice fluid (NELF) are particularly useful for quantifying interactions in polymer systems. In the case of rubbery polymers without the consideration of unoccupied free volume, the Flory–Huggins model can be used to describe the activity of the penetrant as a function of penetrant volume fraction:116 | (1) |
 | (2) |
 | (3) |
Since the heat of vaporization of a polymer cannot be found experimentally, an alternative method of finding the solubility parameter of polymers is as follows:122
 | (4) |
In the context of plasticization, as interactions between the polymer and gas increase, the activity of the gas in the matrix will likewise increase, making the polymer–gas system more susceptible to plasticization. Such trends also apply in more complex models of polymer systems that include free volume, such as Sanchez–Lacombe and NELF, as will be discussed later in this section.
Several properties that correlate with gas sorption of common gases relevant for membrane separations are tabulated in Table 2.124 Generally, larger penetrants have higher sorption in polymers,125 but there are notable exceptions for highly polarizable gases such as CO2, H2S, and H2O, among others. Penetrants with higher gas–polymer interactions are more likely to induce plasticization.
| Gas | Critical temperature129 (K) | Critical volume113,129 (cm3 mol−1) | Kinetic diameter130 (Å) | Lennard-Jones well depth131–133 (K) | |
|---|---|---|---|---|---|
| No plasticization expected | He | 5.19 | 57.3 | 2.551 | 10.2 |
| H2 | 33.2 | 64.9 | 2.89 | 59.7 | |
| Ne | 44.4 | 41.7 | 2.82 | 33.9 | |
| N2 | 126.2 | 89.3 | 3.64 | 71.4 | |
| CO | 134.5 | 90.1 | 3.76 | 91.7 | |
| Ar | 150.9 | 74.57 | 3.542 | 116.8 | |
| O2 | 154.6 | 73.5 | 3.46 | 106.7 | |
| CH4 | 190.6 | 98.6 | 3.8 | 148.6 | |
| Kr | 209.4 | 91.2 | 3.655 | 162.6 | |
| Plasticization observed | C2H4 | 282.5 | 131.1 | 3.9 | 224.7 |
| Xe | 289.7 | 118 | 4.047 | 226.1 | |
| CO2 | 304.2 | 91.9 | 3.3 | 195.2 | |
| C2H6 | 305.3 | 147 | 4.443 | 215.7 | |
| C3H6 | 365.2 | 184.6 | 4.5 | 298.9 | |
| C3H8 | 369.9 | 200 | 4.3 | 237.1 | |
| H2S | 373.3 | 87.7 | 3.6 | 301.1 | |
| i-C4H10 | 407.7 | 259 | 5 | 330.1 | |
| n-C4H10 | 426 | 255 | 4.3 | 531.4 | |
| SO2 | 430.3 | 122.2 | 3.6 | — | |
| H2O | 647 | 55.9 | 2.65 | 809.1 | |
2.2. Transport theory for gas separation membranes
Permeability and selectivity are the two primary material properties to evaluate membrane performance. Permeability (P) is defined as: | (5) |
| P = DS | (6) |
The ideal selectivity for a binary mixture is defined as the ratio of the pure-gas permeability of the more permeable gas to that of the less permeable gas. Using the sorption–diffusion model, selectivity can be written as the product of the diffusion and sorption selectivities:
 | (7) |
 | (8) |
Diffusion selectivity and sorption selectivity highlight primary metrics by which separation performance can be improved. Increases in diffusion selectivity are commonly targeted by forming polymers with denser packing structures. Increases in sorption selectivity are commonly targeted through incorporation of functional groups with strong gas affinity, such as amine or carboxylic acid groups for CO2.38,137–139
Because permeability is the product of diffusion and sorption, it is important to evaluate both of these terms to elucidate structure–property behavior, especially for understanding plasticization. We begin by first considering gas sorption. One of the most widely used models to describe sorption in glassy polymers is the dual mode sorption (DMS) model,140,141 where the pressure dependence of penetrant concentration (C, cmSTP3 cmpol−3) in a polymer is the sum of sorption into Henry and Langmuir modes:
 | (9) |
 is the Langmuir capacity constant (cmSTP3 cmpol−3), and b is the Langmuir affinity constant (atm−1). This phenomenological model is particularly helpful for understanding plasticization in glassy polymers because it envisions sorption as occurring in hypothetical equilibrium and non-equilibrium domains. For a polymer above its Tg (i.e., in its rubbery state), the linear portion of the DMS model is often sufficient for describing sorption in a polymer without volume dilation. For a polymer below its Tg (i.e., in its glassy state), a second population of sorption (the Langmuir mode) accounts for excess sorption into non-equilibrium free volume. Koros extended the DMS model to mixtures, where competitive sorption effects are captured via a combined Langmuir sorption term for a binary i–j system:141,142
 | (10) |
The DMS model has also been extended to envision hypothetical and discrete modes of diffusion through what is known as the partial immobilization model. This model asserts that each sorption “mode” contributes its own diffusivity. “Partial immobility” refers to the theory that penetrant molecules sorbed in the Langmuir mode are partially immobile and therefore have some contribution to the overall permeation, whereas the remainder of diffusing molecules belonging to the Henry's mode are fully mobile.144,145 In its initial conception, the partial immobilization model did not address the effects of plasticization, by virtue of considering D as invariant with respect to penetrant concentration.144 Addressing plasticization via the partial immobilization model became possible when extended by Stern and Saxena, who implemented D as an exponential function of penetrant concentration.146 Zhou and Stern extend the model further by describing each of the aforementioned modes’ diffusivities as their own individual exponential function, in order to demonstrate the effects of plasticization on mass transport in a single mode.67 Other studies demonstrate a clear dependency between diffusivity and free volume:147
 | (11) |
More rigorous models have also been developed to quantitatively describe and predict the sorption of gases in glassy polymers. Specifically, the Flory–Huggins116 and Sanchez–Lacombe148 lattice fluid framework was extended by Doghieri and Sarti for glassy polymers104,149 using the so-called non-equilibrium lattice fluid (NELF) model, which is capable of reproducing isotherms under relevant mixture conditions using one fitted binary interaction parameter determined from pure-gas measurements.150,151 Of note, the NELF model can account for plasticization effects through incorporation of a swelling parameter that describes the change in polymer density (ρ) as a function of penetrant pressure:
| ρ = ρ0(1 − kswp) | (12) |
2.3. Effect of penetrant-induced plasticization on gas transport
Penetrant concentration inside a polymer membrane is proportional to feed pressure, so increasing pressure can exacerbate plasticization effects. A commonly used approach to evaluate plasticization in a polymer membrane is a high-pressure pure-gas permeation test, in which gas permeability is monitored while increasing upstream pressure in a stepwise fashion.28,66,82,152 These pressure steps are held for a pre-determined time that is sufficiently above the expected time-lag of the gas. However, because the time scale for diffusion and the time scale for plasticization are vastly different, the results of these high-pressure tests will be highly dependent on the length of the hold time set at each pressure step.66,153–155 Standard methods to run these tests involve using the same hold time for all pressures or, alternatively, running each pressure point until some metric of steady state has been achieved, such as tracking time intervals when the variation in permeation is <1%.156 In all cases, plasticization phenomena (e.g., the plasticization pressure) will be highly dependent on the experimental procedure, making it difficult to compare performance across samples from different studies. As such, reporting hold times is needed to gain a deeper understanding of plasticization kinetics and behavior.Permeability isotherms have a dependence on pressure.89 Representative isotherms for glassy polymers are illustrated in Fig. 3, including those for the following cases:
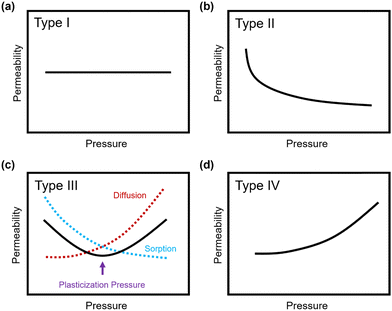 | ||
| Fig. 3 Illustration of 4 different cases of permeability trends for glassy polymers,89 in which the penetrants are: (a) non-plasticizing with low sorption, (b) non-plasticizing with moderate sorption, (c) highly-sorbing, where the permeability dependence initially decreases with increasing pressure due to saturation of the Langmuir mode, followed by increasing permeability at higher pressures due to enhanced diffusion, and (d) highly plasticizing with very high sorption. (c) also depicts the plasticization pressure as the point at which the increase in diffusion overtakes the decrease in sorption. | ||
Type I: non-plasticizing penetrants that have low sorption
Type II: non-plasticizing penetrants that have moderate sorption, which can saturate the Langmuir mode
Type III: highly-sorbing penetrants, where the permeability initially decreases due to sorption into the Langmuir mode before it increases at higher pressure due to plasticization
Type IV: highly plasticizing penetrants that have very high sorption, inducing a significant plasticization effect in the polymer matrix even at low pressures
Of note, Type IV is equivalent to the plasticization behavior of rubbery polymers.157,158 When observed in traditional glassy polymers, this finding indicates that plasticization is severe and that the Tg of the polymer may have been suppressed below the testing temperature, thereby eliminating Langmuir sorption behavior. In the parlance of the membrane-based gas separation literature, plasticization during a pure-gas permeation test is often reported when permeability begins to rise with increasing feed pressure. The minimum value in permeability is the “plasticization pressure,” as shown in isotherm Fig. 3c.42,72 Fundamentally, the plasticization pressure results from an increase in the diffusivity of penetrants at high pressures, which exactly balances the decrease in sorption for glassy polymers.84,86 Beyond this pressure, increases in diffusivity dominate and permeability increases. However, the plasticization pressure alone does not provide any indication of the changes in gas selectivity or permeability of non-plasticization gases that would co-permeate in a real application. Therefore, pure-gas experiments are useful for screening fundamental plasticization behavior, but inadequate at predicting property sets under realistic conditions.
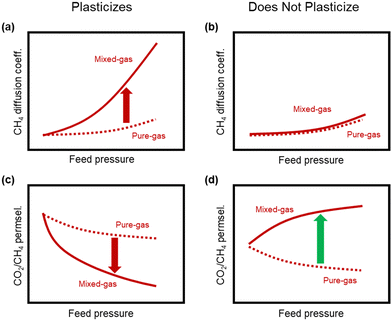
A more comprehensive approach to evaluating plasticization involves monitoring permeability isotherms during high-pressure mixed-gas experiments. These experiments can also be used to track emergent phenomena for co-permeating species, such as competitive sorption effects that are discussed in detail in Section 5.2. For mixed-gas experiments, the plasticization pressure is often reported as the onset of an increase in the permeability of the less permeable gas.28,159 To illustrate these effects, Fig. 4 presents transport metrics used to identify plasticization for a gas mixture of CO2 and CH4. In this case, the response of the less condensable penetrant (i.e., CH4) is an unambiguous indicator of plasticization. An increase in the diffusivity from the pure- to mixed-gas case (Fig. 4a) indicates plasticization, resulting in a concomitant decrease in diffusion selectivity, and frequently, in permselectivity for mixtures (Fig. 4c). Conversely, if the diffusivity of CH4 is largely unchanged between the pure- and mixed-gas cases (Fig. 4b), the permselectivity of the mixed-gas case will be higher than that of the pure-gas case due to competitive sorption (Fig. 4d).160 In this way, mixture testing can be used to decouple the role of competitive sorption and plasticization for gas separation membranes. In addition to laboratory experiments, molecular dynamics (MD) simulations can be used to understand the plasticization behavior of microporous polymers.161–164
In addition to pure- and mixed-gas permeation testing, permeation and sorption hysteresis curves are also used to examine the effect of plasticization and conditioning after a high-pressure test, as shown in Fig. 5.46,165–167 Because the free volume architecture of a polymer changes during plasticization, pressurization and depressurization steps can be compared to quantify the performance change after exposure to certain gases. Hysteresis tests for sorption have shown that sorption of penetrants can increase after polymer plasticization, as indicated by a higher equilibrium concentration of penetrant during depressurization steps.87 While the polymer structure can, over an extended period of time, return to its equilibrium state, plasticization effects often can be detrimental over the time scale relevant for industrial applications. In practice, membranes are operated continuously and can experience variability in feed compositions. Thus, the complex nature of plasticization and the variations in environmental conditions can result in pronounced effects over time during membrane operation.
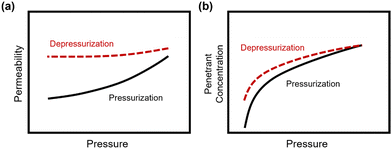 | ||
| Fig. 5 Hysteresis curves during pressurization and depressurization steps of (a) permeation and (b) sorption tests. | ||
It should also be noted that dimensional changes of polymers are rarely evaluated over identical testing conditions,72,87,168–170 and desorption from truly microporous materials requires more energy than sorption,171 so a multifaceted approach of considering hysteresis along with mixed-gas testing is best for evaluating details on plasticization and conditioning, and for identifying their relative contributions.72,172 By doing so, the net consequences of changes in permeability can be evaluated.82
3. Polymer chain cooperativity and its relation to plasticization
Section 2 discussed chemical and thermodynamic properties of gases and how parameters such as condensability and size can influence plasticization behavior. This section highlights the role of the polymer matrix and how polymer chain cooperativity relates to plasticization. Pertinent concepts including polymer chain cooperativity and the glass transition temperature (Tg) are reviewed, and a summary of characterization techniques commonly employed to understand relaxation phenomena in glassy polymers is provided.3.1. Polymer chain cooperativity and the glass transition temperature
As a polymer is cooled from its equilibrium rubbery state, it will experience an apparent continuous phase transition with respect to volume, entropy, and enthalpy. At temperatures below this transition, several important polymer characteristics become apparent, including decreased configurational entropy and the absence of cooperative polymer chain translation under relevant timescales.173–175 As the more liquid-like rubbery polymer transforms into a more solid-like glassy polymer, it becomes trapped in a meta-stable and hence, non-equilibrium state.175 While the origins of the Tg represent an active and ongoing topic of research and debate within the scientific community,175–177 the Tg is generally viewed as a pseudo-second-order phase transition of kinetic origin that is influenced by the processing and thermal history of the sample.173,174Because of their disordered nature in the solid-state, glassy polymers are characterized by the presence of localized domains with distinct chain dynamics. These domains experience molecular level fluctuations in conformation, a phenomenon termed dynamic heterogeneity.175,178 Chain cooperativity describes the collective motion of polymer segments as they spontaneously switch from one conformation to another in the glassy state.178 Above the Tg, large energy fluctuations lead to large-scale cooperative changes in the configuration of polymer chains that are observed as liquid-like flow. Due to dynamic heterogeneity, the Tg is often characterized by diverging relaxation times and broad or non-exponential response functions with respect to temperature when evaluating spectroscopic or relaxation experiments.178,179 Around the Tg, liquid-like flow is significantly minimized. Below the Tg, transient polymer chain dynamics can also allow for changes in the macroscopic packing structure, although these changes are significantly slowed and become dependent on nascent driving forces that develop during vitrification, such as those created by excess non-equilibrium free volume. Of particular relevance to this review, these macroscopic changes also depend on environmental stimuli (e.g., penetrant-induced plasticization).
1. Backbone rigidity. As backbone intrachain mobility decreases, the Tg typically increases. Polymers with aromatic backbones tend to have a higher Tg than polymers with flexible backbones such as those composed of single-bonded chains. Examples of high Tg structures include aromatic polyimides, polymers with fused-rings, and ladder polymers such as PIMs.
2. Side group rigidity. Polymers with rigid side chains that impede reorganization typically have a higher Tg than polymers with small or no sidechains. A classic example of this effect is the difference in Tg between polystyrene (Tg = 100 °C) and polyethylene (Tg = –125 °C). Conversely, addition of flexible side groups to rigid chains can result in a decreased Tg because flexible side chains can act as plasticizers. A classic example here is for the poly(methyl methacrylate) (PMMA), poly(ethyl methacrylate) (PEMA), and poly(propyl methacrylate) (PPMA) series, where Tg decreases from 105 °C for PMMA to 43 °C for PPMA, which corresponds to the increasing length of the flexible aliphatic side chain.
3. Intermolecular interactions. Interchain rigidity induced by strongly interacting backbones or side group chemistries results in higher glass transition temperatures than similar backbones without interacting chemistries. These intermolecular interactions (e.g., hydrogen bonding, π–π stacking, etc.) can reduce cooperative chain motion, and will be discussed in this review as a feature with promise for mitigating plasticization effects.
A summary of glass transition temperatures for select polymers including some commodity and commercial gas separation polymers are provided in Fig. 6, where the state of the polymer at room temperature is used to distinguish rubbery from glassy polymers. Among glassy polymers, the Tg of cellulose acetate is dependent on the degree of acetyl substitutions. For aromatic polyimides, the monomers selected for synthesis can yield glass transition temperatures ranging widely from 200–400 °C, where some polyimides are considered traditional glassy polymers and others are considered microporous and referred to as PIM-PIs. Microporous PIM-PIs have characteristic rigid and contorted backbone structures. The majority of the summarized glass transition temperatures in Fig. 6 were collected through standard experimental techniques such as differential scanning calorimetry (DSC) and dynamic mechanical analysis (DMA), which will be discussed in detail later in this section.
 | ||
| Fig. 6 Approximate values for the Tg of representative polymers including PDMS,108 butyl rubber,186 PS,186 PC,186 PSf,187 CA,68 PPO,186 polyimides,188 DMDPH-TB,185 PIM-1,184 PIM-EA-TB.185 For CA, cellulose diacetate is shown as the example. Polymers with glass transition temperatures below room temperature (RT, 25 °C) are considered rubbery, while those with glass transition temperatures above room temperature are considered glassy. Among glassy polymers, a line is drawn between examples of microporous polymers and traditional glassy polymers, where polyimides can be designated as traditional polyimides or microporous PIM-PIs, depending on the structure. | ||
For the past decade, chemists have focused on developing increasingly rigid backbone structures to increase fractional free volume (FFV) and molecular diffusion through polymer films. Through this effort, solution-processable microporous polymers with ultrahigh free volume and measurable Brunauer–Emmett–Teller (BET) surface areas were developed. In many cases, the ultrahigh backbone stiffness and limited chain mobility in microporous polymers can sometimes result in Tg values well above the degradation temperature of the materials. In these cases, standard techniques such as DSC and DMA do not identify a Tg, and specialized methods such as molecular dynamics (MD) simulations183 and flash calorimetry184,185 are required, as is the case for the PIMs shown in Fig. 6. While variations in glass transition temperatures derived from simulation and ultrafast DSC methods warrant investigation that is beyond the scope of this review, both methods have proved valuable in accessing approximate Tg values where traditional techniques fall short.
| Vfree = V − V0 | (13) |
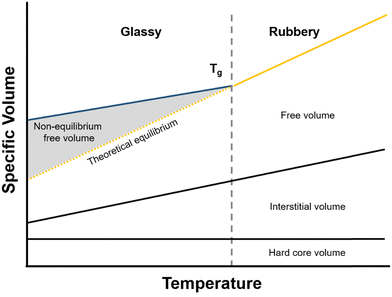 | ||
| Fig. 7 Polymer volume as a function of temperature. The shaded area indicates non-equilibrium free volume. | ||
As mentioned in the previous section, when a polymer is cooled from the rubbery state, it will eventually traverse a glass transition. Below this temperature, cooperative polymer chain mobility becomes exceedingly unfavorable, trapping the polymer in a non-equilibrium and meta-stable state.192 This behavior is reflected schematically in Fig. 7, where the specific volume of the polymer with respect to temperature changes slope with decreasing temperature and correspondingly deviates from the theoretical equilibrium volume (dashed line). The deviation from equilibrium packing results in the formation of non-equilibrium free volume (shaded area in Fig. 7), which is sometimes referred to as “excess free volume”. In the context of the dual-mode sorption model, non-equilibrium free volume provides an additional mode of gas sorption, the “Langmuir mode” discussed in Section 2, and generally results in an order-of-magnitude increase in sorption coefficients for glassy polymers compared to those of rubbery polymers.193 For highly rigid microporous materials, non-equilibrium packing effects can be even more significant and result in large improvements in sorption capacity.194
Fractional free volume (FFV) in a polymer can be correlated with transport properties of diffusing molecules in a polymer film:190,195
 | (14) |
The relationship between free volume and diffusion coefficients of gas molecules in polymers is commonly shown as an exponential correlation:
 | (15) |
Importantly, the effect of plasticization on free volume is seldom studied because of the difficulty in obtaining in situ measurements of FFV for a polymer experiencing plasticization. However, dilatometry and ellipsometry experiments have shown that polymers that sorb condensable penetrants show a decrease in density and increase in free volume.80,91,208 Additionally, molecular simulations have indicated the same type of volume expansion: using cyclical Monte Carlo and molecular dynamics simulations through a “sorption–relaxation cycle”, experiments can be used to predict to what extent a polymer matrix has physically expanded, correlating to lower density and thus higher free volume.168,209,210
3.1.3.1. Dependence of Tg on free volume. The Doolittle equation211 is often used to describe the relationship between viscosity and FFV in liquids212–214 and rubbery polymers:215
 | (16) |
| f = fg + αf(T − Tg) | (17) |
 | (18) |
 | (19) |
 . This equation is known as the Vogel–Fulcher–Tamman–Hesse (VFTH) equation, which correlates polymer relaxation times to temperature primarily through their dependence on free volume. The three parameters required in the VFTH equation can be simplified into two variables by incorporating a reference viscosity (ηref) at a reference temperature (Tref), which can be described using a modified version of eqn (18) with Tref instead of Tg: f = fref + αf(T − Tref) The resulting relationship is known as the Williams–Landel–Ferry (WLF) equation:217
 | (20) |
 and
and  are WLF coefficients, and
  is the WLF shift factor.
For a polymer glass above its Tg, the WLF equation is a universal function widely used to describe the temperature dependence of properties of viscoelastic materials.218 The WLF shift factor is a direct consequence of time-temperature superposition (TTS), where a relaxation process occurring at a long time scale is equivalent to one occurring at a low temperature and vice versa. By running tests over a range of temperatures and/or frequencies, TTS allows for the determination of a large range of viscoelastic properties. As a result, viscoelastic tests such as dynamic mechanical analysis (DMA) can provide useful information on polymer mobility and the glass transition by scanning across a large range of temperatures and timescales and identifying temperatures where phase transitions and relaxation processes occur. In turn, this information can be used to better understand polymer chain dynamics and relaxation processes associated with plasticization phenomena.
3.1.3.2. Dependence of Tg on molecular weight. The Flory–Fox relationship describes the dependence of Tg on polymer molecular weight:108,219
 | (21) |
3.1.3.3. Dependence of Tg on blend or copolymer composition. While many new microporous polymers have been developed in the last decades, their sophisticated chemistries can often result in low molecular weight, decreased mechanical integrity, and expensive or time-consuming multistep syntheses. Blending offers a time- and cost-effective alternative to tune the separation performance and mechanical properties of membranes,222 including properties related to plasticization, as will be discussed in detail in Section 4.223–226 Additionally, copolymerization can also serve as a method to engineer gas-separation properties. In both of these approaches, understanding the dependence of Tg on blend or copolymer composition can assist in selecting the appropriate polymer blend combinations.
For miscible polymer blends and random copolymers, the Fox equation describes the general dependence of Tg on composition:227
 | (22) |
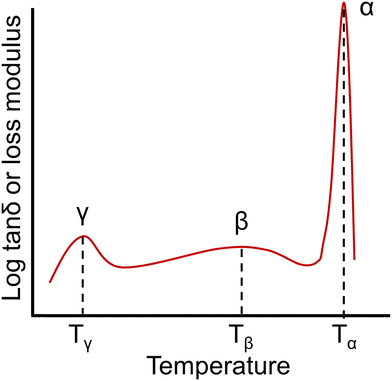 | ||
| Fig. 8 An example of a dynamic mechanical spectrum of an amorphous polymer with γ, β, and α (Tg) relaxations. | ||
A number of studies have indicated that the presence of residual water in a polymer can affect γ relaxations, resulting in changes to the location and intensity of these features.235–237 From a molecular perspective, the γ transition is most commonly associated with phenyl ring oscillations.238,239 The β relaxation has been associated with short-range motions that may be precursors to segmental polymer mobility occurring at the Tg. For instance, β relaxations in aromatic compounds have often been associated with the ring flipping of para-phenylene groups.239 The temperature range and magnitude of some sub-Tg transitions can also be affected by factors such as film preparation methods, thermal history, and moisture absorption.228
Several characterization techniques are used to identify the temperatures at which sub-Tg relaxations occur. These tests include dynamic mechanical analysis (DMA), broadband dielectric spectroscopy (BDS), and thermally stimulated discharge current (TSC) measurements.228 For example, Comer et al. investigated dynamic relaxation characteristics of Matrimid® polyimide using both dielectric and dynamic mechanical tests.240 DMA storage and loss moduli were obtained at a number of frequencies from 0.1–30 Hz, and at discrete temperatures ranging from −150 °C to 425 °C. Additionally, dielectric spectroscopy data, such as the dielectric constant and dielectric loss, were recorded for frequencies from 1 Hz–1 MHz at 10 °C isothermal intervals from −150 °C to 300 °C, which approaches the Tg. As shown in Fig. 9a, two sub-Tg relaxations in Matrimid® were identified at −112 °C (Tγ) and 80 °C (Tβ). Through Starkweather analysis241,242 of the activation energies for each transition, the authors found that the γ transition was close to the zero-entropy limit and non-cooperative in nature, while the β transition showed more cooperative character, which is indicated by the larger variation between the activation energies in Fig. 9b. Performing similar in-depth analyses of sub-Tg relaxation processes in microporous materials would allow for better fundamental understanding of mechanisms relevant in relaxation-related phenomena like CO2 induced plasticization.
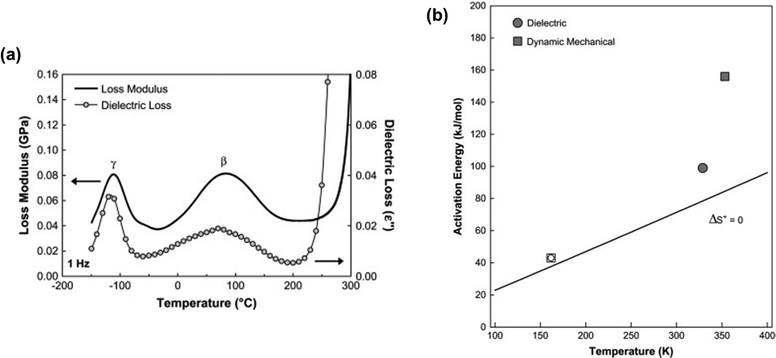 | ||
| Fig. 9 (a) Dynamic mechanical loss modulus (GPa) and dielectric loss vs. temperature (°C) at a frequency of 1 Hz for Matrimid® polyimide. Two sub-glass relaxations are observed at –112 °C (Tγ) and 80 °C (Tβ). (b) Apparent activation energy (kJ mol−1) vs. relaxation temperature (K) at 1 Hz for γ transition (open symbols) and β transition (filled symbols) based on dynamic mechanical analysis (squares) and dielectric spectroscopy (circles). Reprinted with permission from ref. 240 (Copyright Elsevier, 2009). | ||
3.2. Techniques to measure chain cooperativity
Common characterization techniques used to measure chain mobility are reviewed in this section, including methods to determine the Tg and methods to characterize inter and intrachain cooperativity. Typical advantages and disadvantages of each method are summarized in Table 3.3.2.1.1. Differential scanning calorimetry (DSC). Differential scanning calorimetry (DSC) is a thermoanalytical characterization technique used to study thermal transitions such as glass transition temperatures, melting and boiling points, and crystallization temperatures.243 DSC instruments can be classified into two types: heat-flux and power-compensated.243,244 A typical heat-flux DSC instrument consists of two pans heated in a chamber: one pan contains the material of interest and a second reference pan is typically empty or contains a well-characterized sample.244,245 As the pans are heated, transitions such as Tg, melting, and degradation will manifest as differences in the heat flow (q) required to maintain a constant temperature ramp.244,245 The DSC heat flow, q, is defined as:
 | (23) |
| ΔH = CpΔT | (24) |
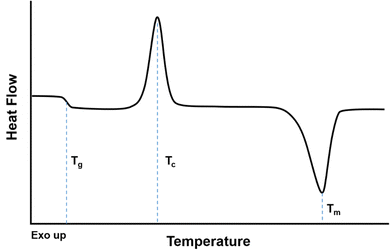
When evaluating a DSC curve, exothermic processes (e.g., crystallization) require a reduction in heat flow to keep the temperature constant, while endothermic processes (e.g., melting, evaporation) require an influx of heat flow. Conventional DSC plots show endothermic reactions as valleys and exothermic reactions as peaks (i.e., “Exo up”), as shown in Fig. 10.246 The crystallization temperature, Tcryst, is an exothermic process shown as a peak on Fig. 10, while the melting temperature, Tm, is an endothermic process represented as a valley. The reported values for Tm and Tcryst are commonly defined as the temperature in the middle of the peak/valley.
The heat capacity (Cp) of a polymer increases as the polymer traverses the glass transition to the rubbery state.243 Two heating/cooling cycles are usually conducted where the polymer is heated to 50–100 °C above Tg or 30 °C above Tm, and the second cycle is usually reported as it does not depend as much on the processing history of the polymer or the residual presence of solvent or impurities.243,245 The first cycle should be run at temperatures below the degradation temperature of the polymer. As shown in Fig. 10, while the Tg occurs over a range of temperatures, the Tg is usually identified as the midpoint of the inclined region in the curve.247
In addition to the traditional DSCs, specialized DSC techniques have emerged in the last decades including microelectromechanical systems (MEMS) DSC,248 infrared (IR) heated DSC,249 modulated-temperature (MT) DSC,250 and pressure perturbation calorimetry (PPC).251 A particularly interesting example is the IR-heated DSC, also referred to as rapid-heating DSC, as it can heat up at a rate up to 2000 °C per minute.243 High heating rates are sub-categorized as fast-scan DSC (100–300 °C per minute), Hyper-DSC (300–750 °C per minute), and Ultra-Fast or Flash DSC (up to 2![[thin space (1/6-em)]](https://www.rsc.org/images/entities/char_2009.gif) 400
400![[thin space (1/6-em)]](https://www.rsc.org/images/entities/char_2009.gif) 000 °C per minute). Ultra-fast or flash DSC allows ultra-glassy materials to be studied as structural changes can be more easily observed at higher heating rates. For instance, this method is particularly useful in analyzing polymers with rigid backbones like PIM-1 and PIM-EA-TB, which have degradation temperatures below their Tg.184,185
000 °C per minute). Ultra-fast or flash DSC allows ultra-glassy materials to be studied as structural changes can be more easily observed at higher heating rates. For instance, this method is particularly useful in analyzing polymers with rigid backbones like PIM-1 and PIM-EA-TB, which have degradation temperatures below their Tg.184,185
In the context of plasticization, high-pressure DSC can be also used to limit desorption of condensable gases from the sample and evaluate the effects of plasticization on the Tg.252,253 Specifically, pressure-controlled DSC, or pressure perturbation calorimetry (PPC), can be used to apply a pressure to the sample cell and subsequently determine differences in heat absorbed and released.253 PPC has been useful for measuring temperature differentials in response to pressure change in proteins.243 However, a major limitation of high-pressure DSCs is the appearance of noisy data even at baseline pressures.252 As pressure is increased, the noise increases due to phase transitions of condensable gases that occur above their critical pressures, making the data difficult to interpret.252,253
Despite such limitations, DSC has been used to investigate the effect of CO2 plasticization on the Tg. In a typical experiment, a pressure-controlled hermetic cell is used and the polymer film is equilibrated at the CO2 pressure of interest.252 Thicker membranes help to minimize fractional loss of CO2 through diffusion before reaching the Tg and retain a high content of CO2 in the polymer.64,252 The total time between removing the polymer from the sorption chamber to sealing the pan is kept short to minimize desorption before testing.64 Erratic fluctuation in the DSC curve above Tg can sometimes reflect evidence of CO2 desorption.64 Thus, in these specialized experiments, it is important to limit CO2 desorption while also reaching a high enough heating rate and temperature to clearly observe the Tg without polymer degradation.64 Moreover, initial scans may feature sub-Tg changes associated with processing history, which make the second heating curve a more useful metric for determining Tg.
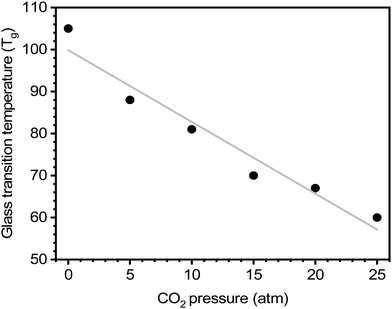
For certain polymers, as CO2 sorption increases with increasing pressure, a steady reduction in the Tg has been documented.64,254 Chiou, Barlow, and Paul demonstrated this effect for poly(methyl methacrylate) (PMMA) evaluated at various CO2 pressures, where there is a clear decrease in Tg with increasing CO2 concentration (Fig. 11).64 On the other hand, crystallization and the addition of fillers to the polymer matrix (i.e., mixed-matrix membranes) have been shown to increase Tg.64,254 As such, DSC can be an effective tool to study the effects of plasticization and provide insight into thermal transitions (i.e., Tg, Tm, and Tcryst).
In a typical DMA experiment to measure Tg, a piece of polymer film is clamped and subjected to a sinusoidal oscillating load while the material response (stress or strain) is recorded as a function of time, temperature, and frequency.267 Tests in which temperature is varied are known as “temperature sweep tests”, while those in which frequency is varied are referred to as “frequency sweep tests”. In an ideal elastic material, the stress and strain will be in phase with each other, while in an ideal viscous material, the stress and strain will be 90° out of phase with each other.268 The stress (σ) at any time, t, can be written as:
σ = σ0![[thin space (1/6-em)]](https://www.rsc.org/images/entities/char_2009.gif) sin(ωt) sin(ωt) | (25) |
 can be written as:
 | (26) |
 is the maximum strain achieved and δ is the phase angle between stress and strain.268 Therefore, in an ideal elastic material, δ = 0, while in an ideal viscous material, δ = 90°.268Fig. 12 depicts the three strain responses that can occur when a sinusoidal stress is applied to a material.
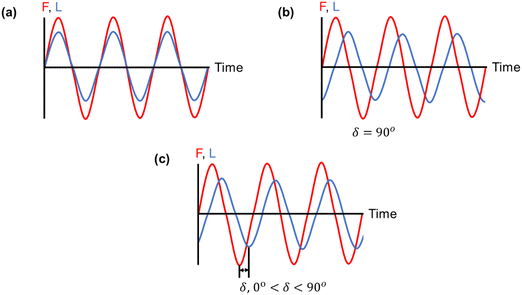 | ||
| Fig. 12 Three strain responses (L) to applied stress (F): (a) an ideal elastic material, (b) an ideal viscous material, and (c) a viscoelastic material, in which the strain response lies in between that of an ideal elastic and an ideal viscous material.255 | ||
The storage modulus (E′), which is a measure of the stored energy in a material (i.e., the elastic portion), and loss modulus (E′′), which is a measure of the energy lost as heat (i.e., the viscous portion) can be defined as follows:268
 | (27) |
 | (28) |
 | (29) |
Below the Tg, the material acts as a “rigid” solid with a very high storage modulus, but when the Tg is traversed, the material enters a more “rubbery”-like state, which is indicated by a sharp decrease in E′ and a peak in both E′′ and tan(δ).270Fig. 13a depicts an idealized E′ scan of a polymer material as a function of temperature. As temperature increases, transitions (e.g., sub-Tg and Tg) will occur as indicated by sharp decreases in E′. An example scan of both E′ and E′′ as functions of temperature is shown in Fig. 13b for a Matrimid® polyimide. The Tg is clearly indicated by the drop in E′ and peak in E′′ (which is labeled as α in the graph), while both β and γ transitions are also present and labeled accordingly.240
 | ||
| Fig. 13 (a) An idealized temperature scan of a polymer.255 Regions of transitions are labeled. (b) Storage modulus (solid line) and loss modulus (dashed line) of Matrimid® polyimide.240 Reproduced with permission from ref. 240 (Copyright Elsevier, 2009). | ||
Since the glass transition of a polymer is a macromolecular relaxation process, the frequency (rate) of DMA tests can influence the onset of transitions. Comer et al. ran a series of DMA tests on an HAB-6FDA polyimide that was thermally-rearranged at 300 °C for 1 h over a frequency range of 0.1 to 30 Hz.261 As seen in Fig. 14, the sub-glass transition temperatures (γ and β), as well as the glass transition temperature (labeled α) exhibited an increased response with increasing frequency, implying that these transitions are kinetic motional processes that are influenced by changes in testing frequency.261 However, above the glass transition, the dynamic mechanical scan becomes independent of frequency, indicating that the polymer is in an equilibrium (and not meta-stable) state. The increase in the modulus starting at around 330 °C is associated with a stiffening of the polymer backbone from thermal rearrangement, while the increase in modulus at 450 °C is attributed to the beginning of thermal degradation.261
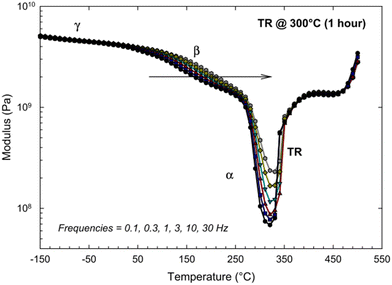 | ||
| Fig. 14 Dynamic mechanical analysis of a thermally-rearranged HAB-6FDA polyimide at different test frequencies.261 Reprinted with permission from ref. 261 (Copyright Elsevier, 2013). | ||
Several studies have reported mechanical properties of polymers in the presence of different concentrations of CO2. Examples include those from Al-Enezi et al., in which a high-pressure three-point bend testing cell was used to monitor the mechanical properties of polycarbonate (PC), polysulfone (PSf), and polymethyl methacrylate (PMMA) at CO2 pressures of up to 120 bar.271 It was found that all polymer samples generally experienced similar deformations at lower temperatures when exposed to more CO2, which can be attributed to CO2 “softening” the samples.271 Ulrich et al. generated tensile stress–strain curves for polycarbonate films exposed to CO2 and found that increasing CO2 concentration led to a depression of yield stress (the stress at which a material will experience permanent deformation).268,272 Flichy et al. conducted indentation experiments of PMMA in a CO2 atmosphere up to 160 bar, reporting that the hardness of PMMA (as well as its Tg) was reduced as CO2 pressure increased.273 In addition, Wang et al. measured the Young's modulus, which is a measure of stiffness, of polystyrene as CO2 pressure was increased from 1 to 1050 bar and found that both the Young's modulus and the Tg of polystyrene reached a minimum at a CO2 pressure of 200 bar.180 The authors attributed this finding to two competing effects that occur during CO2 pressurization.180 The first effect, plasticization, causes decreases in both Young's modulus and Tg. The second effect, which is caused by increasing hydrostatic pressure, leads to an increase in stiffness of the polymer,180 and thus increases in Young's modulus and Tg.
A few studies have used DMA measurements directly to determine the effects of plasticizers such as CO2 on polymer properties. Fried et al. analyzed the effects of sorbed CO2 on the dynamic mechanical response of polysulfone (PSf), polycarbonate (PC), and polyetherimide (PEI).264 DMA results for unconditioned samples and samples conditioned at ∼30 bar of CO2 for 30 h are shown in Fig. 15. In all three cases, E′ exhibited a sharp decrease at a lower temperature for conditioned samples, indicating a lower Tg.264 The peak associated with Tg in the E′′ scans was also broader and occured at a lower temperature for all three conditioned samples.264 The low-temperature secondary relaxation (γ) was also enhanced in magnitude and occurred at lower temperatures for all three conditioned samples, which suggests that sorbed CO2 increases chain separation and allows for more chain mobility.264
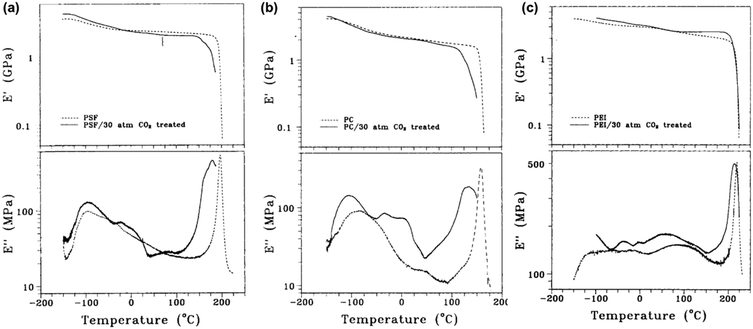 | ||
| Fig. 15 Plot of E′ and E′′ for (a) PSf, (b) PC, and (c) PEI.264 Dotted lines represent data for unconditioned samples, while solid lines represent data for conditioned samples at ∼30 bar of CO2 for 30 h. Runs were performed at a frequency of 1 Hz. Reprinted with permission from ref. 264 (Copyright Wiley-VCH, 1980). | ||
Minelli et al. demonstrated through DMA that the presence of CO2 decreases the magnitude of E′ and increased tan(δ) for three different glassy polymers (PSf, PMMA, and Matrimid®) that were in equilibrium with CO2 at different pressures.274 The three polymers were chosen based on their different permeability behaviors in response to increased CO2 feed pressures (Fig. 16a). PSf showed a continuously decreasing trend in permeability up to a CO2 feed pressure of 30 bar,275 PMMA displayed an increasing permeability even at low feed pressures,276 and Matrimid® showed a plasticization pressure of approximately 11 bar.277 In Fig. 16b–d, the change in storage moduli as the amount of sorbed CO2 increases is shown for PSf, PMMA, and Matrimid®, respectively.274 For all three polymers considered, the storage modulus decreases with increasing amount of CO2 dissolved into the material, demonstrating that CO2 decreased the elastic response of all three polymers.274 As shown in Fig. 16e, tan(δ) for all three polymers increases with increasing CO2 pressure, indicating an enhancement in the viscous response relative to the elastic response of the three polymers, as well as enhanced mobility and relaxation of polymer chains.274
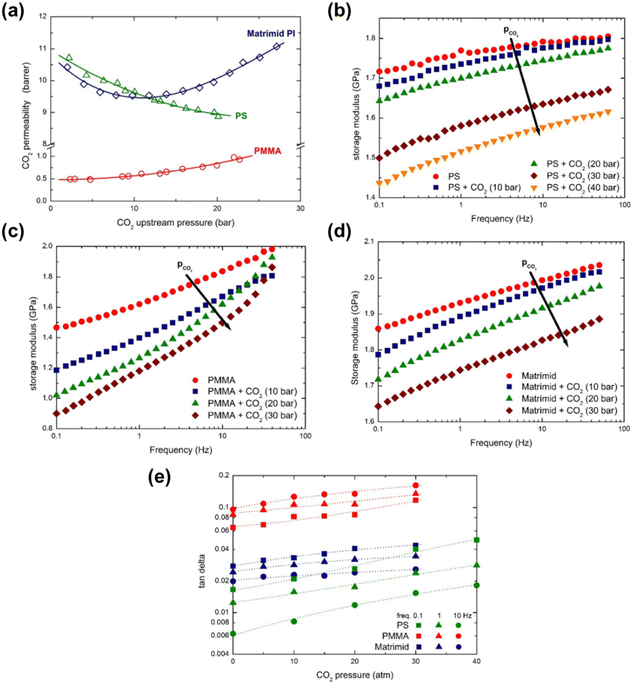 | ||
| Fig. 16 (a) CO2 permeability as a function of CO2 feed pressure for PSf (labeled PS in figures), PMMA, and Matrimid®.274–277 (b)–(d) depicts the storage modulus at various CO2 pressures for PSf, PMMA, and Matrimid®, respectively, at varying test frequencies from 0.1 to 50 Hz. (e) tan(δ) as a function of CO2 mass fraction for PSf, PMMA, and Matrimid® at a test frequency of 0.1 Hz.274 Reprinted with permission from ref. 274 (Copyright Elsevier, 2019). | ||
In regard to microporous polymers, DMA measurements are commonly used to determine Tg or other mechanical properties, but to the best of our knowledge, there have not been any direct DMA studies on microporous polymers in a CO2 environment. However, a recent study by Číhal et al. analyzed the behavior of PIM-1 films exposed to vapor methanol and dimethyl carbonate (DMC) using DMA and found that E′ remained comparable to that of untreated PIM-1 until exposure to DMC-rich vapor mixtures or mixtures at higher degrees of saturation (63% of the dew point pressure), where E′ decreased.278 This finding indicated that the binary mixture acted as a plasticizer.278 Since DMA is a useful technique to determine the mechanical properties of polymer membranes, as well as the changes in such properties when exposed to different environments (such as CO2 or other condensable gases), continued DMA tests on microporous polymers will be useful to elucidate important structural and functional correlations with plasticization.
3.2.1.2. Dielectric spectroscopy. Dielectric spectroscopy is a versatile experimental technique used to examine molecular relaxation processes, such as the Tg and sub-Tg transitions, or phase transitions, including the melting temperature in a crystalline material. Dielectric spectroscopy is also one of only a few analytical techniques that can survey a wide range of behavior for a single material, spanning low viscosity liquids to rubbery solids to hard glassy solids.279 Additionally, dielectric spectroscopy can also be used to understand mixture miscibility and polymerization reaction rates.279
In a typical dielectric spectroscopy experiment for a polymer film, a thin sample is placed in contact with two or more electrodes while a time-varying sinusoidal voltage is applied. Although there are several electrode-sample configurations for polymer system measurements,279 the most commonly used geometry is the parallel-plate arrangement. Pictured in Fig. 17 are two parallel-plate electrodes that sandwich a thin, flat sample, and a guard ring that minimizes fringing or edge effects. After a voltage is applied, the complex permittivity, also known as the dielectric constant, is measured as a function of frequency. To determine various properties of a given polymer, the measurement can be performed as a function of temperature and time at fixed frequencies. By surveying a broad frequency range (from ∼10−6 Hz to ∼1012 Hz) and variations in temperature, molecular responses on different length scales can be observed.280 However, there is no single instrument that can cover this entire frequency range, thereby requiring multiple instruments to extract the most in-depth information. Common types of dielectric instrument techniques along with their typical frequency coverage are discussed by Schultz.279
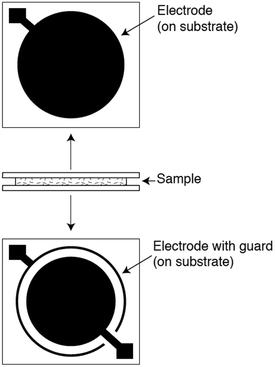 | ||
| Fig. 17 Parallel-plate arrangement for dielectric spectroscopy. Two parallel plates sandwich a thin, flat sample. A guard ring is used to minimize edge effects. Reprinted with permission from ref. 279 (Copyright Wiley, 2006). | ||
In a time-varying or oscillating electric field, dielectric spectroscopy helps to measure the complex dielectric permittivity, ε*(f), which is represented by a complex number:
| ε*(f) = ε′(f) − i*ε′′(f) | (30) |
 | (31) |
Many studies have used dielectric spectroscopy and analysis to determine Tg and sub-Tg relaxations in various polymers, including PIM-1, DL-polylactic acid (PLA), and polystyrene (PS).240,280,284,285 For example, Konnertz et al. investigated the molecular mobility of PIM-1 by using dielectric spectroscopy.284 The complex dielectric permittivity was measured in a frequency range from 10−1–106 Hz using a parallel-plate geometry, and a temperature program with several heating and cooling cycles in the range of −100 to 250 °C was applied (depicted in Fig. 18a) to analyze the influence of temperature on sample structure and dynamics. Fig. 18b illustrates the dielectric spectra (log![[thin space (1/6-em)]](https://www.rsc.org/images/entities/char_2009.gif) ε′′ vs. temperature) at a fixed frequency of 1000 Hz for the different heating and cooling runs performed, and a distinct relaxation peak is observed around 187 °C. Further analysis suggested that this relaxation process in PIM-1, denoted β*, demonstrates a non-cooperative character due to a linear van’t Hoff behavior, compared to the exponential dependence typically observed for cooperative segmental relaxation processes.284 This relaxation can be attributed to π–π stacking in the polymer backbone that leads to local intermolecular agglomerates. Because PIM-1 can be susceptible to factors like physical aging and, therefore, lose its separation performance, Konnertz et al. investigated the molecular mobility of solution-cast nanocomposite films of PIM-1 and polyhedral oligomeric silsesquioxane with phenethyl substituents (PhE-POSS) as nanofillers using dielectric spectroscopy.280 The same frequency range and temperature program from an earlier PIM-1 study was used.284Fig. 19 shows the dielectric spectra for the second heating run for pure PIM-1, pure PhE-POSS and selected composites at 1000 Hz. Though only a β relaxation (due to π–π stacking) is observed for pure PIM-1, composites with higher wt% of PhE-POSS (i.e., PIM-1 with 15 wt% PhE-POSS and 30 wt% PhE-POSS) begin to show a weak but distinct second relaxation process, which the authors attributed to the α relaxation observed in pure PhE-POSS. Thus, these two studies helped to demonstrate that the addition of a secondary component, such as nanofillers or plasticizing agents, to an existing polymer can lead to changes in the Tg and sub-Tg relaxation processes. Dielectric spectroscopy is a useful way to observe, measure, and analyze these molecular dynamic changes in composites or pristine materials.
ε′′ vs. temperature) at a fixed frequency of 1000 Hz for the different heating and cooling runs performed, and a distinct relaxation peak is observed around 187 °C. Further analysis suggested that this relaxation process in PIM-1, denoted β*, demonstrates a non-cooperative character due to a linear van’t Hoff behavior, compared to the exponential dependence typically observed for cooperative segmental relaxation processes.284 This relaxation can be attributed to π–π stacking in the polymer backbone that leads to local intermolecular agglomerates. Because PIM-1 can be susceptible to factors like physical aging and, therefore, lose its separation performance, Konnertz et al. investigated the molecular mobility of solution-cast nanocomposite films of PIM-1 and polyhedral oligomeric silsesquioxane with phenethyl substituents (PhE-POSS) as nanofillers using dielectric spectroscopy.280 The same frequency range and temperature program from an earlier PIM-1 study was used.284Fig. 19 shows the dielectric spectra for the second heating run for pure PIM-1, pure PhE-POSS and selected composites at 1000 Hz. Though only a β relaxation (due to π–π stacking) is observed for pure PIM-1, composites with higher wt% of PhE-POSS (i.e., PIM-1 with 15 wt% PhE-POSS and 30 wt% PhE-POSS) begin to show a weak but distinct second relaxation process, which the authors attributed to the α relaxation observed in pure PhE-POSS. Thus, these two studies helped to demonstrate that the addition of a secondary component, such as nanofillers or plasticizing agents, to an existing polymer can lead to changes in the Tg and sub-Tg relaxation processes. Dielectric spectroscopy is a useful way to observe, measure, and analyze these molecular dynamic changes in composites or pristine materials.
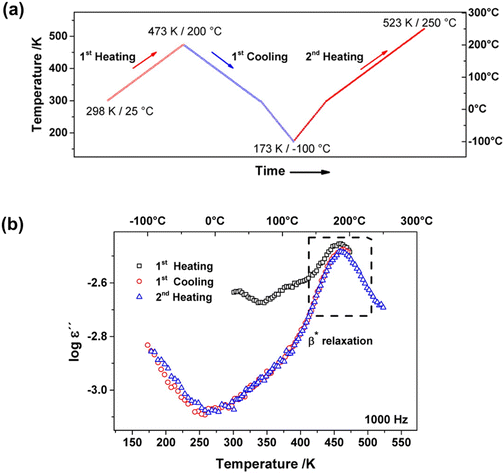 | ||
Fig. 18 (a) Heating/cooling cycles in the range of −100 to 250 °C of the dielectric measurements on PIM-1. (b) Dielectric spectra (log![[thin space (1/6-em)]](https://www.rsc.org/images/entities/char_2009.gif) ε′′ vs. temperature) at a fixed frequency of f = 1000 Hz for the different heating and cooling runs for PIM-1. Reprinted with permission from ref. 284 (Copyright American Chemical Society, 2020). ε′′ vs. temperature) at a fixed frequency of f = 1000 Hz for the different heating and cooling runs for PIM-1. Reprinted with permission from ref. 284 (Copyright American Chemical Society, 2020). | ||
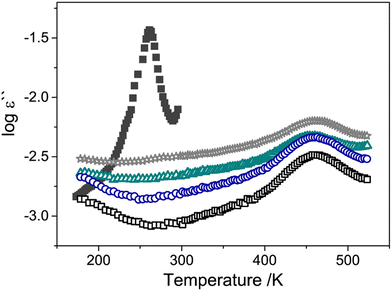 | ||
Fig. 19 Dielectric spectra (log![[thin space (1/6-em)]](https://www.rsc.org/images/entities/char_2009.gif) ε′′ vs. temperature) for pure PIM-1 (unfilled black squares), of PIM-1 with 1 wt% PhE-POSS (unfilled blue circles), 7.5 wt% PhE-POSS (unfilled green triangles), 30 wt% PhE-POSS (unfilled gray stars) and pure PhE-POSS (filled dark gray squares) at a frequency of 1000 Hz. Reprinted with permission from ref. 280 (Copyright Elsevier, 2020). ε′′ vs. temperature) for pure PIM-1 (unfilled black squares), of PIM-1 with 1 wt% PhE-POSS (unfilled blue circles), 7.5 wt% PhE-POSS (unfilled green triangles), 30 wt% PhE-POSS (unfilled gray stars) and pure PhE-POSS (filled dark gray squares) at a frequency of 1000 Hz. Reprinted with permission from ref. 280 (Copyright Elsevier, 2020). | ||
3.2.2.1. NMR relaxation experiments. Solid-state magic angle spinning (MAS) NMR can provide in-depth information on the energetics of polymer chain motion and even individual atom-specific motions through spin–lattice relaxation experiments. These studies help evaluate subtle variations in localized, molecular-level dynamics, which can correlate with gas transport phenomena.69 In general, NMR relaxation experiments evaluate the process through which an excited magnetic state returns to its equilibrium state. Specifically, the spin–lattice relaxation time (T1) is the process where an excited spin returns to equilibrium along the axis of the applied magnetic field. Spin–lattice relaxation can also be measured using a spin-lock, which is referred to as the spin–lattice relaxation in the rotating frame (T1ρ) that forms a rotating magnetic field perpendicular to the applied field. Because NMR signals are associated with specific atoms in an organic molecule, both T1 and T1ρ can resolve relaxation times for individual atoms or clusters of similar atoms in a polymer chain. This feature enables analysis of mobility for atoms on side chains or atoms on the polymer backbone and provides information on both the intra and interchain mobility of polymer chains in a solid-state film. Generally, when thinking of polymer chain dynamics, longer relaxation times indicate less chain mobility. Detailed information on the fundamental theory and common procedures to conduct NMR relaxation experiments can be found elsewhere.286–288
In the context of gas separations, NMR experiments have been used to elucidate (1) the evolution of chain mobility as a function of CO2 content, (2) the mechanism for densification of polymer chains over time in mixed-matrix membranes (MMMs), and (3) the influence of plasticizing solvents or small molecules on the overall chain dynamics. In general, decreases in T1 or T1ρ as a function of physical aging time, additive concentration, or plasticizer content indicate increased mobility and higher local free volume, while increases in T1 or T1ρ suggest reduced chain mobility, higher local packing density or increased secondary interactions.289
Because of the relationship between relaxation times and packing density, NMR has been used to study physical aging mechanisms in films.290 For instance, in work by Lau et al., 13C solid state NMR was used to understand how addition of a hypercrosslinked additive (α-dichloro-p-xylene, p-DCX) helped reduce aging of poly(1-trimethylsilyl-1-propyne, PTMSP).291 In that study, the relative change in T1 values for the carbon atoms was evaluated over time. As shown in Fig. 20, films with added p-DCX showed little change in T1 over time while the pristine PTMSP polymer had a 13% increase in T1 values for the side chains and reduced mobility for the backbone, which was attributed to the collapse of free volume and hindered chain motion.291 Similar 13C-NMR T1 studies have been performed with PIM-1-based MMMs based on different additives such as PAF-1,292 hydroxyl-functionalized p-DCX,293 and functionalized silica nanoparticles.294 These studies have revealed some characteristics of particle–polymer interactions that may help or hinder chain mobility. NMR analysis has also been used to elucidate the effect of casting solvent and particle–solvent interactions on the resulting solid-state chain mobility, such as in cases where the same polymer was cast using solvents of different polarity,293 or where increases in chain mobility arose after solvent treatments or conditioning289 (e.g., methanol in PTMSP). While not as frequently applied in the context of plasticization, the measurement of T1 relaxation over time is inherently similar to the chain dynamics that occur on exposure to plasticizing agents, such as low molecular weight diluents and condensable gases, and may provide useful information on the mechanisms affecting such processes.
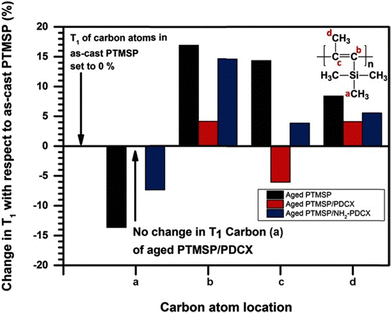 | ||
| Fig. 20 Change in T1 relaxation times for carbon atoms in PTMSP before and after adding a hypercrosslinked additive (α-dichloro-p-xylene, p-DCX) or its amine-functional counterpart. Reprinted with permission from ref. 291 (Copyright Wiley, 2016). | ||
In addition to relaxation experiments as a function of time, T1 or T1ρ experiments have also been used to probe the atom mobility as a function of plasticizer content. For instance, Koval'aková et al. evaluated how a small plasticizing agent, glycerol triacetate (TAC), affected the relaxation of polylactic acid (PLA)295 using solid-state 13C and 1H-NMR experiments. In this case, the presence of plasticizers led to an increase in mobility (decrease in 13C T1 values) of PLA chains at room temperature. In separate studies, T1ρ values measured at frequencies in the mid-kilohertz range have been used to probe relaxations associated with cooperative main-chain motions in polymers.69 In one instance, Sefcik and Schaefer performed 13C NMR tests as a function of CO2 pressure from vacuum to ∼1 bar and observed a reduction in T1ρ values, indicating increased mobility with increasing pressure.296 In subsequent work, Sefcik and Schaefer investigated the role of the tricresyl phosphate plasticizer on the mobility of poly(vinyl chloride) (PVC) and related these correlations to time-lag diffusion.297 The diffusion coefficients decreased when concentrations of the plasticizer were below 15%, while diffusion coefficients and relaxation rates increased at concentrations above 15%. The authors suggested that these similarities in trends may indicate a close relationship between main-chain molecular motions and gas diffusion. To complement this work, Smith and Moll performed deuterium (2H) NMR T1 studies as a function of CO2 pressures ranging from vacuum to ∼35 bar for polycarbonate, a polyester carbonate, and polystyrene.69 As shown in Fig. 21, relaxation times were found to consistently decrease with increasing CO2 pressures, indicating increased main-chain motions once again. Here, the authors considered two hypotheses: that (1) the microscopic dynamic processes (oscillatory motions and phenyl ring flips) assist in diffusion, or that (2) CO2 gas plasticizes the film leading to increased chain motion and diffusion. Importantly, they also note that relative frequency of diffusion (correlation times ∼1012 s−1) is much shorter than the slow relaxations probed by NMR (106–107 s−1). Therefore, diffusion and NMR relaxation may be independent but both can still suggest how CO2 alters the dynamics of the films. Taken together, these examples showcase the utility of NMR relaxation experiments in understanding intra and interchain motions in relation to plasticization. Applying such analyses to microporous materials would assist in revealing clear structure–property relationships and understanding the molecular origins of plasticization, especially in rigid microporous polymers with ultrahigh glass transition temperatures, where sub-Tg motions can influence plasticization effects.
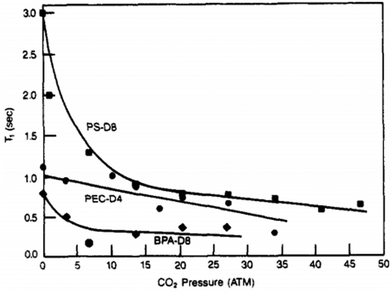 | ||
| Fig. 21 Dependence of 2H-NMR T1 values on CO2 pressure for polystyrene (PS-d8), polyester carbonate (PEC-d4), and bisphenol A polycarbonate (BPA-d8). Reprinted with permission from ref. 69. (Copyright American Chemical Society, 1990). | ||
3.2.2.2. Dilation experiments. As discussed in Section 2, sorption tests can reveal information on interaction parameters when using models such as the NELF model, but an additional consideration is dilation of the membrane—the physical expansion of the polymer matrix when forming a mixture of the polymer and penetrant.65 This volume expansion has been correlated with the increase of diffusivity related to plasticization.72 Dilation experiments have been used as tools to (1) estimate molar volume of the sorbed penetrant,65,150,298 (2) differentiate Fickian and non-Fickian diffusion in polymer chains,72,87,168 and (3) validate thermodynamic model predictions (such as the ksw swelling parameter used in the NELF model).65,87,150,298
Dilation experiments are typically performed sequentially through equilibration with a gaseous atmosphere at discrete pressure steps. Additionally, dimensional changes are recorded for the polymer film as it comes into equilibrium, typically using the assumption of isotropic expansion65,298 to measure volume changes at different sorption equilibrium conditions. These experiments can be performed using a variety of methods such as dilatometry and spectroscopic ellipsometry. Dilatometry measures the change in size of a single dimension using either a camera or a capacitance sensor.65,72,168 For spectroscopic ellipsometry, light of a certain wavelength is refracted through a thin polymer sample attached to a reflective substrate, and the changes in the polarization state of the dispersed waves collected by the detector can be fitted to an appropriate model to obtain thickness and refractive index of the sample.299 The key assumption in spectroscopic ellipsometry is that the measured refractive index of a mixture is based on the refractive indices of both the polymer and penetrant, and can be linked to the individual density of the polymer and penetrant through the Clausius–Mosotti equation.47,300–302 Using volume change data, a dilation isotherm can be created, measuring the fractional volume change from the starting volume (i.e., ΔV/V0) versus pressure p.
Dilation experiments have been used to estimate the partial molar volume of the penetrant150,298 based on its thermodynamic definition:
 | (32) |
 | (33) |
Hysteretic behavior seen in sorption isotherms of plasticized polymers is also observed in dilation experiments, where the fractional volume change due to an external penetrant (ΔV/V0) is higher for depressurizataion curves than the pressurizing curves.65,72,87 Importantly, the treatment history and conditioning of the polymer play a role in dilation.65 The changes to the polymer matrix caused by dilation at high pressures remain for additional time that is dictated by a relaxation time inherent to the polymer structure and morphology.303,304 For example, Ogieglo et al. leveraged in situ spectroscopic ellipsometry to investigate high-pressure CO2 sorption (0–45 bar) for ultrathin films of microporous polymers including PIM-1, AO-PIM-1, a Tröger's base PIM, and PIM-6FDA-OH.305 As shown in Fig. 22a and b, the PIMs showed typical hysteretic behavior for glassy polymers and swelled significantly more than the non-microporous polystyrene. However, PIMs with higher CO2 affinity, PIM-6FDA-OH and Tröger's base PIM, showed higher swelling of about 15% at 45 bar compared to PIM-1 and AO-PIM-1. The hysteretic behavior of ultrathin PIM-1 films (7–128 nm) was also investigated (Fig. 22c). As film thickness decreased, the shape of the sorption isotherms changed to reflect a more rubbery-like isotherm (i.e., the slope of the desorption curve increased). Moreover, the maximum swelling increased to 18% for the 7 nm film, about three times that of the 128 nm thick film. Thin films appeared to have a higher susceptibility to plasticization, which corresponded to an apparent Tg reduction of 200 °C.
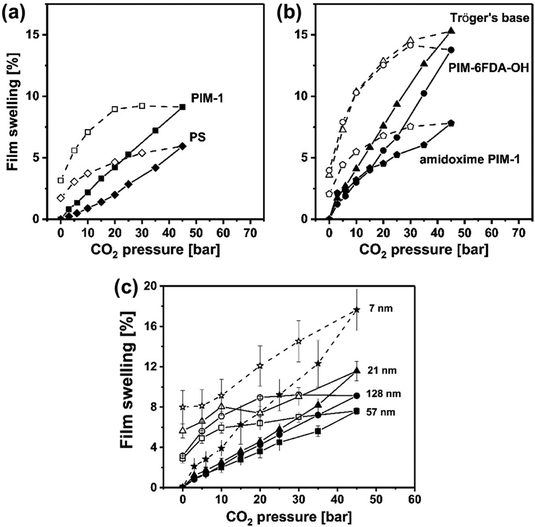 | ||
| Fig. 22 Film swelling versus CO2 pressure for (a) PS (112 nm) and PIM-1 (128 nm), (b) Tröger's base PIM (105 nm), PIM-6FDA-OH (132 nm), and AO-PIM-1, (135 nm), and (c) PIM-1 films of different thicknesses. Filled and unfilled symbols indicate sorption and de-sorption curves, respectively. Reprinted with permission from ref. 305 (Copyright American Chemical Society, 2018). | ||
Dilation experiments can also be used to gain insight into the kinetics of gas sorption in plasticized polymers. In these cases, a distinction between Fickian and non-Fickian diffusion must be made.87,168,303 While Fickian diffusion describes the transport behavior expected for molecular diffusion using Crank's solution,72,306 non-Fickian diffusion needs to be considered if dimensional changes occur to the polymer during an experiment. As proposed by Berens and Hopfenberg,72,87,303 penetrant uptake can be modeled as a two-component relaxational process: the relatively fast matrix response to Fickian diffusion and the slower, relaxational motions of the polymer matrix during dilation. Newns proposed a viscoelastic functional form to model this uptake behavior, which can be found at this reference.307 This model was designed to match viscoelastic phenomena with a distribution of relaxation times.72,303,307 Information on the final mass uptake at steady-state (MF,∞), the maximum sorbed masses for the corresponding relaxational mode (MR,i), and time constants (τi) can be obtained by fitting the Newns equations to transient pressure-decay data provided by sorption experiments. Dilation experiments to capture experimental data on volume dilation versus penetrant pressure can also be used to calculate a swelling coefficient, ksw, used for the NELF model. Doing so constrains fitting for the NELF model with one less variable required, significantly improving model predictions.150
In addition to enabling evaluation of the various fundamental phenomena reviewed above, ellipsometry can be used to further investigate thin films and even the thin selective layers of hollow-fiber membranes,308,309 which are critical considerations for industrial deployment. As demonstrated in Fig. 22c, thin films exhibit vastly different swelling and plasticization behavior than bulk membrane samples.303,305,307 However, ellipsometry experiments can be challenging for certain membrane geometries, preventing widespread adoption of this technique in literature reports.
4. Approaches to mitigate plasticization
In general, there are three primary approaches that researchers pursue to mitigate the effects of plasticization in microporous polymers: (1) engineering the polymer backbone or sidechain chemistry to induce rigidity, (2) applying post-synthetic modification such as crosslinking, and (3) developing composites, blends, and copolymers. Fig. 23 provides an overview of these approaches. When analyzing the success of each approach, the figure of merit is often the plasticization pressure and/or changes in permeability and selectivity between pure- and mixed-gas measurements. These approaches and their resulting trends will be discussed in more detail in Section 5 and compared across an extensive dataset of literature collected from all microporous polymer reports to date. It should also be noted that some reports included in this section performed mixed-gas tests at low pressures (e.g., 1 bar partial pressure CO2). While these sorts of mixed-gas tests do not necessarily provide information relevant to penetrant-induced plasticization effects, they are still valuable as they often reveal information related to competitive sorption. Therefore, we have decided to include these reports in this section but generally recommend that high pressure mixed-gas permeation experiments be run when evaluating stability to plasticization.4.1. Novel syntheses of polymer structures to induce rigidity
Previous studies on non-microporous polymers such as polyimides92–94,310,311 have demonstrated successful plasticization resistance through the restriction of chain mobility via crosslinking,78,312,313 addition of polar moieties,314–316 and formation of charge transfer complexes (CTCs).76,316–318 These methods specifically aim to increase the interchain rigidity of polymers, while, in other cases, researchers have looked to increase the intrachain rigidity of polymers. The differences between interchain and intrachain rigidity are depicted in Fig. 24. Interchain rigidity results from physical or chemical interactions between chains, while intrachain rigidity results from mobility restrictions within a single chain.90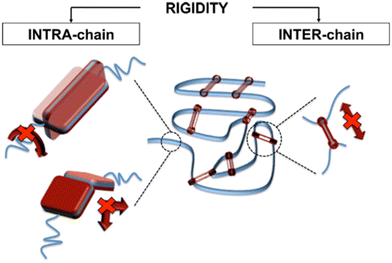 | ||
| Fig. 24 Classification of polymer rigidity into intrachain and interchain rigidity. The blue ribbons represent polymer chains, red segments feature areas of rigidity, and red arrows represent regions of polymer chain movement that are restricted. Adapted with permission from ref. 90 (Copyright American Chemical Society, 2014). | ||
The seminal work by Budd and McKeown in 2004 on polymers of intrinsic microporosity (PIMs)25,319 and subsequent development of many microporous polymers that contain rigid and contorted backbones26,103 has prompted researchers to pursue microporous polymer chemistries for gas separations and plasticization resistance. In particular, increasing the intrachain rigidity of PIMs with addition of bridged-bicyclic contortion centers such as triptycene29,320–324 and Tröger's base (TB) has led to improved gas separation properties.33,35,325,326
![[thin space (1/6-em)]](https://www.rsc.org/images/entities/char_2009.gif) :
:![[thin space (1/6-em)]](https://www.rsc.org/images/entities/char_2009.gif) 47.9 vol% CO2/CH4), they found that while CO2 permeability was constant up to a total feed pressure of 6 bar, CH4 permeability increased slightly and CO2/CH4 selectivity decreased with increasing feed pressure.327 The presence of CO2 in the mixture likely induced dilation of the polymer matrix, which would allow CH4 to permeate more easily.327 However, in a 10
47.9 vol% CO2/CH4), they found that while CO2 permeability was constant up to a total feed pressure of 6 bar, CH4 permeability increased slightly and CO2/CH4 selectivity decreased with increasing feed pressure.327 The presence of CO2 in the mixture likely induced dilation of the polymer matrix, which would allow CH4 to permeate more easily.327 However, in a 10![[thin space (1/6-em)]](https://www.rsc.org/images/entities/char_2009.gif) :
:![[thin space (1/6-em)]](https://www.rsc.org/images/entities/char_2009.gif) 90 vol% CO2/N2 mixture, both CO2 and N2 permeability, as well as CO2/N2 selectivity, remained fairly constant up to a total feed pressure of 6 bar.327 This result could be attributed to the presence of less CO2 in the CO2/N2 mixture, which would not induce as much swelling. Wang et al. synthesized two microporous polymers containing a diamine analogue of TB, known as Hünlich's base (HB), to create 6FDA-HB and TDAi3-HB (Fig. 25).328 While the calculated pure-gas CO2/CH4 selectivity decreased from a feed pressure of 2 bar to 15 bar for both polymers, no obvious CO2-induced plasticization was observed since the permeabilities of both CO2 and CH4 did not increase with increasing feed pressure.328 While these structures show promising initial results, additional studies including mixed-gas tests would be helpful in determining whether the addition of HB onto a polymer backbone can mitigate plasticization more than that of TB.
90 vol% CO2/N2 mixture, both CO2 and N2 permeability, as well as CO2/N2 selectivity, remained fairly constant up to a total feed pressure of 6 bar.327 This result could be attributed to the presence of less CO2 in the CO2/N2 mixture, which would not induce as much swelling. Wang et al. synthesized two microporous polymers containing a diamine analogue of TB, known as Hünlich's base (HB), to create 6FDA-HB and TDAi3-HB (Fig. 25).328 While the calculated pure-gas CO2/CH4 selectivity decreased from a feed pressure of 2 bar to 15 bar for both polymers, no obvious CO2-induced plasticization was observed since the permeabilities of both CO2 and CH4 did not increase with increasing feed pressure.328 While these structures show promising initial results, additional studies including mixed-gas tests would be helpful in determining whether the addition of HB onto a polymer backbone can mitigate plasticization more than that of TB.
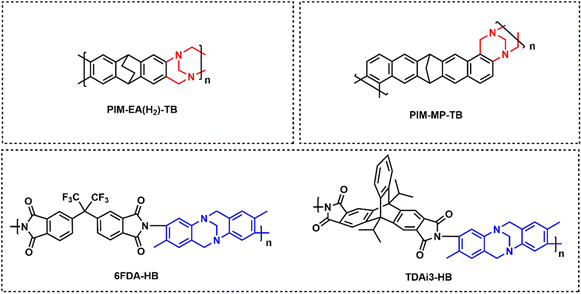 | ||
| Fig. 25 Chemical structures of polymers of intrinsic microporosity containing Tröger's base (red) or Hünlich's base (blue), for studies that reported pure-gas pressurization studies and/or mixed-gas permeation.30,327,328 | ||
Another highly rigid and fused structural component that has been used to increase intrachain rigidity in polymers is triptycene (Fig. 26).20,22,23,25,33–43 Thus, the effects of incorporating triptycene, along with other iptycene structures, on plasticization resistance has been investigated. Swaidan et al. compared the C3H6/C3H8 gas transport properties of KAUST-PI-1 and PIM-PI-1 (Fig. 26) for a feed mixture of 50![[thin space (1/6-em)]](https://www.rsc.org/images/entities/char_2009.gif) :
:![[thin space (1/6-em)]](https://www.rsc.org/images/entities/char_2009.gif) 50 C3H6/C3H8 and a C3H6 partial pressure of 1.0 to 2.5 bar. KAUST-PI-1 experienced a 33% increase in C3H6 permeability while PIM-PI-1 experienced a 7% increase.329 Over this same pressure range, there were also a decrease in C3H6/C3H8 selectivity (7 to 5 for KAUST-PI-1 and 3.4 to 2 for PIM-PI-1).329 However, KAUST-PI-1 both exceeded PIM-PI-1 in terms of C3H6 permeability and C3H6/C3H8 selectivity for the entire pressure range studied.329 In addition, mixed-gas data for KAUST-PI-1 was on the C3H6/C3H8 pure-gas upper bound, while pure-gas data exceeded the upper bound.329,330 Another triptycene-containing polymer, PMDA-DAT (Fig. 26), was also studied for its plasticization resistance.331 pure-gas permeability measurements found that PMDA-DAT had a CO2 plasticization pressure of around 15 bar.331 PIM-TMN-Trip, another PIM with a triptycene unit in the backbone, did not show obvious CO2-induced plasticization effects when exposed to a feed mixture of 22.2 vol% CO2, 6.8 vol% O2, 70.2 vol% N2, and 2220 ppm SO2 over a trans-membrane pressure difference from 1 to 4 bar.332 However, as the CO2 partial pressure was limited to less than 4 bar, plasticization may not have been observed, which would necessitate tests at higher feed pressures, if required for the application.
50 C3H6/C3H8 and a C3H6 partial pressure of 1.0 to 2.5 bar. KAUST-PI-1 experienced a 33% increase in C3H6 permeability while PIM-PI-1 experienced a 7% increase.329 Over this same pressure range, there were also a decrease in C3H6/C3H8 selectivity (7 to 5 for KAUST-PI-1 and 3.4 to 2 for PIM-PI-1).329 However, KAUST-PI-1 both exceeded PIM-PI-1 in terms of C3H6 permeability and C3H6/C3H8 selectivity for the entire pressure range studied.329 In addition, mixed-gas data for KAUST-PI-1 was on the C3H6/C3H8 pure-gas upper bound, while pure-gas data exceeded the upper bound.329,330 Another triptycene-containing polymer, PMDA-DAT (Fig. 26), was also studied for its plasticization resistance.331 pure-gas permeability measurements found that PMDA-DAT had a CO2 plasticization pressure of around 15 bar.331 PIM-TMN-Trip, another PIM with a triptycene unit in the backbone, did not show obvious CO2-induced plasticization effects when exposed to a feed mixture of 22.2 vol% CO2, 6.8 vol% O2, 70.2 vol% N2, and 2220 ppm SO2 over a trans-membrane pressure difference from 1 to 4 bar.332 However, as the CO2 partial pressure was limited to less than 4 bar, plasticization may not have been observed, which would necessitate tests at higher feed pressures, if required for the application.
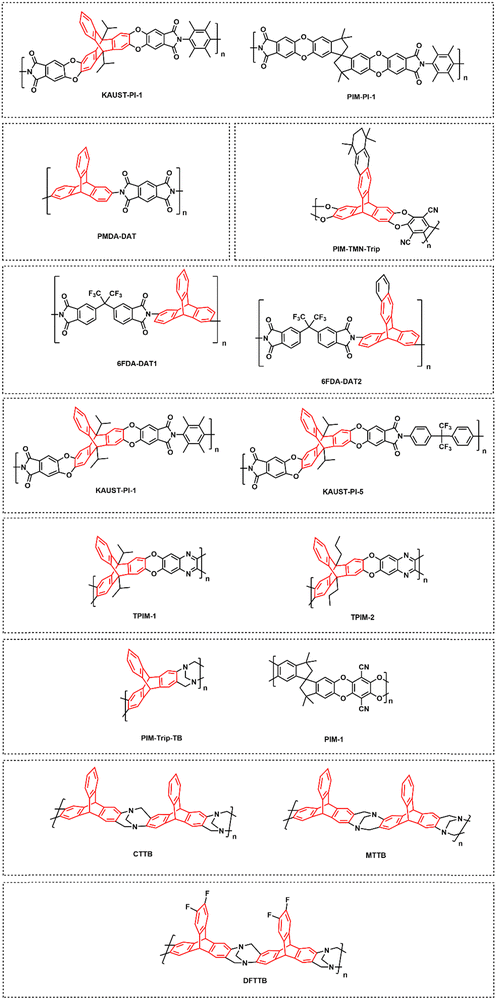 | ||
| Fig. 26 Chemical structures of polymers of intrinsic microporosity containing triptycene (red) and analogous structures, for studies that reported pure-gas pressurization studies and/or mixed-gas permeation.20,22,23,33–43 | ||
Triptycene and an extended iptycene were compared in the forms of 6FDA-DAT1 and 6FDA-DAT2, respectively (Fig. 26), and it was found that 6FDA-DAT2 contained larger micropores due to the bulkier nature of the extended iptycene.333 In terms of gas transport properties, both polymers experienced CO2-induced plasticization when exposed to a mixture feed of 50![[thin space (1/6-em)]](https://www.rsc.org/images/entities/char_2009.gif) :
:![[thin space (1/6-em)]](https://www.rsc.org/images/entities/char_2009.gif) 50 CO2/CH4 up to a CO2 partial pressure of 16 bar, as evident from the increase in both CO2 and CH4 permeability with increasing feed pressure.333
50 CO2/CH4 up to a CO2 partial pressure of 16 bar, as evident from the increase in both CO2 and CH4 permeability with increasing feed pressure.333
Several other studies have shown that solely increasing the intrachain rigidity to mitigate plasticization may not be effective.28,90,334–336 In 2014, Swaidan et al. examined the gas transport properties of two triptycene-based intrinsically microporous polyimides, KAUST-PI-1 (TPDA-TMPD) and KAUST-PI-5 (TPDA-6FpDA) (Fig. 26).90 When comparing the degrees of torsional freedom at 35 °C for the characteristic highlighted bonds in Fig. 27a and Fig. 27b, it was found that KAUST-PI-5, which contains the 6FpDA diamine, exhibits more torsional freedom due to (a) the non-substituted N-phenyl-imide bond and (b) the single bonds between the phenyl rings. Thus, it was expected that KAUST-PI-1 would exhibit higher plasticization resistance due to its increased backbone rigidity and reduced rotational mobility.
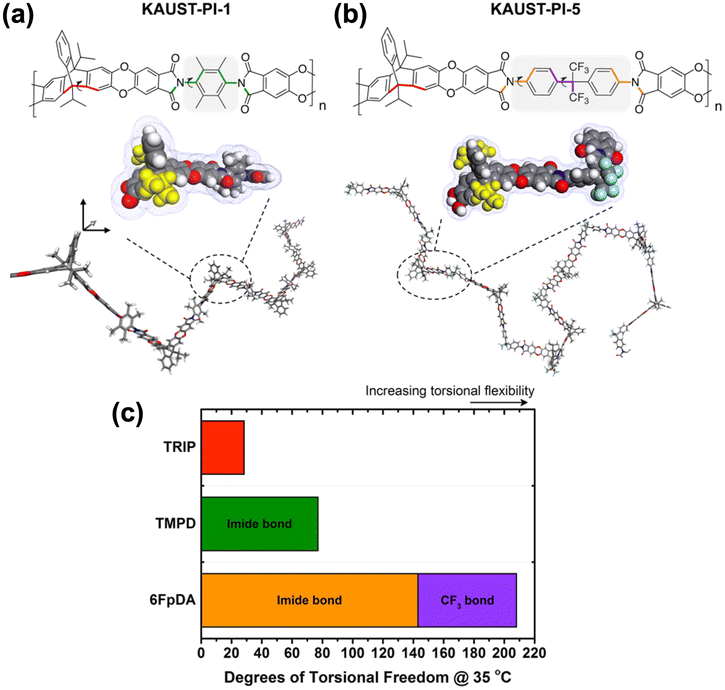 | ||
| Fig. 27 Energy-minimized structures (forcite module, materials studio 7.0, accelrys) of (a) KAUST-PI-1 (TPDA-TMPD), and (b) KAUST-PI-5 (TPDA-6FpDA). (c) Degrees of torsional freedom at 35 °C are measured for bonds of interest highlighted in red, green, orange, and purple. Adapted with permission from ref. 90 (Copyright American Chemical Society, 2014). | ||
While the more flexible KAUST-PI-5 exhibited a plasticization pressure at 10 bar CO2 partial pressure in both pure- and mixed-gas (50![[thin space (1/6-em)]](https://www.rsc.org/images/entities/char_2009.gif) :
:![[thin space (1/6-em)]](https://www.rsc.org/images/entities/char_2009.gif) 50 CO2/CH4 mixture) tests, KAUST-PI-1 showed significant effects from plasticization, as indicated by an immediate rise in CO2 permeability with pressure in both pure- and mixed-gas tests.90 Thus, it was concluded that intrachain rigidity alone is insufficient to mitigate plasticization and, instead, intrachain flexibility could actually result in changes in polymer conformation to help suppress plasticization. In the case of KAUST-PI-5, for example, flexible backbones can coplanarize and assume a denser packing configuration, leading to interchain interactions that subsequently restrict chain mobility.90 Thus, establishing a balance between intrachain and interchain rigidity can lead to plasticization-resistant membranes.
50 CO2/CH4 mixture) tests, KAUST-PI-1 showed significant effects from plasticization, as indicated by an immediate rise in CO2 permeability with pressure in both pure- and mixed-gas tests.90 Thus, it was concluded that intrachain rigidity alone is insufficient to mitigate plasticization and, instead, intrachain flexibility could actually result in changes in polymer conformation to help suppress plasticization. In the case of KAUST-PI-5, for example, flexible backbones can coplanarize and assume a denser packing configuration, leading to interchain interactions that subsequently restrict chain mobility.90 Thus, establishing a balance between intrachain and interchain rigidity can lead to plasticization-resistant membranes.
In 2015, Swaidan et al. continued this study by comparing the effects of plasticization on gas transport properties in PIM-1 and two triptycene-based ladder polymers, TPIM-1 and TPIM-2 (Fig. 26).28 When comparing the degrees of torsional freedom at 35 °C for representative PIMs, it was found that TPIM-1 contains higher intrachain rigidity compared to PIM-1 due to the presence of the rigid triptycene group in its backbone (Fig. 28).28 However, when measuring mixed-gas permeability (50![[thin space (1/6-em)]](https://www.rsc.org/images/entities/char_2009.gif) :
:![[thin space (1/6-em)]](https://www.rsc.org/images/entities/char_2009.gif) 50 CO2/CH4 mixture) at 10 bar CO2 partial pressure, TPIM-1 experienced a 93% increase in CH4 permeability compared to pure-gas permeability at a feed pressure of 10 bar, while PIM-1 experienced a 62% increase.28 This increase in CH4 permeability is an indication of CO2-induced plasticization despite the high intrachain rigidity of TPIM-1. TPIM-2, instead, plasticized less readily than TPIM-1, showing less than a 10% increase in CH4 permeability from the pure- to mixed-gas test up to a CO2 partial pressure of 15 bar.28 The authors investigated the potential origin of this difference in plasticization susceptibility through transport analysis. TPIM-1 possessed higher O2 permeability and O2/N2 selectivity than TPIM-2, suggesting a highly ultra-microporous, size-sieving pore structure with a significant amount of pores around the sizes of O2 and N2 at 3–4 Å.28 If such pores are dilated during exposure to CO2 at higher pressures, both CO2 (dk = 3.3 Å) and CH4 (dk = 3.8 Å) diffusivities will be significantly affected.15,28 This hypothesis is illustrated further in Fig. 29.
50 CO2/CH4 mixture) at 10 bar CO2 partial pressure, TPIM-1 experienced a 93% increase in CH4 permeability compared to pure-gas permeability at a feed pressure of 10 bar, while PIM-1 experienced a 62% increase.28 This increase in CH4 permeability is an indication of CO2-induced plasticization despite the high intrachain rigidity of TPIM-1. TPIM-2, instead, plasticized less readily than TPIM-1, showing less than a 10% increase in CH4 permeability from the pure- to mixed-gas test up to a CO2 partial pressure of 15 bar.28 The authors investigated the potential origin of this difference in plasticization susceptibility through transport analysis. TPIM-1 possessed higher O2 permeability and O2/N2 selectivity than TPIM-2, suggesting a highly ultra-microporous, size-sieving pore structure with a significant amount of pores around the sizes of O2 and N2 at 3–4 Å.28 If such pores are dilated during exposure to CO2 at higher pressures, both CO2 (dk = 3.3 Å) and CH4 (dk = 3.8 Å) diffusivities will be significantly affected.15,28 This hypothesis is illustrated further in Fig. 29.
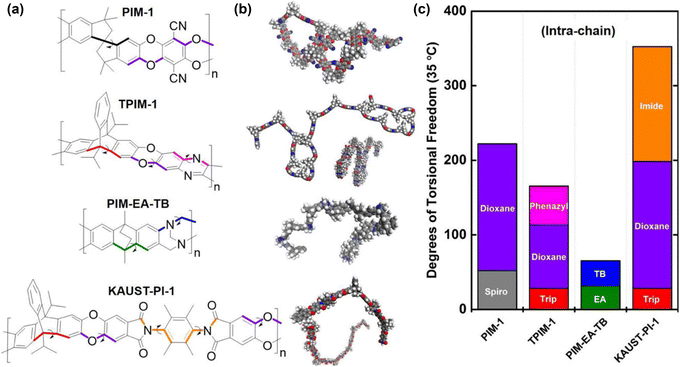 | ||
| Fig. 28 (a) Chemical structures, (b) energy-minimized chain conformations developed from Materials Studio, Accelrys, 7.0, and (c) degrees of torsional freedom at 35 °C in one repeat unit. Adapted with permission from ref. 28 (Copyright American Chemical Society, 2015). | ||
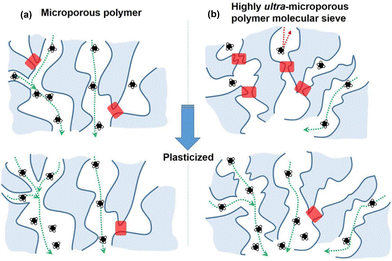 | ||
| Fig. 29 A schematic detailing a higher sensitivity of high ultra-microporous polymers to CO2-induced plasticization. Adapted with permission from ref. 28 (Copyright American Chemical Society, 2015). | ||
Genduso et al. also examined the effects of intrachain rigidity on plasticization resistance by conducting mixed-gas permeability experiments on PIM-Trip-TB, PIM-1, and 6FDA-mPDA (Fig. 26).334 At ∼10 bar CO2 partial fugacity in a 50![[thin space (1/6-em)]](https://www.rsc.org/images/entities/char_2009.gif) :
:![[thin space (1/6-em)]](https://www.rsc.org/images/entities/char_2009.gif) 50 mol% CO2/CH4 mixture, it was found that the CH4 diffusion coefficients for PIM-1 and PIM-Trip-TB were 1.4 and 2.2 times higher than those for 6FDA-mPDA.334 From this result, the authors concluded that intrachain rigidity alone found in PIM structures cannot suppress CO2-induced plasticization.334
50 mol% CO2/CH4 mixture, it was found that the CH4 diffusion coefficients for PIM-1 and PIM-Trip-TB were 1.4 and 2.2 times higher than those for 6FDA-mPDA.334 From this result, the authors concluded that intrachain rigidity alone found in PIM structures cannot suppress CO2-induced plasticization.334
Zhu et al. synthesized and characterized two different regioisomers of triptycene-containing TB-based polymers, CTTB and MTTB, with ITTB being a 50![[thin space (1/6-em)]](https://www.rsc.org/images/entities/char_2009.gif) :
:![[thin space (1/6-em)]](https://www.rsc.org/images/entities/char_2009.gif) 50 mixture of the two (Fig. 26), and found that there was a 30–50% increase in CO2 and CH4 permeability for all three polymers compared to pure-gas experiments at feed pressures from 2 to 16 bar.335 Although CTTB, MTTB, and ITTB possessed both triptycene and TB, the polymers still experienced CO2-induced plasticization,335 solidifying the hypothesis that intrachain rigidity alone may not suppress plasticization.
50 mixture of the two (Fig. 26), and found that there was a 30–50% increase in CO2 and CH4 permeability for all three polymers compared to pure-gas experiments at feed pressures from 2 to 16 bar.335 Although CTTB, MTTB, and ITTB possessed both triptycene and TB, the polymers still experienced CO2-induced plasticization,335 solidifying the hypothesis that intrachain rigidity alone may not suppress plasticization.
Ma et al. generated a fluorine-functionalized triptycene-containing TB-based polymer known as DFTTB (Fig. 26).336 When increasing the upstream pure-gas CO2 pressure, the CO2 permeability of DFTTB decreased around 4% from 2 to 5 bar.336 However, from 5 to 15 bar, DFTTB experienced an approximately 30% increase in CO2 permeability.336 When mixed-gas tests (50![[thin space (1/6-em)]](https://www.rsc.org/images/entities/char_2009.gif) :
:![[thin space (1/6-em)]](https://www.rsc.org/images/entities/char_2009.gif) 50 CO2/CH4 mixture) were conducted from a feed pressure of 2 to 20 bar on DFTTB, the CO2/CH4 selectivity decreased from 28.1 to 18.9, and the CH4 permeability increased from 82 barrer to 119 barrer, once again indicating CO2-induced plasticization in structures with intrachain rigidity.336 Still, at a CO2 partial pressure of 10 bar, DFTTB exhibited a CO2/CH4 selectivity of 18.9 and a CO2 permeability of 2253 barrer, which lies above the 2018 CO2/CH4 mixed-gas upper bound337 and renders DFTTB as a promising candidate for natural gas purification.336
50 CO2/CH4 mixture) were conducted from a feed pressure of 2 to 20 bar on DFTTB, the CO2/CH4 selectivity decreased from 28.1 to 18.9, and the CH4 permeability increased from 82 barrer to 119 barrer, once again indicating CO2-induced plasticization in structures with intrachain rigidity.336 Still, at a CO2 partial pressure of 10 bar, DFTTB exhibited a CO2/CH4 selectivity of 18.9 and a CO2 permeability of 2253 barrer, which lies above the 2018 CO2/CH4 mixed-gas upper bound337 and renders DFTTB as a promising candidate for natural gas purification.336
The effects of additional chemical moieties on intrachain rigidity and gas transport properties have also been studied. Using superacid-catalyzed hydroxyalkylation Friedel–Crafts polymerization, Cai et al. synthesized a series of microporous polymers named SACP-1 (BET surface area = 307 m2 g−1), SACP-2 (BET surface area = 273 m2 g−1), and SACP-3 (BET surface area = 568 m2 g−1) (Fig. 30).338 When mixed-gas tests (50![[thin space (1/6-em)]](https://www.rsc.org/images/entities/char_2009.gif) :
:![[thin space (1/6-em)]](https://www.rsc.org/images/entities/char_2009.gif) 50 vol% CO2/CH4) were performed with total feed pressures ranging from 4 to 40 bar, it was found that while SACP-1 and SACP-2 experienced a 34% and 40% decrease in CO2/CH4 selectivity, respectively, SACP-3 experienced only a 29% decrease in CO2/CH4 permselectivity.338 The authors ascribed the superior plasticization resistance of SACP-3 to its increased chain rigidity from the presence of spirobisindane moieties, as well as its micropore architecture, which consists of micropores larger than the kinetic diameter of CH4.338 Dilation of these micropores would thus not affect CH4 permeability as much.338
50 vol% CO2/CH4) were performed with total feed pressures ranging from 4 to 40 bar, it was found that while SACP-1 and SACP-2 experienced a 34% and 40% decrease in CO2/CH4 selectivity, respectively, SACP-3 experienced only a 29% decrease in CO2/CH4 permselectivity.338 The authors ascribed the superior plasticization resistance of SACP-3 to its increased chain rigidity from the presence of spirobisindane moieties, as well as its micropore architecture, which consists of micropores larger than the kinetic diameter of CH4.338 Dilation of these micropores would thus not affect CH4 permeability as much.338
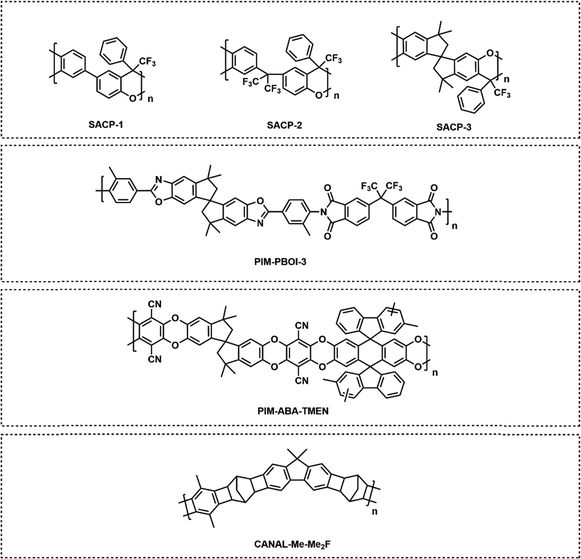 | ||
| Fig. 30 Chemical structures of polymers of intrinsic microporosity containing other rigidifying backbone moieities for studies that reported pure-gas pressurization studies and/or mixed-gas permeation.338–341 | ||
Chen et al. studied the plasticization resistance of PIM-PBOI-3 (Fig. 30) before and after thermal annealing at 400 °C.339 Both the unannealed and thermally-annealed PIM-PBOI-3 exhibited a pure-gas CO2 plasticization pressure of ∼10 bar, but the CO2/CH4 selectivity of the annealed PIM-PBOI-3 decreased by only 13.8% from 28.6 at a feed pressure of 1 bar to 24.7 at a feed pressure of 30 bar.339 In contrast, the CO2/CH4 selectivity of the unannealed PIM-PBOI-3 dropped by ∼40.9% from 23.2 at a feed pressure of 1 bar to ∼13.7 at a feed pressure of 30 bar.339 The authors attributed the improved plasticization resistance of the thermally-annealed PIM-PBOI-3 to potential crosslinking,339 which is a plasticization mitigation method that will be discussed in further detail in Section 4.2.2.
The gas transport properties of PIM-ABAs, which contain difluorenylanthracene-based moieties, synthesized by Han et al. were also reported.340 Mixed-gas (15![[thin space (1/6-em)]](https://www.rsc.org/images/entities/char_2009.gif) :
:![[thin space (1/6-em)]](https://www.rsc.org/images/entities/char_2009.gif) 85 CO2/N2) data of PIM-ABA-TMEN (BET surface area = 952 m2 g−1) (Fig. 30) at a total upstream feed pressure of 2 to 15 bar was collected. The mixed-gas CO2 permeability of PIM-ABA-TMEN increased very slightly from 9191.50 barrer at a total feed pressure of 2 bar to 9242.50 barrer at a total feed pressure of 15 bar, indicating a less than 1% increase over the pressure range considered.340 In addition, the mixed-gas CO2/N2 selectivity increased slightly from 19.63 to 21.20, representing an 8% increase over the pressure range considered.340
85 CO2/N2) data of PIM-ABA-TMEN (BET surface area = 952 m2 g−1) (Fig. 30) at a total upstream feed pressure of 2 to 15 bar was collected. The mixed-gas CO2 permeability of PIM-ABA-TMEN increased very slightly from 9191.50 barrer at a total feed pressure of 2 bar to 9242.50 barrer at a total feed pressure of 15 bar, indicating a less than 1% increase over the pressure range considered.340 In addition, the mixed-gas CO2/N2 selectivity increased slightly from 19.63 to 21.20, representing an 8% increase over the pressure range considered.340
Polymers developed via catalytic arene–norbornene annulation (CANAL) polymerization have also shown promising plasticization resistance. Mixed-gas permeation for CO2/CH4 (50![[thin space (1/6-em)]](https://www.rsc.org/images/entities/char_2009.gif) :
:![[thin space (1/6-em)]](https://www.rsc.org/images/entities/char_2009.gif) 50) of one such polymer developed in 2022, known as CANAL-Me-Me2F (Fig. 30), was evaluated. It was found that the mixed-gas selectivity remained above 35 even at 14 bar of CO2 partial pressure, significantly exceeding the 2018 CO2/CH4 mixed-gas upper bound. The authors attributed this high performance to the 3D backbone contortions of CANAL polymers contributing to high gas selectivity.137,341
50) of one such polymer developed in 2022, known as CANAL-Me-Me2F (Fig. 30), was evaluated. It was found that the mixed-gas selectivity remained above 35 even at 14 bar of CO2 partial pressure, significantly exceeding the 2018 CO2/CH4 mixed-gas upper bound. The authors attributed this high performance to the 3D backbone contortions of CANAL polymers contributing to high gas selectivity.137,341
Abdulhamid et al. demonstrated that a trimethyl-functional polyimide with substituted carboxylic acid (6FDA-TrMCA, BET surface area = 260 m2 g−1) had higher CO2/CH4 selectivity (both in the pure- and equimolar mixed-gas cases) than the unsubstituted 6FDA-TrMPD analog (BET surface area = 450 m2 g−1). While these polymers have classically been defined as non-porous,350,351 we choose to include them in this review because of their reported BET surface areas. This unambiguous structure–property study suggests that the presence of –COOH functionality leads to interchain hydrogen bonding and charge transfer complex (CTC) formation, two key features that correlate with increased interchain rigidity.342 Note that TrMPD is also referred to as 2,4-diaminomesitylene (DAM) in the membrane literature.342,352,353 Both structures, as presented in Fig. 31, have been investigated for plasticization.342 At ∼2 bar CO2 partial pressure, the mixed-gas selectivity of 6FDA-TrMPD was almost 10% higher than its pure-gas selectivity, while the mixed-gas selectivity of 6FDA-TrMCA was about 7% higher than its pure-gas selectivity.342 Similarly, at ∼15 bar CO2 partial pressure, the mixed-gas selectivity of 6FDA-TrMPD was about 15% higher than its pure-gas selectivity, while the mixed-gas selectivity of 6FDA-TrMCA was about 2% higher than its pure-gas selectivity.342 Such effects are typically associated with competitive sorption354–356 and also suggest plasticization resistance since selectivity was not compromised at higher feed pressures.342 However, Mizrahi Rodriguez et al. found that the pure-gas CO2 plasticization pressure of PIM-COOH (∼5 bar) was lower than that of PIM-1 (∼15 bar), despite the former being a carboxylic acid-functionalized version of the latter.138 The structures of PIM-COOH (BET surface area = 373 m2 g−1) and PIM-1 (BET surface area = 886 m2 g−1) are shown in Fig. 31. The authors attributed this unexpected result to a potential disruption of secondary interactions when exposed to CO2, which subsequently can lead to increased free volume and higher CO2 diffusion at higher pressures.138 In addition, mixed-gas (50![[thin space (1/6-em)]](https://www.rsc.org/images/entities/char_2009.gif) :
:![[thin space (1/6-em)]](https://www.rsc.org/images/entities/char_2009.gif) 50 CO2/CH4) data was collected for PIM-COOH below and above the pure-gas plasticization pressure of ∼5 bar (∼1 bar and ∼7 bar CO2 partial pressure).138 While the mixed-gas CO2/CH4 selectivity for PIM-COOH at ∼1 bar CO2 partial pressure was higher than that at ∼7 bar CO2 partial pressure, suggesting plasticization, PIM-COOH still displayed excellent transport properties that lied on the 2018 mixed-gas upper bound.138,337
50 CO2/CH4) data was collected for PIM-COOH below and above the pure-gas plasticization pressure of ∼5 bar (∼1 bar and ∼7 bar CO2 partial pressure).138 While the mixed-gas CO2/CH4 selectivity for PIM-COOH at ∼1 bar CO2 partial pressure was higher than that at ∼7 bar CO2 partial pressure, suggesting plasticization, PIM-COOH still displayed excellent transport properties that lied on the 2018 mixed-gas upper bound.138,337
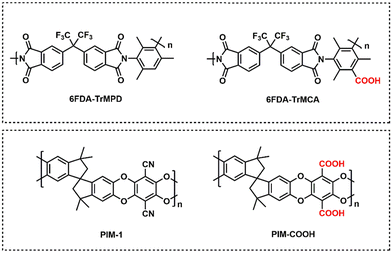 | ||
| Fig. 31 Chemical structures of polymers of intrinsic microporosity containing carboxylic acid functionality (along with non-functionalized counterparts) that reported pure-gas pressurization studies and/or mixed-gas permeation.138,342 | ||
A number of plasticization studies have also been performed on hydroxyl-functionalized PIMs, and these structures are presented in Fig. 32. When comparing the hydroxyl-functionalized TPDA-DAR to its non-functionalized analog (TPDA-mPDA), Alaslai et al. found that TPDA-DAR exhibited higher CO2/CH4 selectivity than TPDA-mPDA in both the pure- and mixed-gas (50![[thin space (1/6-em)]](https://www.rsc.org/images/entities/char_2009.gif) :
:![[thin space (1/6-em)]](https://www.rsc.org/images/entities/char_2009.gif) 50 vol% CO2/CH4) scenarios up to a CO2 partial pressure of ∼20 bar.343 For instance, at a CO2 partial pressure of ∼20 bar, both the pure- and mixed-gas selectivity of TPDA-DAR were about 65% higher than that of TPDA-mPDA.343 This finding can be explained from the higher BET surface area found in TPDA-mPDA (565 m2 g−1) versus that of TPDA-DAR (308 m2 g−1), due to the presence of hydrogen bonds in the latter sample that increased CTC formation and tighter chain packing.343 Both polymers displayed excellent plasticization resistance, as evident from the absence of an increase in either CO2 or CH4 permeability up to a CO2 partial pressure of ∼20 bar in both the pure- and mixed-gas cases.343 Additionally, while the CO2/CH4 selectivity of both polymers decreased with increasing CO2 partial pressure for both pure- and mixed-gas cases, the mixed-gas CO2/CH4 selectivity and CO2 permeability of TPDA-DAR was 38 and 140 barrer, respectively, at a partial CO2 pressure of ∼10 bar. This result lies on the 2018 mixed-gas upper bound337 and thus indicates promising gas separation properties.343
50 vol% CO2/CH4) scenarios up to a CO2 partial pressure of ∼20 bar.343 For instance, at a CO2 partial pressure of ∼20 bar, both the pure- and mixed-gas selectivity of TPDA-DAR were about 65% higher than that of TPDA-mPDA.343 This finding can be explained from the higher BET surface area found in TPDA-mPDA (565 m2 g−1) versus that of TPDA-DAR (308 m2 g−1), due to the presence of hydrogen bonds in the latter sample that increased CTC formation and tighter chain packing.343 Both polymers displayed excellent plasticization resistance, as evident from the absence of an increase in either CO2 or CH4 permeability up to a CO2 partial pressure of ∼20 bar in both the pure- and mixed-gas cases.343 Additionally, while the CO2/CH4 selectivity of both polymers decreased with increasing CO2 partial pressure for both pure- and mixed-gas cases, the mixed-gas CO2/CH4 selectivity and CO2 permeability of TPDA-DAR was 38 and 140 barrer, respectively, at a partial CO2 pressure of ∼10 bar. This result lies on the 2018 mixed-gas upper bound337 and thus indicates promising gas separation properties.343
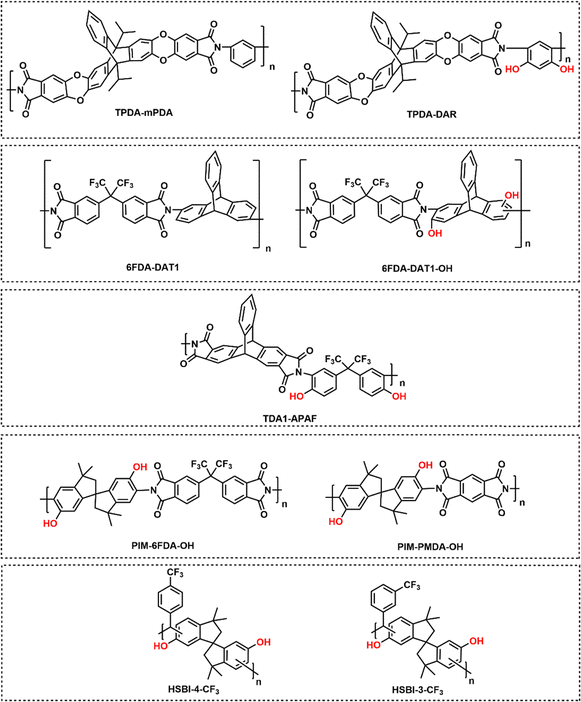 | ||
| Fig. 32 Chemical structures of polymers of intrinsic microporosity containing hydroxyl functionality (along with non-functionalized counterparts), for studies that reported pure-gas pressurization studies and/or mixed-gas permeation.343–346,357 | ||
Alaslai et al. also compared 6FDA-DAT1-OH with its non-functionalized analog 6FDA-DAT1 (Fig. 32) and found that the former had a pure-gas CO2 permeability of 70 barrer and a CO2/CH4 selectivity of 50, while the latter had a pure-gas CO2 permeability and a CO2/CH4 selectivity of 120 barrer and 38, respectively.344 The decrease in permeability and increase in selectivity with hydroxyl-functionalization can be attributed to the lower BET surface area of 6FDA-DAT1-OH (160 m2 g−1) compared to that of 6FDA-DAT1 (320 m2 g−1), which results from strong CTC formation that could occur because of hydrogen bonding tightening the polymer microstructure.344 In addition, 6FDA-DAT1-OH did not exhibit a CO2 plasticization pressure up to 20 bar CO2 partial pressure in either the pure- or mixed-gas (1![[thin space (1/6-em)]](https://www.rsc.org/images/entities/char_2009.gif) :
:![[thin space (1/6-em)]](https://www.rsc.org/images/entities/char_2009.gif) 1 molar ratio CO2/CH4) scenario while maintaining a mixed-gas CO2 permeability of 50 barrer and a CO2/CH4 selectivity of 40 at a CO2 partial pressure of 10 bar, indicating strong plasticization resistance.344
1 molar ratio CO2/CH4) scenario while maintaining a mixed-gas CO2 permeability of 50 barrer and a CO2/CH4 selectivity of 40 at a CO2 partial pressure of 10 bar, indicating strong plasticization resistance.344
Alghunaimi et al. synthesized the hydroxyl-functionalized PIM-polyimide (PIM-PI) TDA1-APAF (BET surface area = 260 m2 g−1) (Fig. 32), which exhibited a pure-gas CO2 permeability of 44 barrer and a CO2/CH4 selectivity of 55 at a feed pressure of 2 bar.345 In both the pure- and mixed-gas (1![[thin space (1/6-em)]](https://www.rsc.org/images/entities/char_2009.gif) :
:![[thin space (1/6-em)]](https://www.rsc.org/images/entities/char_2009.gif) 1 CO2/CH4 mixture) cases, TDA1-APAF did not show a CO2 plasticization pressure up to 15 bar CO2 partial pressure345 and displayed a mixed-gas CO2/CH4 selectivity of ∼45 at 15 bar CO2 partial pressure,345 which shows promise for plasticization resistance. Similarly, Ma et al. demonstrated that both PIM-6FDA-OH (BET surface area = 225 m2 g−1) and PIM-PMDA-OH (BET surface area = 190 m2 g−1) (Fig. 32) had high mixed-gas CO2/CH4 selectivity (>20) even at a high CO2 partial pressure of 20 bar for a 1
1 CO2/CH4 mixture) cases, TDA1-APAF did not show a CO2 plasticization pressure up to 15 bar CO2 partial pressure345 and displayed a mixed-gas CO2/CH4 selectivity of ∼45 at 15 bar CO2 partial pressure,345 which shows promise for plasticization resistance. Similarly, Ma et al. demonstrated that both PIM-6FDA-OH (BET surface area = 225 m2 g−1) and PIM-PMDA-OH (BET surface area = 190 m2 g−1) (Fig. 32) had high mixed-gas CO2/CH4 selectivity (>20) even at a high CO2 partial pressure of 20 bar for a 1![[thin space (1/6-em)]](https://www.rsc.org/images/entities/char_2009.gif) :
:![[thin space (1/6-em)]](https://www.rsc.org/images/entities/char_2009.gif) 1 molar ratio.346 More recently, in 2022, Weng et al. synthesized HSBI-4-CF3 (BET surface area = 318 m2 g−1) and HSBI-3-CF3 (BET surface area = 287 m2 g−1) (Fig. 32), two hydroxyl-functionalized PIMs via a Friedel–Crafts polycondensation reaction.357 Both the pure-gas CO2 and CH4 permeabilities of HSBI-4-CF3 and HSBI-3-CF3 continuously decreased with increasing feed pressure from 2 to 18 bar, indicating strong plasticization resistance that can be attributed to hydrogen bonding between the hydroxyl groups.357
1 molar ratio.346 More recently, in 2022, Weng et al. synthesized HSBI-4-CF3 (BET surface area = 318 m2 g−1) and HSBI-3-CF3 (BET surface area = 287 m2 g−1) (Fig. 32), two hydroxyl-functionalized PIMs via a Friedel–Crafts polycondensation reaction.357 Both the pure-gas CO2 and CH4 permeabilities of HSBI-4-CF3 and HSBI-3-CF3 continuously decreased with increasing feed pressure from 2 to 18 bar, indicating strong plasticization resistance that can be attributed to hydrogen bonding between the hydroxyl groups.357
Amidoxime functionalization of PIM-1 (listed as AO-PIM-1 (Fig. 33)) has also shown promising plasticization resistance, as it can rigidify the polymer matrix and introduce more microporosity due to intermolecular hydrogen bonding.347 Swaidan et al. found that AO-PIM-1 (BET surface area = 482 m2 g−1) had a three-fold increase in pure-gas CO2/CH4 diffusivity selectivity over PIM-1 (BET surface area = 768 m2 g−1) with comparable solubility selectivity.347 In addition, the mixed-gas CO2/CH4 (50![[thin space (1/6-em)]](https://www.rsc.org/images/entities/char_2009.gif) :
:![[thin space (1/6-em)]](https://www.rsc.org/images/entities/char_2009.gif) 50 CO2/CH4 mixture) selectivity of AO-PIM-1 decreased by about 13% from ∼23.7 at a total feed pressure of 4 bar to ∼21 at a total feed pressure of 20 bar.347 For PIM-1, the mixed-gas selectivity decreased by about 60% under similar conditions to ∼8 at a total feed pressure of 20 bar due to the significant increase in CH4 diffusion coefficients from CO2-induced swelling.347 These results suggest that amidoxime functionalization can lead to plasticization resistance.347 AO-PIM-1 was also examined for its efficacy in sour gas separations by Yi et al., and it was found that when the polymer was exposed to a ternary feed mixture of 20% H2S, 20% CO2, and 60% CH4 at 35 °C, the CO2/CH4 selectivity was relatively stable up to a total feed pressure of 80 bar, while H2S/CH4 selectivity increased from 50 at a total feed pressure of 10 bar to ∼70 at a total feed pressure of 80 bar.348 This suggests some degree of plasticization with H2S.
50 CO2/CH4 mixture) selectivity of AO-PIM-1 decreased by about 13% from ∼23.7 at a total feed pressure of 4 bar to ∼21 at a total feed pressure of 20 bar.347 For PIM-1, the mixed-gas selectivity decreased by about 60% under similar conditions to ∼8 at a total feed pressure of 20 bar due to the significant increase in CH4 diffusion coefficients from CO2-induced swelling.347 These results suggest that amidoxime functionalization can lead to plasticization resistance.347 AO-PIM-1 was also examined for its efficacy in sour gas separations by Yi et al., and it was found that when the polymer was exposed to a ternary feed mixture of 20% H2S, 20% CO2, and 60% CH4 at 35 °C, the CO2/CH4 selectivity was relatively stable up to a total feed pressure of 80 bar, while H2S/CH4 selectivity increased from 50 at a total feed pressure of 10 bar to ∼70 at a total feed pressure of 80 bar.348 This suggests some degree of plasticization with H2S.
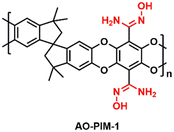 | ||
| Fig. 33 Chemical structure of AO-PIM-1, a polymer of intrinsic microporosity containing amidoxime functionalization (highlighted in red).347,348 | ||
Satilmis et al. synthesized an amine-functionalized version of PIM-1, named amine-PIM-1 (Fig. 34).358 This structure is often referred to as PIM-NH2.38,142 Post-synthetic modification reactions reached 93% conversion from the cyano group in PIM-1 to an amine group. For gas permeation testing, increasing the feed pressure of CO2 from 0.2 to 1 bar resulted in a decreased permeability from ∼1400 to ∼800 barrer, while—interestingly—CO2 diffusivity increased by almost 60%.358 This unusual transport behavior warrants further investigation to understand the role of amine functionality on CO2 transport and plasticization resistance in these microporous polymers.
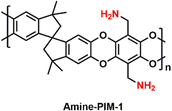 | ||
| Fig. 34 Chemical structure of amine-PIM-1, a polymer of intrinsic microporosity containing amine functionalization (highlighted in red).358 | ||
In addition to introducing hydroxyl groups to facilitate CTC formation, thermal annealing has been used to further supplement interchain hydrogen bonding with CTCs, allowing polymer chains to relax into a denser structure.34,48,159 Swaidan et al. thermally annealed PIM-6FDA-OH (Fig. 35) at 250 °C for 24 h, which resulted in enhanced interchain hydrogen bonding with CTCs.159 In the pure-gas case, no observable C3H6 plasticization pressure was found in the thermally-annealed PIM-6FDA-OH sample up to a feed pressure of 5.0 bar, while PIM-6FDA-OH without thermal annealing had a C3H6 plasticization pressure of ∼3.0 bar.159 In the mixed-gas case (50![[thin space (1/6-em)]](https://www.rsc.org/images/entities/char_2009.gif) :
:![[thin space (1/6-em)]](https://www.rsc.org/images/entities/char_2009.gif) 50 C3H6/C3H8), thermally-annealed PIM-6FDA-OH did not exhibit a plasticization pressure up to a C3H6 partial feed pressure of 2.5 bar, while PIM-6FDA-OH without thermal annealing showed a C3H6 plasticization pressure of ∼2.0 bar.159 In addition, thermal annealing of PIM-6FDA-OH still resulted in a 50% increase in C3H6/C3H8 selectivity in both pure- and mixed-gas cases.159 Yi et al. also thermally annealed PIM-6FDA-OH using the same procedure, but studied this polymer for sour gas separations.48 They found that in pure-gas tests, the H2S plasticization pressure was around 4.5 bar and the CO2 plasticization pressure was greater than 28 bar for thermally-annealed PIM-6FDA-OH.48 In addition, in mixed-gas tests (15% H2S, 15% CO2, 70% CH4), thermally-annealed PIM-6FDA-OH maintained an excellent CO2/CH4 selectivity (∼25) even at a total feed pressure of nearly 50 bar, while H2S/CH4 selectivity reached up to 30 at a total pressure of nearly 50 bar.48
50 C3H6/C3H8), thermally-annealed PIM-6FDA-OH did not exhibit a plasticization pressure up to a C3H6 partial feed pressure of 2.5 bar, while PIM-6FDA-OH without thermal annealing showed a C3H6 plasticization pressure of ∼2.0 bar.159 In addition, thermal annealing of PIM-6FDA-OH still resulted in a 50% increase in C3H6/C3H8 selectivity in both pure- and mixed-gas cases.159 Yi et al. also thermally annealed PIM-6FDA-OH using the same procedure, but studied this polymer for sour gas separations.48 They found that in pure-gas tests, the H2S plasticization pressure was around 4.5 bar and the CO2 plasticization pressure was greater than 28 bar for thermally-annealed PIM-6FDA-OH.48 In addition, in mixed-gas tests (15% H2S, 15% CO2, 70% CH4), thermally-annealed PIM-6FDA-OH maintained an excellent CO2/CH4 selectivity (∼25) even at a total feed pressure of nearly 50 bar, while H2S/CH4 selectivity reached up to 30 at a total pressure of nearly 50 bar.48
In a study by Swaidan et al., the effects of thermal annealing at 250 °C on the hydroxyl-functionalized TPDA-APAF and methyl-functionalized TPDA-ATAF (Fig. 35) were investigated.34 Without thermal annealing, both TPDA-APAF and TPDA-ATAF experienced increases in CO2 and CH4 permeability in the mixed-gas (50![[thin space (1/6-em)]](https://www.rsc.org/images/entities/char_2009.gif) :
:![[thin space (1/6-em)]](https://www.rsc.org/images/entities/char_2009.gif) 50 CO2/CH4) case, along with observable CO2 plasticization pressures of 10 bar for both polymers in pure- and mixed-gas cases.34 However, when the polymers were thermally annealed, CO2 and CH4 permeabilities, in both the pure- and mixed-gas cases, were relatively consistent up to a CO2 partial pressure of 25 bar, with TPDA-APAF exhibiting lower CO2 permeability but higher CO2/CH4 selectivity due to hydroxyl functionality.34 Examples involving more intensive thermal treatments that lead to changes in chemical structure (such as thermal rearrangement, carbon molecular sieve formation, and crosslinking) will be discussed in Section 4.2.
50 CO2/CH4) case, along with observable CO2 plasticization pressures of 10 bar for both polymers in pure- and mixed-gas cases.34 However, when the polymers were thermally annealed, CO2 and CH4 permeabilities, in both the pure- and mixed-gas cases, were relatively consistent up to a CO2 partial pressure of 25 bar, with TPDA-APAF exhibiting lower CO2 permeability but higher CO2/CH4 selectivity due to hydroxyl functionality.34 Examples involving more intensive thermal treatments that lead to changes in chemical structure (such as thermal rearrangement, carbon molecular sieve formation, and crosslinking) will be discussed in Section 4.2.
![[thin space (1/6-em)]](https://www.rsc.org/images/entities/char_2009.gif) :
:![[thin space (1/6-em)]](https://www.rsc.org/images/entities/char_2009.gif) 50 CO2/CH4 feed at a CO2 partial pressure of up to ∼9 bar, the CO2/CH4 selectivity of the triptycene-containing 6FDA-DAT1 (referred to as “6FDA-DATRI” in the manuscript) (Fig. 36b) was maintained, while CO2/CH4 selectivity of 6FDA-mPDA and 6FDA-mTMPD decreased with increasing feed pressure.365 This result suggests that the secondary interactions resulting from the triptycene moiety may help to mitigate plasticization.
50 CO2/CH4 feed at a CO2 partial pressure of up to ∼9 bar, the CO2/CH4 selectivity of the triptycene-containing 6FDA-DAT1 (referred to as “6FDA-DATRI” in the manuscript) (Fig. 36b) was maintained, while CO2/CH4 selectivity of 6FDA-mPDA and 6FDA-mTMPD decreased with increasing feed pressure.365 This result suggests that the secondary interactions resulting from the triptycene moiety may help to mitigate plasticization.
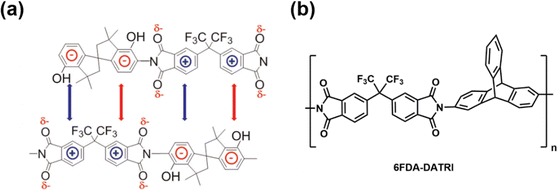 | ||
| Fig. 36 (a) Example of π–π interactions found in electron-rich aromatic groups of PIM-6FDA-OH due to the formation of charge-transfer complexes (CTCs). Reprinted with permission from ref. 159 (Copyright Elsevier, 2015). (b) Chemical structure of the triptycene-containing 6FDA-DATRI, which is equivalent to 6FDA-DAT1 in Fig. 32.365 | ||
In addition to the π–π interactions between phenyl rings in triptycene groups, it has also been found that different substituents that alter packing of polymer chains may likewise lead to plasticization resistance. In 2018, Bezzu et al. examined PIM-SBF-1 and PIM-SBF-5 (Fig. 37), which have a hydrogen and tert-butyl substituent, respectively.368 When exposed to a CO2/CH4 mixture feed of 35![[thin space (1/6-em)]](https://www.rsc.org/images/entities/char_2009.gif) :
:![[thin space (1/6-em)]](https://www.rsc.org/images/entities/char_2009.gif) 65 vol% from 1 to 6 bar, both the hydrogen-containing PIM-SBF-1 and the t-butyl-containing PIM-SBF-5 experienced a CO2 permeability and CO2/CH4 selectivity decrease of about 20% as feed pressure increased.368 However, when the feed pressure was kept constant at 3 bar, it was found that permeability and selectivity of PIM-SBF-5 was independent of gas composition ranging from 10–50% CO2.368 While this study focused on physical aging and found that PIM-SBF-5 had considerably slower aging than PIM-SBF-1 due to the bulkier tert-butyl groups, which resulted in more stable polymer chain spacing during aging,368 these findings suggest that strategies to improve stability of polymer chain spacing could be applied to mitigate plasticization as well.
65 vol% from 1 to 6 bar, both the hydrogen-containing PIM-SBF-1 and the t-butyl-containing PIM-SBF-5 experienced a CO2 permeability and CO2/CH4 selectivity decrease of about 20% as feed pressure increased.368 However, when the feed pressure was kept constant at 3 bar, it was found that permeability and selectivity of PIM-SBF-5 was independent of gas composition ranging from 10–50% CO2.368 While this study focused on physical aging and found that PIM-SBF-5 had considerably slower aging than PIM-SBF-1 due to the bulkier tert-butyl groups, which resulted in more stable polymer chain spacing during aging,368 these findings suggest that strategies to improve stability of polymer chain spacing could be applied to mitigate plasticization as well.
 | ||
| Fig. 37 Chemical structures of PIM-SBF-1 and PIM-SBF-5.368 The t-butyl group in PIM-SBF-5 is highlighted in red. | ||
Introducing fluorine functionality to polymers can enhance interchain interactions,39,369 which can improve plasticization resistance. A fluorine-functionalized PIM that has been analyzed for gas transport properties is PIM-2 (Fig. 38).369 In this work, Fuoco et al. investigated mixed-gas tests for both CO2/CH4 (50![[thin space (1/6-em)]](https://www.rsc.org/images/entities/char_2009.gif) :
:![[thin space (1/6-em)]](https://www.rsc.org/images/entities/char_2009.gif) 50 vol%) and CO2/N2 (15
50 vol%) and CO2/N2 (15![[thin space (1/6-em)]](https://www.rsc.org/images/entities/char_2009.gif) :
:![[thin space (1/6-em)]](https://www.rsc.org/images/entities/char_2009.gif) 85 vol%), and found that when the feed pressure was increased from 1 to 6 bar, both CO2/CH4 and CO2/N2 mixed-gas selectivities were slightly higher than the respective ideal selectivities, likely due to competitive sorption.369 In addition, as the feed pressure was increased, mixed-gas CO2 permeability decreased slightly due to saturation of Langmuir sorption sites, while both CH4 and N2 permeability were relatively constant.369 This finding is indicative of plasticization resistance as CH4 and N2 permeability would otherwise increase if the polymer experienced dilation from CO2-induced plasticization.
85 vol%), and found that when the feed pressure was increased from 1 to 6 bar, both CO2/CH4 and CO2/N2 mixed-gas selectivities were slightly higher than the respective ideal selectivities, likely due to competitive sorption.369 In addition, as the feed pressure was increased, mixed-gas CO2 permeability decreased slightly due to saturation of Langmuir sorption sites, while both CH4 and N2 permeability were relatively constant.369 This finding is indicative of plasticization resistance as CH4 and N2 permeability would otherwise increase if the polymer experienced dilation from CO2-induced plasticization.
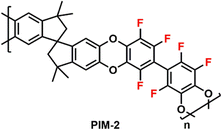 | ||
| Fig. 38 Chemical structure of PIM-2.369 Fluorines are highlighted in red. | ||
In 2019, a class of polymers generated via ring opening metathesis polymerization (ROMP) were studied for gas separation applications.39 These polymers, CF3-ROMP and OMe-ROMP (Fig. 39), contain rigid side chains and flexible poly(norbornene) backbones.39 This new structural design may have promoted greater “physical interlocking” and interchain rigidity between side chains, ultimately leading to outstanding plasticization resistance in which no CO2 plasticization pressure was observed up to a pure-gas CO2 feed pressure of 51 bar.39 In addition, preliminary mixed-gas experiments on CF3-ROMP with a 50![[thin space (1/6-em)]](https://www.rsc.org/images/entities/char_2009.gif) :
:![[thin space (1/6-em)]](https://www.rsc.org/images/entities/char_2009.gif) 50 vol% CO2/CH4 mixture at a feed pressure of 2 bar showed that the mixed-gas CO2/CH4 selectivity increased by 21.5% compared to the pure-gas case, potentially indicating an increase in solubility selectivity (due to competitive sorption).39 In follow-up studies that investigated the role of side-chain length on plasticization resistance for OMe-ROMP, it was found that increasing side-chain length led to increased plasticization resistance. This was attributed to greater interchain rigidity from longer side chains.370,371
50 vol% CO2/CH4 mixture at a feed pressure of 2 bar showed that the mixed-gas CO2/CH4 selectivity increased by 21.5% compared to the pure-gas case, potentially indicating an increase in solubility selectivity (due to competitive sorption).39 In follow-up studies that investigated the role of side-chain length on plasticization resistance for OMe-ROMP, it was found that increasing side-chain length led to increased plasticization resistance. This was attributed to greater interchain rigidity from longer side chains.370,371
 | ||
| Fig. 39 Chemical structures of CF3-ROMP and OMe-ROMP.39 The CF3 functional group is highlighted in blue, while the OMe functional group is highlighted in red. | ||
4.2. Post-synthetic packing structure modification
The following section addresses strategies related to post-synthetic packing structure modification (PPSM) to improve plasticization resistance. This section focuses on methods targeted towards altering the solid-state packing structure as opposed to the chemical structure described in detail in Section 4.1. PPSM strategies include structural rearrangement via thermal or UV methods as well as thermal and chemical crosslinking. Frequently, these strategies produce insoluble materials.4.2.1.1. Thermally rearranged polymers. The solid-state packing structure of certain polymers can be altered through a so-called thermal rearrangement reaction of a pre-cast film. As an aside, these polymers are more technically described as undergoing decarboxylation reactions since they do not follow classic rearrangement reactions found in organic chemistry. Nevertheless, thermally rearranged (TR) polymers have a corresponding conformational change to the angles of backbone connectivity from precursor to final form, and hence, they assume the descriptor of “rearrangement” to emphasize this structural change. First detailed by Park et al., thermal rearrangement occurs when a polymer containing an ortho-functional hydroxy-imide is heated to approximately 400 °C. At this elevated temperature, the hydroxyl group reacts with the imide to form a benzoxazole via decarboxylation, causing a shift in the pore size distribution and generally improving transport properties.311 A generalized reaction scheme is shown in Fig. 23. Originally demonstrated using polyimide homopolymers,311 this strategy has been applied by a number of researchers for PIM-PI structures, shown below in Fig. 40.372–377 The rearranged polymers containing benzoxazole groups have a more rigid and potentially crosslinked backbone structure compared to their polyimide precursor, indicated by the increase in glass transition temperature.378
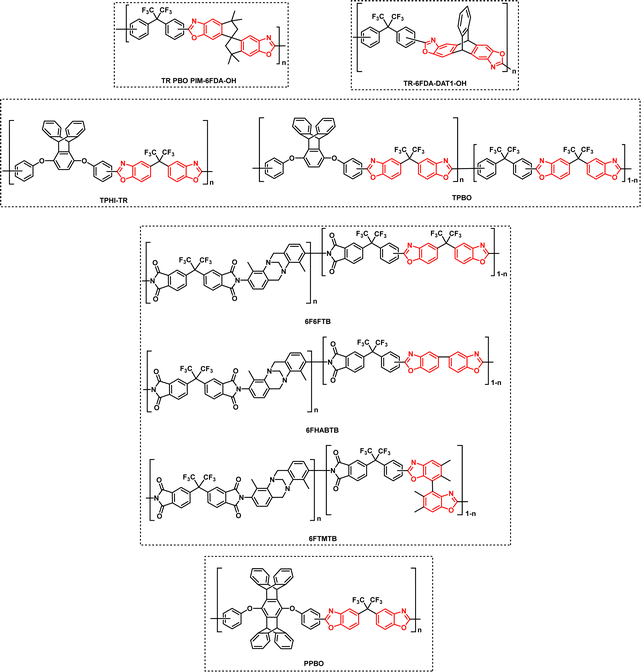 | ||
| Fig. 40 Chemical structures of thermally rearranged polymers of intrinsic microporosity from studies that reported pure-gas pressurization studies or mixed-gas permeation. The benzoxazole functionality is highlighted in red.372–377,379 | ||
Investigation of plasticization resistance for TR PIMs was first reported by Swaidan et al., where they investigated the mixed-gas separation of CO2/CH4 and C3H6/C3H8 mixtures for TR polybenzoxazole (PBO) PIM-6FDA-OH (Fig. 40).372,373 For a 50![[thin space (1/6-em)]](https://www.rsc.org/images/entities/char_2009.gif) :
:![[thin space (1/6-em)]](https://www.rsc.org/images/entities/char_2009.gif) 50 CO2/CH4 mixture ranging from 4 to 20 bar total pressure, the base PIM-6FDA-OH polymer showed a decrease in selectivity from 34 to 22,346 while the TR PBO displayed better plasticization resistance, showing a small decrease in selectivity from 18 to 15.372 For a 50
50 CO2/CH4 mixture ranging from 4 to 20 bar total pressure, the base PIM-6FDA-OH polymer showed a decrease in selectivity from 34 to 22,346 while the TR PBO displayed better plasticization resistance, showing a small decrease in selectivity from 18 to 15.372 For a 50![[thin space (1/6-em)]](https://www.rsc.org/images/entities/char_2009.gif) :
:![[thin space (1/6-em)]](https://www.rsc.org/images/entities/char_2009.gif) 50 C3H6/C3H8 mixture at 2 bar total pressure, the TR PBO showed a decrease from pure-gas selectivity of 15 to a mixed-gas selectivity of 11. However, in this case, the mixed-gas selectivity was stable with increasing feed pressure up to 5 bar, indicative of plasticization resistance.373 Other researchers have investigated the plasticization benefits of the TR technique on other homopolymer backbones. Yerzhankyzy et al. reported the transport behavior of TR-6FDA-DAT1-OH (Fig. 40) for a 2 bar total pressure feed of 50
50 C3H6/C3H8 mixture at 2 bar total pressure, the TR PBO showed a decrease from pure-gas selectivity of 15 to a mixed-gas selectivity of 11. However, in this case, the mixed-gas selectivity was stable with increasing feed pressure up to 5 bar, indicative of plasticization resistance.373 Other researchers have investigated the plasticization benefits of the TR technique on other homopolymer backbones. Yerzhankyzy et al. reported the transport behavior of TR-6FDA-DAT1-OH (Fig. 40) for a 2 bar total pressure feed of 50![[thin space (1/6-em)]](https://www.rsc.org/images/entities/char_2009.gif) :
:![[thin space (1/6-em)]](https://www.rsc.org/images/entities/char_2009.gif) 50 C3H6/C3H8, where the pure-gas to mixed-gas selectivity of a 28 day aged film decreased from 16 to 8, indicating significant effects of plasticization.374 In contrast, Luo et al. reported no discernable plasticization pressure up to 15 bar CO2 for TPHI-TR (Fig. 40).375
50 C3H6/C3H8, where the pure-gas to mixed-gas selectivity of a 28 day aged film decreased from 16 to 8, indicating significant effects of plasticization.374 In contrast, Luo et al. reported no discernable plasticization pressure up to 15 bar CO2 for TPHI-TR (Fig. 40).375
A variety of copolymer structures have been modified via the TR method to combine the transport and plasticization-resistance benefits of multiple structural groups. For example, Luo et al. synthesized TPBO, a copolymer based off of their previously reported TPHI structure, varying the relative amounts of each component (Fig. 40).375,376 All copolymer films showed no CO2 plasticization pressure up to 10 bar. However, the mixed-gas performance for only the homopolymer, possessing the same structure as TPHI-TR (Fig. 40), was reported. For 20![[thin space (1/6-em)]](https://www.rsc.org/images/entities/char_2009.gif) :
:![[thin space (1/6-em)]](https://www.rsc.org/images/entities/char_2009.gif) 80 and 50
80 and 50![[thin space (1/6-em)]](https://www.rsc.org/images/entities/char_2009.gif) :
:![[thin space (1/6-em)]](https://www.rsc.org/images/entities/char_2009.gif) 50 CO2/CH4 mixtures, the TPBO homopolymer showed decreasing selectivity from 68 to 59 and 63 to 55, respectively, with increasing CO2 partial pressure from 1.5 to 3 bar for the 20
50 CO2/CH4 mixtures, the TPBO homopolymer showed decreasing selectivity from 68 to 59 and 63 to 55, respectively, with increasing CO2 partial pressure from 1.5 to 3 bar for the 20![[thin space (1/6-em)]](https://www.rsc.org/images/entities/char_2009.gif) :
:![[thin space (1/6-em)]](https://www.rsc.org/images/entities/char_2009.gif) 80 mixture and from 4 to 6.7 bar for the 50
80 mixture and from 4 to 6.7 bar for the 50![[thin space (1/6-em)]](https://www.rsc.org/images/entities/char_2009.gif) :
:![[thin space (1/6-em)]](https://www.rsc.org/images/entities/char_2009.gif) 50 mixture. The decrease in selectivity was driven by increased CH4 permeability from 5.3 to 6.0 with respect to CO2 partial pressure. The magnitude of these selectivities compare favorably against the stable CO2/CH4 pure-gas selectivity of 56 for pressures up to 10 bar.376 More recently, Huang et al. developed a series of thermally rearranged pentiptyciene-based polybenzoxazoles (PPBO) polymers from a poly(ortho-hydroxyl imide) (PPHI) precursor.379 PPBO films showed no plasticization pressure up to 16 bar in pure-gas permeation tests. The highest performing film (i.e., a polymer treated using a heating rate of 50 °C min−1 for the intermediate heating step at 300 °C) showed no plasticization up to 6.6 bar in binary CO2/CH4 mixed-gas tests. Several variations of TR polymers with the Tröger's base structural group were recently reported by Hu et al., whereby the 6F6FTB, 6FHABTB, and 6FTMTB copolymers were synthesized with varying amounts of the TR and Tröger's base repeat units (Fig. 40).377 The mixed-gas behavior was investigated for the 6F6FTB-0.3 (n = 0.3) copolymer treated at 400 °C, 425 °C, and 450 °C for a 50
50 mixture. The decrease in selectivity was driven by increased CH4 permeability from 5.3 to 6.0 with respect to CO2 partial pressure. The magnitude of these selectivities compare favorably against the stable CO2/CH4 pure-gas selectivity of 56 for pressures up to 10 bar.376 More recently, Huang et al. developed a series of thermally rearranged pentiptyciene-based polybenzoxazoles (PPBO) polymers from a poly(ortho-hydroxyl imide) (PPHI) precursor.379 PPBO films showed no plasticization pressure up to 16 bar in pure-gas permeation tests. The highest performing film (i.e., a polymer treated using a heating rate of 50 °C min−1 for the intermediate heating step at 300 °C) showed no plasticization up to 6.6 bar in binary CO2/CH4 mixed-gas tests. Several variations of TR polymers with the Tröger's base structural group were recently reported by Hu et al., whereby the 6F6FTB, 6FHABTB, and 6FTMTB copolymers were synthesized with varying amounts of the TR and Tröger's base repeat units (Fig. 40).377 The mixed-gas behavior was investigated for the 6F6FTB-0.3 (n = 0.3) copolymer treated at 400 °C, 425 °C, and 450 °C for a 50![[thin space (1/6-em)]](https://www.rsc.org/images/entities/char_2009.gif) :
:![[thin space (1/6-em)]](https://www.rsc.org/images/entities/char_2009.gif) 50 CO2/CH4 mixture for CO2 partial pressures from 2 to 15 bar. The plasticization behavior for the three treatments were relatively similar, where the selectivity decreased as a function of increasing CO2 partial pressure. More specifically, the selectivity decreased from 54 to 26, 40 to 25, and 30 to 20 for the 400 °C, 425 °C, and 450 °C treatments, respectively, showing a smaller percentage decrease in selectivity and improved plasticization resistance with increasing treatment temperature.377
50 CO2/CH4 mixture for CO2 partial pressures from 2 to 15 bar. The plasticization behavior for the three treatments were relatively similar, where the selectivity decreased as a function of increasing CO2 partial pressure. More specifically, the selectivity decreased from 54 to 26, 40 to 25, and 30 to 20 for the 400 °C, 425 °C, and 450 °C treatments, respectively, showing a smaller percentage decrease in selectivity and improved plasticization resistance with increasing treatment temperature.377
4.2.1.2. Carbon molecular sieves. In addition to thermal rearrangement, higher temperature pyrolysis reactions can be used to create carbon molecular sieve (CMS) materials.380 After pyrolysis in a controlled atmosphere at temperatures typically ranging from 500–800 °C, polymer precursors transform into chains of fused aromatic rings, significantly increasing both intrachain and interchain rigidity and resulting in improved plasticization resistance.381 While there are a large number of studies regarding the transport behavior of CMS membranes derived from polyimides,381–383 this section focuses explicitly on CMS membranes derived from microporous polymers.
Along with TR PBO and PIM-6FDA-OH discussed earlier, Swaidan et al. also investigated the formation of CMS membranes from PIM-6FDA-OH.372 For 50![[thin space (1/6-em)]](https://www.rsc.org/images/entities/char_2009.gif) :
:![[thin space (1/6-em)]](https://www.rsc.org/images/entities/char_2009.gif) 50 CO2/CH4 mixtures ranging from 4 to 30 bar total pressure, the CMS membranes formed from 600 °C and 630 °C cures showed roughly the same drop in selectivity from 40 to 20, while the CMS membrane formed from an 800 °C cure showed a larger drop in selectivity from 80 to 50 compared to the base PIM-6FDA-OH polymer.346,372 While the significant decrease in selectivity with pressure is indicative of morphological changes, the mixed-gas selectivity values are very high for the tested pressures and may be suitable for natural gas sweetening applications. Separation of equimolar C2H4/C2H6 mixtures for PIM-6FDA-OH CMS membrane treated at 800 °C was also tested by Salinas et al., where a decrease in selectivity from 14 to 8 was observed with increasing total feed pressure from 4 to 20 bar.384 The decrease in selectivity was attributed to an increase in the C2H6 permeability originating from physical changes to the CMS structure.
50 CO2/CH4 mixtures ranging from 4 to 30 bar total pressure, the CMS membranes formed from 600 °C and 630 °C cures showed roughly the same drop in selectivity from 40 to 20, while the CMS membrane formed from an 800 °C cure showed a larger drop in selectivity from 80 to 50 compared to the base PIM-6FDA-OH polymer.346,372 While the significant decrease in selectivity with pressure is indicative of morphological changes, the mixed-gas selectivity values are very high for the tested pressures and may be suitable for natural gas sweetening applications. Separation of equimolar C2H4/C2H6 mixtures for PIM-6FDA-OH CMS membrane treated at 800 °C was also tested by Salinas et al., where a decrease in selectivity from 14 to 8 was observed with increasing total feed pressure from 4 to 20 bar.384 The decrease in selectivity was attributed to an increase in the C2H6 permeability originating from physical changes to the CMS structure.
Salinas et al. also investigated the mixed-gas C2H4/C2H6 transport performance for a CMS formed from PIM-6FDA.385 The PIM-6FDA CMS membrane treated at 800 °C showed a smaller decrease in selectivity compared to PIM-6FDA-OH CMS, decreasing from 17.9 to 15.6 for an equimolar C2H4/C2H6 mixture with increasing total feed pressure from 4 to 20 bar. The improved stability was attributed to its tighter packed CMS structure compared to its PIM-6FDA-OH counterpart, as suggested by the XRD and Raman spectra. The authors note that the presence of hydroxyl functional groups appeared to negatively affect performance and hypothesized that “it is likely that the additional larger pores created during PBO transformation for PIM-6FDA-OH precursor CMS membranes during the pyrolysis process undermine or slow down the formation of more tightly sintered CMS structure”.385 Recently, thin-film composite CMS membranes were fabricated based on PIM-6FDA-OH386 and had CO2/CH4 selectivities of 43. The authors found that the 3 μm and 100 nm films had accelerated microstructure collapse indicative of physical aging. In another study, Pinnau and colleagues prepared CMS membranes through the pyrolysis of a CANAL-Tröger's base ladder polymer of intrinsic microporosity precursor (CANAL-TB-1).387 The membranes showed pure-gas selectivities of 39, 1952, and >8200 for H2/CO2, H2/N2, and H2/CH4 and mixed-gas selectivities of 174 for H2/CO2 at a 10 bar total feed pressure with a H2 permeability of 8.2 barrer.
4.2.1.3. Polymers with UV transformations. Another method that has been considered to induce transformation of the polymer backbone is UV treatment, primarily focusing on PIM-1. Li et al. investigated the effect of UV irradiation on PIM-1 through exposure of dense membranes to a 254 nm wavelength lamp for periods ranging from 10 min to 4 h.388 As shown in Fig. 41, the authors proposed a 1,2-migration reaction mechanism involving the destruction of the spirocenter catalyzed by radicals generated by UV exposure. The destruction of the spirocenter was confirmed through WAXS and PALS, where the elimination of the peak corresponding to the largest d-spacing in PIM-1 and a decrease in the average free volume radius supported the hypothesized mechanism. The authors tested the UV-rearranged PIM-1 polymer for a number of gas mixtures, including ternary mixtures with H2S and water.388,389 Comparing a binary mixed-gas feed of 50
![[thin space (1/6-em)]](https://www.rsc.org/images/entities/char_2009.gif) :
:![[thin space (1/6-em)]](https://www.rsc.org/images/entities/char_2009.gif) 50 CO2/CH4 to a ternary feed of 50
50 CO2/CH4 to a ternary feed of 50![[thin space (1/6-em)]](https://www.rsc.org/images/entities/char_2009.gif) :
:![[thin space (1/6-em)]](https://www.rsc.org/images/entities/char_2009.gif) 49.95
49.95![[thin space (1/6-em)]](https://www.rsc.org/images/entities/char_2009.gif) :
:![[thin space (1/6-em)]](https://www.rsc.org/images/entities/char_2009.gif) 0.05 CO2/CH4/H2S at ∼7 bar total pressure, the CO2/CH4 selectivity dropped from 25.4 to 9.1 for the 20 min treated sample, demonstrating the strong effect of H2S as a plasticizing gas.388 A similar test was conducted on a 4 h UV treated membrane with increasing water concentration in a 50
0.05 CO2/CH4/H2S at ∼7 bar total pressure, the CO2/CH4 selectivity dropped from 25.4 to 9.1 for the 20 min treated sample, demonstrating the strong effect of H2S as a plasticizing gas.388 A similar test was conducted on a 4 h UV treated membrane with increasing water concentration in a 50![[thin space (1/6-em)]](https://www.rsc.org/images/entities/char_2009.gif) :
:![[thin space (1/6-em)]](https://www.rsc.org/images/entities/char_2009.gif) 50 balance H2/CO2 feed at 2 bar total pressure. As the water concentration in the feed increased from 0 to 15.8 mol%, the selectivity dropped from 10.5 to 6.9, which the authors attributed to both water vapor induced plasticization and competitive sorption from water vapor and CO2 that would decrease H2 permeability.389
50 balance H2/CO2 feed at 2 bar total pressure. As the water concentration in the feed increased from 0 to 15.8 mol%, the selectivity dropped from 10.5 to 6.9, which the authors attributed to both water vapor induced plasticization and competitive sorption from water vapor and CO2 that would decrease H2 permeability.389
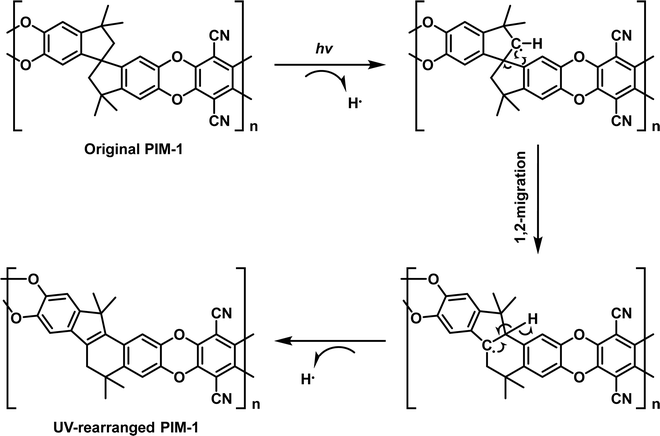 | ||
| Fig. 41 Proposed 1,2-migration mechanism for UV-exposed PIM-1 proposed by Li et al., resulting in the elimination of the spirocenter. Adapted with permission from ref. 388 (Copyright Wiley-VCH, 2012). | ||
Song et al. also investigated the effect of UV irradiation on PIM-1 membranes through exposure to a 254 nm wavelength lamp for a period of 5 to 60 minutes.390 Interestingly, a photo-oxidation mechanism was proposed, counter to the 1,2-migration reaction mechanism previously discussed. Specifically, Song proposed an oxidative chain scission mechanism in which the UV radiation generates singlet oxygen and ozone from atmospheric O2, which then attack the polymer chains at the surface (Fig. 42). This hypothesis was supported by the presence of peaks corresponding to carbonyl and hydroxyl groups observed via FTIR for the UV-treated samples. The fragmented chains can pack more efficiently and reduce porosity, as explored via molecular dynamics simulations for PIM-1 and the fragmented polymer. The tighter packing of chains at the surface effectively formed a thin selective layer at the exposed surface, similar to an asymmetric membrane, resulting in decreased pure-gas CO2 permeability and increased CO2/CH4 ideal selectivity as a function of UV exposure time. When tested in a 50![[thin space (1/6-em)]](https://www.rsc.org/images/entities/char_2009.gif) :
:![[thin space (1/6-em)]](https://www.rsc.org/images/entities/char_2009.gif) 50 CO2/CH4 mixture ranging from 4 to 12.5 bar CO2 partial pressure, UV-treated membranes displayed an almost identical percentage loss in selectivity from 23 to 12 (48%) to that of the PIM-1 control, which decreased from 13 to 7 (46%). These films were also tested using a 50
50 CO2/CH4 mixture ranging from 4 to 12.5 bar CO2 partial pressure, UV-treated membranes displayed an almost identical percentage loss in selectivity from 23 to 12 (48%) to that of the PIM-1 control, which decreased from 13 to 7 (46%). These films were also tested using a 50![[thin space (1/6-em)]](https://www.rsc.org/images/entities/char_2009.gif) :
:![[thin space (1/6-em)]](https://www.rsc.org/images/entities/char_2009.gif) 50 CO2/N2 gas mixture under the same partial pressure conditions, showing decreased selectivity with respect to CO2 partial pressure from 32 to 20 for the UV-treated samples and from 25 to 17 for PIM-1.390
50 CO2/N2 gas mixture under the same partial pressure conditions, showing decreased selectivity with respect to CO2 partial pressure from 32 to 20 for the UV-treated samples and from 25 to 17 for PIM-1.390
 | ||
| Fig. 42 Proposed chain scission mechanism for UV-exposed PIM-1 in the presence of oxygen, resulting in smaller, fragmented chains. These fragmented chains are hypothesized to pack closer together and effectively form a selective layer at the exposed surface of the film. Adapted with permission from ref. 390 (Copyright Springer Nature, 2013). | ||
4.2.2.1. Thermal crosslinking. Thermal crosslinking is a common method to mitigate the effects of plasticization by reducing interchain mobility. In terms of microporous polymers, the PIM subclass has been investigated rather extensively. Du et al. thermally treated carboxylic acid-functionalized PIMs (C-PIMs).391 In their study, the authors prepared C-PIM through a post-synthetic base-catalyzed hydrolysis reaction to convert a percentage of the nitrile groups in PIM-1 to carboxylic acid.391 They hypothesized a thermally-induced decarboxylation reaction could produce a stable phenyl radical site that would crosslink with other sites across chains, as shown in Fig. 43, resulting in crosslinked decarboxylated PIMs (DC-PIMs). High pressure pure-gas CO2 tests revealed DC-PIM films formed from C-PIM films with higher degrees of conversion did not display a plasticization pressure up to ∼56 bar CO2. Additionally, mixed-gas tests for 90
![[thin space (1/6-em)]](https://www.rsc.org/images/entities/char_2009.gif) :
:![[thin space (1/6-em)]](https://www.rsc.org/images/entities/char_2009.gif) 10 CO2/N2 showed a smaller decrease in the relative mixed-gas CO2/N2 selectivity with respect to CO2 partial pressure for all DC-PIMs compared to PIM-1.391
10 CO2/N2 showed a smaller decrease in the relative mixed-gas CO2/N2 selectivity with respect to CO2 partial pressure for all DC-PIMs compared to PIM-1.391
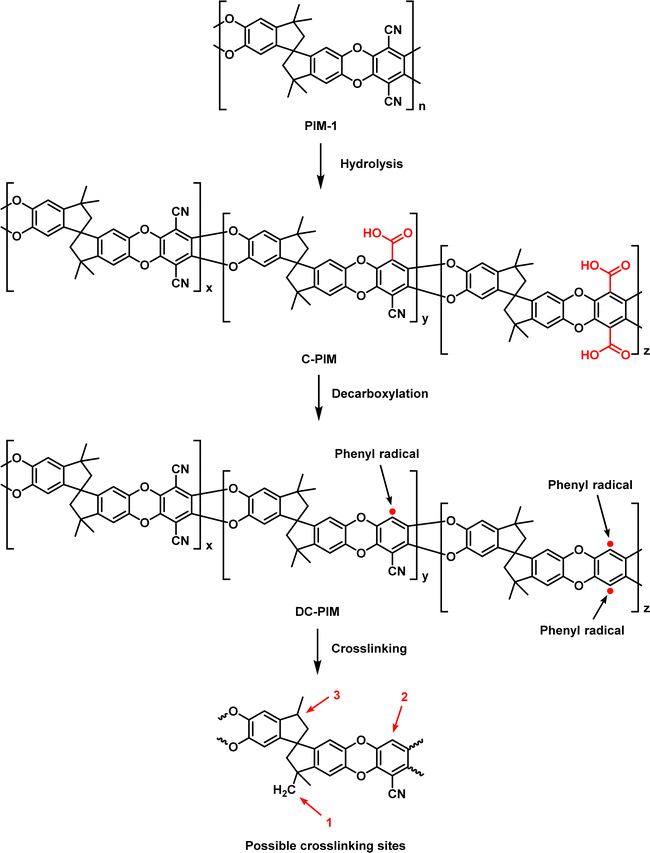 | ||
| Fig. 43 Synthesis route from PIM-1 to DC-PIM and proposed crosslinking sites. Adapted with permission from ref. 391 (Copyright National Research Council of Canada, 2012). | ||
Li et al. investigated the thermal crosslinking of pristine PIM-1, where a 300 °C treatment of dense PIM-1 membranes under vacuum was proposed to cause the native nitrile groups to form stable, bulky triazine rings connecting separate chains, as shown in Fig. 44.392 The crosslinked polymers showed excellent mixed-gas selectivity of 54 for a 50![[thin space (1/6-em)]](https://www.rsc.org/images/entities/char_2009.gif) :
:![[thin space (1/6-em)]](https://www.rsc.org/images/entities/char_2009.gif) 50 CO2/CH4 mixture at ∼7 bar and a mixed-gas selectivity of 38.9 for a 50
50 CO2/CH4 mixture at ∼7 bar and a mixed-gas selectivity of 38.9 for a 50![[thin space (1/6-em)]](https://www.rsc.org/images/entities/char_2009.gif) :
:![[thin space (1/6-em)]](https://www.rsc.org/images/entities/char_2009.gif) 50 CO2/N2 mixture after crosslinking.392
50 CO2/N2 mixture after crosslinking.392
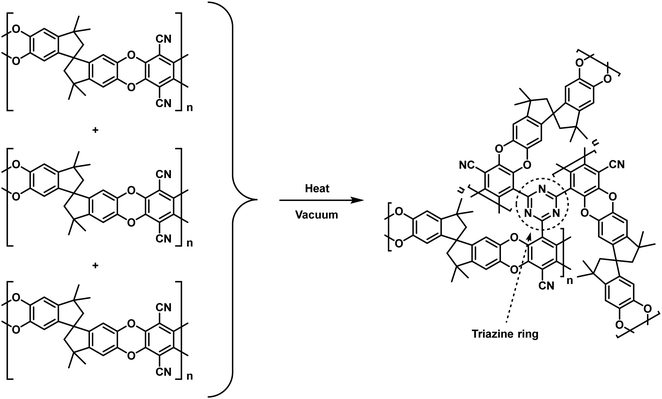 | ||
| Fig. 44 Proposed crosslinking mechanism for three PIM-1 chains to form a triazine ring. Adapted with permission from ref. 392 (Copyright American Chemical Society, 2012). | ||
Song et al. reported a different method for crosslinking PIM-1 via controlled thermal oxidation, where dense PIM-1 films were heated to 385 °C under a controlled atmosphere containing 0 to 200 ppm O2.393 The authors hypothesize that the high temperature treatment will cause oxidative crosslinking of polymer chains similar to vulcanization (Fig. 45), thus resulting in a crosslinked network. The mixed-gas separation performance for the thermally-oxidated films (TOX-PIM-1) was tested using 50![[thin space (1/6-em)]](https://www.rsc.org/images/entities/char_2009.gif) :
:![[thin space (1/6-em)]](https://www.rsc.org/images/entities/char_2009.gif) 50 mixtures of CO2/CH4 and CO2/N2 for a CO2 partial pressure range of 2 to 15 bar. For CO2/CH4, TOX-PIM-1 showed a decrease in mixed-gas selectivity from 60 to 20 while PIM-1 decreased from 12 to 6. For CO2/N2 mixtures, TOX-PIM-1 selectivity showed a decrease from 45 to 23 and PIM-1 selectivity decreased from 20 to 14 for the same CO2 partial pressure range. Additionally, a CO2 plasticization pressure was not observed for the TOX-PIM-1 films.393
50 mixtures of CO2/CH4 and CO2/N2 for a CO2 partial pressure range of 2 to 15 bar. For CO2/CH4, TOX-PIM-1 showed a decrease in mixed-gas selectivity from 60 to 20 while PIM-1 decreased from 12 to 6. For CO2/N2 mixtures, TOX-PIM-1 selectivity showed a decrease from 45 to 23 and PIM-1 selectivity decreased from 20 to 14 for the same CO2 partial pressure range. Additionally, a CO2 plasticization pressure was not observed for the TOX-PIM-1 films.393
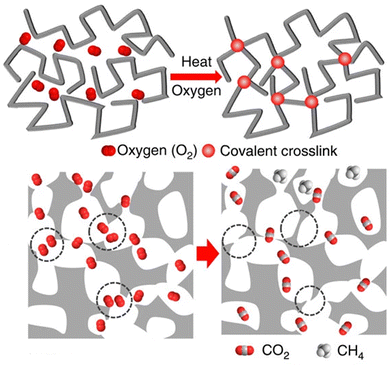 | ||
| Fig. 45 Schematic for thermally-oxidated crosslinking of PIM-1 to form covalent crosslinks, effectively blocking off diffusion pathways. Adapted with permission from ref. 393 (Copyright Springer Nature, 2014). | ||
Chen et al. reported a method for crosslinking of PIM-BM-x, a partially bromomethylated structure using a methyl-substituted PIM-1 (PIM-M, see Fig. 46) as the precursor.394 After thermal treatment at temperatures ranging from 200 °C to 300 °C, the bromine groups are hypothesized to react with the aromatic hydrogens, showing a loss of HBr and forming a crosslinked network, as shown in Fig. 46. High pressure pure-gas CO2 permeability tests indicated improved plasticization resistance for longer treatment times and at higher temperatures, where pristine PIM-BM-70 and PIM-BM-70 treated at 200 °C for 10 h samples displayed a plasticization pressure less than 3.4 bar while the samples treated for 250 °C for 10 h and 300 °C for 5 h did not display a plasticization pressure up to ∼35 bar.394
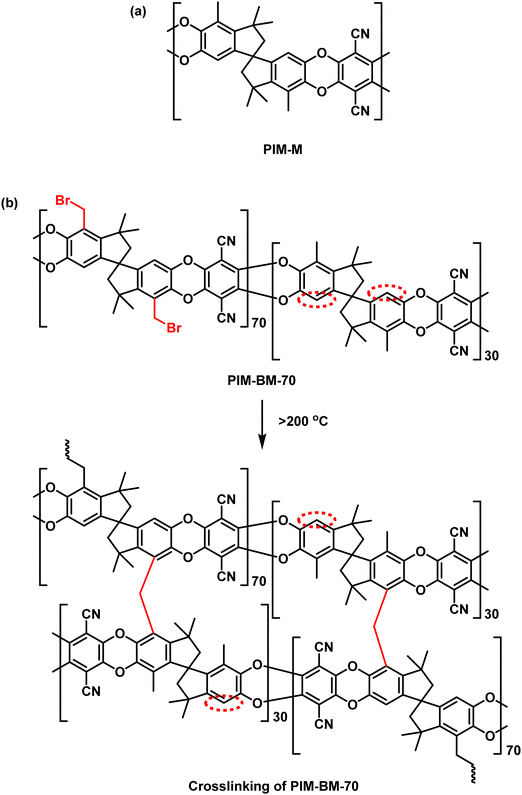 | ||
| Fig. 46 (a) Structure for PIM-M. (b) Proposed crosslinking mechanism for heat-treated PIM-BM-70. Adapted with permission from ref. 394 (Copyright American Chemical Society, 2020). | ||
Zhang et al. reported a thermal crosslinking method for a carboxylate PIM (CA-PIM) using a decarboxylation method similar to Du et al.391,395 The authors synthesized copolymers consisting of 2,6-diaminotriptycene (DAT) and 2,6-diaminotriptycene-14-carboxylic acid (DATCA) using 9![[thin space (1/6-em)]](https://www.rsc.org/images/entities/char_2009.gif) :
:![[thin space (1/6-em)]](https://www.rsc.org/images/entities/char_2009.gif) 1 and 8
1 and 8![[thin space (1/6-em)]](https://www.rsc.org/images/entities/char_2009.gif) :
:![[thin space (1/6-em)]](https://www.rsc.org/images/entities/char_2009.gif) 2 monomer ratios. When heated to at least 325 °C, it was proposed that the carboxylic acid groups on adjacent chains reacted and formed radicals, resulting in a direct crosslinking of the triptycene groups across chains, as shown in Fig. 47. High pressure pure-gas CO2 permeation tests on both copolymer compositions showed similar results, where a plasticization pressure of 7 bar and 17 bar was observed for copolymers heated to 300 °C and 325 °C, respectively, while a plasticization pressure was not observed up to 30 bar for the copolymer heated to 350 °C, suggesting that the crosslinking reaction had reached completion according to the authors.395
2 monomer ratios. When heated to at least 325 °C, it was proposed that the carboxylic acid groups on adjacent chains reacted and formed radicals, resulting in a direct crosslinking of the triptycene groups across chains, as shown in Fig. 47. High pressure pure-gas CO2 permeation tests on both copolymer compositions showed similar results, where a plasticization pressure of 7 bar and 17 bar was observed for copolymers heated to 300 °C and 325 °C, respectively, while a plasticization pressure was not observed up to 30 bar for the copolymer heated to 350 °C, suggesting that the crosslinking reaction had reached completion according to the authors.395
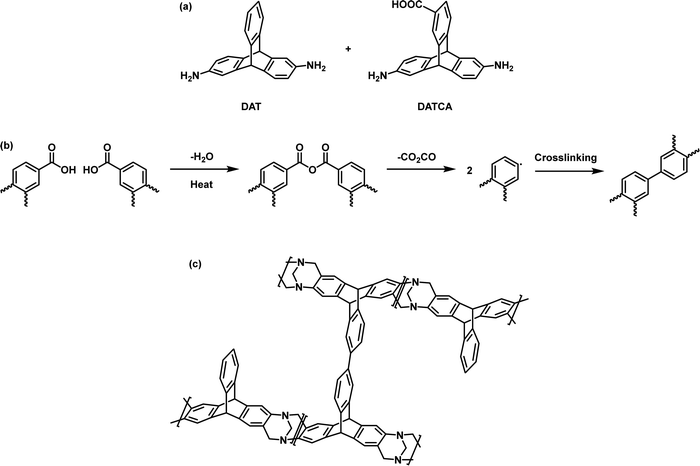 | ||
| Fig. 47 (a) Monomers 2,6-diaminotriptycene (DAT) and 2,6-diaminotriptycene-14-carboxylic acid (DATCA). (b) Proposed crosslinking mechanism between two carboxylic acid groups when heated. (c) The final crosslinked structure, demonstrating the connection between two chains at the carboxylic acid groups of the DATCA monomer. Adapted with permission from ref. 395 (Copyright American Chemical Society, 2020). | ||
4.2.2.2. Chemical crosslinking. As opposed to thermal methods, chemical crosslinking takes advantage of multi-functional compounds to create crosslinked networks. One such method was reported by Du et al., where 4-azido phenyl sulfone and 2,6-bis(4-azidobenzylidene)-4-methylcyclohexanone (Fig. 48) were used as chemical crosslinkers for PIM-1 via a nitrene reaction with the nitrile groups.396 The crosslinked polymer films were tested for 50
![[thin space (1/6-em)]](https://www.rsc.org/images/entities/char_2009.gif) :
:![[thin space (1/6-em)]](https://www.rsc.org/images/entities/char_2009.gif) 50 and 80
50 and 80![[thin space (1/6-em)]](https://www.rsc.org/images/entities/char_2009.gif) :
:![[thin space (1/6-em)]](https://www.rsc.org/images/entities/char_2009.gif) 20 CO2/CH4 feeds ranging from ∼3 to ∼17 bar total pressure. As pressure increased, the 4-azido phenyl sulfone-crosslinked film showed a decrease in selectivity from 19 to 17 and the 2,6-bis(4-azidobenzylidene)-4-methylcyclohexanone-crosslinked film showed a decrease in selectivity from 23 to 21. Both films compared favorably to PIM-1, which showed a decrease in selectivity from 14 to 11. A plasticization pressure was not observed up to ∼20 bar for pure-gas CO2 tests for the crosslinked films.396 A similar crosslinking reaction was investigated by Khan et al., using a PEG-biazide (Fig. 48) to crosslink PIM-1.397 In this case, high pressure pure-gas CO2 tests up to ∼30 bar did not show a plasticization pressure for samples with as little as 5 wt% of crosslinker.
20 CO2/CH4 feeds ranging from ∼3 to ∼17 bar total pressure. As pressure increased, the 4-azido phenyl sulfone-crosslinked film showed a decrease in selectivity from 19 to 17 and the 2,6-bis(4-azidobenzylidene)-4-methylcyclohexanone-crosslinked film showed a decrease in selectivity from 23 to 21. Both films compared favorably to PIM-1, which showed a decrease in selectivity from 14 to 11. A plasticization pressure was not observed up to ∼20 bar for pure-gas CO2 tests for the crosslinked films.396 A similar crosslinking reaction was investigated by Khan et al., using a PEG-biazide (Fig. 48) to crosslink PIM-1.397 In this case, high pressure pure-gas CO2 tests up to ∼30 bar did not show a plasticization pressure for samples with as little as 5 wt% of crosslinker.
 | ||
| Fig. 48 Three azides investigated for the chemical crosslinking of PIM-1.396,397 | ||
Chemical crosslinking for polymers containing triptycene and Tröger's base structural units was investigated by Zhang et al., where a triptycene-based diamine was functionalized with a carboxylic acid group and copolymerized with the triptycene-based diamine precursor to form a Tröger's base copolymer, CoPIM-TB.398 The copolymers were crosslinked using a glycidol agent to react with carboxylic acid groups on different chains (Fig. 49). The crosslinked films were tested in a 50![[thin space (1/6-em)]](https://www.rsc.org/images/entities/char_2009.gif) :
:![[thin space (1/6-em)]](https://www.rsc.org/images/entities/char_2009.gif) 50 CO2/CH4 mixture from ∼2 to ∼41 bar total pressure, showing a decrease in selectivity from 12 to 8 over this pressure range, primarily due to decreasing CO2 permeability and stable CH4 permeability. A plasticization pressure was not observed for pure-gas and mixed-gas CO2 pressures up to ∼20 bar.398
50 CO2/CH4 mixture from ∼2 to ∼41 bar total pressure, showing a decrease in selectivity from 12 to 8 over this pressure range, primarily due to decreasing CO2 permeability and stable CH4 permeability. A plasticization pressure was not observed for pure-gas and mixed-gas CO2 pressures up to ∼20 bar.398
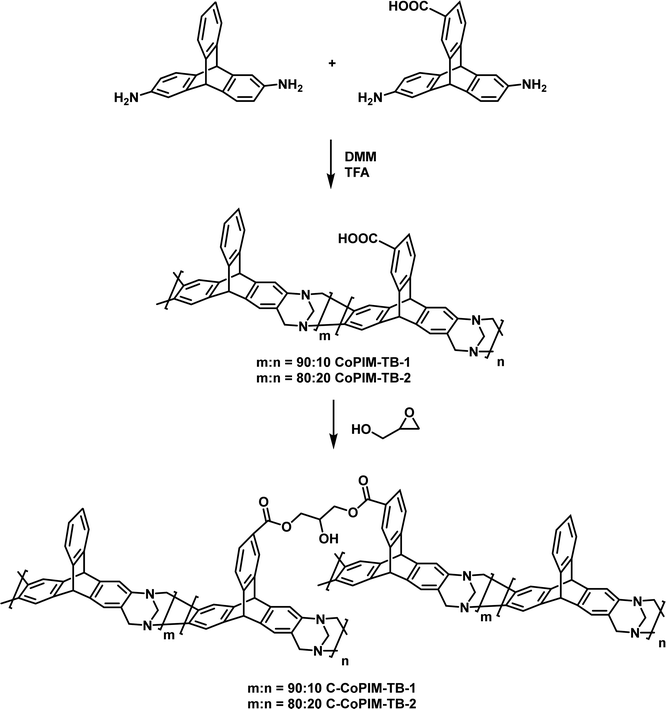 | ||
| Fig. 49 Synthetic route for the synthesis of CoPIM-TB-1 and CoPIM-TB-2, followed by chemical crosslinking using a glycidol agent reacting with the carboxylic acid groups to form C-CoPIM-TB-1 and C-CoPIM-TB-2. Adapted with permission from ref. 398 (Copyright Elsevier, 2018). | ||
Liao et al. investigated the incorporation of divalent metal ions, such as Zn2+, Mg2+, and Ag+, in hydrolyzed PIM-1 (C-PIM).156 The authors hypothesized that the carboxylic acid groups of C-PIM would deprotonate in the presence of metal ions, after which the ions would then act as crosslinkers between polymer chains. The metal-crosslinked PIMs were tested for a 50![[thin space (1/6-em)]](https://www.rsc.org/images/entities/char_2009.gif) :
:![[thin space (1/6-em)]](https://www.rsc.org/images/entities/char_2009.gif) 50 mixture of C3H6/C3H8 at total feed pressures up to ∼9 bar. All three crosslinked systems showed improved plasticization resistance compared to PIM-1, with the Zn2+ crosslinked polymer showing the highest permeability due to its larger ionic radius, which results in higher internal free volume. Conversely, the Mg2+ crosslinked polymer showed the highest selectivity at high pressures, which the authors attributed to π-orbital interactions with C3H6.156
50 mixture of C3H6/C3H8 at total feed pressures up to ∼9 bar. All three crosslinked systems showed improved plasticization resistance compared to PIM-1, with the Zn2+ crosslinked polymer showing the highest permeability due to its larger ionic radius, which results in higher internal free volume. Conversely, the Mg2+ crosslinked polymer showed the highest selectivity at high pressures, which the authors attributed to π-orbital interactions with C3H6.156
4.3. Composites, blends, and copolymers
The following section focuses on the use of composites, blends, and copolymers to improve plasticization resistance. The majority of strategies already discussed involve only one polymer backbone and its potential treatments and modifications. Here, we expand the discussion to include systems with up to three unique components and their interactions that affect transport and plasticization resistance.4.3.1.1. Copolymers. Copolymerization has been previously investigated for conventional glassy polymers with the goal of combining the beneficial aspects of each component.399–401 This section only focuses on reports detailing the plasticization resistance of copolymers that incorporate microporous structural units. It should be noted that many polymers discussed earlier in this section are copolymers as well (e.g., 6F6FTB, CoPIM-TB, etc.) but are omitted from this section, since we intend to highlight approaches that are specifically designed to incorporate microporous subunits.
Wu et al. reported the copolymerization of 4-tert-butylcalix[4]arene (CA) with the typical PIM-1 monomers to form a modified PIM-1 backbone structure, shown in Fig. 50.402 The addition of small amounts of the CA unit was intended to force frustrated packing through both forced contortion and increased rigidity. The mixed-gas selectivity for a 50![[thin space (1/6-em)]](https://www.rsc.org/images/entities/char_2009.gif) :
:![[thin space (1/6-em)]](https://www.rsc.org/images/entities/char_2009.gif) 50 CO2/CH4 mixture at ∼7 bar total pressure was consistently lower than the pure-gas selectivity for each loading, with the 1.0% loading showing the best performance and plasticization resistance.402
50 CO2/CH4 mixture at ∼7 bar total pressure was consistently lower than the pure-gas selectivity for each loading, with the 1.0% loading showing the best performance and plasticization resistance.402
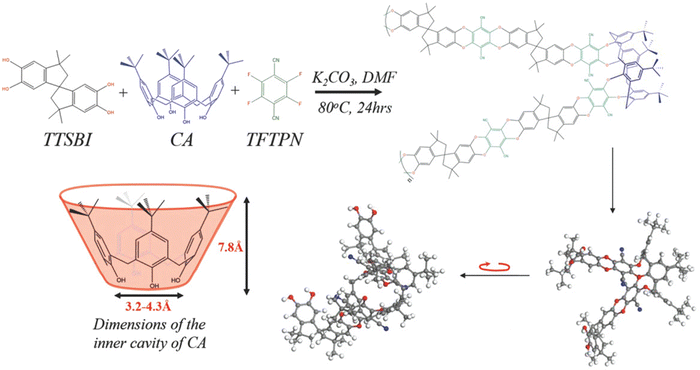 | ||
| Fig. 50 Synthetic route for the incorporation of CA into the PIM-1 backbone. The CA dimensions and structure force contortion of the backbone. Reprinted with permission from ref. 402 (Copyright Wiley-VCH, 2018). | ||
A similar approach was reported by Liu et al., where up to 2 wt% of beta-cyclodextrin (β-CD) monomer, possessing a hollow-bowl structure, was introduced to rigidify the backbone structure of PIM-1, shown in Fig. 51.403 The polymers were tested under 50![[thin space (1/6-em)]](https://www.rsc.org/images/entities/char_2009.gif) :
:![[thin space (1/6-em)]](https://www.rsc.org/images/entities/char_2009.gif) 50 CO2/CH4 mixed-gas conditions, where increasing amounts of β-CD resulted in more stable selectivity, with pure PIM-1 showing a 35% decrease in selectivity compared to a 13% decrease for 2% β-CD for CO2 partial pressures from 2 to 10 bar.403
50 CO2/CH4 mixed-gas conditions, where increasing amounts of β-CD resulted in more stable selectivity, with pure PIM-1 showing a 35% decrease in selectivity compared to a 13% decrease for 2% β-CD for CO2 partial pressures from 2 to 10 bar.403
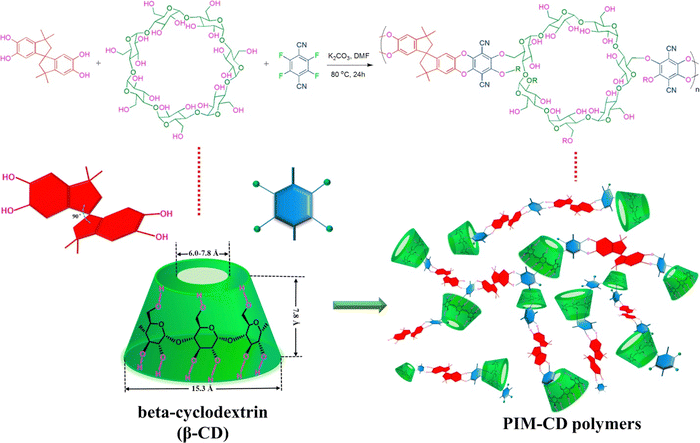 | ||
| Fig. 51 Synthetic route for the incorporation of β-CD in the PIM-1 backbone. The inclusion of β-CD forces inefficient packing through its structure. Reprinted with permission from ref. 403 (Copyright Elsevier, 2017). | ||
4.3.1.2. Miscible polymer–polymer blends. In a similar vein to copolymerization, the physical blending of polymers has also been investigated for a number of microporous polymers, with the same goal of combining the beneficial aspects of each component. Here, the focus is again on systems that incorporate at least one component that has microporous characteristics.
Yong et al. published a series of papers detailing the transport behavior of PIM-1/Matrimid® blended membranes.224,404,405 First, the authors reported a simple physical blend of PIM-1 and Matrimid® and hypothesized that formation of CTCs between the two polymers could increase intrachain rigidity and thereby contribute to better performance and plasticization resistance. The mixed-gas selectivities of 34 and 30 for a 50![[thin space (1/6-em)]](https://www.rsc.org/images/entities/char_2009.gif) :
:![[thin space (1/6-em)]](https://www.rsc.org/images/entities/char_2009.gif) 50 CO2/CH4 mixture at ∼7 bar total pressure for 10
50 CO2/CH4 mixture at ∼7 bar total pressure for 10![[thin space (1/6-em)]](https://www.rsc.org/images/entities/char_2009.gif) :
:![[thin space (1/6-em)]](https://www.rsc.org/images/entities/char_2009.gif) 90 and 30
90 and 30![[thin space (1/6-em)]](https://www.rsc.org/images/entities/char_2009.gif) :
:![[thin space (1/6-em)]](https://www.rsc.org/images/entities/char_2009.gif) 70 compositions of PIM-1/Matrimid® blends showed little change compared to the pure-gas selectivities of 35 and 30.224 These polymer blends were then fabricated into hollow fibers, followed by heat treatment at 75 °C for 3 h and a subsequent silicon rubber coating procedure for 3 min to cure defects in the fibers. For a 50
70 compositions of PIM-1/Matrimid® blends showed little change compared to the pure-gas selectivities of 35 and 30.224 These polymer blends were then fabricated into hollow fibers, followed by heat treatment at 75 °C for 3 h and a subsequent silicon rubber coating procedure for 3 min to cure defects in the fibers. For a 50![[thin space (1/6-em)]](https://www.rsc.org/images/entities/char_2009.gif) :
:![[thin space (1/6-em)]](https://www.rsc.org/images/entities/char_2009.gif) 50 CO2/CH4 mixture at ∼2 bar total pressure, the 10
50 CO2/CH4 mixture at ∼2 bar total pressure, the 10![[thin space (1/6-em)]](https://www.rsc.org/images/entities/char_2009.gif) :
:![[thin space (1/6-em)]](https://www.rsc.org/images/entities/char_2009.gif) 90 blend composition showed a decrease in selectivity to 23.1 compared to 26.2 for the pure-gas test, while the 15
90 blend composition showed a decrease in selectivity to 23.1 compared to 26.2 for the pure-gas test, while the 15![[thin space (1/6-em)]](https://www.rsc.org/images/entities/char_2009.gif) :
:![[thin space (1/6-em)]](https://www.rsc.org/images/entities/char_2009.gif) 85 blend composition showed a decrease in selectivity from 34.3 to 28.8, indicating low plasticization resistance with increasing amounts of PIM-1.404 The authors then investigated the effects of a post-casting diamine crosslinking reaction.405 In this work, as-cast PIM-1/Matrimid® films were immersed in a diamine solution (e.g., trimethylenediamine (TMEDA), p-xylylenediamine (pXDA), triethylenetetramine (TETA), etc.). The diamine would then act as a crosslinker for the imide functionality on Matrimid® and form a Matrimid® crosslinked network within the PIM-1 polymer. The TETA-crosslinked membrane was tested in a 50
85 blend composition showed a decrease in selectivity from 34.3 to 28.8, indicating low plasticization resistance with increasing amounts of PIM-1.404 The authors then investigated the effects of a post-casting diamine crosslinking reaction.405 In this work, as-cast PIM-1/Matrimid® films were immersed in a diamine solution (e.g., trimethylenediamine (TMEDA), p-xylylenediamine (pXDA), triethylenetetramine (TETA), etc.). The diamine would then act as a crosslinker for the imide functionality on Matrimid® and form a Matrimid® crosslinked network within the PIM-1 polymer. The TETA-crosslinked membrane was tested in a 50![[thin space (1/6-em)]](https://www.rsc.org/images/entities/char_2009.gif) :
:![[thin space (1/6-em)]](https://www.rsc.org/images/entities/char_2009.gif) 50 H2/CO2 gas mixture at ∼7 bar total pressure and showed a decrease in pure-gas to mixed-gas selectivity from 9.6 to 5.3. It should be noted that both plasticization and competitive sorption could contribute to the decrease in selectivity for H2/CO2 mixtures, but requires further investigation.405
50 H2/CO2 gas mixture at ∼7 bar total pressure and showed a decrease in pure-gas to mixed-gas selectivity from 9.6 to 5.3. It should be noted that both plasticization and competitive sorption could contribute to the decrease in selectivity for H2/CO2 mixtures, but requires further investigation.405
A similar strategy of blending PIM-1 with a commercial polymer was reported by Hao et al., where the effect of adding PIM-1 to Ultem® was investigated.406,407 For a 90![[thin space (1/6-em)]](https://www.rsc.org/images/entities/char_2009.gif) :
:![[thin space (1/6-em)]](https://www.rsc.org/images/entities/char_2009.gif) 10 blend of Ultem®/PIM-1, 50
10 blend of Ultem®/PIM-1, 50![[thin space (1/6-em)]](https://www.rsc.org/images/entities/char_2009.gif) :
:![[thin space (1/6-em)]](https://www.rsc.org/images/entities/char_2009.gif) 50 mixtures of CO2/CH4 and CO2/N2 at ∼7 bar total pressure showed selectivities of 27.3 and 37.0, a slight increase compared to the pure-gas selectivities of 23.5 and 33.8, respectively, which was attributed to PIM-1 affinity to CO2 and competitive sorption effects. Similar small increases were observed for the 80
50 mixtures of CO2/CH4 and CO2/N2 at ∼7 bar total pressure showed selectivities of 27.3 and 37.0, a slight increase compared to the pure-gas selectivities of 23.5 and 33.8, respectively, which was attributed to PIM-1 affinity to CO2 and competitive sorption effects. Similar small increases were observed for the 80![[thin space (1/6-em)]](https://www.rsc.org/images/entities/char_2009.gif) :
:![[thin space (1/6-em)]](https://www.rsc.org/images/entities/char_2009.gif) 20 blend as well.406 The authors also formed hollow fibers of the 90
20 blend as well.406 The authors also formed hollow fibers of the 90![[thin space (1/6-em)]](https://www.rsc.org/images/entities/char_2009.gif) :
:![[thin space (1/6-em)]](https://www.rsc.org/images/entities/char_2009.gif) 10 and 85
10 and 85![[thin space (1/6-em)]](https://www.rsc.org/images/entities/char_2009.gif) :
:![[thin space (1/6-em)]](https://www.rsc.org/images/entities/char_2009.gif) 15 blended systems. Both fibers were tested for 50
15 blended systems. Both fibers were tested for 50![[thin space (1/6-em)]](https://www.rsc.org/images/entities/char_2009.gif) :
:![[thin space (1/6-em)]](https://www.rsc.org/images/entities/char_2009.gif) 50 CO2/CH4 with 3 bar CO2 partial pressure and showed slight increases in permselectivity compared to the pure-gas permselectivities.407
50 CO2/CH4 with 3 bar CO2 partial pressure and showed slight increases in permselectivity compared to the pure-gas permselectivities.407
A PIM-1 blend with sulfonated polyphenylenesulfone (sPPSU) was investigated by Yong et al., where the secondary interactions caused by the sulfonic acid groups on sPPSU were hypothesized to increase interchain rigidity.408 The blends were tested for a 50![[thin space (1/6-em)]](https://www.rsc.org/images/entities/char_2009.gif) :
:![[thin space (1/6-em)]](https://www.rsc.org/images/entities/char_2009.gif) 50 CO2/CH4 gas mixture from ∼5 to ∼30 bar total pressure, where the 20
50 CO2/CH4 gas mixture from ∼5 to ∼30 bar total pressure, where the 20![[thin space (1/6-em)]](https://www.rsc.org/images/entities/char_2009.gif) :
:![[thin space (1/6-em)]](https://www.rsc.org/images/entities/char_2009.gif) 80 sPPSU/PIM-1 blend showed a slight decrease in mixed-gas selectivity from 26 to 23 over the pressure range.408 PIM-1 was also blended with a Tröger's base polymer by Zhao et al., chosen for its favorable nitrogen-nitrile interactions with PIM-1 and resulting in good miscibility and interchain rigidity.223 The 8
80 sPPSU/PIM-1 blend showed a slight decrease in mixed-gas selectivity from 26 to 23 over the pressure range.408 PIM-1 was also blended with a Tröger's base polymer by Zhao et al., chosen for its favorable nitrogen-nitrile interactions with PIM-1 and resulting in good miscibility and interchain rigidity.223 The 8![[thin space (1/6-em)]](https://www.rsc.org/images/entities/char_2009.gif) :
:![[thin space (1/6-em)]](https://www.rsc.org/images/entities/char_2009.gif) 2 and 6
2 and 6![[thin space (1/6-em)]](https://www.rsc.org/images/entities/char_2009.gif) :
:![[thin space (1/6-em)]](https://www.rsc.org/images/entities/char_2009.gif) 4 PIM-1/TB blends did not show a plasticization pressure up to 40 bar, while PIM-1 displayed a plasticization pressure at 15 bar.223
4 PIM-1/TB blends did not show a plasticization pressure up to 40 bar, while PIM-1 displayed a plasticization pressure at 15 bar.223
Blends of PIM-1 and PEG of varying molecular weights (2k to 20k) and loadings (0 to 5 wt%) were investigated by Wu et al.409 The authors hypothesized that the addition of the CO2-philic PEG to the PIM-1 matrix would improve the separation performance for CO2-based gas pairs, such as CO2/CH4 and CO2/N2. For pure-gas CO2 tests ranging from 4 to 12 bar, plasticization pressures were not observed for PIM-1 or the blend containing 2.5 wt% of 20k PEG. In addition, similar decreases in permeability (77% for PIM-1 and 72% for the blend) were observed for both membranes when comparing the permeability at 12 bar to that at 4 bar.409
C-PIMs have also been explored in blends with commercial polymers, such as Torlon® and Matrimid®, by Yong et al.225,410 In both cases, it was hypothesized that the carboxylic acid functional group on C-PIM would allow for secondary hydrogen bond interactions with the other polymer in the blend, thereby increasing interchain rigidity. For the 90![[thin space (1/6-em)]](https://www.rsc.org/images/entities/char_2009.gif) :
:![[thin space (1/6-em)]](https://www.rsc.org/images/entities/char_2009.gif) 10 C-PIM/Torlon® system, no plasticization pressure was observed up to ∼30 bar, while pure C-PIM showed a plasticization pressure at ∼20 bar. Additionally, the mixed-gas selectivity of 22.2 for a 50
10 C-PIM/Torlon® system, no plasticization pressure was observed up to ∼30 bar, while pure C-PIM showed a plasticization pressure at ∼20 bar. Additionally, the mixed-gas selectivity of 22.2 for a 50![[thin space (1/6-em)]](https://www.rsc.org/images/entities/char_2009.gif) :
:![[thin space (1/6-em)]](https://www.rsc.org/images/entities/char_2009.gif) 50 CO2/CH4 mixture at ∼7 bar total pressure was slightly lower than the pure-gas selectivity of 24.1.410 Similarly, for the C-PIM/Matrimid® system, incorporation of 90 wt% C-PIM into Matrimid® increased the plasticization pressure to ∼20 bar from ∼4 bar for pure Matrimid®. The same mixed-gas conditions showed a small decrease in mixed-gas selectivity to 16.9 compared to the pure-gas selectivity of 17.2, showing comparable results to the C-PIM/Torlon® blend.225
50 CO2/CH4 mixture at ∼7 bar total pressure was slightly lower than the pure-gas selectivity of 24.1.410 Similarly, for the C-PIM/Matrimid® system, incorporation of 90 wt% C-PIM into Matrimid® increased the plasticization pressure to ∼20 bar from ∼4 bar for pure Matrimid®. The same mixed-gas conditions showed a small decrease in mixed-gas selectivity to 16.9 compared to the pure-gas selectivity of 17.2, showing comparable results to the C-PIM/Torlon® blend.225
In addition to the archetypal PIM-1 backbone, PIM-EA(H2)-TB has also been blended with polybenzimidazole (PBI) and Matrimid® by Sánchez-Laínez et al. and Esposito et al., respectively.411,412 For the PIM-EA(H2)-TB/PBI blend, the authors aimed to combine two structures that showed promising separation for H2/CO2 mixtures, arguing that PIM-EA(H2)-TB is more appropriate for this separation than PIM-1 due to its higher intrachain rigidity. Asymmetric membranes were prepared for blends with 0 to 20 wt% of PIM-EA(H2)-TB in PBI and tested for a 50![[thin space (1/6-em)]](https://www.rsc.org/images/entities/char_2009.gif) :
:![[thin space (1/6-em)]](https://www.rsc.org/images/entities/char_2009.gif) 50 H2/CO2 mixture from 3 to 6 bar total pressure, showing increased mixed-gas selectivity from 10 to 21 with increasing pressure in the 20 wt% case due to dual-mode effects.411 For the 50
50 H2/CO2 mixture from 3 to 6 bar total pressure, showing increased mixed-gas selectivity from 10 to 21 with increasing pressure in the 20 wt% case due to dual-mode effects.411 For the 50![[thin space (1/6-em)]](https://www.rsc.org/images/entities/char_2009.gif) :
:![[thin space (1/6-em)]](https://www.rsc.org/images/entities/char_2009.gif) 50 PIM-EA(H2)-TB/Matrimid® blend, a 35
50 PIM-EA(H2)-TB/Matrimid® blend, a 35![[thin space (1/6-em)]](https://www.rsc.org/images/entities/char_2009.gif) :
:![[thin space (1/6-em)]](https://www.rsc.org/images/entities/char_2009.gif) 65 CO2/CH4 mixture ranging from 1 to 6 bar total pressure resulted in a constant selectivity of 29 and showed little hysteresis. A constant selectivity of 43 was observed for a 15
65 CO2/CH4 mixture ranging from 1 to 6 bar total pressure resulted in a constant selectivity of 29 and showed little hysteresis. A constant selectivity of 43 was observed for a 15![[thin space (1/6-em)]](https://www.rsc.org/images/entities/char_2009.gif) :
:![[thin space (1/6-em)]](https://www.rsc.org/images/entities/char_2009.gif) 85 CO2/N2 mixture for the same pressure range.412
85 CO2/N2 mixture for the same pressure range.412
4.3.2.1. Metal–organic frameworks. This section focuses on reports detailing the use of non-miscible fillers in a microporous polymer continuous phase to form what is generally considered to be a mixed-matrix membrane (MMM). In particular, significant research effort has been expended on the use of MOFs as a filler. A wide variety of MOFs, namely ZIFs and UiO-66, among others, and their various derivatives, have been investigated to improve transport performance and plasticization resistance of microporous polymers. Out of 34 studies resulting from our literature search related to the incorporation of MOFs in microporous polymers, MMMs fabricated with ZIF- and UiO-66-based MOFs were reported in 41% and 35% of the studies, respectively. Interestingly, 21% of the total studies reported an amine or nitrile functionalization of the ligand, indicating an emphasis on improved interfacial compatibility between the polymer and MOF. The unmodified structures for the most studied MOFs discussed in this section are shown in Fig. 52.134 These structures do not include all varieties and variations of MOFs discussed below for the sake of brevity.
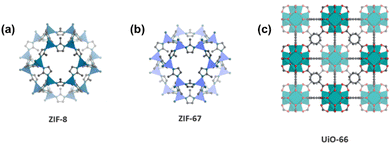 | ||
| Fig. 52 MOF structures for (a) ZIF-8, (b) ZIF-67, and (c) UiO-66. Legend: gray, C; red, O, teal, N; dark blue, Zn; light blue, Co; light green, Zr. Reprinted with permission from ref. 134 (Copyright American Chemical Society, 2020). | ||
There has been a significant research effort on incorporating the ZIF family of MOFs as a filler in microporous polymers primarily due to their excellent size-sieving properties, with the most well-known and most investigated being ZIF-8.413 Ma et al. reported an MMM of PIM-6FDA-OH and ZIF-8 with filler loadings up to 65 wt%.414 The authors investigated enhanced interfacial compatibility between the polymer and MOF based on hydrogen bonds between the –OH groups of the polymer and the nitrogen groups on ZIF-8. MMMs with 33 wt% and 65 wt% loading were tested for 50![[thin space (1/6-em)]](https://www.rsc.org/images/entities/char_2009.gif) :
:![[thin space (1/6-em)]](https://www.rsc.org/images/entities/char_2009.gif) 50 C3H6/C3H8 mixed feed from 2 to 7 bar total pressure and showed only a small decrease in selectivity from 22 to 21 and 31 to 29 with increasing feed pressure, respectively, while pure PIM-6FDA-OH selectivity decreased from 21 to 12 from 2 to 6 bar total pressure.414 ZIF-8 was also used as a filler in a blended PIM-1/6FDA-DAM polymer matrix by Sánchez-Laínez et al.415 The authors observed that ZIF-8 exhibited better compatibility with 6FDA-DAM than with PIM-1, resulting in uniform dispersion throughout the polymer matrix. The MMMs were tested for 50
50 C3H6/C3H8 mixed feed from 2 to 7 bar total pressure and showed only a small decrease in selectivity from 22 to 21 and 31 to 29 with increasing feed pressure, respectively, while pure PIM-6FDA-OH selectivity decreased from 21 to 12 from 2 to 6 bar total pressure.414 ZIF-8 was also used as a filler in a blended PIM-1/6FDA-DAM polymer matrix by Sánchez-Laínez et al.415 The authors observed that ZIF-8 exhibited better compatibility with 6FDA-DAM than with PIM-1, resulting in uniform dispersion throughout the polymer matrix. The MMMs were tested for 50![[thin space (1/6-em)]](https://www.rsc.org/images/entities/char_2009.gif) :
:![[thin space (1/6-em)]](https://www.rsc.org/images/entities/char_2009.gif) 50 CO2/CH4 and 10
50 CO2/CH4 and 10![[thin space (1/6-em)]](https://www.rsc.org/images/entities/char_2009.gif) :
:![[thin space (1/6-em)]](https://www.rsc.org/images/entities/char_2009.gif) 90 CO2/N2 mixtures at 3 bar total pressure, with MMMs containing 10 wt% ZIF-8 in PIM-1/6FDA-DAM showing the best combination of permeability and selectivity.415 ZIF-8 and SiO2 were also investigated as fillers in TOX-PIM-1 by Song et al., where the authors first blended the filler with PIM-1 and the entire system was thermally oxidized as described previously.393,416 For a 50
90 CO2/N2 mixtures at 3 bar total pressure, with MMMs containing 10 wt% ZIF-8 in PIM-1/6FDA-DAM showing the best combination of permeability and selectivity.415 ZIF-8 and SiO2 were also investigated as fillers in TOX-PIM-1 by Song et al., where the authors first blended the filler with PIM-1 and the entire system was thermally oxidized as described previously.393,416 For a 50![[thin space (1/6-em)]](https://www.rsc.org/images/entities/char_2009.gif) :
:![[thin space (1/6-em)]](https://www.rsc.org/images/entities/char_2009.gif) 50 CO2/CH4 mixture for CO2 partial pressure from 2 to 9 bar, the TOX-PIM-1/ZIF-8 and TOX-PIM-1/SiO2 MMMs showed effectively the same mixed-gas selectivity change from 35 to 20, while the pure TOX-PIM-1 selectivity decreased from 60 to 30, indicating improved plasticization resistance due to the presence of the fillers.416 More recently, Xiong et al. developed porous asymmetric composite membranes based from ZIF-8 and the amidoxime-functionalized polymer, AO-PIM-1.417 The MOF was grown in situ using the amidoxime functionality as coordinate sites for Zn2+ ions. The membranes had H2 permeabilities of 5688 barrer and H2/CO2 selectivities of 12.
50 CO2/CH4 mixture for CO2 partial pressure from 2 to 9 bar, the TOX-PIM-1/ZIF-8 and TOX-PIM-1/SiO2 MMMs showed effectively the same mixed-gas selectivity change from 35 to 20, while the pure TOX-PIM-1 selectivity decreased from 60 to 30, indicating improved plasticization resistance due to the presence of the fillers.416 More recently, Xiong et al. developed porous asymmetric composite membranes based from ZIF-8 and the amidoxime-functionalized polymer, AO-PIM-1.417 The MOF was grown in situ using the amidoxime functionality as coordinate sites for Zn2+ ions. The membranes had H2 permeabilities of 5688 barrer and H2/CO2 selectivities of 12.
A number of different ZIFs have been investigated as a filler for PIM-1. Hao et al. combined up to 30 wt% of ZIF-71 in PIM-1, followed by UV treatment to promote photo-oxidative scission that resulted in a dense selective layer as described by Song et al. earlier.390,418 ZIF-71 was chosen for its large pore aperture of 4.2 Å to promote permeability. The UV-treated 30 wt% ZIF-71/PIM-1 MMM showed a pure-gas CO2/CH4 selectivity of 35.6, which was greater than the demonstrated mixed-gas selectivity of 28.8 and 28.3 for a 50![[thin space (1/6-em)]](https://www.rsc.org/images/entities/char_2009.gif) :
:![[thin space (1/6-em)]](https://www.rsc.org/images/entities/char_2009.gif) 50 and 30
50 and 30![[thin space (1/6-em)]](https://www.rsc.org/images/entities/char_2009.gif) :
:![[thin space (1/6-em)]](https://www.rsc.org/images/entities/char_2009.gif) 70 CO2/CH4 gas mixtures at ∼7 bar total pressure. Additionally, the mixed-gas CO2 permeability for a 50
70 CO2/CH4 gas mixtures at ∼7 bar total pressure. Additionally, the mixed-gas CO2 permeability for a 50![[thin space (1/6-em)]](https://www.rsc.org/images/entities/char_2009.gif) :
:![[thin space (1/6-em)]](https://www.rsc.org/images/entities/char_2009.gif) 50 CO2/CH4 mixture increased from 2,224 to 3,020 barrer with increased loading from 20 wt% to 30 wt%.418 Wu et al. investigated MMMs with up to 30 wt% of ZIF-67 in PIM-1. ZIF-67 is isostructural to ZIF-8, but contains Co instead of Zn, which results in slightly stiffer metal–ligand coordination, and hence improved size-sieving separations.419 The MMMs were tested in a 30
50 CO2/CH4 mixture increased from 2,224 to 3,020 barrer with increased loading from 20 wt% to 30 wt%.418 Wu et al. investigated MMMs with up to 30 wt% of ZIF-67 in PIM-1. ZIF-67 is isostructural to ZIF-8, but contains Co instead of Zn, which results in slightly stiffer metal–ligand coordination, and hence improved size-sieving separations.419 The MMMs were tested in a 30![[thin space (1/6-em)]](https://www.rsc.org/images/entities/char_2009.gif) :
:![[thin space (1/6-em)]](https://www.rsc.org/images/entities/char_2009.gif) 70 CO2/CH4 mixture at 2 bar CO2 partial pressure and showed a decrease in mixed-gas selectivity when compared to the pure-gas selectivity, with the smallest decrease from 12 to 11.2 observed for the 30 wt% loaded MMM.419 The same group also reported the transport behavior of up to 36 wt% of ZIF-67 hollow nanoparticles (ZIF-HNPs) in a PIM-1 matrix.420 The authors differentiate conventional solid nanoparticles (ZIF-SNPs) from ZIF-HNPs by the ability to regulate the cavity size of ZIF-HNPs and thereby control the permeability ratio of PIM-1 to the ZIF-HNPs.420 Under the same testing conditions, similar changes in mixed-gas selectivity were observed with the highest loading MMMs showing the smallest decrease from 17 to 16.420 Again from the same group, Wang et al. investigated the effect of up to 30 wt% of amino-functionalized ZIF-7 (NH2-ZIF-7) in PIM-1.421 The authors suggested that the addition of the –NH2 promoted favorable interaction with the PIM-1 matrix and caused rigidification of the polymer chains at the interface and partial blockage of the MOF pores. Under the same 30
70 CO2/CH4 mixture at 2 bar CO2 partial pressure and showed a decrease in mixed-gas selectivity when compared to the pure-gas selectivity, with the smallest decrease from 12 to 11.2 observed for the 30 wt% loaded MMM.419 The same group also reported the transport behavior of up to 36 wt% of ZIF-67 hollow nanoparticles (ZIF-HNPs) in a PIM-1 matrix.420 The authors differentiate conventional solid nanoparticles (ZIF-SNPs) from ZIF-HNPs by the ability to regulate the cavity size of ZIF-HNPs and thereby control the permeability ratio of PIM-1 to the ZIF-HNPs.420 Under the same testing conditions, similar changes in mixed-gas selectivity were observed with the highest loading MMMs showing the smallest decrease from 17 to 16.420 Again from the same group, Wang et al. investigated the effect of up to 30 wt% of amino-functionalized ZIF-7 (NH2-ZIF-7) in PIM-1.421 The authors suggested that the addition of the –NH2 promoted favorable interaction with the PIM-1 matrix and caused rigidification of the polymer chains at the interface and partial blockage of the MOF pores. Under the same 30![[thin space (1/6-em)]](https://www.rsc.org/images/entities/char_2009.gif) :
:![[thin space (1/6-em)]](https://www.rsc.org/images/entities/char_2009.gif) 70 CO2/CH4 mixed-gas testing conditions, the highest loading MMM tested showed the smallest decrease in mixed-gas selectivity from 21 to 20.421 Task-specific ionic liquids (TSILs) have also been used to modify ZIF-67 to form MMMs with PIM-1 by Han et al.422 Specifically, the TSILs shown in Fig. 53, tetramethylgunidinium phenol (TMGHPhO) and tetramethylgunidinium imidazole (TMGHIM), were coated on the ZIF-67 particles and were hypothesized to improve CO2 solubility as well as improve the interfacial compatibility between the MOF and the PIM-1 matrix. For a 50
70 CO2/CH4 mixed-gas testing conditions, the highest loading MMM tested showed the smallest decrease in mixed-gas selectivity from 21 to 20.421 Task-specific ionic liquids (TSILs) have also been used to modify ZIF-67 to form MMMs with PIM-1 by Han et al.422 Specifically, the TSILs shown in Fig. 53, tetramethylgunidinium phenol (TMGHPhO) and tetramethylgunidinium imidazole (TMGHIM), were coated on the ZIF-67 particles and were hypothesized to improve CO2 solubility as well as improve the interfacial compatibility between the MOF and the PIM-1 matrix. For a 50![[thin space (1/6-em)]](https://www.rsc.org/images/entities/char_2009.gif) :
:![[thin space (1/6-em)]](https://www.rsc.org/images/entities/char_2009.gif) 50 CO2/CH4 mixture at 2 bar total pressure, the 10 wt% TMGHIM@ZIF-67/PIM-1 MMM showed a mixed-gas selectivity of 9.3, lower than the ideal selectivity of 10.5 and suggesting limited sorption enhancement effects.422
50 CO2/CH4 mixture at 2 bar total pressure, the 10 wt% TMGHIM@ZIF-67/PIM-1 MMM showed a mixed-gas selectivity of 9.3, lower than the ideal selectivity of 10.5 and suggesting limited sorption enhancement effects.422
 | ||
| Fig. 53 Chemical structures for (a) TMGHPhO and (b) TMGHIM used to modify ZIF-67.422 | ||
Significant research efforts have focused on the addition of UiO-66 derivatives in microporous matrices. Tien-Binh et al. explored the incorporation of UiO-66-NH2 in PIM-1 through an in situ cross-interfacial nucleophilic aromatic substitution reaction during polymer synthesis shown in Fig. 54a.423 By introducing the UiO-66-NH2 particle as a starting polymerization reagent, the MOF effectively acts as a chain terminator for PIM-1 polymer chains, thus introducing a covalent bond between the polymer and the filler. This system was tested for a 50![[thin space (1/6-em)]](https://www.rsc.org/images/entities/char_2009.gif) :
:![[thin space (1/6-em)]](https://www.rsc.org/images/entities/char_2009.gif) 50 CO2/CH4 mixture from 2 to 10 bar CO2 partial pressure and showed a constant selectivity of 19 across the entire pressure range, while the control UiO-66-NH2/PIM-1 MMM showed a decrease in selectivity from 13 to 10.423 UiO-66-NH2 was also used as a filler in partially converted amidoxime-modified PIM-1 (PAO-PIM-1) by Wang et al.424 The authors hypothesized that a hydrogen bonding network between the –NH2 groups on the MOFs and the amidoxime groups on the PAO-PIM-1 backbone would result in improved interfacial compatibility as shown in Fig. 54b. An MMM containing 30 wt% UiO-66-NH2 was tested under a mixed CO2/CH4 and CO2/N2 feed at 1 bar total pressure with varying volumetric compositions (3
50 CO2/CH4 mixture from 2 to 10 bar CO2 partial pressure and showed a constant selectivity of 19 across the entire pressure range, while the control UiO-66-NH2/PIM-1 MMM showed a decrease in selectivity from 13 to 10.423 UiO-66-NH2 was also used as a filler in partially converted amidoxime-modified PIM-1 (PAO-PIM-1) by Wang et al.424 The authors hypothesized that a hydrogen bonding network between the –NH2 groups on the MOFs and the amidoxime groups on the PAO-PIM-1 backbone would result in improved interfacial compatibility as shown in Fig. 54b. An MMM containing 30 wt% UiO-66-NH2 was tested under a mixed CO2/CH4 and CO2/N2 feed at 1 bar total pressure with varying volumetric compositions (3![[thin space (1/6-em)]](https://www.rsc.org/images/entities/char_2009.gif) :
:![[thin space (1/6-em)]](https://www.rsc.org/images/entities/char_2009.gif) 7, 1
7, 1![[thin space (1/6-em)]](https://www.rsc.org/images/entities/char_2009.gif) :
:![[thin space (1/6-em)]](https://www.rsc.org/images/entities/char_2009.gif) 1, and 7
1, and 7![[thin space (1/6-em)]](https://www.rsc.org/images/entities/char_2009.gif) :
:![[thin space (1/6-em)]](https://www.rsc.org/images/entities/char_2009.gif) 3). For both gas mixtures, the mixed-gas selectivity increased with CO2 partial pressure, indicating beneficial competitive sorption and minimal plasticization for the tested pressure range.424 Another UiO-66 derivative, UiO-66-CN, was investigated by Yu et al. for incorporation into PIM-1, followed by a high temperature cure to form bulky triazine rings between two nitrile groups of separate PIM-1 chains and the nitrile group of UiO-66-CN, using a thermal crosslinking reaction as described earlier in this section. The process is shown in Fig. 54c.392,425 The 20 wt% MMM showed hysteresis resistance via high pressure CO2 cycling tests, where consistent CO2 permeability was observed for a 50
3). For both gas mixtures, the mixed-gas selectivity increased with CO2 partial pressure, indicating beneficial competitive sorption and minimal plasticization for the tested pressure range.424 Another UiO-66 derivative, UiO-66-CN, was investigated by Yu et al. for incorporation into PIM-1, followed by a high temperature cure to form bulky triazine rings between two nitrile groups of separate PIM-1 chains and the nitrile group of UiO-66-CN, using a thermal crosslinking reaction as described earlier in this section. The process is shown in Fig. 54c.392,425 The 20 wt% MMM showed hysteresis resistance via high pressure CO2 cycling tests, where consistent CO2 permeability was observed for a 50![[thin space (1/6-em)]](https://www.rsc.org/images/entities/char_2009.gif) :
:![[thin space (1/6-em)]](https://www.rsc.org/images/entities/char_2009.gif) 50 CO2/N2 feed cycled three times between 1.4 to 4 bar.425 UiO-66 was once again modified by Prasetya et al. through a mixed-ligand approach by loading azobenzene linkers inside of the framework.426 The MMMs were tested for a 15
50 CO2/N2 feed cycled three times between 1.4 to 4 bar.425 UiO-66 was once again modified by Prasetya et al. through a mixed-ligand approach by loading azobenzene linkers inside of the framework.426 The MMMs were tested for a 15![[thin space (1/6-em)]](https://www.rsc.org/images/entities/char_2009.gif) :
:![[thin space (1/6-em)]](https://www.rsc.org/images/entities/char_2009.gif) 85 CO2/N2 mixed feed at 1.4 bar total pressure, and it was found that higher loadings of azobenzene linkers displayed a smaller difference between pure-gas and mixed-gas selectivity, with the 100% azobenzene linker MOF showing a decrease in selectivity from 19 to 18. The change in performance with respect to increasing azobenzene linker percentage was attributed to the bulky azobenzene structure causing decreased CO2 sorption, resulting in improving plasticization resistance.426 UiO-66-NH2 was also investigated as a filler in a blended PIM-1/MEEP80 system by Muldoon et al., where the –NH2 functionality was hypothesized to promote favorable polymer–filler interactions and thereby improve plasticization resistance.427 The MMM with 10 wt% loading of UiO-66-NH2 in a 75
85 CO2/N2 mixed feed at 1.4 bar total pressure, and it was found that higher loadings of azobenzene linkers displayed a smaller difference between pure-gas and mixed-gas selectivity, with the 100% azobenzene linker MOF showing a decrease in selectivity from 19 to 18. The change in performance with respect to increasing azobenzene linker percentage was attributed to the bulky azobenzene structure causing decreased CO2 sorption, resulting in improving plasticization resistance.426 UiO-66-NH2 was also investigated as a filler in a blended PIM-1/MEEP80 system by Muldoon et al., where the –NH2 functionality was hypothesized to promote favorable polymer–filler interactions and thereby improve plasticization resistance.427 The MMM with 10 wt% loading of UiO-66-NH2 in a 75![[thin space (1/6-em)]](https://www.rsc.org/images/entities/char_2009.gif) :
:![[thin space (1/6-em)]](https://www.rsc.org/images/entities/char_2009.gif) 25 PIM-1/MEEP80 blend was tested in a 14
25 PIM-1/MEEP80 blend was tested in a 14![[thin space (1/6-em)]](https://www.rsc.org/images/entities/char_2009.gif) :
:![[thin space (1/6-em)]](https://www.rsc.org/images/entities/char_2009.gif) 86 CO2/N2 mixed-gas feed from 1.5 to 3.5 bar total pressure, showing a small decrease in mixed-gas selectivity from 27.1 to 26.7.427 Work by Geng et al. has also implemented defect-engineered UiO-66 nanoparticles as pillars to prevent the collapse of the PIM-1 structure and reduce physical aging.428 In another recent study, Husna et al. grafted UiO-66-NH2 particles with PIM-1 to increase the overall compatibility of the filler into a PEBAX matrix.429 The surface-modified MOF provided additional molecular transport channels for the MMM, yielding a CO2 permeability of 247 with a CO2/N2 selectivity of 56, improved mechanical properties and excellent aging resistance.
86 CO2/N2 mixed-gas feed from 1.5 to 3.5 bar total pressure, showing a small decrease in mixed-gas selectivity from 27.1 to 26.7.427 Work by Geng et al. has also implemented defect-engineered UiO-66 nanoparticles as pillars to prevent the collapse of the PIM-1 structure and reduce physical aging.428 In another recent study, Husna et al. grafted UiO-66-NH2 particles with PIM-1 to increase the overall compatibility of the filler into a PEBAX matrix.429 The surface-modified MOF provided additional molecular transport channels for the MMM, yielding a CO2 permeability of 247 with a CO2/N2 selectivity of 56, improved mechanical properties and excellent aging resistance.
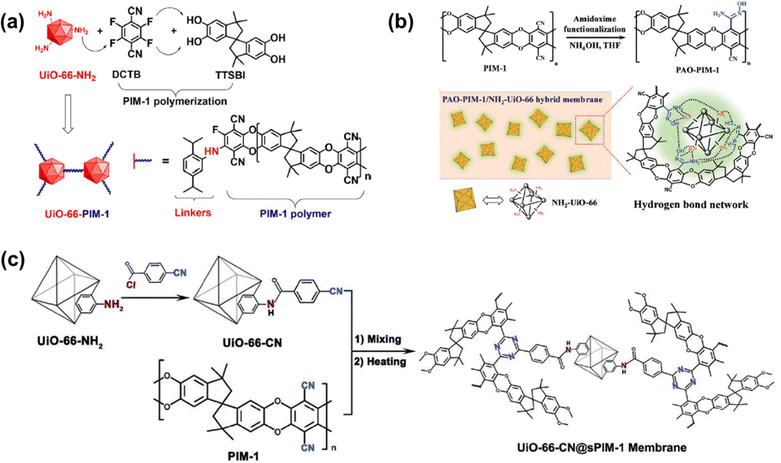 | ||
| Fig. 54 Conceptualization for the integration of UiO-66-based MOFs in polymers of intrinsic microporosity via (a) direct nucleophilic aromatic substitution during synthesis,423 (b) hydrogen bonding,424 and (c) post-synthesis crosslinking.425 Reprinted with permission from ref. 423–425 (Copyright Elsevier, 2018; Royal Society of Chemistry, 2017; and Wiley-VCH, 2019). | ||
Another class of widely investigated MOFs are MIL-type MOFs. For simplicity, MIL-101 refers to MIL-101(Cr) MOF unless stated otherwise. Khdhayyer et al. investigated the effect of MIL-101 MOFs and their derivatives in PIM-1.430 The authors found that MIL-101 showed the best performance among those tested. The 47 vol% MIL-101/PIM-1 MMM was tested for 15![[thin space (1/6-em)]](https://www.rsc.org/images/entities/char_2009.gif) :
:![[thin space (1/6-em)]](https://www.rsc.org/images/entities/char_2009.gif) 85 CO2/N2 and 35
85 CO2/N2 and 35![[thin space (1/6-em)]](https://www.rsc.org/images/entities/char_2009.gif) :
:![[thin space (1/6-em)]](https://www.rsc.org/images/entities/char_2009.gif) 65 CO2/CH4 mixtures from 1 to 6 bar total pressure, showing small decreases in mixed-gas selectivity of 27 to 25 and 24 to 20, respectively.430 Sabetghadam et al. reported the incorporation of NH2-MIL-53(Al) with Matrimid® in a PIM-1 matrix.431 The authors hypothesized that a small loading of Matrimid® would promote enhanced phase compatibility between the MOF and PIM-1. For an MMM containing 25 wt% loading of MOF in a 9.1
65 CO2/CH4 mixtures from 1 to 6 bar total pressure, showing small decreases in mixed-gas selectivity of 27 to 25 and 24 to 20, respectively.430 Sabetghadam et al. reported the incorporation of NH2-MIL-53(Al) with Matrimid® in a PIM-1 matrix.431 The authors hypothesized that a small loading of Matrimid® would promote enhanced phase compatibility between the MOF and PIM-1. For an MMM containing 25 wt% loading of MOF in a 9.1![[thin space (1/6-em)]](https://www.rsc.org/images/entities/char_2009.gif) :
:![[thin space (1/6-em)]](https://www.rsc.org/images/entities/char_2009.gif) 90.9 Matrimid®/PIM-1 blend, mixed-gas selectivity for a 15
90.9 Matrimid®/PIM-1 blend, mixed-gas selectivity for a 15![[thin space (1/6-em)]](https://www.rsc.org/images/entities/char_2009.gif) :
:![[thin space (1/6-em)]](https://www.rsc.org/images/entities/char_2009.gif) 85 CO2/N2 feed compared to a feed with 2.3 mol% water increased from 23 to 28, demonstrating beneficial competitive sorption effects resulting from a plasticization-resistant MMM.431 Similarly, Fan et al. fabricated MMMs with loadings up to 30 wt% using NH2-MIL-53(Al) in Tröger's base polymers to take advantage of beneficial interaction between the MOF –NH2 and the Tröger's base functionality.432 For 10
85 CO2/N2 feed compared to a feed with 2.3 mol% water increased from 23 to 28, demonstrating beneficial competitive sorption effects resulting from a plasticization-resistant MMM.431 Similarly, Fan et al. fabricated MMMs with loadings up to 30 wt% using NH2-MIL-53(Al) in Tröger's base polymers to take advantage of beneficial interaction between the MOF –NH2 and the Tröger's base functionality.432 For 10![[thin space (1/6-em)]](https://www.rsc.org/images/entities/char_2009.gif) :
:![[thin space (1/6-em)]](https://www.rsc.org/images/entities/char_2009.gif) 90 CO2/N2 and 50
90 CO2/N2 and 50![[thin space (1/6-em)]](https://www.rsc.org/images/entities/char_2009.gif) :
:![[thin space (1/6-em)]](https://www.rsc.org/images/entities/char_2009.gif) 50 CO2/CH4 mixtures ranging from 4 to 15 bar total feed pressure, the 20% loading MMM showed a constant mixed-gas selectivity for both mixtures of 26 and 24, respectively, while the mixed-gas selectivity for the pure polymer decreased from 26 to 22 for the CO2/CH4 mixture.432
50 CO2/CH4 mixtures ranging from 4 to 15 bar total feed pressure, the 20% loading MMM showed a constant mixed-gas selectivity for both mixtures of 26 and 24, respectively, while the mixed-gas selectivity for the pure polymer decreased from 26 to 22 for the CO2/CH4 mixture.432
Prasetya et al. also investigated the use of Azo-DMOF-1 as a filler in PIM-1, shown in Fig. 55a.433 The authors hypothesized that the azobenzene functionalities would improve CO2 sorption. When tested for a 50![[thin space (1/6-em)]](https://www.rsc.org/images/entities/char_2009.gif) :
:![[thin space (1/6-em)]](https://www.rsc.org/images/entities/char_2009.gif) 50 CO2/N2 mixed feed at 1.5 bar total pressure, the 10 wt% Azo-DMOF-1/PIM-1 MMM showed a decrease in pure- to mixed-gas selectivity from 20 to 11, indicating limited sorption enhancement effects.433 Mg-MOF-74 was also used to form MMMs with PIM-1 by Tien-Binh et al.434 The authors hypothesized that the hydroxyl groups of the Mg-MOF-74 fillers could undergo a chemical crosslinking reaction with the fluoride chain ends of PIM-1 and improve interfacial compatibility while constructing channels for gas transport, shown in Fig. 55b. PIM-1 and MMMs containing 10 and 20 wt% MOF in PIM-1 were tested using 50
50 CO2/N2 mixed feed at 1.5 bar total pressure, the 10 wt% Azo-DMOF-1/PIM-1 MMM showed a decrease in pure- to mixed-gas selectivity from 20 to 11, indicating limited sorption enhancement effects.433 Mg-MOF-74 was also used to form MMMs with PIM-1 by Tien-Binh et al.434 The authors hypothesized that the hydroxyl groups of the Mg-MOF-74 fillers could undergo a chemical crosslinking reaction with the fluoride chain ends of PIM-1 and improve interfacial compatibility while constructing channels for gas transport, shown in Fig. 55b. PIM-1 and MMMs containing 10 and 20 wt% MOF in PIM-1 were tested using 50![[thin space (1/6-em)]](https://www.rsc.org/images/entities/char_2009.gif) :
:![[thin space (1/6-em)]](https://www.rsc.org/images/entities/char_2009.gif) 50 CO2/CH4 mixed-gas feeds ranging from 4 to 20 bar total pressure. PIM-1 showed a drop in mixed-gas selectivity from 13 to 6 as a result of increasing CH4 permeability with pressure. Meanwhile, the 10 and 20 wt% MMMs showed stable CH4 permeability and consistent mixed-gas selectivity of 13.1 and 19.2, respectively, indicating effective plasticization resistance.434 In 2022, Pu et al. incorporated amino-functionalized NUS-8-MOF nanosheets into PIM-1435 to increase interfacial compatibility and improve overall CO2 transport in MMMs. At a 10 wt% filler loading, the MMMs had a CO2 permeability of 14
50 CO2/CH4 mixed-gas feeds ranging from 4 to 20 bar total pressure. PIM-1 showed a drop in mixed-gas selectivity from 13 to 6 as a result of increasing CH4 permeability with pressure. Meanwhile, the 10 and 20 wt% MMMs showed stable CH4 permeability and consistent mixed-gas selectivity of 13.1 and 19.2, respectively, indicating effective plasticization resistance.434 In 2022, Pu et al. incorporated amino-functionalized NUS-8-MOF nanosheets into PIM-1435 to increase interfacial compatibility and improve overall CO2 transport in MMMs. At a 10 wt% filler loading, the MMMs had a CO2 permeability of 14![[thin space (1/6-em)]](https://www.rsc.org/images/entities/char_2009.gif) 000 barrer and a CO2/N2 selectivity of 30. The effect of plasticization on the MMMs was tested using mixed-gas high-pressure permeation tests up to 50 bar for CO2/N2 and CO2/CH4 mixtures at 20 vol% and 30 vol% of CO2, respectively. No plasticization was observed for CO2/N2 tests up to 50 bar. In CO2/CH4 tests, CH4 permeability increased slightly after approximately 5 bar for PIM-1. The plasticization pressure for CH4 decreased as a function of MOF addition, where at 13.2% MOF loading, no increase in CH4 permeability was observed up to 50 bar.
000 barrer and a CO2/N2 selectivity of 30. The effect of plasticization on the MMMs was tested using mixed-gas high-pressure permeation tests up to 50 bar for CO2/N2 and CO2/CH4 mixtures at 20 vol% and 30 vol% of CO2, respectively. No plasticization was observed for CO2/N2 tests up to 50 bar. In CO2/CH4 tests, CH4 permeability increased slightly after approximately 5 bar for PIM-1. The plasticization pressure for CH4 decreased as a function of MOF addition, where at 13.2% MOF loading, no increase in CH4 permeability was observed up to 50 bar.
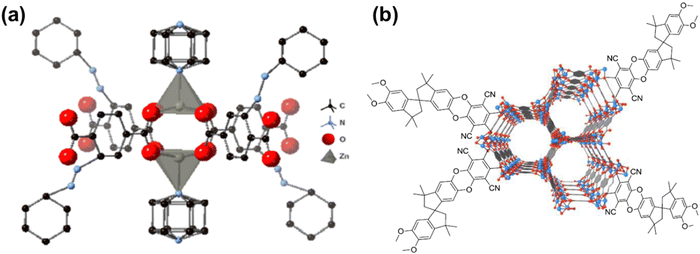 | ||
| Fig. 55 (a) Structure for Azo-DMOF-1433 and (b) conceptualization of transport channels created by Mg-MOF-74 in PIM-1.434 Reprinted with permission from ref. 433 and 434 (Copyright American Chemical Society, 2018 and Elsevier, 2016). | ||
4.3.2.2. Other fillers. While MOFs occupy a large portion of the research space for fillers in polymer membranes, several other fillers have also been investigated such as silica-based particles, carbon nanotubes, graphene oxide, and porous organic frameworks.
Polyhedral oligomeric silsesquioxane (POSS) nanoparticles have been investigated as a filler in PIM-1 due to their potential to improve gas diffusion by increasing porosity as well as for their tunable functional groups to improve compatibility and dispersibility.436 For example, Yong et al. created MMMs using up to 20 wt% of DiSilanolIsobutyl POSS nanoparticles (SO1440) in PIM-1 to study changes in plasticization behavior with filler content.436 DiSilanolIsobutyl POSS, shown in Fig. 56a, was chosen for its high solubility in a dichloromethane casting solvent. MMMs containing 2 and 10 wt% of POSS were tested using a 50![[thin space (1/6-em)]](https://www.rsc.org/images/entities/char_2009.gif) :
:![[thin space (1/6-em)]](https://www.rsc.org/images/entities/char_2009.gif) 50 CO2/CH4 mixed feed from ∼5 to ∼30 bar total pressure and showed a similar decrease in mixed-gas selectivity from 12.5 to 9 with increasing pressure.436 Kinoshita et al. investigated the effect of up to 20 wt% of nitro- and amine-modified POSS particles in PIM-1, hypothesizing that the modified groups could promote improved interfacial compatibility between the filler and the polymer matrix. The structure of the amine-modified POSS (OAPS) is shown in Fig. 56b.437 The 5 wt% amine-modified POSS MMM was tested for 50
50 CO2/CH4 mixed feed from ∼5 to ∼30 bar total pressure and showed a similar decrease in mixed-gas selectivity from 12.5 to 9 with increasing pressure.436 Kinoshita et al. investigated the effect of up to 20 wt% of nitro- and amine-modified POSS particles in PIM-1, hypothesizing that the modified groups could promote improved interfacial compatibility between the filler and the polymer matrix. The structure of the amine-modified POSS (OAPS) is shown in Fig. 56b.437 The 5 wt% amine-modified POSS MMM was tested for 50![[thin space (1/6-em)]](https://www.rsc.org/images/entities/char_2009.gif) :
:![[thin space (1/6-em)]](https://www.rsc.org/images/entities/char_2009.gif) 50 CO2/CH4 and 50
50 CO2/CH4 and 50![[thin space (1/6-em)]](https://www.rsc.org/images/entities/char_2009.gif) :
:![[thin space (1/6-em)]](https://www.rsc.org/images/entities/char_2009.gif) 50 CO2/N2 mixtures from 2 to 10 bar CO2 partial pressure. For the CO2/CH4 mixture, the mixed-gas selectivity decreased from 12 to 9, while CO2/N2 mixed-gas selectivity decreased from 17.5 to 15 with increasing pressure.437
50 CO2/N2 mixtures from 2 to 10 bar CO2 partial pressure. For the CO2/CH4 mixture, the mixed-gas selectivity decreased from 12 to 9, while CO2/N2 mixed-gas selectivity decreased from 17.5 to 15 with increasing pressure.437
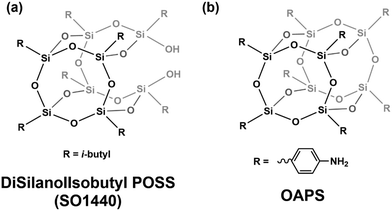 | ||
| Fig. 56 Chemical structures for (a) DiSilanolIsobutyl POSS436 and (b) octa aminophenyl POSS (OAPS).437 | ||
Carbon nanotubes have received interest as a filler in polymer membranes for their beneficial mechanical properties and fast diffusion due to their inherent inner-wall smoothness. Khan et al. synthesized functionalized multi-walled carbon nanotubes (f-MWCNTs) as a filler in PIM-1.438 The authors modified the MWCNTs with poly(ethylene glycol) (PEG) to aid in matrix dispersion and created MMMs with up to 3% f-MWCNT loading. Addition of just 0.5 wt% of f-MWCNTs resulted in the elimination of a plasticization pressure for high pressure CO2 tests up to ∼30 bar, which was attributed to the strong interaction between the PEG functionality and the polymer matrix.438 Along a similar line, Sun et al. synthesized pristine, acid-, and amine-functionalized MWCNTs as a filler in Cardo-PIM-1.439 The MMMs were tested for a 50![[thin space (1/6-em)]](https://www.rsc.org/images/entities/char_2009.gif) :
:![[thin space (1/6-em)]](https://www.rsc.org/images/entities/char_2009.gif) 50 CO2/N2 mixture at ∼1 bar, showing the highest selectivity for the amine-functionalized MWCNTs.439
50 CO2/N2 mixture at ∼1 bar, showing the highest selectivity for the amine-functionalized MWCNTs.439
In addition to the 1-D nature of carbon nanotubes, 2-D sheet-like materials have been used as fillers as well. For example, Kim et al. formed 2-D scaffolds of graphene oxide nanosheets inside of a TR polymer.440 Graphene oxide (GO) was expected to improve size selectivity and mechanical properties of the material. MMMs with 1.0 wt% loading of GO showed a CO2/CH4 pure-gas selectivity of 32.4 and a mixed-gas selectivity of 35.1 for a 50![[thin space (1/6-em)]](https://www.rsc.org/images/entities/char_2009.gif) :
:![[thin space (1/6-em)]](https://www.rsc.org/images/entities/char_2009.gif) 50 mixture at ∼1 bar total feed pressure. A slight increase in selectivity was observed for CO2/N2 as well, from 17.7 to 18.2.440
50 mixture at ∼1 bar total feed pressure. A slight increase in selectivity was observed for CO2/N2 as well, from 17.7 to 18.2.440
In contrast to MOFs, another category of fillers that have been incorporated into microporous polymers are porous organic frameworks (POFs). These materials are similar to MOFs in that the porous structure is meant to improve diffusion and potentially diffusion selectivity, but they do not contain metal–ligand coordinative bonds. As such, the porous structure is entirely organic, and thus, it is expected to have better dispersion in the continuous organic polymer phase.441 Bushell et al. synthesized a porous imine cage (CC3) as a filler for PIM-1 (Fig. 57a).441 CC3 was synthesized from 1,3,5-triformylbenzene and (R,R)-1,2-diaminocyclohexane to form a cage-like structure. MMMs with 30 wt% loading were tested in a ternary 35![[thin space (1/6-em)]](https://www.rsc.org/images/entities/char_2009.gif) :
:![[thin space (1/6-em)]](https://www.rsc.org/images/entities/char_2009.gif) 10
10![[thin space (1/6-em)]](https://www.rsc.org/images/entities/char_2009.gif) :
:![[thin space (1/6-em)]](https://www.rsc.org/images/entities/char_2009.gif) 55 CO2/O2/N2 mixture for a total pressure up to 6.5 bar and showed an increase in selectivity from 13 to 15 due to a combination of suppressed plasticization and competitive sorption effects.441 Similarly, Yu et al. synthesized MAPDA, a POF made from melamine and 1,4-piperazinedicarboxaldehyde, as a filler in PIM-1 (Fig. 57b).442 MMMs with loadings up to 20 wt% MAPDA were fabricated. The incorporation 15 wt% of the POF showed a decrease in mixed-gas selectivity for a 50
55 CO2/O2/N2 mixture for a total pressure up to 6.5 bar and showed an increase in selectivity from 13 to 15 due to a combination of suppressed plasticization and competitive sorption effects.441 Similarly, Yu et al. synthesized MAPDA, a POF made from melamine and 1,4-piperazinedicarboxaldehyde, as a filler in PIM-1 (Fig. 57b).442 MMMs with loadings up to 20 wt% MAPDA were fabricated. The incorporation 15 wt% of the POF showed a decrease in mixed-gas selectivity for a 50![[thin space (1/6-em)]](https://www.rsc.org/images/entities/char_2009.gif) :
:![[thin space (1/6-em)]](https://www.rsc.org/images/entities/char_2009.gif) 50 CO2/N2 mixture from 40 to 30 with increasing pressure from 2 to 4 bar total pressure. However, a stable CO2/N2 mixed-gas selectivity was observed for up to 70 h of continuous testing at 3 bar feed pressure.442 There have also been significant research efforts into the application of porous aromatic frameworks (PAFs) in microporous polymers, but these materials have primarily been studied for aging resistance.443–446
50 CO2/N2 mixture from 40 to 30 with increasing pressure from 2 to 4 bar total pressure. However, a stable CO2/N2 mixed-gas selectivity was observed for up to 70 h of continuous testing at 3 bar feed pressure.442 There have also been significant research efforts into the application of porous aromatic frameworks (PAFs) in microporous polymers, but these materials have primarily been studied for aging resistance.443–446
5. Overview of plasticization performance of microporous polymers
This section summarizes published work on the plasticization behavior of microporous polymers that have been evaluated through high-pressure permeation and/or mixed-gas tests. In addition, studies on long-term performance and stability of membranes are summarized. A list of recent reports on microporous materials was compiled using the SciFinder search engine, where the keywords “PIM”, “polymers of intrinsic microporosity”, “gas separations”, “membranes”, and “plasticization” were used to identify research papers that reported gas separation performance on microporous polymers until the end of 2022. When not tabulated in the studies, permeability and selectivity data points were digitally extracted using WebPlotDigitizer.4475.1. High-pressure permeation performance
One of the most common methods to evaluate the susceptibility of a membrane to plasticization is a high-pressure permeation test. This test involves increasing the feed pressure of polarizable or condensable gases (e.g., CO2, C3H6, H2S, etc.) while monitoring pure- or mixed-gas permeability. During high-pressure tests, the pressure at which the permeability begins to increase is commonly referred to as the “plasticization pressure”. As discussed in Sections 2 and 3, the plasticization pressure is the point at which increasing diffusion coefficients overtake decreasing sorption coefficients, resulting in an overall increase in permeability.42,72 While the plasticization pressure of the condensable gas can be an initial indication of plasticization in a polymer film, it does not evaluate co-permeating species, and thus reveals no information on changes in selectivity for a real binary separation. Therefore, other more direct indications of plasticization are also discussed in this section. The following sections summarize the performance of a variety of microporous polymers that have been evaluated with high-pressure permeation tests, including polymers with post-synthetic modifications (PSM) and multi-component systems, such as blends and mixed-matrix membranes (MMMs).In general, polymers containing hydrogen bonding groups exhibit less significant increases in CO2 permeability, in both pure- and mixed-gas cases, compared to polymers without hydrogen bonding groups. This finding can be attributed to secondary forces that help facilitate the formation of charge transfer complexes (CTCs) and a reduction in cooperative polymer chain mobility, which is often described in the literature as “rigidifying” polymer chains.34,342–348,448 A more rigorous method to identify plasticization effects involves evaluating the permeability of the weaker sorbing gas at high pressures during mixed-gas tests.34 CH4 is typically not a plasticizing gas due to its lower critical temperature (Tc = 190.55 K) than common plasticizing gases such as CO2 (Tc = 304.13 K). As a result, in a pure-gas scenario, CH4 permeability would not be expected to increase significantly with increasing feed pressure. However, when CO2/CH4 mixtures are considered, polymer chain mobility due to the presence of CO2 can cause CH4 permeability to increase, also known as “CH4-creep,” a phenomena that can more directly identify plasticization effects, especially in cases where CO2 permeability appears constant.34 Notably, when considering CH4 permeability for high-pressure mixed-gas tests, polymers with hydrogen bonding groups generally show smaller increases in CH4 permeability than polymers without hydrogen bonding groups. Secondary forces offer a clear means to mitigate plasticization effects.
Fig. 59 presents normalized CO2/CH4 permselectivity as feed pressure increases. Fig. 59a and b distinguish between polymers with hydrogen bonding groups and polymers without hydrogen bonding groups. Both pure- and mixed-gas permselectivities are reported. In general, mixed-gas permselectivities are lower than pure-gas permselectivities regardless of whether the polymer contains hydrogen bonding groups. This general trend can be attributed to the increase in CH4 permeability in the presence of CO2. Moreover, the decrease in CO2/CH4 selectivity from the pure- to mixed-gas case for polymers without hydrogen bonding groups is much more significant than that for polymers with hydrogen bonding groups, consistent with previous trends suggesting that hydrogen bonding moieties can suppress plasticization.
![[thin space (1/6-em)]](https://www.rsc.org/images/entities/char_2009.gif) :
:![[thin space (1/6-em)]](https://www.rsc.org/images/entities/char_2009.gif) 50 CO2/CH4 mixture for TPDA-APAF and TPDA-ATAF. In this work, Swaidan et al. showed that thermally annealing TPDA-ATAF and TPDA-APAF at 250 °C for 24 h led to more stable CH4 permeabilities up to a CO2 partial pressure of 25 bar.34 While TPDA-ATAF and TPDA-APAF showed mixed-gas CO2 plasticization pressures at ∼10 bar before annealing at 250 °C, no detectable mixed-gas CO2 plasticization pressure up to 25 bar CO2 partial pressure was found after annealing.34 The authors concluded that thermal annealing helped to decrease polymer chain mobility and facilitate CTC formation in both TPDA-ATAF and TPDA-APAF, which improved resistance to CO2-induced swelling.34
50 CO2/CH4 mixture for TPDA-APAF and TPDA-ATAF. In this work, Swaidan et al. showed that thermally annealing TPDA-ATAF and TPDA-APAF at 250 °C for 24 h led to more stable CH4 permeabilities up to a CO2 partial pressure of 25 bar.34 While TPDA-ATAF and TPDA-APAF showed mixed-gas CO2 plasticization pressures at ∼10 bar before annealing at 250 °C, no detectable mixed-gas CO2 plasticization pressure up to 25 bar CO2 partial pressure was found after annealing.34 The authors concluded that thermal annealing helped to decrease polymer chain mobility and facilitate CTC formation in both TPDA-ATAF and TPDA-APAF, which improved resistance to CO2-induced swelling.34
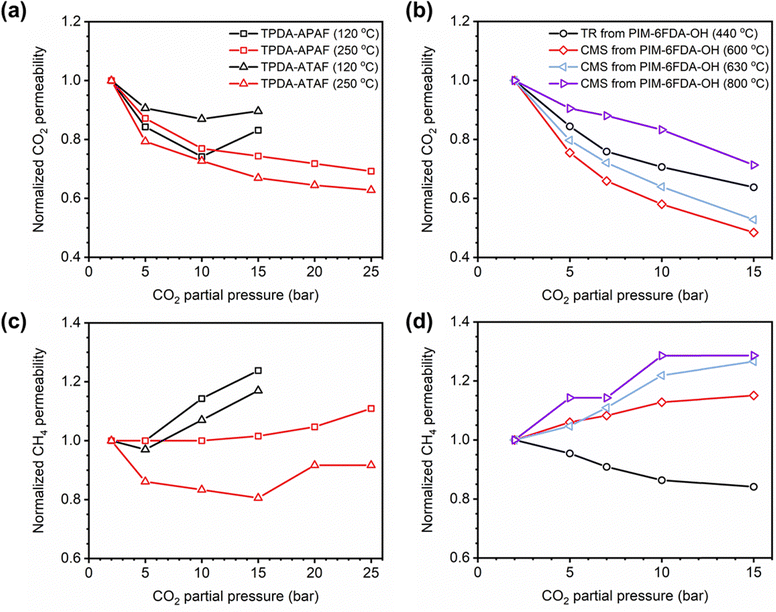 | ||
| Fig. 60 Normalized CO2 permeability vs. CO2 partial pressure for (a) thermally annealed polymers34 and (b) carbon molecular sieves or thermally rearranged polymers.372 Normalized CH4 permeability vs. CO2 partial pressure for (c) thermally annealed polymers34 and (d) carbon molecular sieves or thermally rearranged polymers.372 | ||
In a separate study, Swaidan et al. examined how high-pressure mixed-gas (50![[thin space (1/6-em)]](https://www.rsc.org/images/entities/char_2009.gif) :
:![[thin space (1/6-em)]](https://www.rsc.org/images/entities/char_2009.gif) 50 CO2/CH4) permeation changed between PIM-6FDA-OH and its thermally-rearranged (TR) and carbon molecular sieve (CMS) analogues.372Fig. 60b and d depict the CO2 and CH4 permeabilities as functions of CO2 partial pressure, respectively, of the TR and CMS analogs of PIM-6FDA-OH.372 While the CO2 permeability of the TR analog decreased more than that of the CMS analog treated at 800 °C, the CH4 permeability of the TR analog was more stable than that of the three CMS analogs up to a CO2 partial pressure of 15 bar.372 Swaidan et al. concluded that sorption of CO2 increased due to an increase in the number of ultramicropores formed when transforming the TR polymer to a CMS material.449 The resulting dilation from enhanced CO2 sorption thus increased CH4 permeability.372 However, when treated at 800 °C, pore collapse from heat treatment was significant enough to reduce CO2 sorption and also reduce corresponding effects from dilation.372
50 CO2/CH4) permeation changed between PIM-6FDA-OH and its thermally-rearranged (TR) and carbon molecular sieve (CMS) analogues.372Fig. 60b and d depict the CO2 and CH4 permeabilities as functions of CO2 partial pressure, respectively, of the TR and CMS analogs of PIM-6FDA-OH.372 While the CO2 permeability of the TR analog decreased more than that of the CMS analog treated at 800 °C, the CH4 permeability of the TR analog was more stable than that of the three CMS analogs up to a CO2 partial pressure of 15 bar.372 Swaidan et al. concluded that sorption of CO2 increased due to an increase in the number of ultramicropores formed when transforming the TR polymer to a CMS material.449 The resulting dilation from enhanced CO2 sorption thus increased CH4 permeability.372 However, when treated at 800 °C, pore collapse from heat treatment was significant enough to reduce CO2 sorption and also reduce corresponding effects from dilation.372
Besides thermal annealing and TR/CMS formation, thermal and chemical crosslinking have been used to suppress plasticization in microporous polymers. Fig. 61 displays high-pressure CO2 permeation data for three examples of thermal crosslinking on microporous polymers. Specifically, Fig. 61a shows a comparison between PIM-1 and its thermally-oxidated crosslinked version (TOX-PIM-1).393 PIM-1 and TOX-PIM-1 (treated for 24 h) exhibit similar decreases in mixed-gas (50![[thin space (1/6-em)]](https://www.rsc.org/images/entities/char_2009.gif) :
:![[thin space (1/6-em)]](https://www.rsc.org/images/entities/char_2009.gif) 50 vol% CO2/CH4) CO2 permeability up to a CO2 partial pressure of ∼15 bar.393 When comparing the mixed-gas CO2/CH4 selectivity (Fig. 61d), both samples showed similar decreases over the pressure range considered.393
50 vol% CO2/CH4) CO2 permeability up to a CO2 partial pressure of ∼15 bar.393 When comparing the mixed-gas CO2/CH4 selectivity (Fig. 61d), both samples showed similar decreases over the pressure range considered.393
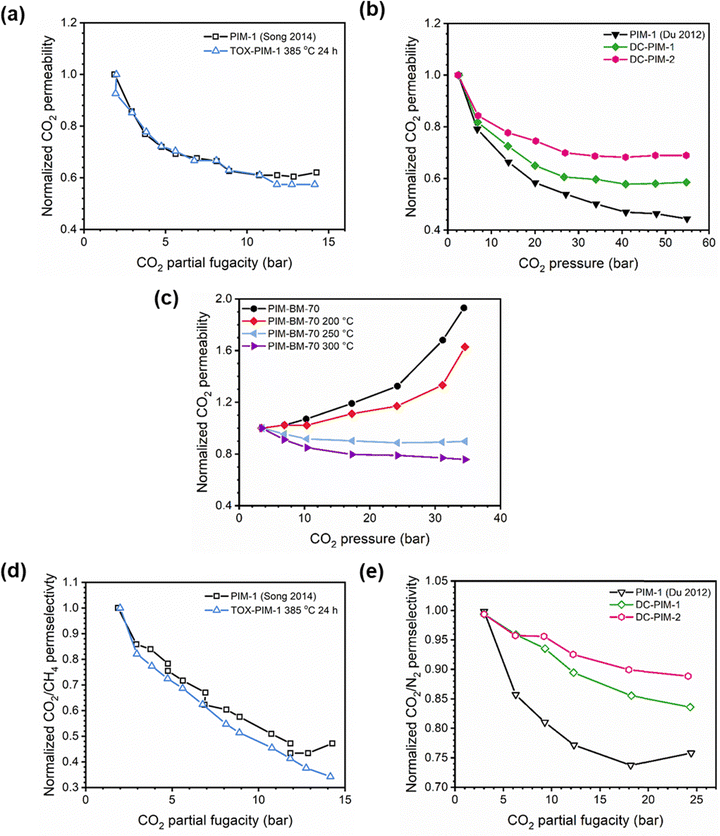 | ||
| Fig. 61 Normalized CO2 permeability vs. CO2 pressure/fugacity for thermally crosslinked samples including (a) TOX-PIM-1,393 (b) decarboxylated PIM-1,391 and (c) PIM-BM-70.394 (d) normalized CO2/CH4 permselectivity for TOX-PIM-1,393 and (e) normalized CO2/N2 permselectivity for decarboxylated PIM-1391vs. CO2 fugacity. | ||
In Fig. 61b, pure-gas high-pressure CO2 permeation data is shown for PIM-1, as well as two thermally crosslinked decarboxylated PIMs, denoted as “DC-PIM-1” and “DC-PIM-2”.391 Before thermal crosslinking, PIM-1 underwent a controlled base hydrolysis reaction to convert the nitrile groups into carboxyl groups.391 C-PIM-1 (degree of hydrolysis = ∼22%) and C-PIM-2 (degree of hydrolysis = ∼41%) were then thermally crosslinked to form DC-PIM-1 and DC-PIM-2.391 While PIM-1, DC-PIM-1, and DC-PIM-2 do not show signs of CO2-induced plasticization pressure points up to a feed pressure of 55 bar, PIM-1 is severely affected by strongly sorbing CO2 (as evident by the large decrease in CO2 permeability as pressure increases).391 However, with increased degrees of hydrolysis and crosslinking, DC-PIM-1 and DC-PIM-2 experience a smaller change in permeability.391 This relative change in normalized CO2 permeability with increasing pressure does not indicate plasticization resistance, but is likely a result of decreased CO2 sorption capacity.450Fig. 61e presents the normalized mixed-gas selectivity for CO2/N2 (90![[thin space (1/6-em)]](https://www.rsc.org/images/entities/char_2009.gif) :
:![[thin space (1/6-em)]](https://www.rsc.org/images/entities/char_2009.gif) 10) for PIM-1, DC-PIM-1, and DC-PIM-2. Notably, the change in selectivity over the fugacity range tested for DC-PIM-1 and DC-PIM-2 is less than that for PIM-1, which the authors attributed to the presence of crosslinks rigidifying the polymer chains and suppressing plasticization.391 This example showcases the importance of mixed-gas testing to elucidate the effects of plasticization. Fig. 61c shows the effects of increasing levels of thermal crosslinking (with increasing temperatures and hold times) on the pure-gas high-pressure CO2 permeation of PIM-BM-70.394 As the degree of crosslinking of PIM-BM-70 increases, the film becomes more plasticization-resistant as evident by the stabilization of CO2 permeability with increasing feed pressure.394
10) for PIM-1, DC-PIM-1, and DC-PIM-2. Notably, the change in selectivity over the fugacity range tested for DC-PIM-1 and DC-PIM-2 is less than that for PIM-1, which the authors attributed to the presence of crosslinks rigidifying the polymer chains and suppressing plasticization.391 This example showcases the importance of mixed-gas testing to elucidate the effects of plasticization. Fig. 61c shows the effects of increasing levels of thermal crosslinking (with increasing temperatures and hold times) on the pure-gas high-pressure CO2 permeation of PIM-BM-70.394 As the degree of crosslinking of PIM-BM-70 increases, the film becomes more plasticization-resistant as evident by the stabilization of CO2 permeability with increasing feed pressure.394
Fig. 62 displays two examples of chemical crosslinking on microporous polymers for high-pressure permeation tests.396,397 As seen in Fig. 62a, Du et al. found that crosslinking PIM-1 with either 4-azido phenyl sulfone (azide1) or 2,6-bis(4-azidobenzylidene)-4-methylcyclohexanone (azide2) (PIM-1/azide mol ratio = 80/20) led to more stable pure-gas CO2 permeabilities up to a feed pressure of ∼20 bar.396 Pure- and mixed-gas CO2/CH4 high-pressure tests for PIM-1/azide1 and PIM-1/azide2 are shown in Fig. 62c.396 In the pure- and mixed-gas (80![[thin space (1/6-em)]](https://www.rsc.org/images/entities/char_2009.gif) :
:![[thin space (1/6-em)]](https://www.rsc.org/images/entities/char_2009.gif) 20 or 50
20 or 50![[thin space (1/6-em)]](https://www.rsc.org/images/entities/char_2009.gif) :
:![[thin space (1/6-em)]](https://www.rsc.org/images/entities/char_2009.gif) 50 mol% CO2/CH4) scenarios, crosslinking led to more stable permselectivities across all pressures tested, suggesting that chemical crosslinking can increase plasticization resistance.396 In Fig. 62b, Khan et al. found that crosslinking PIM-1 with 5 wt% PEG-biazide led to increased stability of pure-gas CO2 permeability up to a feed pressure of ∼30 bar, but further increasing the amount of PEG-biazide up to 20 wt% led to minimal improvements.397 The normalized high-pressure pure-gas CO2/CH4 selectivity as a function of pressure for PIM-1/PEG-biazide is shown in Fig. 62d, where the addition of PEG-biazide led to more stable selectivity.397 Of course, these pure-component tests may not fully capture plasticization effects that would be more apparent in mixed-gas tests.
50 mol% CO2/CH4) scenarios, crosslinking led to more stable permselectivities across all pressures tested, suggesting that chemical crosslinking can increase plasticization resistance.396 In Fig. 62b, Khan et al. found that crosslinking PIM-1 with 5 wt% PEG-biazide led to increased stability of pure-gas CO2 permeability up to a feed pressure of ∼30 bar, but further increasing the amount of PEG-biazide up to 20 wt% led to minimal improvements.397 The normalized high-pressure pure-gas CO2/CH4 selectivity as a function of pressure for PIM-1/PEG-biazide is shown in Fig. 62d, where the addition of PEG-biazide led to more stable selectivity.397 Of course, these pure-component tests may not fully capture plasticization effects that would be more apparent in mixed-gas tests.
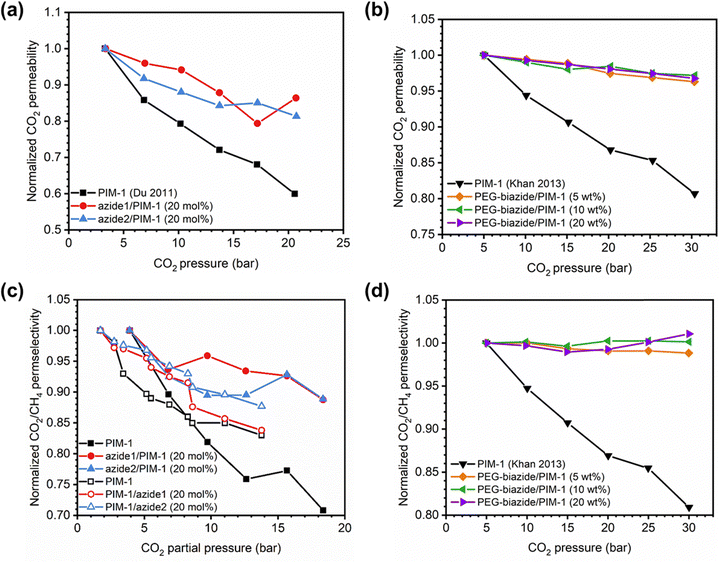 | ||
Fig. 62 Normalized CO2 permeability vs. CO2 pressure for PIM-1 samples chemically crosslinked with (a) azides396 and (b) PEG-biazide.397 CO2 pressure vs. normalized CO2/CH4 permselectivity for PIM-1 samples crosslinked with (c) azides396 and (d) PEG-biazide.397 Filled symbols represent pure-gas measurements, while unfilled symbols represent mixed-gas measurements. For (c), mixed-gas CO2/CH4 compositions tested were 50![[thin space (1/6-em)]](https://www.rsc.org/images/entities/char_2009.gif) : :![[thin space (1/6-em)]](https://www.rsc.org/images/entities/char_2009.gif) 50 or 80 50 or 80![[thin space (1/6-em)]](https://www.rsc.org/images/entities/char_2009.gif) : :![[thin space (1/6-em)]](https://www.rsc.org/images/entities/char_2009.gif) 20 mol%. Total feed pressures tested were 3.4, 6.9, 10.3, 13.8, and 17.2 bar, which correspond to 1.7, 3.4, 5.2, 6.9, and 8.6 bar CO2 partial pressures (50 20 mol%. Total feed pressures tested were 3.4, 6.9, 10.3, 13.8, and 17.2 bar, which correspond to 1.7, 3.4, 5.2, 6.9, and 8.6 bar CO2 partial pressures (50![[thin space (1/6-em)]](https://www.rsc.org/images/entities/char_2009.gif) : :![[thin space (1/6-em)]](https://www.rsc.org/images/entities/char_2009.gif) 50 mol%) and 2.76, 5.51, 8.26, 11.02, and 13.8 bar CO2 partial pressures (80 50 mol%) and 2.76, 5.51, 8.26, 11.02, and 13.8 bar CO2 partial pressures (80![[thin space (1/6-em)]](https://www.rsc.org/images/entities/char_2009.gif) : :![[thin space (1/6-em)]](https://www.rsc.org/images/entities/char_2009.gif) 20 mol%). Note that (d) presents ideal selectivities calculated from pure-gas tests. 20 mol%). Note that (d) presents ideal selectivities calculated from pure-gas tests. | ||
![[thin space (1/6-em)]](https://www.rsc.org/images/entities/char_2009.gif) :
:![[thin space (1/6-em)]](https://www.rsc.org/images/entities/char_2009.gif) 50 vol% CO2/CH4), as highlighted in Fig. 63c and d. These findings contrast those of polyimide/MOF MMMs, where normalized CO2 permeaility, while more stable, often decreases with MOF addition.451–455 Thus, an additional figure of merit needs to be considered to better understand the role of plasticization for MOF-based MMMs formed with microporous polymers.
50 vol% CO2/CH4), as highlighted in Fig. 63c and d. These findings contrast those of polyimide/MOF MMMs, where normalized CO2 permeaility, while more stable, often decreases with MOF addition.451–455 Thus, an additional figure of merit needs to be considered to better understand the role of plasticization for MOF-based MMMs formed with microporous polymers.
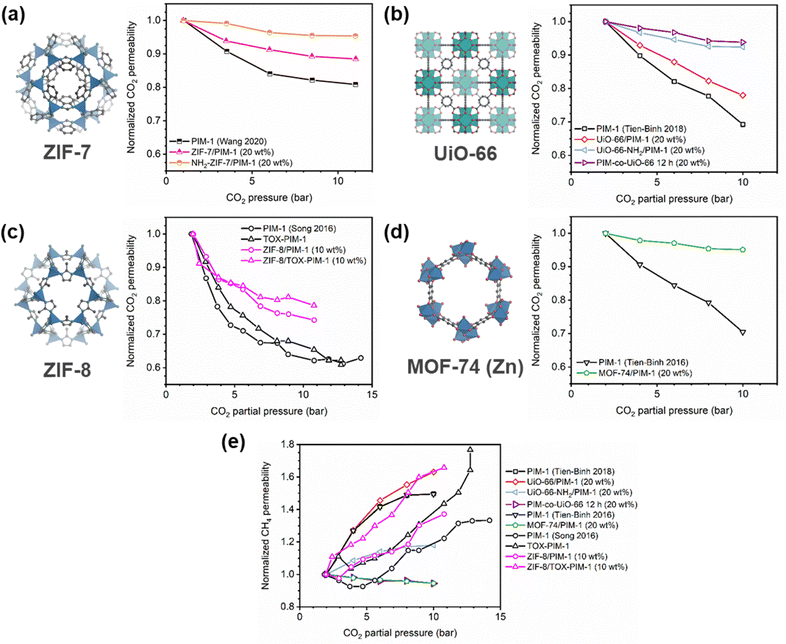 | ||
| Fig. 63 (a)–(d) Normalized CO2 permeability vs. CO2 pressure for select MMMs.416,421,423,434 (a) represents data for pure-gas measurements, while (b)–(d) represents data for mixed-gas measurements. (e) Normalized CH4 permeability versus CO2 partial pressure for mixed-gas tests for select MMMs. For ease of comparison, crystal structures of unfunctionalized MOFs are presented next to corresponding figures. | ||
As previously highlighted, high-pressure CO2 permeability is often insufficient for determining the degree of plasticization resistance for a sample, especially when plasticization pressures (as often indicated by an increase in CO2 diffusivity) are not observed within the pressure range considered. This effect is demonstrated in Fig. 63e, which presents high-pressure mixed-gas CH4 permeabilities for select MMMs as a function of CO2 partial pressure. While previously discussed CO2 data showed an apparent stabilization of permeability with MOF incorporation, MOF addition does not always result in stable CH4 permeabilities as feed pressure increases, indicating susceptibility to plasticization. For instance, over the pressure range tested, the addition of UiO-66 to PIM-1 resulted in a slight increase in normalized CH4 permeability while addition of UiO-66-NH2 to PIM-1 led to more stabilized CH4 permeabilities, due to increased interfacial compatibility from the amine.421 It was also found that the addition of ZIF-8 to either PIM-1 or TOX-PIM-1 led to slightly increased normalized CH4 permeability over the pressure ranges tested.416 Compared to physical mixing of MOFs and polymers, one approach that shows consistent improvements in plasticization resistance is using MOF–polymer crosslinking. For instance, by chemically crosslinking PIM-1 and UiO-66 (PIM-co-UiO-66), the normalized CH4 permeability over the pressure range tested was stable, suggesting plasticization resistance.421 Similarly, crosslinking MOF-74 to PIM-1 resulted in a very stable normalized CH4 permeability over the pressure range tested.434
High-pressure permeation tests have also been conducted on polymer blends as shown in Fig. 64. It was found that the integration of Torlon® into cPIM-1 improved plasticization resistance by forming hydrogen bonds and also reducing the intersegmental mobility in cPIM-1 (Fig. 64a).410 Blends of Matrimid® and cPIM-1 were also studied. While Matrimid® had a pure-gas CO2 plasticization pressure of ∼5 bar, the addition of cPIM-1, even at a small loading of 5 wt%, increased the plasticization pressure up to ∼10 bar (Fig. 64b).225 The suppression of plasticization in Matrimid® by the addition of cPIM-1 was attributed to newly-formed hydrogen bonds between the polymers, as well as the inclusion of the rigid backbone of cPIM-1.225
 values for C3H6 and C3H8 (72 and 70 cmSTP3 cmpol−3, respectively) than PIM-PI-1 (69 and 63 cmSTP3 cmpol−3, respectively), which is consistent with the more microporous structure of KAUST-PI-1.329 However, the kd values for KAUST-PI-1 for C3H6 and C3H8 (7.9 and 6.1 cmSTP3 cmpol−3 bar−1, respectively) are lower than those for PIM-PI-1 (9.9 and 9.0 cmSTP3 cmpol−3 bar−1, respectively), which the authors attributed to the spirobisindane unit of PIM-PI-1 facilitating slightly higher chain mobility than the triptycene unit in KAUST-PI-1 and increasing gas uptake in the equilibrium sorption mode.329 KAUST-PI-1 has a strongly sieving microstructure with narrower ultramicropores (promoted by intrachain rigidity) than PIM-PI-1 and was also found to be more susceptible to plasticization.90,329 PIM-6FDA-OH, on the other hand, sorbs less gas than both KAUST-PI-1 and PIM-PI-1.159 The normalized C3H6 and C3H8 permeability profiles of PIM-6FDA-OH (Fig. 65a and b) are also considerably more stable with increasing pressure than those of KAUST-PI-1 and PIM-PI-1.159 The presence of the hydrogen bonding –OH group in PIM-6FDA-OH creates a denser polymer structure through secondary forces and facilitates CTC formation,159 which help to decrease polymer chain translational motion and mitigate plasticization effects. The lower sorption capacity of PIM-6FDA-OH compared to KAUST-PI-1 and PIM-PI-1 (Fig. 65c) can be attributed to the tighter packing in PIM-6FDA-OH, restricting gas sorption.159,373
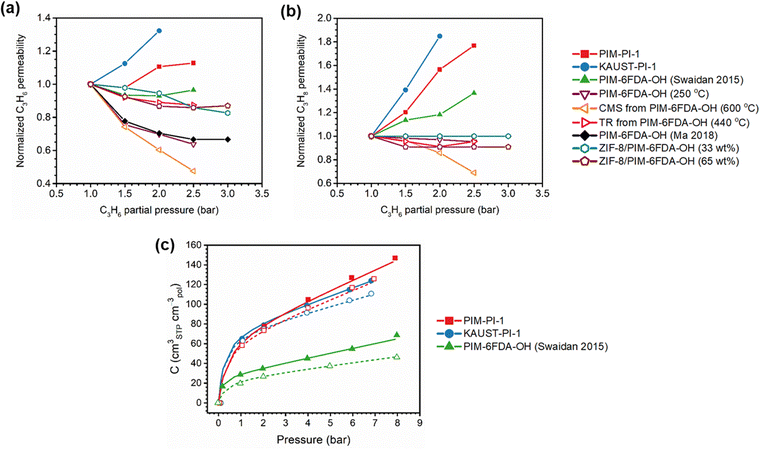 | ||
| Fig. 65 Normalized (a) C3H6 and (b) C3H8 permeabilities vs. C3H6 pressure for select polymers tested in the literature.159,329,373,414 Filled symbols represent untreated samples, while unfilled symbols represent samples that either contain fillers or are treated. (c) Reported C3H6 (solid lines, filled symbols) and C3H8 (dashed lines, unfilled symbols) sorption isotherms that were fit using the dual-mode sorption model for PIM-6FDA-OH, KAUST-PI-1, and PIM-PI-1.159,329 | ||
Both thermal annealing159 and addition of nitrogen-containing ZIF-8414 to PIM-6FDA-OH also led to a more stable C3H6 permeability and a lower normalized C3H8 permeability (Fig. 65a and b). Thermal annealing facilitated CTC formation and improved plasticization resistance,159 similar to earlier results for TPDA-ATAF and TPDA-APAF discussed in Section 5.1.2.34 The strong molecular interactions between the hydroxyl groups in PIM-6FDA-OH and the nitrogen in ZIF-8 also restricted polymer chain mobility, improving plasticization resistance.414 In addition, TR and CMS analogues of PIM-6FDA-OH were tested (Fig. 65a and b), and it was found that, while both analogues did not show signs of plasticization over the pressure range tested, the mixed-gas permeabilities of C3H6 and C3H8 for the CMS film decreased more with increasing pressure than those for the TR film.373 This result is consistent with earlier examples of CO2/CH4 mixed-gas tests for CMS and TR PIM-6FDA-OH and indicative of how such thermal treatments can induce plasticization resistance when considering different mixtures.372
Mixtures involving H2S have also been considered for plasticization studies in microporous polymers particularly since H2S is a highly condensable contaminant commonly found in natural gas and biogas.48,348,456 Due to its high condensability and critical temperature (Tc = 373.1 K) that result in increased sorption, the presence of H2S in a mixture can lead to significant dilation and plasticization. The relative sorption capacity for H2S compared to less condensable gases found in natural gas (i.e., CO2 and CH4) is shown in Fig. 66a–c for several samples, where H2S sorption for PIM-1, PIM-6FDA-OH, and AO-PIM-1 is significantly higher than that of CO2 (Tc = 304.13 K), and CH4 (Tc = 190.55 K).48,348 Consequently, H2S will typically result in significantly increased normalized permeabilities in high-pressure pure-gas tests. Yi et al. demonstrated this effect in PIM-6FDA-OH, where in a 15![[thin space (1/6-em)]](https://www.rsc.org/images/entities/char_2009.gif) :
:![[thin space (1/6-em)]](https://www.rsc.org/images/entities/char_2009.gif) 15
15![[thin space (1/6-em)]](https://www.rsc.org/images/entities/char_2009.gif) :
:![[thin space (1/6-em)]](https://www.rsc.org/images/entities/char_2009.gif) 70 H2S/CO2/CH4 mixture tested from 7 to 48 bar total pressure, the normalized mixed-gas H2S permeability increased by almost three-fold at the highest pressure, while that of CO2 decreased to about 60% of its original value at 7 bar total pressure and CH4 permeability remained nearly constant (Fig. 66d–f).48 Interestingly, while the mixed-gas CO2/CH4 selectivity decreased with increasing pressure, the H2S/CH4 selectivity increased (Fig. 66g–h). This result is indicative of competitive sorption effects, where CO2 and H2S compete for the Langmuir sorption modes, and the more condensable gas (H2S) will outcompete other gases in the mixture and result in decreased CO2 permeability and increased H2S/CH4 sorption selectivity in the mixed-gas case.48 While CO2/CH4 selectivity is controlled by both diffusion and sorption selectivity, H2S/CH4 selectivity is dominated by sorption selectivity.100,348 Competitive sorption effects will be discussed in more detail in Section 5.2. Similar trends in CO2/CH4 and H2S/CH4 selectivity were found for PIM-1, AO-PIM-1 (fresh), and AO-PIM-1 (rejuvenated) tested in a 20
70 H2S/CO2/CH4 mixture tested from 7 to 48 bar total pressure, the normalized mixed-gas H2S permeability increased by almost three-fold at the highest pressure, while that of CO2 decreased to about 60% of its original value at 7 bar total pressure and CH4 permeability remained nearly constant (Fig. 66d–f).48 Interestingly, while the mixed-gas CO2/CH4 selectivity decreased with increasing pressure, the H2S/CH4 selectivity increased (Fig. 66g–h). This result is indicative of competitive sorption effects, where CO2 and H2S compete for the Langmuir sorption modes, and the more condensable gas (H2S) will outcompete other gases in the mixture and result in decreased CO2 permeability and increased H2S/CH4 sorption selectivity in the mixed-gas case.48 While CO2/CH4 selectivity is controlled by both diffusion and sorption selectivity, H2S/CH4 selectivity is dominated by sorption selectivity.100,348 Competitive sorption effects will be discussed in more detail in Section 5.2. Similar trends in CO2/CH4 and H2S/CH4 selectivity were found for PIM-1, AO-PIM-1 (fresh), and AO-PIM-1 (rejuvenated) tested in a 20![[thin space (1/6-em)]](https://www.rsc.org/images/entities/char_2009.gif) :
:![[thin space (1/6-em)]](https://www.rsc.org/images/entities/char_2009.gif) 20
20![[thin space (1/6-em)]](https://www.rsc.org/images/entities/char_2009.gif) :
:![[thin space (1/6-em)]](https://www.rsc.org/images/entities/char_2009.gif) 60 mol% H2S/CO2/CH4 mixture.348 Examples of this phenomenon have been reported for polyimide films as well.100,318,457–459 Recently, Liu et al. found that 6FDA-DAM displayed increasing H2S/CH4 selectivity up to ∼31 when exposed to a 20
60 mol% H2S/CO2/CH4 mixture.348 Examples of this phenomenon have been reported for polyimide films as well.100,318,457–459 Recently, Liu et al. found that 6FDA-DAM displayed increasing H2S/CH4 selectivity up to ∼31 when exposed to a 20![[thin space (1/6-em)]](https://www.rsc.org/images/entities/char_2009.gif) :
:![[thin space (1/6-em)]](https://www.rsc.org/images/entities/char_2009.gif) 20
20![[thin space (1/6-em)]](https://www.rsc.org/images/entities/char_2009.gif) :
:![[thin space (1/6-em)]](https://www.rsc.org/images/entities/char_2009.gif) 60 H2S/CO2/CH4 ternary gas mixture at a total feed pressure of 46 bar, even with a decrease in CO2/CH4 selectivity from ∼30 to ∼18 and a plasticization pressure for CO2 at around 28 bar.100
60 H2S/CO2/CH4 ternary gas mixture at a total feed pressure of 46 bar, even with a decrease in CO2/CH4 selectivity from ∼30 to ∼18 and a plasticization pressure for CO2 at around 28 bar.100
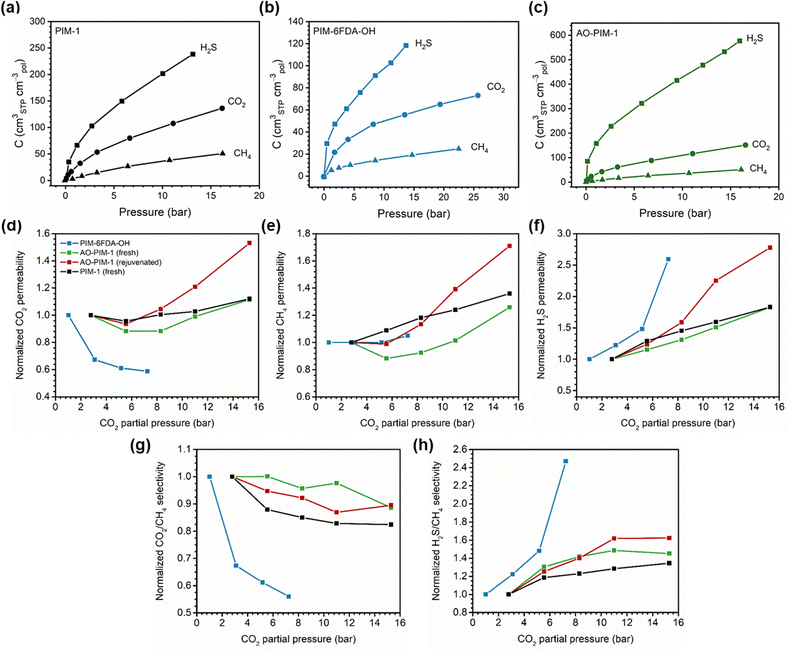 | ||
| Fig. 66 H2S, CO2, and CH4 pure-gas sorption isotherms for (a) PIM-1,348 (b) PIM-6FDA-OH,48 and (c) AO-PIM-1.348 Normalized (d) CO2, (e) CH4, and (f) H2S permeabilities and (g) CO2/CH4 and (h) H2S/CH4 selectivities in a CO2/CH4/H2S ternary mixture versus CO2 partial pressure for PIM-1,348 AO-PIM-1,348 and PIM-6FDA-OH.48 Data was collected at 35 °C. | ||
| Polymer name | Membrane treatment conditions | Thickness (μm) | Young's modulus (GPa) | T g (°C) | Test temperature (°C) | Test pressure (bar) | CO2 permeability (barrer) | CO2 plasticization pressure (bar) | Ref. |
|---|---|---|---|---|---|---|---|---|---|
cPIM-1/Torlon® (5![[thin space (1/6-em)]](https://www.rsc.org/images/entities/char_2009.gif) : :![[thin space (1/6-em)]](https://www.rsc.org/images/entities/char_2009.gif) 95) 95) |
40 °C vacuum 12 h; 75 °C vacuum 24 h; 250 °C vacuum 12 h | 50 ± 5 | n/a | 278 | 35 | ∼3.5 | 0.68 | >30 | 410 |
cPIM-1/Torlon® (10![[thin space (1/6-em)]](https://www.rsc.org/images/entities/char_2009.gif) : :![[thin space (1/6-em)]](https://www.rsc.org/images/entities/char_2009.gif) 90) 90) |
40 °C vacuum 12 h; 75 °C vacuum 24 h; 250 °C vacuum 12 h | 50 ± 5 | n/a | 285 | 35 | ∼3.5 | 1.23 | >30 | |
cPIM-1/Torlon® (30![[thin space (1/6-em)]](https://www.rsc.org/images/entities/char_2009.gif) : :![[thin space (1/6-em)]](https://www.rsc.org/images/entities/char_2009.gif) 70) 70) |
40 °C vacuum 12 h; 75 °C vacuum 24 h; 250 °C vacuum 12 h | 50 ± 5 | n/a | 286, 415 | 35 | ∼3.5 | 4.82 | >30 | |
cPIM-1/Torlon® (50![[thin space (1/6-em)]](https://www.rsc.org/images/entities/char_2009.gif) : :![[thin space (1/6-em)]](https://www.rsc.org/images/entities/char_2009.gif) 50) 50) |
40 °C vacuum 12 h; 75 °C vacuum 24 h; 250 °C vacuum 12 h | 50 ± 5 | n/a | 297, 403 | 35 | ∼3.5 | 21.4 | >30 | |
cPIM-1/Torlon® (70![[thin space (1/6-em)]](https://www.rsc.org/images/entities/char_2009.gif) : :![[thin space (1/6-em)]](https://www.rsc.org/images/entities/char_2009.gif) 30) 30) |
40 °C vacuum 12 h; 75 °C vacuum 24 h; 250 °C vacuum 12 h | 50 ± 5 | n/a | 319, 399 | 35 | ∼3.5 | 440 | >30 | |
cPIM-1/Torlon® (90![[thin space (1/6-em)]](https://www.rsc.org/images/entities/char_2009.gif) : :![[thin space (1/6-em)]](https://www.rsc.org/images/entities/char_2009.gif) 10) 10) |
40 °C vacuum 12 h; 75 °C vacuum 24 h; 250 °C vacuum 12 h | 50 ± 5 | n/a | 360, 399 | 35 | ∼3.5 | 1013 | >30 | |
cPIM-1/Torlon® (95![[thin space (1/6-em)]](https://www.rsc.org/images/entities/char_2009.gif) : :![[thin space (1/6-em)]](https://www.rsc.org/images/entities/char_2009.gif) 5) 5) |
40 °C vacuum 12 h; 75 °C vacuum 24 h; 250 °C vacuum 12 h | 50 ± 5 | n/a | n/a | 35 | ∼3.5 | 1382 | >30 | |
| cPIM-1 | 40 °C vacuum 12 h; 75 °C vacuum 24 h; 250 °C vacuum 12 h | 50 ± 5 | n/a | n/a | 35 | ∼3.5 | 2654 | 20 | |
| KAUST-PI-1 | 120 °C vacuum 24 h; MeOH 24 h; 120 °C vacuum 24 h | 70 | n/a | >350 | 35 | 2 | 2329 | <2 | 90 |
| KAUST-PI-5 | 120 °C vacuum 24 h; MeOH 24 h; 120 °C vacuum 24 h | 70 | n/a | >350 | 35 | 2 | 1560 | 10 | |
cPIM-1/Matrimid® (5![[thin space (1/6-em)]](https://www.rsc.org/images/entities/char_2009.gif) : :![[thin space (1/6-em)]](https://www.rsc.org/images/entities/char_2009.gif) 95) 95) |
25 °C min−1 to 250 °C then hold in vacuum 12 h | 50 ± 5 | 2.60 ± 0.34 | 325 | 35 | ∼3.5 | 13.6 | 9 | 225 |
cPIM-1/Matrimid® (10![[thin space (1/6-em)]](https://www.rsc.org/images/entities/char_2009.gif) : :![[thin space (1/6-em)]](https://www.rsc.org/images/entities/char_2009.gif) 90) 90) |
25 °C min−1 to 250 °C then hold in vacuum 12 h | 50 ± 5 | 2.71 ± 0.11 | 332 | 35 | ∼3.5 | 17.9 | 9 | |
cPIM-1/Matrimid® (30![[thin space (1/6-em)]](https://www.rsc.org/images/entities/char_2009.gif) : :![[thin space (1/6-em)]](https://www.rsc.org/images/entities/char_2009.gif) 70) 70) |
25 °C min−1 to 250 °C then hold in vacuum 12 h | 50 ± 5 | 2.05 ± 0.99 | 352 | 35 | ∼3.5 | 48.7 | 9 | |
cPIM-1/Matrimid® (50![[thin space (1/6-em)]](https://www.rsc.org/images/entities/char_2009.gif) : :![[thin space (1/6-em)]](https://www.rsc.org/images/entities/char_2009.gif) 50) 50) |
25 °C min−1 to 250 °C then hold in vacuum 12 h | 50 ± 5 | 1.84 ± 0.94 | 361 | 35 | ∼3.5 | 145 | 9 | |
cPIM-1/Matrimid® (70![[thin space (1/6-em)]](https://www.rsc.org/images/entities/char_2009.gif) : :![[thin space (1/6-em)]](https://www.rsc.org/images/entities/char_2009.gif) 30) 30) |
25 °C min−1 to 250 °C then hold in vacuum 12 h | 50 ± 5 | 1.95 ± 0.79 | 370 | 35 | ∼3.5 | 486 | 14 | |
cPIM-1/Matrimid® (90![[thin space (1/6-em)]](https://www.rsc.org/images/entities/char_2009.gif) : :![[thin space (1/6-em)]](https://www.rsc.org/images/entities/char_2009.gif) 10) 10) |
25 °C min−1 to 250 °C then hold in vacuum 12 h | 50 ± 5 | n/a | >450 | 35 | ∼3.5 | 982 | 9 | |
cPIM-1/Matrimid® (95![[thin space (1/6-em)]](https://www.rsc.org/images/entities/char_2009.gif) : :![[thin space (1/6-em)]](https://www.rsc.org/images/entities/char_2009.gif) 5) 5) |
25 °C min−1 to 250 °C then hold in vacuum 12 h | 50 ± 5 | n/a | >450 | 35 | ∼3.5 | 2268 | 14 | |
| cPIM-1 | 25 °C min−1 to 250 °C then hold in vacuum 12 h | 50 ± 5 | n/a | >450 | 35 | ∼3.5 | 2654 | 14 | |
(PIM-PI)-(6FDA-durene-PI)(1![[thin space (1/6-em)]](https://www.rsc.org/images/entities/char_2009.gif) : :![[thin space (1/6-em)]](https://www.rsc.org/images/entities/char_2009.gif) 4) 4) |
70 °C for 24 h once, then peeled membrane off, then 70 °C for 24 h again | 45–55 | n/a | n/a | 30 | 2 | 1265 | >2 | 462 |
| TPDA-APAF | 120 °C vacuum 24 h; 250 °C vacuum 24 h | 45–60 | 1.13 | >350 | 35 | 2 | 46 | >25 | 34 |
| TPDA-ATAF | 120 °C vacuum 24 h; 250 °C vacuum 24 h | 45–60 | 1.99 | >350 | 35 | 2 | 125 | >25 | |
| TPDA-APAF | 120 °C vacuum 24 h | 45–60 | 1.13 | >350 | 35 | 2 | 99 | 10 | |
| TPDA-ATAF | 120 °C vacuum 24 h | 45–60 | 1.99 | >350 | 35 | 2 | 325 | 10 | |
| 6FDA-TrMPD | 200 °C vacuum 24 h | 85 | 1.2 ± 0.1 | 397 | 35 | 2 | 498 | >16 | 342 |
| 6FDA-TrMCA | 200 °C vacuum 24 h | 85 | 1.1 ± 0.1 | >360 | 35 | 2 | 144 | >16 | |
| PIM-6FDA-OH | n-Hexane/DCM (90/10) 24 h; air-dried; 120 °C vacuum 24 h | 80–100 | n/a | >330 | 35 | 1 | 263 | 7 | 346 |
| PIM-PMDA-OH | n-Hexane/DCM (90/10) 24 h; air-dried; 120 °C vacuum 24 h | 80–100 | n/a | >330 | 35 | 1 | 198 | 5 | |
| AO-PIM-1 | MeOH 24 h; 120 °C vacuum 24 h | 80–100 | n/a | n/a | 35 | 2 | 1153 | >10 | 347 |
| PIM-1 | MeOH 24 h; 120 °C vacuum 24 h | 80–100 | n/a | n/a | 35 | 2 | 5919 | >10 | |
| TPDA-mPDA | MeOH 24 h; air-dried; 120 °C vacuum (24 h) | 40 ± 5 | n/a | n/a | 35 | 2 | 349 | >20 | 343 |
| TDA-DAR | MeOH 24 h; air-dried; 120 °C vacuum 24 h | 40 ± 5 | n/a | n/a | 35 | 2 | 215 | >20 | |
| PMDA-DAT | 200 °C vacuum 24 h | 70–80 | n/a | >450 | 35 | 1 | 51.4 | 15.2 | 331 |
| CF3-ROMP | EtOH 48 h; air-dried 24 h; 35 °C vacuum 8 h | 119 | n/a | >350 | 35 | 1 | 18![[thin space (1/6-em)]](https://www.rsc.org/images/entities/char_2009.gif) 490 490 |
>51 | 39 |
| OMe-ROMP | EtOH 48 h; air-dried 24 h; 35 °C vacuum 8 h | 160 | n/a | >300 | 35 | 1 | 2900 | >51 | |
| PIM-1 | EtOH 48 h; air-dried 24 h; 35 °C vacuum 8 h | 119 | n/a | n/a | 35 | 1 | 12![[thin space (1/6-em)]](https://www.rsc.org/images/entities/char_2009.gif) 318 318 |
27 | |
| CTTB | MeOH 12 h; RT 3 d | 54 | 0.42 | >380 | 35 | 2 | 3087 | <2 | 335 |
| MTTB | MeOH 12 h; RT 3 d | 60 | 0.44 | >380 | 35 | 2 | 3155 | <2 | |
| ITTB | MeOH 12 h; RT 3 d | 54 | 0.50 | >380 | 35 | 2 | 3901 | <2 | |
| 6FDA-HB | 120 °C vacuum overnight; MeOH 12 h; 120 °C vacuum 24 h | 70 ± 5 | 0.72 | n/a | 35 | 2 | 286 | >15 | 328 |
| TDAi3-HB | 120 °C vacuum overnight; MeOH 12 h; 120 °C vacuum 24 h | 70 ± 5 | 2.12 | n/a | 35 | 2 | 998 | >15 | |
| PIM-1 | 120 °C vacuum 12 h; MeOH 12 h; 120 °C vacuum 24 h | 102 | n/a | n/a | 35 | 2 | 5921 | >10 | 28 |
| TPIM-1 | 120 °C vacuum 12 h; MeOH 12 h; 120 °C vacuum 24 h | 103 | n/a | n/a | 35 | 2 | 1551 | <2 | |
| TPIM-2 | 120 °C vacuum 12 h; MeOH 12 h; 120 °C vacuum 24 h | 46 | n/a | n/a | 35 | 2 | 412 | >15 | |
| PIM-Trip-TB | MeOH 24 h; 120 °C vacuum 20 h | 105 | n/a | n/a | n/a | 1 | 4109 | 14.2 | 334 |
| TDA1-APAF | MeOH 10 h; air-dried; 250 °C vacuum 12 h | 70 ± 5 | n/a | n/a | 35 | 2 | 40 | >15 | 345 |
| TDA1-APAF | MeOH 10 h; air-dried; 250 °C vacuum 12 h; aged 250 d | 70 ± 5 | n/a | n/a | 35 | 2 | 30 | >15 | |
| PIM-TMN-Trip | MeOH 24 h | 161 | n/a | n/a | 25 | 1 | 10![[thin space (1/6-em)]](https://www.rsc.org/images/entities/char_2009.gif) 910 910 |
3 | 463 |
| PIM-TMN-Trip | MeOH 24 h; 25 °C at 500 kPa for 2 weeks | 161 | n/a | n/a | 25 | 1 | 9480 | 1.7 | |
| PIM-1 | 130 °C 12 h | 40–60 | n/a | n/a | 35 | 1 | 2800 | 15 | 138 |
| PIM-COOH | 130 °C 12 h | 40–60 | n/a | n/a | 35 | 1 | 290 | 5 | |
| TZPIM-2 | Washed in water (pH = 4–5) several times; soaked in MeOH; 120 °C vacuum 12 h | 70–90 | n/a | >350 | 22 | 1 | 3083 | >17 | 37 |
| PIM-1 | 80 °C vacuum 12 h | 30 | n/a | n/a | 30 | 4 | 3799 | >12 | 409 |
| PIM-1/PEG 20k kDA (2.5 wt%) | 80 °C vacuum 12 h | 30 | n/a | n/a | 30 | 4 | 2278 | >12 | |
| AM_93a | MeOH overnight; RT 24 h | 76 | n/a | n/a | 25 | 1 | 1740 | >1 | 358 |
| PIM-6FDA-OH | 120 °C vacuum 12 h; 250 °C vacuum 24 h | n/a | n/a | >380 | 35 | ∼2.2 | 143 | 19 | 48 |
(PIM-PI)x-b-(PI)y (x![[thin space (1/6-em)]](https://www.rsc.org/images/entities/char_2009.gif) : :![[thin space (1/6-em)]](https://www.rsc.org/images/entities/char_2009.gif) y= 9 y= 9![[thin space (1/6-em)]](https://www.rsc.org/images/entities/char_2009.gif) : :![[thin space (1/6-em)]](https://www.rsc.org/images/entities/char_2009.gif) 36 or 1 36 or 1![[thin space (1/6-em)]](https://www.rsc.org/images/entities/char_2009.gif) : :![[thin space (1/6-em)]](https://www.rsc.org/images/entities/char_2009.gif) 4) 4) |
70 °C 24 h | 40–50 | 2.25 | 390 | 30 | 2 | 3011 | >2 | 464 |
| DFTTB | MeOH 12 h; RT 24 h | 65 | 0.39 | >350 | 30 | 2 | 3146 | 5 | 336 |
| PIM-1 | Cast from chloroform; 80 °C vacuum 24 h; 110 °C vacuum 48 h | 30 | n/a | n/a | 35 | 2 | 10![[thin space (1/6-em)]](https://www.rsc.org/images/entities/char_2009.gif) 675 675 |
8 | 460 |
| PIM-1 | Cast from chloroform; 80 °C vacuum 24 h; 110 °C vacuum 48 h | 1 | n/a | n/a | 35 | 2 | 551 | <2 | |
| PIM-1 | Cast from o-DCB; 80 °C vacuum 24 h; 110 °C vacuum 48 h | 0.2 | n/a | n/a | 35 | 2 | 412 | <2 | |
| 6FDA-DAT1-OH | 120 °C vacuum 24 h; 200 °C vacuum 24 h | 75 ± 5 | n/a | n/a | 35 | 2 | 70 | >20 | 344 |
| 6FDA-DAT1 | MeOH 10 h; air-dried; 120 °C vacuum 12 h | 65 ± 5 | n/a | n/a | 35 | 2 | 120 | 8 | 333 |
| 6FDA-DAT2 | MeOH 10 h; air-dried; 120 °C vacuum 12 h | 65 ± 5 | n/a | n/a | 35 | 2 | 210 | 8 | |
| FPIM-5 | MeOH 12 h; 120 °C vacuum 12 h; soaked with 5![[thin space (1/6-em)]](https://www.rsc.org/images/entities/char_2009.gif) : :![[thin space (1/6-em)]](https://www.rsc.org/images/entities/char_2009.gif) 95 F2/N2 gas at 4 bar 5 min 95 F2/N2 gas at 4 bar 5 min |
45 | 1 | n/a | 35 | 2 | 22.3 | <2 | 465 |
| HSBI-NO2 | RT 24 h; dried in 180 °C tube furnace under N2 2 h | 70 | 1.94 | n/a | 35 | 2 | 144 | >15 | 466 |
| PIM-1 | 130 °C vacuum 12 h | 58.0 ± 0.9 | n/a | n/a | 35 | ∼1.2 | 9000 | ∼14 | 142 |
| PIM-NH2 | MeOH 24 h; 130 °C vacuum 12 h | 49 ± 2 | n/a | n/a | 35 | ∼1.2 | 1070 | >29 | |
| PIM-t-BOC | MeOH 24 h; 130 °C vacuum 12 h | 70 ± 9 | n/a | n/a | 35 | ∼1.2 | 110 | ∼10 | |
| PIM-deBOC(acid) | MeOH 24 h; 130 °C vacuum 12 h | 65.0 ± 0.6 | n/a | n/a | 35 | ∼1.2 | 460 | >29 | |
| PIM-deBOC(thermal) | MeOH 24 h; 130 °C vacuum 12 h | 83 ± 2 | n/a | n/a | 35 | ∼1.2 | 630 | >29 | |
| UiO-66-CN@sPIM-1 (20 wt%) | Heated in N2 flow (25 ml min−1) from 30 to 250 °C (1 °C min−1), then held for 24 h | 26 | 1.30 | n/a | 25 | 1.4 | 16![[thin space (1/6-em)]](https://www.rsc.org/images/entities/char_2009.gif) 121 121 |
<1.4 | 425 |
| PIM-1 | MeOH 4 h; 120 °C 16 h | 109.4 ± 4.2 | 0.530 ± 0.152 | n/a | 30 | 2 | 6211 | >30 | 438 |
| f-MWCNTs/PIM-1 (0.5 wt%) | MeOH 4 h; 120 °C 16 h | 121.7 ± 3.9 | 0.626 ± 0.122 | n/a | 30 | 2 | 7535 | >30 | |
| f-MWCNTs/PIM-1 (1 wt%) | MeOH 4 h; 120 °C 16 h | 113.4 ± 4.7 | 0.666 ± 0.153 | n/a | 30 | 2 | 7813 | 20 | |
| f-MWCNTs/PIM-1 (2 wt%) | MeOH 4 h; 120 °C 16 h | 117.5 ± 4.8 | 0.685 ± 0.175 | n/a | 30 | 2 | 12![[thin space (1/6-em)]](https://www.rsc.org/images/entities/char_2009.gif) 274 274 |
25 | |
| f-MWCNTs/PIM-1 (3 wt%) | MeOH 4 h; 120 °C 16 h | 115.1 ± 5.1 | 0.640 ± 0.170 | n/a | 30 | 2 | 4816 | <5 | |
| PIM-1 | MeOH 24 h; 120 °C vacuum 24 h | 85 ± 5 | 1.01 ± 0.06 | n/a | 30 | 2 | 4533 | >11 | 421 |
| ZIF-7/PIM-1 (20 wt%) | MeOH 24 h; 120 °C vacuum 24 h | 85 ± 5 | 1.16 ± 0.03 | n/a | 30 | 2 | 2663 | >11 | |
| NH2-ZIF-7/PIM-1 (20 wt%) | MeOH 24 h; 120 °C vacuum 24 h | 85 ± 5 | 1.23 ± 0.06 | n/a | 30 | 2 | 2953 | >11 | |
| OAPS/PIM-1 (5 wt%) | 110 °C vacuum 24 h | 70 | 2.80 | n/a | 25 | 4 | 3266 | >10 | 437 |
| PIM-EA(Me2)-TB | n/a | 100 | n/a | n/a | 25 | 2 | 8200 | <2 | 467 |
| PAF-1/PIM-EA(Me2)-TB (10 wt%) | n/a | 100 | n/a | n/a | 25 | 2 | 9780 | <2 | |
| PIM-EA(H2)-TB | n/a | 100 | n/a | n/a | 25 | 2 | 6660 | <2 | |
| PAF-1/PIM-EA(H2)-TB (10 wt%) | n/a | 100 | n/a | n/a | 25 | 2 | 14![[thin space (1/6-em)]](https://www.rsc.org/images/entities/char_2009.gif) 120 120 |
<2 | |
| PIM-1 | Stirred at 25 °C (24 h) with 3-aminopropyl trimethoxysilane (5 wt%) and 0.1 M hydrochloric acid, washed three times with water | n/a | n/a | n/a | 25 | 1 | 744 | <1 | 468 |
| PIM-co-MOF (23 wt%) | Stirred at 25 °C (24 h) with 3-aminopropyl trimethoxysilane (5 wt%) and 0.1 M hydrochloric acid, washed three times with water | n/a | n/a | n/a | 25 | 1 | 639 | <1 | |
| MAPDA/PIM-1 (15 wt%) | RT 12 h | n/a | 1.16 | n/a | 25 | 3 | 7862 | <2 | 442 |
| PPM-10@MMM | 40 °C 48 h | 40–50 | n/a | n/a | 30 | 1 | 3827 | 20 | 469 |
| PIM-1 | 60 °C vacuum overnight | 25 | n/a | n/a | 35 | 4 | 4110 | <4 | 470 |
| IL@MOF/PIM-1 (5 wt%) | 60 °C vacuum overnight | 25 | n/a | n/a | 35 | 4 | 9420 | ∼16 | |
PIM-[durene(m)-co-PEG/PPG(n)]-PI (1![[thin space (1/6-em)]](https://www.rsc.org/images/entities/char_2009.gif) : :![[thin space (1/6-em)]](https://www.rsc.org/images/entities/char_2009.gif) 0.05) 0.05) |
70 °C vacuum 24 h; peeled from casting dish; 70 °C vacuum 24 h | 40–50 | 1.67 | n/a | 30 | ∼1 | 669 | ∼10 | 471 |
PIM-[durene(m)-co-PEG/PPG(n)]-PI (1![[thin space (1/6-em)]](https://www.rsc.org/images/entities/char_2009.gif) : :![[thin space (1/6-em)]](https://www.rsc.org/images/entities/char_2009.gif) 0.10) 0.10) |
70 °C vacuum 24 h; peeled from casting dish; 70 °C vacuum 24 h | 40–50 | 1.33 | n/a | 30 | ∼1 | 349 | ∼15 | |
| PIM-1 | 120 °C vacuum 16 h | 100–120 | n/a | >400 | 30 | 1 | 8919 | >30 | 397 |
| Crosslinked PEG-biazide/PIM-1 (5 wt%) | 120 °C vacuum 16 h | 100–120 | n/a | >400 | 30 | 1 | 2711 | >30 | |
| Crosslinked PEG-biazide/PIM-1 (10 wt%) | 120 °C vacuum 16 h | 100–120 | n/a | >400 | 30 | 1 | 1565 | >30 | |
| Crosslinked PEG-biazide/PIM-1 (20 wt%) | 120 °C vacuum 16 h | 100–120 | n/a | >400 | 30 | 1 | 433 | >30 | |
| PIM-1 | 175 °C vacuum 7.5 h | 50–70 | n/a | >350 | 25 | 3.4 | 3702 | >20 | 396 |
| Cross-linked azide1/PIM-1 (20 mol%) | 175 °C vacuum 7.5 h | 50–70 | n/a | >350 | 25 | 3.4 | 80 | >20 | |
| Cross-linked azide2/PIM-1 (20 mol%) | 175 °C vacuum 7.5 h | 50–70 | n/a | >350 | 25 | 3.4 | 219 | >20 | |
| PIM-Br | MeOH overnight; 80 °C vacuum | 60 ± 10 | 0.0108 ± 0.0023 | n/a | 35 | 6.89 | 1853 | <3.5 | 472 |
PIM-Br/PBI-95![[thin space (1/6-em)]](https://www.rsc.org/images/entities/char_2009.gif) : :![[thin space (1/6-em)]](https://www.rsc.org/images/entities/char_2009.gif) 5 5 |
MeOH overnight; 80 °C vacuum | 60 ± 10 | 0.0229 ± 0.0030 | n/a | 35 | 6.89 | 1645 | <3.5 | |
PIM-Br/PBI-85![[thin space (1/6-em)]](https://www.rsc.org/images/entities/char_2009.gif) : :![[thin space (1/6-em)]](https://www.rsc.org/images/entities/char_2009.gif) 15 15 |
MeOH overnight; 80 °C vacuum | 60 ± 10 | 0.0405 ± 0.0036 | n/a | 35 | 6.89 | 1356 | <3.5 | |
PIM-Br/PBI-95![[thin space (1/6-em)]](https://www.rsc.org/images/entities/char_2009.gif) : :![[thin space (1/6-em)]](https://www.rsc.org/images/entities/char_2009.gif) 5–150 5–150 |
MeOH overnight; 80 °C vacuum | 60 ± 10 | 0.0260 ± 0.0046 | n/a | 35 | 6.89 | 1850 | <3.5 | |
PIM-Br/PBI-95![[thin space (1/6-em)]](https://www.rsc.org/images/entities/char_2009.gif) : :![[thin space (1/6-em)]](https://www.rsc.org/images/entities/char_2009.gif) 5–250 5–250 |
MeOH overnight; 80 °C vacuum | 60 ± 10 | 0.0348 ± 0.0060 | n/a | 35 | 6.89 | 2264 | ∼21 | |
PIM-Br/PBI-95![[thin space (1/6-em)]](https://www.rsc.org/images/entities/char_2009.gif) : :![[thin space (1/6-em)]](https://www.rsc.org/images/entities/char_2009.gif) 5–300 5–300 |
MeOH overnight; 80 °C vacuum | 60 ± 10 | 0.0376 ± 0.0031 | n/a | 35 | 6.89 | 3313 | >41 | |
| PIM-BM-70 | Dipped in MeOH; 70 °C vacuum 24 h | n/a | n/a | n/a | 25 | 3.4 | 1689 | <3.4 | 394 |
PIM-BM-70![[thin space (1/6-em)]](https://www.rsc.org/images/entities/char_2009.gif) 200 °C-10 h 200 °C-10 h |
Dipped in MeOH; 70 °C vacuum 24 h | n/a | n/a | n/a | 25 | 3.4 | 508 | <3.4 | |
| PIM-BM-70–250 °C-10 h | Dipped in MeOH; 70 °C vacuum 24 h | n/a | n/a | n/a | 25 | 3.4 | 142 | >35 | |
| PIM-BM-70–300 °C-5 h | Dipped in MeOH; 70 °C vacuum 24 h | n/a | n/a | n/a | 25 | 3.4 | 48.3 | >35 | |
| PIM-1 | Washed in acidified water, MeOH 1 h; air-dried; 200 °C 0.5 h; 375 °C 40 min | 70–90 | n/a | n/a | 25 | 3.4 | 5093 | >55 | 391 |
| DC-PIM-1 | Washed in acidified water, MeOH 1 h; air-dried; 200 °C 0.5 h; 375 °C 40 min | 70–90 | n/a | n/a | 25 | 3.4 | 2345 | >55 | |
| DC-PIM-2 | Washed in acidified water, MeOH 1 h; air-dried; 200 °C 0.5 h; 375 °C 40 min | 70–90 | n/a | n/a | 25 | 3.4 | 1987 | >55 | |
| PIM-Trip-TB | 100 °C 24 h | 100 | n/a | n/a | 25 | 1 | 8616 | >20 | 398 |
| CoPIM-TB-1 | 100 °C 24 h | 100 | n/a | n/a | 25 | 1 | 7835 | >20 | |
| CoPIM-TB-2 | 100 °C 24 h | 100 | n/a | n/a | 25 | 1 | 6767 | >20 | |
| C-CoPIM-TB-1 | 100 °C 24 h | 100 | n/a | n/a | 25 | 1 | 5437 | >20 | |
| C-CoPIM-TB-2 | 100 °C 24 h | 100 | n/a | n/a | 25 | 1 | 4251 | >20 | |
| TR from PIM-6FDA-OH (440 °C) | n-Hexane/DCM (90/10) 24 h; air-dried; 120 °C vacuum 24 h | 80–100 | n/a | n/a | 35 | 2 | 816 | >15 | 372 |
| CMS from PIM-6FDA-OH (600 °C) | n-Hexane/DCM (90/10) 24 h; air-dried; 120 °C vacuum 24 h | 80–100 | n/a | n/a | 35 | 2 | 5028 | >15 | |
| CMS from PIM-6FDA-OH (630 °C) | n-Hexane/DCM (90/10) 24 h; air-dried; 120 °C vacuum 24 h | 80–100 | n/a | n/a | 35 | 2 | 2880 | >15 | |
| CMS from PIM-6FDA-OH (800 °C) | n-Hexane/DCM (90/10) 24 h; air-dried; 120 °C vacuum 24 h | 80–100 | n/a | n/a | 35 | 2 | 552 | >15 | |
| PIM-BM/TB | MeOH overnight; 70 °C vacuum 24 h | 50 | 1.24 | n/a | 35 | 3.45 | 2007 | >35 | 473 |
| PIM-BM/TB-80C-20 h | MeOH overnight; 70 °C vacuum 24 h; 80 °C 200 ppm O2/balance N2 20 h | 50 | 1.20 | n/a | 35 | 3.45 | 987 | 24.1 | |
| PIM-BM/TB-200C-20 h | MeOH overnight; 70 °C vacuum 24 h; 200 °C 200 ppm O2/balance N2 20 h | 50 | 1.05 | n/a | 35 | 3.45 | 391 | >35 | |
| PIM-BM/TB-250C-10 h | MeOH overnight; 70 °C vacuum 24 h; 250 °C 200 ppm O2/balance N2 10 h | 50 | n/a | n/a | 35 | 3.45 | 197 | >35 | |
| PIM-BM/TB-300C-2 h | MeOH overnight; 70 °C vacuum 24 h; 300 °C 200 ppm O2/balance N2 2 h | 50 | n/a | n/a | 35 | 3.45 | 218 | >35 | |
| PIM-BM/TB-300C-5 h | MeOH overnight; 70 °C vacuum 24 h; 300 °C 200 ppm O2/balance N2 5 h | 50 | 1.01 | n/a | 35 | 3.45 | 79 | >35 |
| Polymer name | Membrane treatment conditions | Thickness (μm) | Young's Modulus (GPa) | T g (°C) | Test temperature (°C) | Total test pressure (bar) | Mixture composition (mol%) | C3H6 permeability (barrer) | C3H6 plasticization pressure (bar) | Ref. |
|---|---|---|---|---|---|---|---|---|---|---|
| PIM-6FDA-OH | n-Hexane/DCM (90/10) 24 h; air-dried; 120 °C vacuum 24 h | n/a | n/a | n/a | 35 | 2 | Pure-gas | 5.1 | 3 | 159 |
| PIM-6FDA-OH | n-Hexane/DCM (90/10) 24 h; air-dried; 120 °C vacuum 24 h; 250 °C vacuum 24 h | n/a | n/a | n/a | 35 | 2 | Pure-gas | 3.5 | >5 | |
| PIM-6FDA-OH | n-Hexane/DCM (90/10) 24 h; air-dried; 120 °C vacuum 24 h | n/a | n/a | n/a | 35 | 2 | 50![[thin space (1/6-em)]](https://www.rsc.org/images/entities/char_2009.gif) : :![[thin space (1/6-em)]](https://www.rsc.org/images/entities/char_2009.gif) 50 C3H6/C3H8 50 C3H6/C3H8 |
4.0 | 2 | |
| PIM-6FDA-OH | n-Hexane/DCM (90/10) 24 h; air-dried; 120 °C vacuum 24 h; 250 °C vacuum 24 h | n/a | n/a | n/a | 35 | 2 | 50![[thin space (1/6-em)]](https://www.rsc.org/images/entities/char_2009.gif) : :![[thin space (1/6-em)]](https://www.rsc.org/images/entities/char_2009.gif) 50 C3H6/C3H8 50 C3H6/C3H8 |
3.3 | >2.5 | |
| PIM-PI-1 | 120 °C vacuum 24 h; MeOH 24 h; 120 °C vacuum 24 h | ∼130 | n/a | n/a | 35 | 2 | 50![[thin space (1/6-em)]](https://www.rsc.org/images/entities/char_2009.gif) : :![[thin space (1/6-em)]](https://www.rsc.org/images/entities/char_2009.gif) 50 C3H6/C3H8 50 C3H6/C3H8 |
235 | 1.5 | 329 |
| KAUST-PI-1 | 120 °C vacuum 24 h; MeOH 24 h; 120 °C vacuum 24 h | ∼100 | n/a | n/a | 35 | 2 | 50![[thin space (1/6-em)]](https://www.rsc.org/images/entities/char_2009.gif) : :![[thin space (1/6-em)]](https://www.rsc.org/images/entities/char_2009.gif) 50 C3H6/C3H8 50 C3H6/C3H8 |
511 | <1 | |
| TR from PIM-6FDA-OH (440 °C) | 120 °C vacuum 24 h; n-hexane/DCM (90/10) 24 h; 120 °C vacuum 24 h | n/a | n/a | n/a | 35 | 2 | 50![[thin space (1/6-em)]](https://www.rsc.org/images/entities/char_2009.gif) : :![[thin space (1/6-em)]](https://www.rsc.org/images/entities/char_2009.gif) 50 C3H6/C3H8 50 C3H6/C3H8 |
11.9 | >5 | 373 |
| CMS from PIM-6FDA-OH (600 °C) | 120 °C vacuum 24 h; n-hexane/DCM (90/10) 24 h; 120 °C vacuum 24 h | n/a | n/a | n/a | 35 | 2 | 50![[thin space (1/6-em)]](https://www.rsc.org/images/entities/char_2009.gif) : :![[thin space (1/6-em)]](https://www.rsc.org/images/entities/char_2009.gif) 50 C3H6/C3H8 50 C3H6/C3H8 |
50.6 | >5 | |
| PIM-6FDA-OH | 250 °C vacuum 24 h | 40–60 | 0.51 ± 0.02 | n/a | 35 | 2 | 50![[thin space (1/6-em)]](https://www.rsc.org/images/entities/char_2009.gif) : :![[thin space (1/6-em)]](https://www.rsc.org/images/entities/char_2009.gif) 50 mol% C3H6/C3H8 50 mol% C3H6/C3H8 |
2.7 | >6 | 414 |
| ZIF-8/PIM-6FDA-OH (33 wt%) | 250 °C vacuum 24 h | 40–60 | 0.92 ± 0.04 | n/a | 35 | 2 | 50![[thin space (1/6-em)]](https://www.rsc.org/images/entities/char_2009.gif) : :![[thin space (1/6-em)]](https://www.rsc.org/images/entities/char_2009.gif) 50 mol% C3H6/C3H8 50 mol% C3H6/C3H8 |
9.2 | >7 | |
| ZIF-8/PIM-6FDA-OH (65 wt%) | 250 °C vacuum 24 h | 40–60 | 0.47 ± 0.06 | n/a | 35 | 2 | 50![[thin space (1/6-em)]](https://www.rsc.org/images/entities/char_2009.gif) : :![[thin space (1/6-em)]](https://www.rsc.org/images/entities/char_2009.gif) 50 mol% C3H6/C3H8 50 mol% C3H6/C3H8 |
34.6 | ∼5 |
| Polymer name | Membrane treatment conditions | Thickness (μm) | Young's Modulus (GPa) | T g (°C) | Test temperature (°C) | Total test pressure (bar) | Mixture composition (mol%) | H2S permeability (barrer) | H2S plasticization pressure (bar) | Ref. |
|---|---|---|---|---|---|---|---|---|---|---|
| PIM-6FDA-OH | 120 °C vacuum 12 h; 250 °C vacuum 24 h | n/a | n/a | >380 | 35 | 1 | Pure-gas | 30 | 4.5 | 48 |
| PIM-6FDA-OH | 120 °C vacuum 12 h; 250 °C vacuum 24 h; | n/a | n/a | >380 | 35 | 5 | 15![[thin space (1/6-em)]](https://www.rsc.org/images/entities/char_2009.gif) : :![[thin space (1/6-em)]](https://www.rsc.org/images/entities/char_2009.gif) 15 15![[thin space (1/6-em)]](https://www.rsc.org/images/entities/char_2009.gif) : :![[thin space (1/6-em)]](https://www.rsc.org/images/entities/char_2009.gif) 70 CO2/H2S/CH4 70 CO2/H2S/CH4 |
24 | <0.75 | |
| PIM-1 | MeOH; air-dried; 120 °C vacuum | 50–60 | n/a | n/a | 35 | 1 | Pure-gas | 4808 | <1 | 348 |
| PIM-1 | MeOH; air-dried; 120 °C vacuum | 50–60 | n/a | n/a | 35 | ∼14 | 20![[thin space (1/6-em)]](https://www.rsc.org/images/entities/char_2009.gif) : :![[thin space (1/6-em)]](https://www.rsc.org/images/entities/char_2009.gif) 20 20![[thin space (1/6-em)]](https://www.rsc.org/images/entities/char_2009.gif) : :![[thin space (1/6-em)]](https://www.rsc.org/images/entities/char_2009.gif) 60 (mol%) CO2/H2S/CH4 60 (mol%) CO2/H2S/CH4 |
10![[thin space (1/6-em)]](https://www.rsc.org/images/entities/char_2009.gif) 750 750 |
<2.8 | |
| AO-PIM-1 | MeOH; air-dried; 120 °C vacuum | 50–60 | n/a | n/a | 35 | 1 | Pure-gas | 1124 | <1 | |
| AO-PIM-1 | MeOH; air-dried; 120 °C vacuum | 50–60 | n/a | n/a | 35 | ∼14 | 20![[thin space (1/6-em)]](https://www.rsc.org/images/entities/char_2009.gif) : :![[thin space (1/6-em)]](https://www.rsc.org/images/entities/char_2009.gif) 20 20![[thin space (1/6-em)]](https://www.rsc.org/images/entities/char_2009.gif) : :![[thin space (1/6-em)]](https://www.rsc.org/images/entities/char_2009.gif) 60 (mol%) CO2/H2S/CH4 60 (mol%) CO2/H2S/CH4 |
2385 | <2.8 | |
| AO-PIM-1 | 6 months aged; 120 °C 12 h; MeOH 24 h; n-hexane 24 h; air-dried; 120 °C vacuum 24 h | 50–60 | n/a | n/a | 35 | 1 | Pure-gas | 880 | <1 | |
| AO-PIM-1 | 6 months aged; 120 °C 12 h; MeOH 24 h; n-hexane 24 h; air-dried; 120 °C vacuum 24 h | 50–60 | n/a | n/a | 35 | ∼14 | 20![[thin space (1/6-em)]](https://www.rsc.org/images/entities/char_2009.gif) : :![[thin space (1/6-em)]](https://www.rsc.org/images/entities/char_2009.gif) 20 20![[thin space (1/6-em)]](https://www.rsc.org/images/entities/char_2009.gif) : :![[thin space (1/6-em)]](https://www.rsc.org/images/entities/char_2009.gif) 60 (mol%) CO2/H2S/CH4 60 (mol%) CO2/H2S/CH4 |
1445 | <2.8 |
As mentioned in Section 3, Tg and mechanical properties correlate with chain mobility and plasticization resistance. For many of the samples tabulated, no Tg was detected due to polymer degradation before Tg. In general, the glass transition temperatures of microporous polymers are higher than those of other polymers, which is consistent with their ultrahigh backbone stiffness and limited chain mobility. However, because most microporous polymers considered in Tables 4–6 do not detect a Tg within the testing temperatures, a direct correlation between Tg and plasticization pressure is not possible. Specialized methods such as molecular dynamics simulation and ultrafast DSC, as mentioned in Section 3, can be used to extract information on the Tg and should be taken into consideration to establish relationships between Tg and plasticization pressure in the future.
Furthermore, for the samples considered in Tables 4–6, the Young's Modulus ranged from 0.39 to 2.80 GPa, which is similar to results found for traditional glassy polymers.461 However, no clear relationships were found between the Young's Modulus and the plasticization pressure, indicating that mechanical properties alone cannot be used to predict a polymer's susceptibility to plasticization.
Fig. 67a–c depict the CO2 concentration at the plasticization pressure for each sample. Interestingly, the CO2 concentration is independent of the plasticization pressure. From these findings, it appears that a concentration of 38 ± 7 cmSTP3 cmpol−3, which was previously reported for non-microporous polymers, does not correlate with plasticization pressures for microporous polymers.42 In fact, all microporous polymers considered sorb more CO2 before the onset of plasticization than Bos et al. originally observed. Besides a “critical concentration”, other correlating variables have been suggested too.80,87 While out of scope for this review, further analyses on the relationship between these parameters and the onset of plasticization in polymer membranes would be useful. Our findings suggest that identifying simple correlating variables to predict plasticization pressure is difficult and that the interplay of equilibrium sorption and non-equilibrium polymer chain dynamics is challenging to de-couple when investigating plasticization. Further development of theory is needed to accurately predict the onset of plasticization and how to mitigate these effects in polymer membranes.
The structures of samples that either reached a pure-gas CO2 plasticization pressure or did not reach a pure-gas CO2 plasticization pressure at the pressure range tested are also displayed in Fig. 67d and e. It is interesting to note that two structures listed (PIM-1 and PIM-6FDA-OH) can either show a pure-gas CO2 plasticization pressure or not, which underscores the fact that the plasticization pressure can change depending on a number of additional factors including thickness, treatment conditions, pressure range of the measurement, and gas composition.460
5.2. Mixed-gas permeation performance
As shown in Section 5.1, pure- and mixed-gas high pressure permeation data are useful for evaluating plasticization phenomena in polymers. In particular, high-pressure permeation trends in gas mixtures can unambiguously determine when plasticization is occurring in a given sample. As an extension of the discussion in Section 5.1, this section reviews: (1) pure- and mixed-gas permeation data for microporous materials and commonly tested conditions, (2) research progress on competitive sorption for gas mixtures, and (3) a summary of literature trends in plasticization for gas mixtures and mitigation techniques reviewed in Sections 4 and 5.1 (i.e., hydrogen bonding, post-synthetic modification, and multi-component systems).| Gas mixture | # of papers | Testing conditions | Relevant industrial application | ||
|---|---|---|---|---|---|
| Compositionb | Temperature (°C) | Contaminants | |||
a Relative humidity is indicated as RH.
b Composition ratios are listed in the same order as the gas pair, e.g., a CO2/CH4 mixture with a 30![[thin space (1/6-em)]](https://www.rsc.org/images/entities/char_2009.gif) : :![[thin space (1/6-em)]](https://www.rsc.org/images/entities/char_2009.gif) 70 composition has 30% CO2 and 70% CH4. 70 composition has 30% CO2 and 70% CH4.
|
|||||
| CO2/CH4 | 31 | 50![[thin space (1/6-em)]](https://www.rsc.org/images/entities/char_2009.gif) : :![[thin space (1/6-em)]](https://www.rsc.org/images/entities/char_2009.gif) 50 50 |
30–35 | — | Biogas upgrading and natural gas purification482 |
| 3 | 50![[thin space (1/6-em)]](https://www.rsc.org/images/entities/char_2009.gif) : :![[thin space (1/6-em)]](https://www.rsc.org/images/entities/char_2009.gif) 50 50 |
N/A | — | Organic waste: (60–70% CH4; 30–40% CO2; 0–5000 ppm H2S) | |
| 25 | 50![[thin space (1/6-em)]](https://www.rsc.org/images/entities/char_2009.gif) : :![[thin space (1/6-em)]](https://www.rsc.org/images/entities/char_2009.gif) 50 50 |
22–25 | — | Landfill waste: (35–65% CH4; 15–50% CO2; 5–40% N2; 0–100 ppm H2S) | |
| 5 | 35![[thin space (1/6-em)]](https://www.rsc.org/images/entities/char_2009.gif) : :![[thin space (1/6-em)]](https://www.rsc.org/images/entities/char_2009.gif) 65 65 |
N/A | — | Natural gas: (75–95% CH4; 1–10% CO2; 4–10![[thin space (1/6-em)]](https://www.rsc.org/images/entities/char_2009.gif) 000 ppm H2S) 000 ppm H2S) |
|
| 3 | 30![[thin space (1/6-em)]](https://www.rsc.org/images/entities/char_2009.gif) : :![[thin space (1/6-em)]](https://www.rsc.org/images/entities/char_2009.gif) 70 70 |
30 | — | ||
| 3 | 20![[thin space (1/6-em)]](https://www.rsc.org/images/entities/char_2009.gif) : :![[thin space (1/6-em)]](https://www.rsc.org/images/entities/char_2009.gif) 80 80 |
30–35 | — | ||
| 1 | 40![[thin space (1/6-em)]](https://www.rsc.org/images/entities/char_2009.gif) : :![[thin space (1/6-em)]](https://www.rsc.org/images/entities/char_2009.gif) 60 60 |
25 | — | ||
| H2S/CO2/CH4 ternary | 1 | 15![[thin space (1/6-em)]](https://www.rsc.org/images/entities/char_2009.gif) : :![[thin space (1/6-em)]](https://www.rsc.org/images/entities/char_2009.gif) 15 15![[thin space (1/6-em)]](https://www.rsc.org/images/entities/char_2009.gif) : :![[thin space (1/6-em)]](https://www.rsc.org/images/entities/char_2009.gif) 70 70 |
35 | H2S | |
| 1 | 20![[thin space (1/6-em)]](https://www.rsc.org/images/entities/char_2009.gif) : :![[thin space (1/6-em)]](https://www.rsc.org/images/entities/char_2009.gif) 20 20![[thin space (1/6-em)]](https://www.rsc.org/images/entities/char_2009.gif) : :![[thin space (1/6-em)]](https://www.rsc.org/images/entities/char_2009.gif) 60 60 |
35 | H2S | ||
| 1 | 0.05![[thin space (1/6-em)]](https://www.rsc.org/images/entities/char_2009.gif) : :![[thin space (1/6-em)]](https://www.rsc.org/images/entities/char_2009.gif) 50 50![[thin space (1/6-em)]](https://www.rsc.org/images/entities/char_2009.gif) : :![[thin space (1/6-em)]](https://www.rsc.org/images/entities/char_2009.gif) 49.95 49.95 |
35 | H2S | ||
| 1 | 33.6![[thin space (1/6-em)]](https://www.rsc.org/images/entities/char_2009.gif) : :![[thin space (1/6-em)]](https://www.rsc.org/images/entities/char_2009.gif) 64 64![[thin space (1/6-em)]](https://www.rsc.org/images/entities/char_2009.gif) : :![[thin space (1/6-em)]](https://www.rsc.org/images/entities/char_2009.gif) 2.4 CO2/CH4/N2 2.4 CO2/CH4/N2 |
25 | ppm H2S | ||
| CO2/N2 | 5 | 50![[thin space (1/6-em)]](https://www.rsc.org/images/entities/char_2009.gif) : :![[thin space (1/6-em)]](https://www.rsc.org/images/entities/char_2009.gif) 50 50 |
35–37 | — | Carbon capture from point sources24,484 |
| 6 | 15![[thin space (1/6-em)]](https://www.rsc.org/images/entities/char_2009.gif) : :![[thin space (1/6-em)]](https://www.rsc.org/images/entities/char_2009.gif) 85 85 |
35 | — | Post-combustion flue gas from coal or natural-gas fired power plants, and cement/steel production: | |
| 2 | 9![[thin space (1/6-em)]](https://www.rsc.org/images/entities/char_2009.gif) : :![[thin space (1/6-em)]](https://www.rsc.org/images/entities/char_2009.gif) 91 91 |
35 | — | (4–30% CO2 at atmospheric pressure with contaminants such as SOX, NOX, water, and trace metals) | |
| 1 | 10![[thin space (1/6-em)]](https://www.rsc.org/images/entities/char_2009.gif) : :![[thin space (1/6-em)]](https://www.rsc.org/images/entities/char_2009.gif) 90 90 |
25 | — | ||
| 9 | 50![[thin space (1/6-em)]](https://www.rsc.org/images/entities/char_2009.gif) : :![[thin space (1/6-em)]](https://www.rsc.org/images/entities/char_2009.gif) 50 50 |
22–25 | — | ||
| 3 | 15![[thin space (1/6-em)]](https://www.rsc.org/images/entities/char_2009.gif) : :![[thin space (1/6-em)]](https://www.rsc.org/images/entities/char_2009.gif) 85 85 |
N/A | — | ||
| 4 | 15![[thin space (1/6-em)]](https://www.rsc.org/images/entities/char_2009.gif) : :![[thin space (1/6-em)]](https://www.rsc.org/images/entities/char_2009.gif) 85 85 |
22–25 | — | ||
| 1 | 20![[thin space (1/6-em)]](https://www.rsc.org/images/entities/char_2009.gif) : :![[thin space (1/6-em)]](https://www.rsc.org/images/entities/char_2009.gif) 80 80 |
30 | — | ||
| 1 | 30![[thin space (1/6-em)]](https://www.rsc.org/images/entities/char_2009.gif) : :![[thin space (1/6-em)]](https://www.rsc.org/images/entities/char_2009.gif) 70 & 70 70 & 70![[thin space (1/6-em)]](https://www.rsc.org/images/entities/char_2009.gif) : :![[thin space (1/6-em)]](https://www.rsc.org/images/entities/char_2009.gif) 30 30 |
25 | — | ||
| 1 | 40![[thin space (1/6-em)]](https://www.rsc.org/images/entities/char_2009.gif) : :![[thin space (1/6-em)]](https://www.rsc.org/images/entities/char_2009.gif) 60 60 |
25 | — | ||
| 1 | 20![[thin space (1/6-em)]](https://www.rsc.org/images/entities/char_2009.gif) : :![[thin space (1/6-em)]](https://www.rsc.org/images/entities/char_2009.gif) 80 & 80 80 & 80![[thin space (1/6-em)]](https://www.rsc.org/images/entities/char_2009.gif) : :![[thin space (1/6-em)]](https://www.rsc.org/images/entities/char_2009.gif) 20 20 |
25 | — | ||
| CO2/N2 ternary | 1 | 15![[thin space (1/6-em)]](https://www.rsc.org/images/entities/char_2009.gif) : :![[thin space (1/6-em)]](https://www.rsc.org/images/entities/char_2009.gif) 85 85 |
30 | 2.5, 25, 41.5 RHa | |
| 1 | 9![[thin space (1/6-em)]](https://www.rsc.org/images/entities/char_2009.gif) : :![[thin space (1/6-em)]](https://www.rsc.org/images/entities/char_2009.gif) 91 91 |
30 | 7 & 26 RH | ||
| 1 | 20![[thin space (1/6-em)]](https://www.rsc.org/images/entities/char_2009.gif) : :![[thin space (1/6-em)]](https://www.rsc.org/images/entities/char_2009.gif) 20 20 |
40 | 61% Ar | ||
| 2 | 20![[thin space (1/6-em)]](https://www.rsc.org/images/entities/char_2009.gif) : :![[thin space (1/6-em)]](https://www.rsc.org/images/entities/char_2009.gif) 20 20 |
22 | 60% Ar | ||
| 1 | 5% flue gas (14![[thin space (1/6-em)]](https://www.rsc.org/images/entities/char_2009.gif) : :![[thin space (1/6-em)]](https://www.rsc.org/images/entities/char_2009.gif) 86) 86) |
22 | 95% H2O vapor | ||
| 1 | 15![[thin space (1/6-em)]](https://www.rsc.org/images/entities/char_2009.gif) : :![[thin space (1/6-em)]](https://www.rsc.org/images/entities/char_2009.gif) 80 80 |
25 | 5% O2 | ||
| C3H6/C3H8 | 8 | 50![[thin space (1/6-em)]](https://www.rsc.org/images/entities/char_2009.gif) : :![[thin space (1/6-em)]](https://www.rsc.org/images/entities/char_2009.gif) 50 50 |
35 | — | Alkene/alkane or olefin/paraffin separations134 |
| H2/N2 | 3 | 50![[thin space (1/6-em)]](https://www.rsc.org/images/entities/char_2009.gif) : :![[thin space (1/6-em)]](https://www.rsc.org/images/entities/char_2009.gif) 50 50 |
25 | — | H2 recovery from ammonia synthesis plants11,106 (30–80% H2) |
| 1 | 20![[thin space (1/6-em)]](https://www.rsc.org/images/entities/char_2009.gif) : :![[thin space (1/6-em)]](https://www.rsc.org/images/entities/char_2009.gif) 80 80 |
22 | — | ||
| 1 | 30![[thin space (1/6-em)]](https://www.rsc.org/images/entities/char_2009.gif) : :![[thin space (1/6-em)]](https://www.rsc.org/images/entities/char_2009.gif) 70 70 |
25 | — | ||
| 1 | 70![[thin space (1/6-em)]](https://www.rsc.org/images/entities/char_2009.gif) : :![[thin space (1/6-em)]](https://www.rsc.org/images/entities/char_2009.gif) 30 30 |
25 | — | ||
| H2/CH4 | 4 | 50![[thin space (1/6-em)]](https://www.rsc.org/images/entities/char_2009.gif) : :![[thin space (1/6-em)]](https://www.rsc.org/images/entities/char_2009.gif) 50 50 |
35 | — | |
| 1 | 50![[thin space (1/6-em)]](https://www.rsc.org/images/entities/char_2009.gif) : :![[thin space (1/6-em)]](https://www.rsc.org/images/entities/char_2009.gif) 50 50 |
25 | — | ||
| H2/CO2 | 3 | 50![[thin space (1/6-em)]](https://www.rsc.org/images/entities/char_2009.gif) : :![[thin space (1/6-em)]](https://www.rsc.org/images/entities/char_2009.gif) 50 50 |
35 | — | Carbon capture10,52 |
| 1 | 50![[thin space (1/6-em)]](https://www.rsc.org/images/entities/char_2009.gif) : :![[thin space (1/6-em)]](https://www.rsc.org/images/entities/char_2009.gif) 50 50 |
35, 60, 90, 120 | — | Pre-combustion/syngas: (30% CO2, 20% CO, 45% H2, and other inert gases at 100–150 °C) | |
| 1 | 50![[thin space (1/6-em)]](https://www.rsc.org/images/entities/char_2009.gif) : :![[thin space (1/6-em)]](https://www.rsc.org/images/entities/char_2009.gif) 50 50 |
180 | — | ||
| 1 | 12 to 39% RH in CO2 | 30 | H2O | ||
| 1 | 50![[thin space (1/6-em)]](https://www.rsc.org/images/entities/char_2009.gif) : :![[thin space (1/6-em)]](https://www.rsc.org/images/entities/char_2009.gif) 49 49 |
35, 60, 90 | 1% CO | ||
| 1 | Equimolar | 120 | H2O: 1.51–15.8% | ||
Membrane performance is typically evaluated in the context of upper bound plots, which were first proposed by Robeson in 199117 and later revisited in 2008.18 These upper bound plots were empirically derived using a database of pure-gas permeation data evaluated at pressures of approximately 1 to 10 bar. These plots are thus useful for comparing performance in relatively low-pressure pure-gas conditions but are insufficient to benchmark performance for more industrially relevant mixtures. For CO2/CH4 mixtures, Wang et al. proposed a new mixed-gas upper bound in 2018 using literature data for 70 microporous polymers tested using a 50![[thin space (1/6-em)]](https://www.rsc.org/images/entities/char_2009.gif) :
:![[thin space (1/6-em)]](https://www.rsc.org/images/entities/char_2009.gif) 50 CO2/CH4 mixture at a CO2 partial pressure of 10 bar.337 This upper bound is highlighted throughout this section for comparison of mixed-gas data. However, comparing mixed-gas tests performed at different pressures and temperatures can lead to challenges with accurately interpreting data, so the discussion here will be limited only to measurements taken at a CO2 partial pressures of 1 to 2 bar or up to 12 bar and temperatures ∼25 to 35 °C. For C3H6/C3H8 mixtures, Burns and Koros developed a pure-gas upper bound in 2003330 and, in 2012, Zhang et al. reported a mixed-gas upper bound using permeation data measured at temperatures from 35 to 50 °C and at pressures between 1 to 4 bar.485 Other pure-gas upper bounds for CO2- and H2-based gas pairs have been recently proposed.326,337,486 Finally, upper bounds for ternary mixtures have yet to be defined in part due to the limited size of datasets and variability in reported findings. For comparisons of transport performance in H2S/CO2/CH4 mixtures, the combined acid gas selectivity (CAG) (i.e., the summed CO2 and H2S permeabilities divided by the CH4 permeability) proposed by Krafschik et al. has been commonly used.48,348,457 The rest of this section will primarily focus on gas pairs containing condensable penetrants such as CO2, H2S, and C3H8 and several performance trends will be discussed in the context of upper bound benchmark plots.
50 CO2/CH4 mixture at a CO2 partial pressure of 10 bar.337 This upper bound is highlighted throughout this section for comparison of mixed-gas data. However, comparing mixed-gas tests performed at different pressures and temperatures can lead to challenges with accurately interpreting data, so the discussion here will be limited only to measurements taken at a CO2 partial pressures of 1 to 2 bar or up to 12 bar and temperatures ∼25 to 35 °C. For C3H6/C3H8 mixtures, Burns and Koros developed a pure-gas upper bound in 2003330 and, in 2012, Zhang et al. reported a mixed-gas upper bound using permeation data measured at temperatures from 35 to 50 °C and at pressures between 1 to 4 bar.485 Other pure-gas upper bounds for CO2- and H2-based gas pairs have been recently proposed.326,337,486 Finally, upper bounds for ternary mixtures have yet to be defined in part due to the limited size of datasets and variability in reported findings. For comparisons of transport performance in H2S/CO2/CH4 mixtures, the combined acid gas selectivity (CAG) (i.e., the summed CO2 and H2S permeabilities divided by the CH4 permeability) proposed by Krafschik et al. has been commonly used.48,348,457 The rest of this section will primarily focus on gas pairs containing condensable penetrants such as CO2, H2S, and C3H8 and several performance trends will be discussed in the context of upper bound benchmark plots.
Microporous polymers are frequently considered for CO2-based separations because these separations often benefit from both sorption and diffusion selectivity. As a result, a large majority of mixed-gas studies for microporous polymers involve mixtures containing CO2/CH4 and CO2/N2. A collection of mixed-gas upper bound data from these studies is shown in Fig. 68 and compared to a larger set of upper bound data considered in the 2008 Robeson upper bound, which includes data from other non-microporous polymer backbones. Considering CO2/CH4 and CO2/N2 tests performed at total pressures below 12 bar and varying CO2 compositions, the mixed-gas performance for microporous polymers (colored symbols) generally outperforms that of the pure-gas companion studies for polymers included in the 2008 upper bound (gray symbols). This trend highlights the promise of leveraging competition in microporous polymer backbones for gas separation applications when plasticization effects are limited. Subsequent subsections will further investigate these trends and discuss the effects of competition and plasticization in relation to upper bound performance of microporous polymers.
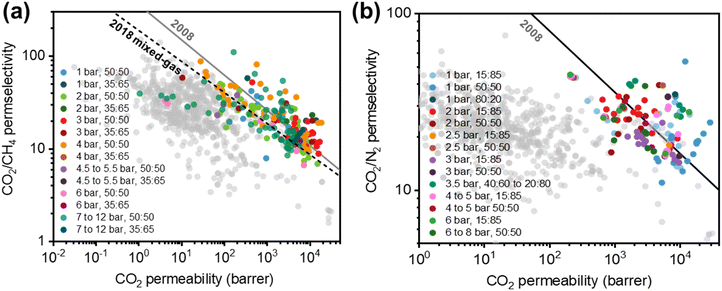 | ||
Fig. 68 (a) 2008 pure-gas18 and 2018 mixed-gas337 CO2/CH4 upper bound front and (b) 2008 pure-gas18 CO2/N2 upper bound front. Also included are mixed-gas tests of microporous polymers in the literature, highlighted in colored symbols. Gray symbols denote Robeson database points for pure-gas tests in predominantly non-microporous polymers.17,18 The legends show the gas feed mixture compositions and the mixed-gas total pressures for testing. At 3.5 bar, the CO2/N2 compositions tested include 40![[thin space (1/6-em)]](https://www.rsc.org/images/entities/char_2009.gif) : :![[thin space (1/6-em)]](https://www.rsc.org/images/entities/char_2009.gif) 60, 30 60, 30![[thin space (1/6-em)]](https://www.rsc.org/images/entities/char_2009.gif) : :![[thin space (1/6-em)]](https://www.rsc.org/images/entities/char_2009.gif) 70, and 20 70, and 20![[thin space (1/6-em)]](https://www.rsc.org/images/entities/char_2009.gif) : :![[thin space (1/6-em)]](https://www.rsc.org/images/entities/char_2009.gif) 80. 80. | ||
By contrast, in H2-based mixtures such as H2/CH4 and H2/CO2, competitive effects can reduce transport performance by biasing sorption selectivity toward the more condensable penetrant (i.e., CO2 or CH4), which leads to a decrease in overall permselectivity. Because the extent of competition is dependent on the relative sorption affinity of the gases in the mixture, the reader is referred to the tabulated critical temperatures (Tc) in Section 2, Table 2 for gases discussed throughout this section. Sorption correlates exponentially with Tc, which makes this parameter an excellent correlating variable for estimating competitive sorption effects. In ternary mixtures of H2S/CO2/CH4, which were briefly discussed in Section 5.1.4, the relative condensability of the gases (H2S (Tc = 373.3 °C) > CO2 (Tc = 304.2 °C) > CH4 (Tc = 190.6 °C)) results in complex competition phenomena. H2S will preferentially sorb into the polymer due to its higher Tc, increasing its permeability. However, both CO2 and CH4 permeability decrease, resulting in an increase in H2S/CH4 sorption selectivity and permselectivity.100,487
Competitive sorption effects are inherently linked to the sorption characteristics of the polymer and gas mixture investigated. As a result, performance changes due to competition will vary depending on the gases considered, the gas mixture composition, and the sorption affinity of the polymer. In a laboratory setting, typical experiments used to evaluate competitive sorption include mixed-gas permeation and mixed-gas sorption tests.
For mixed-gas permeation tests that involve separating a more condensable gas from a less condensable gas (i.e., CO2/N2, CO2/CH4, H2S/CO2, etc.), an increase in mixed-gas permselectivity compared to pure-gas permselectivity indicates a rise in sorption selectivity. This rise is due to competitive effects in which the less condensable penetrant will experience a decrease in sorption, and, thus, a decrease in permeability. The opposite trend (i.e., when the mixed-gas permselectivity decreases compared to the pure-gas permselectivity) indicates plasticization, where diffusion and permeation of the less condensable penetrant increases due to enhanced chain mobility. Since plasticization and competitive sorption counterbalance each other, it is possible to simultaneously observe an increase in permselectivity at low pressures (due to competition) with a decrease in permselectivity at high pressures (due to detrimental plasticization effects).
A direct indicator of competition phenomena is the mixed-gas sorption test. In these tests, the experimental mixed-gas sorption selectivity can be compared to the experimental pure-gas sorption selectivity to evaluate competition. Unfortunately, because mixed-gas sorption tests are highly specialized, very few of these custom-built systems exist in the world, limiting access to experimental data.488–491 When not available, researchers have also applied models such as the dual-mode sorption (DMS) model141,492 and the NELF model104 to predict mixed-gas sorption data in polymers of interest using experimental pure-gas sorption isotherms. Generally, the mixed-gas DMS model provides a good qualitative prediction of mixed-gas sorption, but thermodynamically rigorous models such as NELF are required for quantitative mixed-gas sorption predictions.143,493 When using the DMS and NELF models, pure-gas sorption isotherms are required, and for the NELF model, lattice fluid parameters must be known or estimated for a given polymer. These parameters can be collected through pressure–volume–temperature (PVT) experiments for polymers above their glass transition temperature.494 However, when such measurements are not accessible, which is frequently the case for microporous polymers that do not exhibit measurable glass transition temperatures, additional sorption fitting of infinite dilution sorption coefficients495,496 or molecular simulations,497 are required.
5.2.2.1. Mixed-gas sorption and competition. Despite challenges associated with testing mixed-gas sorption, direct measurements of CO2/CH4 mixed-gas sorption have been collected in many glassy polymers such as cellulose triacetate (CTA),160 6FDA-TADPO,498 6FDA-HAB and its thermally rearranged analogue,143 TZ-PIM,356 PIM-1,356 PTMSP,356 6FDA-mPDA,355 PIM-Trip-TB,334 and AO-PIM,499 and some rubbery polymers such as polydimethylsiloxane (PDMS).491,500 Other gas mixtures such as CO2/C2H4, CO2/N2O, CO2/C2H6, and C2H6/CO2/CH4 have also been tested for PMMA,490,501 crosslinked PEO,502 and PIM-1,503 respectively. For CO2 and CH4 in glassy polymers, mixed-gas CO2 sorption decreases slightly compared to the pure-gas case, whereas mixed-gas CH4 sorption is significantly lower than the pure-gas case due to competitive sorption. In this way, CO2/CH4 selectivity can increase for mixtures compared to pure gases, providing there are limited plasticization effects at the testing conditions. Similar mixed-gas sorption trends are also observed when considering other gas mixtures in glassy polymers. The less condensable gas will always experience a larger depression in sorption from the pure- to mixed-gas case. Readers are directed to the above references for information on mixed-gas sorption of non-microporous glassy polymers.
Recently, a particularly important study considered mixed-gas sorption in cellulose triacetate (CTA), which is a commercial membrane material currently used for natural gas purification in industry. Genduso et al. evaluated mixed-gas sorption for CTA in mixtures containing 26, 51, and 75 mol% of CO2 in CH4 at 35 °C up to a partial CO2 fugacity of ∼10 bar.160 In accordance with expected mixed-gas sorption trends, CO2 uptake exhibited almost no change with increasing pressure relative to the pure-gas case, while CH4 sorption decreased significantly. The concentration-averaged diffusion coefficients were also calculated, and the CH4 diffusion coefficients increased with increasing CO2 pressure. Moreover, the CH4 diffusion coefficients were found to be higher in the mixed-gas case compared to the pure-gas case (i.e., a 2.9-fold increase in diffusion coefficient for CH4 at CO2 partial pressure of 10 bar), unambiguously indicating plasticization. In the case of CO2, mixed-gas diffusion coefficients remained within error of the pure-gas diffusion coefficients. Interestingly, CTA had a high CO2/CH4 sorption selectivity of 12.6 ± 2.8 at infinite dilution, surpassing that of PIM-1 and 6FDA-mPDA and nearly reaching the CO2/CH4 sorption upper bound.504 However, compared to 6FDA-mPDA, PIM-1, and PIM-Trip-TB, CTA had CO2/CH4 diffusion selectivities and CO2 diffusivities below the proposed mixed-gas and pure-gas diffusion upper bounds.15
Due to their high free volume structure and backbone functionality, microporous polymers have potential to concurrently display sorption-selective and size-sieving characteristics. Ricci et al. investigated mixed-gas sorption in CO2/CH4 for poly(trimethylsilyl propyne) (PTMSP), PIM-1, and tetrazole-functionalized PIM-1 (TZ-PIM) for mixtures at 10, 30, and 50 mol% of CO2 at 25 °C, 35 °C, and 50 °C.356 As shown in Fig. 69, in mixed-gas scenarios, CH4 sorption decreased much more significantly than CO2. As a result, CO2/CH4 mixed-gas sorption selectivity increased compared to the pure-gas case for all pressures considered. For instance, at a total pressure of 30 bar, the CO2/CH4 mixed-gas sorption selectivity of TZ-PIM was approximately 7.8 while the pure-gas sorption selectivity was approximately 2.5. Additionally, NELF predictions of mixed-gas sorption data for all gas mixture compositions showed excellent agreement with experiments. Finally, diffusion coefficients were calculated from the sorption–diffusion model using NELF sorption predictions and mixed-gas permeation. When considering a 50![[thin space (1/6-em)]](https://www.rsc.org/images/entities/char_2009.gif) :
:![[thin space (1/6-em)]](https://www.rsc.org/images/entities/char_2009.gif) 50 CO2/CH4 mixture at a total pressure of 20 bar, the predicted CO2/CH4 sorption selectivity (6.8) for TZ-PIM had a much larger contribution to CO2/CH4 permselectivity (17.9) than the CO2/CH4 diffusion selectivity (2.6), indicating the stronger relative influence of sorption in membrane performance under more realistic conditions. This effect can be more pronounced in microporous polymers, which typically have higher gas sorption than traditional polyimides.505 An extension of this work was recently published, where complex ternary mixtures of C2H6/CO2/CH4 were investigated for PIM-1.503 Despite having a similar Tc to CO2 (Tc = 304.2 K), the presence of C2H6 (Tc = 305.3 K) reduced the sorption capacity of CO2 and CH4 in the mixture, reducing overall separation performance metrics and demonstrating the importance of competition and exclusion in mixtures.
50 CO2/CH4 mixture at a total pressure of 20 bar, the predicted CO2/CH4 sorption selectivity (6.8) for TZ-PIM had a much larger contribution to CO2/CH4 permselectivity (17.9) than the CO2/CH4 diffusion selectivity (2.6), indicating the stronger relative influence of sorption in membrane performance under more realistic conditions. This effect can be more pronounced in microporous polymers, which typically have higher gas sorption than traditional polyimides.505 An extension of this work was recently published, where complex ternary mixtures of C2H6/CO2/CH4 were investigated for PIM-1.503 Despite having a similar Tc to CO2 (Tc = 304.2 K), the presence of C2H6 (Tc = 305.3 K) reduced the sorption capacity of CO2 and CH4 in the mixture, reducing overall separation performance metrics and demonstrating the importance of competition and exclusion in mixtures.
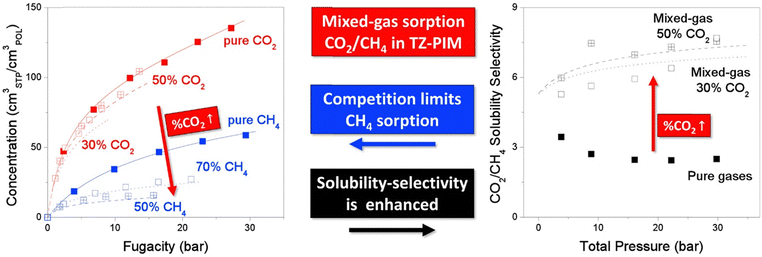 | ||
| Fig. 69 (a) Pure- and mixed-gas sorption isotherms for TZ-PIM. Unfilled and filled data points denote experimental data collected for mixed-gas and pure-gas sorption tests, respectively. (b) pure- and mixed-gas solubility selectivity versus pressure plots for TZ-PIM. Dashed lines represent NELF predictions of the sorption and sorption selectivity data. Reprinted with permission from ref. 356 (Copyright Elsevier, 2019). | ||
Binary mixed-gas CO2/CH4 sorption was also recently investigated in an HAB-6FDA polyimide (HAB = 3,3′-dihydroxy-4,4′-diamino-biphenyl, 6FDA = 2,2′-bis-(3,4-dicarboxyphenyl) hexafluoropropane dianhydride) and its thermally rearranged polymer analogue (TR450).143 Similar trends to those found in CTA and the PIMs discussed earlier were observed here. In short, the CO2 mixed-gas sorption was much less affected by the presence of CH4, while the mixed-gas CH4 sorption significantly decreased due to the presence of CO2. As shown in Fig. 70, CO2/CH4 diffusion and sorption selectivities were calculated at various increasing pressures for the ideal and multi-component case. In pure-gas scenarios, diffusion selectivity contributed more than sorption selectivity to permselectivity (Fig. 70a). In mixed-gas scenarios, the presence of a highly sorbing penetrant (CO2) had a detrimental effect on diffusion selectivity, while sorption selectivity increased and then remained relatively constant for the pressures considered (Fig. 70b). This same sorption–diffusion analysis was extended to a broader database of mixed-gas sorption studies in glassy polymers, where it was shown that permselectivity can be driven by sorption in multi-component scenarios (Fig. 70c).
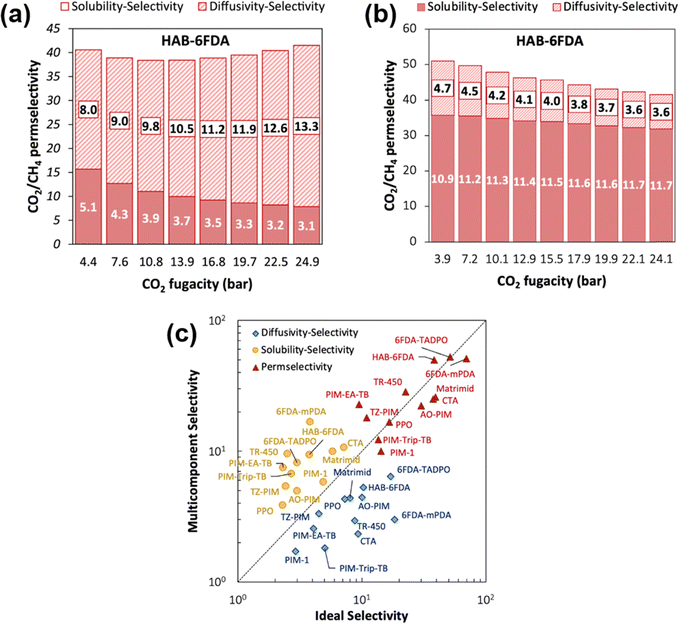 | ||
| Fig. 70 (a) pure-gas and (b) mixed-gas CO2/CH4 permselectivity split into the sorption selectivity (predicted from NELF model analysis) and diffusivity selectivity (calculated from applying the sorption–diffusion model to experimentally determined permeabilities). (c) Comparison of CO2/CH4 ideal and mixed-gas permselectivity, diffusion selectivity, and sorption selectivity for reference polymers reported in ref. 143. Reprinted with permission from ref. 143 (Copyright Elsevier, 2020). | ||
5.2.2.2. Mixed-gas permeation and competition. In the absence of mixed-gas sorption experiments, applying models to pure-gas sorption tests and comparing experimental mixed-gas permeation tests can elucidate trends associated with competition and gas–polymer interactions. Using this approach, structure–property relationships were recently investigated for a family of functionalized and aged PIM-1 analogues with distinct CO2 sorption affinities, as shown in Fig. 71a.142 In this study, the CO2/CH4 sorption selectivity for the functionalized PIMs were compared against the 2014 pure-gas sorption upper bound developed by Lipscomb et al.504 The PIM-1 sample functionalized with the primary amine group (PIM-NH2) showed a remarkably high sorption selectivity of 12.6, which is close to the theoretically derived 2014 sorption upper bound. The six PIM-1 analogues were also evaluated under binary CO2/CH4 mixed-gas conditions at a total mixed-gas pressure of 2 bar, where increases in mixed-gas permselectivity (Fig. 71b) aligned directly with the predicted CO2/CH4 sorption selectivity enhancements of each PIM (Fig. 71a). Furthermore, because of its high CO2 affinity and ability of forming hydrogen bonding through secondary interactions, PIM-NH2 showed a 150% increase in CO2/CH4 permselectivity from the pure-gas case to the mixed-gas case while simultaneously maintaining a CO2/CH4 selectivity over 20 up to a total feed pressure of ∼26 bar. Of note, the mixed-gas performance for this polymer sample was significantly higher than that in pure-gas tests due to the large increase in selectivity. This finding highlights the importance of evaluating films under realistic feed conditions, as the presence of condensable gases can drastically alter the transport properties.
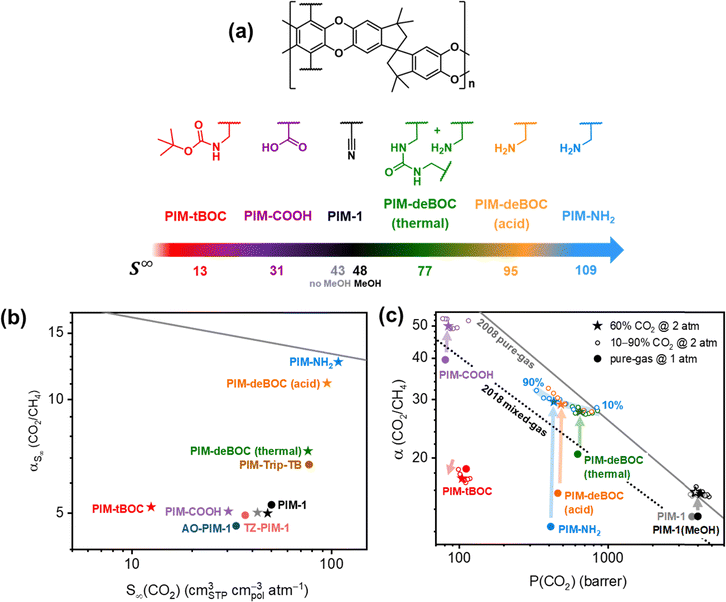 | ||
| Fig. 71 (a) Chemical structures of PIM-1 functionalized analogues considered in the study and their pure-gas CO2 sorption at infinite dilution. From left to right, the samples include the tert-butoxycarbonyl (–CH2NHCOOC(CH3)3, PIM-t-BOC), carboxylic acid (–COOH, PIM-COOH), nitrile (–CN, PIM-1), partial urea (–NHCONH–, PIM-deBOC(thermal)) and primary amine (–CH2NH2, PIM-deBOC (acid) and PIM-NH2) functionalized PIM-1 analogues. Grey and black stars indicate untreated and MeOH treated PIM-1 samples, respectively. (b) pure-gas CO2/CH4 sorption selectivity at infinite dilution versus CO2 sorption at infinite dilution for PIM-1 analogues and literature references including AO-PIM-1499 (dark blue circle), TZ-PIM-1499 (pink circle), PIM-1488 (black circle), PIM-Trip-TB334 (brown circle). The gray line represents the 2014 CO2/CH4 sorption upper bound.504 (c) CO2/CH4 2008 pure-gas18 and 2018 mixed-gas337 upper bounds for the PIM-1 analogues. Filled circles indicate pure-gas permeation tests performed at a total pressure of 1 bar, stars indicate CO2/CH4 mixed-gas tests with 60% CO2 at a total pressure of ∼2 bar, and unfilled circles denote CO2/CH4 mixed-gas permeation tests performed at CO2 compositions ranging from 10% to 90% at a total pressure of ∼2 bar. Reproduced from ref. 142 with permission from the Royal Society of Chemistry. | ||
In sour gas ternary mixtures, larger deviations between mixed- and pure-gas performance are observed due to the co-sorption of additional condensable penetrants (i.e., H2S) and the onset of beneficial plasticization effects. As discussed in Section 5.1, H2S/CH4 separation is dictated by sorption selectivity since H2S (dk = 3.6 Å) and CH4 (dk = 3.8 Å) have similar kinetic diameters. As a result, when the polymer is plasticized, H2S diffusion can be significantly increased and CH4 will be prevented from permeating due to competition, which leads to an increase in H2S/CH4 permselectivity. However, CO2/CH4 selectivity often decreases in these mixtures due to the plasticization effects incurred by both H2S and CO2, increasing CH4 diffusivity, as well as competition between H2S and CO2, which leads to decreased CO2 permeability. These trends have been investigated for a few microporous polymer systems discussed in Section 5.1, including PIM-6FDA-OH48 and AO-PIM-1.348 Other systems such as polyazole-based membranes459 and 6FDA-based polyimides, and co-polyimides including 6FDA-DAM,100 6FDA-Durene/6FpDA,506 and 6FDA-DAM/DABA copolymers458 have also been investigated with ternary feeds. In such cases, co-polymer composition has been used to molecularly tailor sour gas transport for various gas compositions. In addition to polymer systems, Koros and Eddaoudi have reported successful design of MOF–polymer MMMs for simultaneous removal of CO2 and H2S from sour gas including incorporation of fluorinated NbOFFIVE-1-Ni, AlFFIVE-1-Ni, and (RE)-fcu-MOF (fcu = face centered cubic) fillers.507,508 Addition of MOF into the polymer matrix helps to significantly increase permeabilities compared to conventional polyimides and to tune diffusion selectivity for CO2/CH4 and H2S/CH4 separations. More recently, the same groups reported on the design of highly tailorable and stable M-fcu-MOFs (M = metal) and incorporation of these MOFs into 6FDA-based polyimides.509 Careful selection of molecular building blocks allowed for tailored pore apertures and chemical functionalities in MOFs for enhanced sour gas performance. Transport properties were additionally tuned through appropriate selection of a compatible polymer matrix. Finally, in certain cases, the addition of MOF helps to mitigate plasticization, which is further complimented by competitive sorption effects between H2S, CO2, and CH4.
| Polymer | Casting solvent | Treatment and drying conditions | Thickness (μm) | Comp. (mol%) | P(CH4) (barrer) | P(CO2) (barrer) | α(CO2/CH4) | Score | Ref. |
|---|---|---|---|---|---|---|---|---|---|
| 23–35 °C, Ptotal = 2 bar | |||||||||
| PIM-Trip-TB | CHCl3 | MeOH 24 h; 120 °C vacuum 20 h | 105 | Pure | 310 | 4109 | 13 | –0.130 | 334 |
50![[thin space (1/6-em)]](https://www.rsc.org/images/entities/char_2009.gif) : :![[thin space (1/6-em)]](https://www.rsc.org/images/entities/char_2009.gif) 50 50 |
299 | 3914 | 13 | –0.159 | |||||
| CF3-ROMP | CHCl3 | 120 °C vacuum 24 h | 119 | Pure | 644 | 6377 | 10 | –0.245 | 39 |
50![[thin space (1/6-em)]](https://www.rsc.org/images/entities/char_2009.gif) : :![[thin space (1/6-em)]](https://www.rsc.org/images/entities/char_2009.gif) 50 50 |
779 | 7063 | 9 | –0.292 | |||||
| PIM-MP-TB (118 d) | CHCl3 | MeOH 24 h; RT 24 h | 94 | Pure | 26 | 633 | 24 | –0.224 | 327 |
| PIM-MP-TB (110 d) | 52![[thin space (1/6-em)]](https://www.rsc.org/images/entities/char_2009.gif) : :![[thin space (1/6-em)]](https://www.rsc.org/images/entities/char_2009.gif) 48 48 |
36 | 766 | 21 | –0.282 | ||||
| PIM-Trip-TB | NMP | 100 °C vacuum 24 h | — | Pure | 664 | 8616 | 13 | 0.114 | 398 |
50![[thin space (1/6-em)]](https://www.rsc.org/images/entities/char_2009.gif) : :![[thin space (1/6-em)]](https://www.rsc.org/images/entities/char_2009.gif) 50 50 |
979 | 7267 | 7 | –0.469 | |||||
| CoPIM-TB-1 | NMP | 100 °C vacuum 24 h | — | Pure | 575 | 7835 | 14 | 0.126 | |
50![[thin space (1/6-em)]](https://www.rsc.org/images/entities/char_2009.gif) : :![[thin space (1/6-em)]](https://www.rsc.org/images/entities/char_2009.gif) 50 50 |
654 | 6271 | 10 | –0.281 | |||||
| CoPIM-TB-2 | NMP | 100 °C vacuum 24 h | — | Pure | 448 | 6767 | 15 | 0.170 | |
50![[thin space (1/6-em)]](https://www.rsc.org/images/entities/char_2009.gif) : :![[thin space (1/6-em)]](https://www.rsc.org/images/entities/char_2009.gif) 50 50 |
536 | 5818 | 11 | –0.192 | |||||
| C-CoPIM-TB-1 | NMP | 4/1 MeOH-glycidol at 60 °C for 8 h; 80 °C 4 h; 120 °C overnight | — | Pure | 233 | 5437 | 23 | 0.499 | |
50![[thin space (1/6-em)]](https://www.rsc.org/images/entities/char_2009.gif) : :![[thin space (1/6-em)]](https://www.rsc.org/images/entities/char_2009.gif) 50 50 |
264 | 5241 | 20 | 0.335 | |||||
| C-CoPIM-TB-2 | NMP | 4/1 MeOH-glycidol at 60 °C for 8 h; 80 °C 4 h; 120 °C overnight | — | Pure | 169 | 4251 | 25 | 0.482 | |
50![[thin space (1/6-em)]](https://www.rsc.org/images/entities/char_2009.gif) : :![[thin space (1/6-em)]](https://www.rsc.org/images/entities/char_2009.gif) 50 50 |
184 | 3931 | 21 | 0.302 | |||||
PIM-1/Matrimid (10![[thin space (1/6-em)]](https://www.rsc.org/images/entities/char_2009.gif) : :![[thin space (1/6-em)]](https://www.rsc.org/images/entities/char_2009.gif) 90) 90) |
THF/NMP | Fibers were immersed in tap water for 3 days; 3 consecutive 30 min solvent exchange by circulating in MeOH and n-hexane; dried at RT 24 h | 0.06 | Pure | 11.3 | 227 | 20 | –0.767 | 404 |
50![[thin space (1/6-em)]](https://www.rsc.org/images/entities/char_2009.gif) : :![[thin space (1/6-em)]](https://www.rsc.org/images/entities/char_2009.gif) 50 50 |
8.1 | 212 | 26 | –0.542 | |||||
| PIM-TMN-Trip | CHCl3 | MeOH 24 h | 161 | Pure | 722 | 10![[thin space (1/6-em)]](https://www.rsc.org/images/entities/char_2009.gif) 910 910 |
15 | 0.340 | 463 |
60![[thin space (1/6-em)]](https://www.rsc.org/images/entities/char_2009.gif) : :![[thin space (1/6-em)]](https://www.rsc.org/images/entities/char_2009.gif) 40 40 |
489 | 11![[thin space (1/6-em)]](https://www.rsc.org/images/entities/char_2009.gif) 300 300 |
23 | 0.750 | |||||
| PIM-COOH (330 d) | THF | 130 °C 12 h | 40–60 | Pure | 2.1 | 81 | 39 | –0.523 | 138 |
50![[thin space (1/6-em)]](https://www.rsc.org/images/entities/char_2009.gif) : :![[thin space (1/6-em)]](https://www.rsc.org/images/entities/char_2009.gif) 50 50 |
1.9 | 90 | 49 | –0.270 | |||||
| TMGHIM@ZIF-67/PIM-1 (10 wt%) | CHCl3 | RT 24 h; 70 °C 8 h | 170–200 | Pure | 1218 | 12![[thin space (1/6-em)]](https://www.rsc.org/images/entities/char_2009.gif) 849 849 |
11 | 0.062 | 422 |
50![[thin space (1/6-em)]](https://www.rsc.org/images/entities/char_2009.gif) : :![[thin space (1/6-em)]](https://www.rsc.org/images/entities/char_2009.gif) 50 50 |
918 | 8545 | 9 | –0.200 | |||||
| DFTTB | CHCl3 | MeOH 12 h; RT 24 h | 63 | Pure | 144 | 3146 | 21.8 | 0.242 | 336 |
50![[thin space (1/6-em)]](https://www.rsc.org/images/entities/char_2009.gif) : :![[thin space (1/6-em)]](https://www.rsc.org/images/entities/char_2009.gif) 50 50 |
82 | 2304 | 28.1 | 0.369 | |||||
| SPIM-1-6 | CHCl3 | RT 24 h; MeOH 12 h; 80 °C vacuum 2 h; immersed in SO3/DCM solution for 6 min; RT 48 h; aged 7 days | 123 | Pure | 11.4 | 624 | 54.7 | 0.528 | 510 |
50![[thin space (1/6-em)]](https://www.rsc.org/images/entities/char_2009.gif) : :![[thin space (1/6-em)]](https://www.rsc.org/images/entities/char_2009.gif) 50 50 |
8.6 | 448 | 52 | 0.363 | |||||
| PIM-SBI-Trip (501 d) | CHCl3 | MeOH 24 h; RT 24 h | 248 | Pure | 590 | 11![[thin space (1/6-em)]](https://www.rsc.org/images/entities/char_2009.gif) 500 500 |
19.5 | 0.597 | 511 |
35![[thin space (1/6-em)]](https://www.rsc.org/images/entities/char_2009.gif) : :![[thin space (1/6-em)]](https://www.rsc.org/images/entities/char_2009.gif) 65 65 |
685 | 13![[thin space (1/6-em)]](https://www.rsc.org/images/entities/char_2009.gif) 918 918 |
20.3 | 0.703 | |||||
| PIM-1/SBI-Trip (401 d) | CHCl3 | MeOH 24 h; RT 24 h | 180 | Pure | 430 | 7700 | 17.9 | 0.375 | |
35![[thin space (1/6-em)]](https://www.rsc.org/images/entities/char_2009.gif) : :![[thin space (1/6-em)]](https://www.rsc.org/images/entities/char_2009.gif) 65 65 |
403 | 8103 | 20.1 | 0.501 | |||||
| BNNS/PIM-1 (0.5 wt%) (620 d) | CHCl3 | MeOH 18 h; 80 °C vacuum 8 h | 73 ± 5 | Pure | 410 | 3495 | 8.5 | –0.602 | 512 |
50![[thin space (1/6-em)]](https://www.rsc.org/images/entities/char_2009.gif) : :![[thin space (1/6-em)]](https://www.rsc.org/images/entities/char_2009.gif) 50 50 |
364 | 4679 | 12.8 | –0.115 | |||||
| BNNS/PIM-1 (0.8 wt%) (620 d) | CHCl3 | MeOH 18 h; 80 °C vacuum 8 h | 73 ± 5 | Pure | 278 | 3331 | 12.0 | –0.296 | |
50![[thin space (1/6-em)]](https://www.rsc.org/images/entities/char_2009.gif) : :![[thin space (1/6-em)]](https://www.rsc.org/images/entities/char_2009.gif) 50 50 |
346 | 4821 | 13.9 | –0.028 | |||||
| PIM-1 (1 d) | CHCl3 | MeOH 24 h; 130 °C vacuum 12 h | 58.0 ± 0.9 | Pure | 660 | 9000 | 13.5 | 0.167 | 142 |
50![[thin space (1/6-em)]](https://www.rsc.org/images/entities/char_2009.gif) : :![[thin space (1/6-em)]](https://www.rsc.org/images/entities/char_2009.gif) 50 50 |
810 | 8250 | 10.2 | –0.126 | |||||
| PIM-1 (381 d) | CHCl3 | MeOH 24 h; 130 °C vacuum 12 h | 43.8 ± 0.9 | Pure | 300 | 4000 | 13.4 | –0.128 | |
50![[thin space (1/6-em)]](https://www.rsc.org/images/entities/char_2009.gif) : :![[thin space (1/6-em)]](https://www.rsc.org/images/entities/char_2009.gif) 50 50 |
270 | 4200 | 16 | 0.055 | |||||
| PIM-NH2 (1 d) | CHCl3 | MeOH 24 h; 130 °C vacuum 12 h | 49 ± 2 | Pure | 300 | 1070 | 3.6 | –1.825 | |
50![[thin space (1/6-em)]](https://www.rsc.org/images/entities/char_2009.gif) : :![[thin space (1/6-em)]](https://www.rsc.org/images/entities/char_2009.gif) 50 50 |
33.5 | 845 | 25.2 | –0.089 | |||||
| PIM-NH2 (290 d) | CHCl3 | MeOH 24 h; 130 °C vacuum 12 h | 51 ± 2 | Pure | 33 | 410 | 12 | –1.039 | |
50![[thin space (1/6-em)]](https://www.rsc.org/images/entities/char_2009.gif) : :![[thin space (1/6-em)]](https://www.rsc.org/images/entities/char_2009.gif) 50 50 |
14.7 | 430 | 29 | –0.197 | |||||
| PIM-NH2 (448 d) | CHCl3 | MeOH 24 h; 130 °C vacuum 12 h | 67.2 ± 0.9 | Pure | 44 | 480 | 11.1 | –1.056 | |
50![[thin space (1/6-em)]](https://www.rsc.org/images/entities/char_2009.gif) : :![[thin space (1/6-em)]](https://www.rsc.org/images/entities/char_2009.gif) 50 50 |
18.3 | 509 | 27.8 | –0.177 | |||||
| PIM-NH2 (433 d, cond.) | CHCl3 | MeOH 24 h; 130 °C vacuum 12; CO2 conditioning up to ∼29 bar | 82 ± 1 | Pure | 54 | 410 | 7.6 | –1.466 | |
50![[thin space (1/6-em)]](https://www.rsc.org/images/entities/char_2009.gif) : :![[thin space (1/6-em)]](https://www.rsc.org/images/entities/char_2009.gif) 50 50 |
16.9 | 445 | 26.3 | –0.276 | |||||
| PIM-tBOC (351 d) | CHCl3 | MeOH 24 h; 130 °C vacuum 12 h | 70 ± 9 | Pure | 6.1 | 110 | 18 | –1.127 | |
50![[thin space (1/6-em)]](https://www.rsc.org/images/entities/char_2009.gif) : :![[thin space (1/6-em)]](https://www.rsc.org/images/entities/char_2009.gif) 50 50 |
6.1 | 100 | 17 | –1.214 | |||||
| PIM-deBOC (acid) (339 d) | CHCl3 | MeOH 24 h; 130 °C vacuum 12 h | 65.0 ± 0.6 | Pure | 30 | 460 | 15.6 | –0.753 | |
50![[thin space (1/6-em)]](https://www.rsc.org/images/entities/char_2009.gif) : :![[thin space (1/6-em)]](https://www.rsc.org/images/entities/char_2009.gif) 50 50 |
16.7 | 480 | 29 | –0.158 | |||||
| PIM-deBOC (thermal) (343 d) | CHCl3 | MeOH 24 h; 130 °C vacuum 12 h | 83 ± 2 | Pure | 31 | 630 | 20 | –0.409 | |
50![[thin space (1/6-em)]](https://www.rsc.org/images/entities/char_2009.gif) : :![[thin space (1/6-em)]](https://www.rsc.org/images/entities/char_2009.gif) 50 50 |
24 | 650 | 28 | –0.084 | |||||
| PIM-1 (402 d) | CHCl3 | MeOH 24 h; 130 °C vacuum 12 h | 46 ± 1 | Pure | 280 | 3700 | 13.3 | –0.163 | |
50![[thin space (1/6-em)]](https://www.rsc.org/images/entities/char_2009.gif) : :![[thin space (1/6-em)]](https://www.rsc.org/images/entities/char_2009.gif) 50 50 |
250 | 3900 | 15.8 | 0.017 | |||||
| PIM-COOH (330 d) | CHCl3 | MeOH 24 h; 130 °C vacuum 12 h | 34.2 ± 0.8 | Pure | 2.1 | 81 | 39 | –0.512 | |
50![[thin space (1/6-em)]](https://www.rsc.org/images/entities/char_2009.gif) : :![[thin space (1/6-em)]](https://www.rsc.org/images/entities/char_2009.gif) 50 50 |
1.7 | 90 | 50 | –0.243 | |||||
| 22–35 °C, Ptotal = 4 bar | |||||||||
| TPDA-mPDA | CHCl3 | MeOH 24 h; RT 24 h; 120 °C vacuum 24 h | 40 ± 5 | Pure | 11.0 | 349 | 32 | –0.187 | 343 |
50![[thin space (1/6-em)]](https://www.rsc.org/images/entities/char_2009.gif) : :![[thin space (1/6-em)]](https://www.rsc.org/images/entities/char_2009.gif) 50 50 |
9.7 | 293 | 30 | –0.293 | |||||
| TPDA-DAR | CHCl3 | MeOH 24 h; RT 24 h; 120 °C vacuum 24 h | 40 ± 5 | Pure | 4.7 | 215 | 46 | –0.007 | |
50![[thin space (1/6-em)]](https://www.rsc.org/images/entities/char_2009.gif) : :![[thin space (1/6-em)]](https://www.rsc.org/images/entities/char_2009.gif) 50 50 |
3.9 | 180 | 47 | –0.059 | |||||
| TDA1-APAF | THF | MeOH 10 h; RT dry; 120 °C vacuum 12 h | 70 ± 5 | Pure | 0.7 | 40 | 55 | –0.445 | 345 |
50![[thin space (1/6-em)]](https://www.rsc.org/images/entities/char_2009.gif) : :![[thin space (1/6-em)]](https://www.rsc.org/images/entities/char_2009.gif) 50 50 |
0.5 | 37 | 67 | –0.279 | |||||
| TDA1-APAF (250 d) | THF | MeOH 10 h; RT dry; 120 °C vacuum 12 h | 70 ± 5 | Pure | 0.4 | 30 | 75 | –0.253 | |
50![[thin space (1/6-em)]](https://www.rsc.org/images/entities/char_2009.gif) : :![[thin space (1/6-em)]](https://www.rsc.org/images/entities/char_2009.gif) 50 50 |
0.3 | 28 | 88 | –0.133 | |||||
| AO-PIM-1 | DMAc | MeOH 24 h; 120 °C vacuum 24 h | 80–100 | Pure | 34 | 1153 | 34 | 0.299 | 347 |
50![[thin space (1/6-em)]](https://www.rsc.org/images/entities/char_2009.gif) : :![[thin space (1/6-em)]](https://www.rsc.org/images/entities/char_2009.gif) 50 50 |
36 | 847 | 24 | –0.139 | |||||
| PIM-1 (Swaidan 2014) | CHCl3 | MeOH 24 h; 120 °C vacuum 24 h | 80–100 | Pure | 362 | 5919 | 16 | 0.197 | |
50![[thin space (1/6-em)]](https://www.rsc.org/images/entities/char_2009.gif) : :![[thin space (1/6-em)]](https://www.rsc.org/images/entities/char_2009.gif) 50 50 |
427 | 5630 | 13 | –0.022 | |||||
| 6FDA-TrMPD | CHCl3 | 200 °C vacuum 24 h | 85 | Pure | 23.0 | 498 | 22 | –0.418 | 342 |
50![[thin space (1/6-em)]](https://www.rsc.org/images/entities/char_2009.gif) : :![[thin space (1/6-em)]](https://www.rsc.org/images/entities/char_2009.gif) 50 50 |
19.1 | 448 | 23 | –0.381 | |||||
| 6FDA-TrMCA | DMF | 200 °C vacuum 24 h | 85 | Pure | 3.2 | 144 | 45 | –0.175 | |
50![[thin space (1/6-em)]](https://www.rsc.org/images/entities/char_2009.gif) : :![[thin space (1/6-em)]](https://www.rsc.org/images/entities/char_2009.gif) 50 50 |
2.9 | 141 | 48 | –0.122 | |||||
| KAUST-PI-1 | CHCl3 | MeOH 24 h; 120 °C vacuum 24 h | 70 | Pure | 98 | 2329 | 24 | 0.221 | 90 |
50![[thin space (1/6-em)]](https://www.rsc.org/images/entities/char_2009.gif) : :![[thin space (1/6-em)]](https://www.rsc.org/images/entities/char_2009.gif) 50 50 |
98 | 2409 | 25 | 0.264 | |||||
| KAUST-PI-5 | CHCl3 | MeOH 24 h; 120 °C vacuum 24 h | 70 | Pure | 79 | 1560 | 20 | –0.102 | |
50![[thin space (1/6-em)]](https://www.rsc.org/images/entities/char_2009.gif) : :![[thin space (1/6-em)]](https://www.rsc.org/images/entities/char_2009.gif) 50 50 |
67 | 1431 | 21 | –0.061 | |||||
| PIM-6FDA-OH TR 440 °C | THF | n-Hexane/DCM (90/10) 24 h; air-dry; 120 °C vacuum 24 h | 80–100 | Pure | 54 | 816 | 15 | –0.580 | 372 |
50![[thin space (1/6-em)]](https://www.rsc.org/images/entities/char_2009.gif) : :![[thin space (1/6-em)]](https://www.rsc.org/images/entities/char_2009.gif) 50 50 |
44 | 784 | 18 | –0.440 | |||||
| PIM-6FDA-OH CMS 600 °C | THF | n-Hexane/DCM (90/10) 24 h; air-dry; 120 °C vacuum 24 h | 80–100 | Pure | 133 | 5028 | 38 | 0.923 | |
50![[thin space (1/6-em)]](https://www.rsc.org/images/entities/char_2009.gif) : :![[thin space (1/6-em)]](https://www.rsc.org/images/entities/char_2009.gif) 50 50 |
133 | 4797 | 36 | 0.862 | |||||
| PIM-6FDA-OH CMS 630 °C | THF | n-Hexane/DCM (90/10) 24 h; air-dry; 120 °C vacuum 24 h | 80–100 | Pure | 56 | 2880 | 51 | 1.013 | |
50![[thin space (1/6-em)]](https://www.rsc.org/images/entities/char_2009.gif) : :![[thin space (1/6-em)]](https://www.rsc.org/images/entities/char_2009.gif) 50 50 |
64 | 2662 | 42 | 0.787 | |||||
| PIM-6FDA-OH CMS 800 °C | THF | n-Hexane/DCM (90/10) 24 h; air-dry; 120 °C vacuum 24 h | 80–100 | Pure | 6.0 | 552 | 92 | 0.971 | |
50![[thin space (1/6-em)]](https://www.rsc.org/images/entities/char_2009.gif) : :![[thin space (1/6-em)]](https://www.rsc.org/images/entities/char_2009.gif) 50 50 |
7.0 | 568 | 81 | 0.863 | 372 | ||||
| PIM-1 | CHCl3 | MeOH overnight; 120 °C vacuum | — | Pure | 397 | 5135 | 13 | –0.073 | 513 |
50![[thin space (1/6-em)]](https://www.rsc.org/images/entities/char_2009.gif) : :![[thin space (1/6-em)]](https://www.rsc.org/images/entities/char_2009.gif) 50 50 |
312 | 3943 | 13 | –0.188 | |||||
| Crosslinked PIM-1 385 °C, 8 h (TOX PIM-1) | CHCl3 | MeOH overnight; 120 °C vacuum; 385 °C vacuum 8 h | — | Pure | 58 | 1956 | 34 | 0.481 | |
50![[thin space (1/6-em)]](https://www.rsc.org/images/entities/char_2009.gif) : :![[thin space (1/6-em)]](https://www.rsc.org/images/entities/char_2009.gif) 50 50 |
68 | 1646 | 24 | 0.110 | |||||
| Crosslinked PIM-1 385 °C, 24 h (TOX PIM-1) | CHCl3 | MeOH overnight; 120 °C vacuum; 385 °C vacuum 24 h | — | Pure | 16 | 1100 | 69 | 0.943 | |
50![[thin space (1/6-em)]](https://www.rsc.org/images/entities/char_2009.gif) : :![[thin space (1/6-em)]](https://www.rsc.org/images/entities/char_2009.gif) 50 50 |
33 | 1182 | 36 | 0.359 | |||||
| TPDA-APAF 250 °C | THF | 120 °C vacuum 24 h; 250 °C vacuum 24 h | 40–60 | Pure | 0.9 | 46 | 53 | –0.429 | 34 |
50![[thin space (1/6-em)]](https://www.rsc.org/images/entities/char_2009.gif) : :![[thin space (1/6-em)]](https://www.rsc.org/images/entities/char_2009.gif) 50 50 |
0.6 | 39 | 61 | –0.354 | |||||
| TPDA-APAF | THF | 120 °C vacuum 24 h | 40–60 | Pure | 2.6 | 99 | 38 | –0.464 | |
50![[thin space (1/6-em)]](https://www.rsc.org/images/entities/char_2009.gif) : :![[thin space (1/6-em)]](https://www.rsc.org/images/entities/char_2009.gif) 50 50 |
2.1 | 89 | 42 | –0.401 | |||||
| TPDA-ATAF 250 °C | CHCl3 | 120 °C vacuum 24 h; 250 °C vacuum 24 h | 40–60 | Pure | 3.8 | 125 | 33 | –0.518 | |
50![[thin space (1/6-em)]](https://www.rsc.org/images/entities/char_2009.gif) : :![[thin space (1/6-em)]](https://www.rsc.org/images/entities/char_2009.gif) 50 50 |
3.6 | 121 | 34 | –0.509 | |||||
| TPDA-ATAF | CHCl3 | 120 °C vacuum 24 h | 40–60 | Pure | 11 | 325 | 30 | –0.279 | |
50![[thin space (1/6-em)]](https://www.rsc.org/images/entities/char_2009.gif) : :![[thin space (1/6-em)]](https://www.rsc.org/images/entities/char_2009.gif) 50 50 |
10 | 299 | 30 | –0.298 | |||||
| PIM-1 (Tien-Binh 2018) | CHCl3 | MeOH 24 h; 100 °C vacuum 24 h | — | Pure | 536 | 6576 | 12 | –0.034 | 423 |
50![[thin space (1/6-em)]](https://www.rsc.org/images/entities/char_2009.gif) : :![[thin space (1/6-em)]](https://www.rsc.org/images/entities/char_2009.gif) 50 50 |
409 | 5840 | 14 | 0.066 | |||||
| UiO-66/PIM-1 (20 wt%) | CHCl3 | MeOH 24 h; 100 °C vacuum 24 h | — | Pure | 610 | 7100 | 12 | –0.056 | |
50![[thin space (1/6-em)]](https://www.rsc.org/images/entities/char_2009.gif) : :![[thin space (1/6-em)]](https://www.rsc.org/images/entities/char_2009.gif) 50 50 |
610 | 7055 | 12 | –0.064 | |||||
| UiO-66-NH2/PIM-1 (20 wt%) | CHCl3 | MeOH 24 h; 100 °C vacuum 24 h | — | Pure | 638 | 7660 | 12 | 0.000 | |
50![[thin space (1/6-em)]](https://www.rsc.org/images/entities/char_2009.gif) : :![[thin space (1/6-em)]](https://www.rsc.org/images/entities/char_2009.gif) 50 50 |
585 | 7686 | 13 | 0.085 | |||||
| PIM-co-UiO-66 (20 wt%) | CHCl3 | MeOH 24 h; 100 °C vacuum 24 h | — | Pure | 828 | 15![[thin space (1/6-em)]](https://www.rsc.org/images/entities/char_2009.gif) 815 815 |
19 | 0.691 | |
50![[thin space (1/6-em)]](https://www.rsc.org/images/entities/char_2009.gif) : :![[thin space (1/6-em)]](https://www.rsc.org/images/entities/char_2009.gif) 50 50 |
831 | 15![[thin space (1/6-em)]](https://www.rsc.org/images/entities/char_2009.gif) 799 799 |
19 | 0.686 | |||||
| PIM-1 (Tien-Binh 2016) | DCM | 60 °C vacuum 24 h | 50 | Pure | 536 | 6576 | 12 | –0.034 | 434 |
50![[thin space (1/6-em)]](https://www.rsc.org/images/entities/char_2009.gif) : :![[thin space (1/6-em)]](https://www.rsc.org/images/entities/char_2009.gif) 50 50 |
411 | 5822 | 14 | 0.057 | |||||
| MOF-74/PIM-1 (10 wt%) | CHCl3 | 60 °C vacuum 24 h | — | Pure | 707 | 9400 | 13 | 0.168 | |
50![[thin space (1/6-em)]](https://www.rsc.org/images/entities/char_2009.gif) : :![[thin space (1/6-em)]](https://www.rsc.org/images/entities/char_2009.gif) 50 50 |
961 | 9231 | 10 | –0.143 | |||||
| MOF-74/PIM-1 (20 wt%, acid treated) | CHCl3 | 60 °C vacuum 24 h | — | Pure | 802 | 7506 | 9 | –0.240 | |
50![[thin space (1/6-em)]](https://www.rsc.org/images/entities/char_2009.gif) : :![[thin space (1/6-em)]](https://www.rsc.org/images/entities/char_2009.gif) 50 50 |
756 | 7632 | 10 | –0.163 | |||||
| MOF-74/PIM-1 (20 wt%) | CHCl3 | 60 °C vacuum 24 h | — | Pure | 1114 | 21![[thin space (1/6-em)]](https://www.rsc.org/images/entities/char_2009.gif) 269 269 |
19 | 0.796 | |
50![[thin space (1/6-em)]](https://www.rsc.org/images/entities/char_2009.gif) : :![[thin space (1/6-em)]](https://www.rsc.org/images/entities/char_2009.gif) 50 50 |
963 | 18![[thin space (1/6-em)]](https://www.rsc.org/images/entities/char_2009.gif) 401 401 |
19 | 0.745 | |||||
| OAPS/PIM-1 (5 wt %) | THF | 110 °C vacuum | 70–80 | Pure | 227 | 3519 | 16 | –0.037 | 437 |
50![[thin space (1/6-em)]](https://www.rsc.org/images/entities/char_2009.gif) : :![[thin space (1/6-em)]](https://www.rsc.org/images/entities/char_2009.gif) 50 50 |
303 | 3603 | 12 | –0.277 | |||||
| 6FDA-DAT1-OH | THF | 120 °C vacuum 24 h; 200 °C vacuum 24 h | 75 ± 5 | Pure | 1.4 | 70 | 50 | –0.332 | 344 |
50![[thin space (1/6-em)]](https://www.rsc.org/images/entities/char_2009.gif) : :![[thin space (1/6-em)]](https://www.rsc.org/images/entities/char_2009.gif) 50 50 |
1.5 | 70 | 46 | –0.412 | |||||
| 6FDA-DAT1 | CHCl3 | MeOH 10 h; 120 °C vacuum 12 h | 65 ± 5 | Pure | 2.8 | 102 | 36 | –0.498 | 333 |
50![[thin space (1/6-em)]](https://www.rsc.org/images/entities/char_2009.gif) : :![[thin space (1/6-em)]](https://www.rsc.org/images/entities/char_2009.gif) 50 50 |
2.5 | 96 | 38 | –0.474 | |||||
| 6FDA-DAT2 | CHCl3 | MeOH 10 h; 120 °C vacuum 12 h | 65 ± 5 | Pure | 5.2 | 156 | 30 | –0.531 | |
50![[thin space (1/6-em)]](https://www.rsc.org/images/entities/char_2009.gif) : :![[thin space (1/6-em)]](https://www.rsc.org/images/entities/char_2009.gif) 50 50 |
4.6 | 139 | 30 | –0.570 | |||||
| Polymer | Casting solvent | Treatment and drying conditions | Thickness (μm) | Comp. | P(N2) (barrer) | P(CO2) (barrer) | α(CO2/N2) | Score | Ref. |
|---|---|---|---|---|---|---|---|---|---|
| 35 °C, Ptotal = 2 bar | |||||||||
| DFTTB | CHCl3 | MeOH 12 h; RT 24 h | 63 | Pure | 109 | 3146 | 28.9 | 0.198 | 336 |
15![[thin space (1/6-em)]](https://www.rsc.org/images/entities/char_2009.gif) : :![[thin space (1/6-em)]](https://www.rsc.org/images/entities/char_2009.gif) 85 85 |
89 | 2875 | 32.2 | 0.271 | |||||
| PIM-NH2 (448 d) | CHCl3 | MeOH 24 h; 130 °C vacuum 12 h | 67.2 ± 0.9 | Pure | 42 | 483 | 11.6 | –1.282 | 142 |
50![[thin space (1/6-em)]](https://www.rsc.org/images/entities/char_2009.gif) : :![[thin space (1/6-em)]](https://www.rsc.org/images/entities/char_2009.gif) 50 50 |
16 | 520 | 32.9 | –0.274 | |||||
| PIM-NH2 (433 d, cond.) | CHCl3 | MeOH 24 h; 130 °C vacuum 12 h and conditioning | 82 ± 1 | Pure | 46 | 411 | 8.9 | –1.586 | |
50![[thin space (1/6-em)]](https://www.rsc.org/images/entities/char_2009.gif) : :![[thin space (1/6-em)]](https://www.rsc.org/images/entities/char_2009.gif) 50 50 |
14 | 435 | 31.5 | –0.374 | |||||
| 25 °C, Ptotal = 4 bar | |||||||||
| OAPS/PIM-1 (5 wt%) | THF | 110 °C vacuum | 70–80 | Pure | 173 | 3533 | 20 | –0.092 | 437 |
50![[thin space (1/6-em)]](https://www.rsc.org/images/entities/char_2009.gif) : :![[thin space (1/6-em)]](https://www.rsc.org/images/entities/char_2009.gif) 50 50 |
211 | 3698 | 18 | –0.222 | |||||
| MAPDA/PIM-1 (15 wt%) | CHCl3 | RT 12 h | — | Pure | 268 | 7203 | 27 | 0.404 | 442 |
50![[thin space (1/6-em)]](https://www.rsc.org/images/entities/char_2009.gif) : :![[thin space (1/6-em)]](https://www.rsc.org/images/entities/char_2009.gif) 50 50 |
223 | 6640 | 30 | 0.473 | |||||
| 25 °C, Ptotal = 6 bar | |||||||||
| Matrimid 5218/PIM-EA(H2)-TB Blend (30 d) | DCM | RT 24 h | — | Pure | 6.8 | 198 | 29 | –0.712 | 412 |
15![[thin space (1/6-em)]](https://www.rsc.org/images/entities/char_2009.gif) : :![[thin space (1/6-em)]](https://www.rsc.org/images/entities/char_2009.gif) 85 85 |
4.6 | 208 | 45 | –0.280 | |||||
| PIM-EA(H2)-TB (30 d) | DCM | RT 24 h | — | Pure | 53 | 1391 | 26 | –0.164 | |
15![[thin space (1/6-em)]](https://www.rsc.org/images/entities/char_2009.gif) : :![[thin space (1/6-em)]](https://www.rsc.org/images/entities/char_2009.gif) 85 85 |
42 | 1173 | 28 | –0.148 | |||||
| PIM-SBI-Trip (501 d) | CHCl3 | MeOH 24 h; air-dried 24 h | 248 | Pure | 471 | 11![[thin space (1/6-em)]](https://www.rsc.org/images/entities/char_2009.gif) 500 500 |
24.4 | 0.467 | 511 |
15![[thin space (1/6-em)]](https://www.rsc.org/images/entities/char_2009.gif) : :![[thin space (1/6-em)]](https://www.rsc.org/images/entities/char_2009.gif) 85 85 |
498 | 13![[thin space (1/6-em)]](https://www.rsc.org/images/entities/char_2009.gif) 801 801 |
27.7 | 0.647 | |||||
| PIM-1/SBI-Trip (401 d) | CHCl3 | MeOH 24 h; air-dried 24 h | 180 | Pure | 338 | 7700 | 22.8 | 0.270 | |
15![[thin space (1/6-em)]](https://www.rsc.org/images/entities/char_2009.gif) : :![[thin space (1/6-em)]](https://www.rsc.org/images/entities/char_2009.gif) 85 85 |
338 | 8952 | 26.5 | 0.462 | |||||
| 22–35 °C, Ptotal = 6.9–8.3 bar | |||||||||
| PIM-300-2.0 d | DCM | MeOH, 120 °C | 50–60 | Pure | 96 | 4000 | 42 | 0.623 | 392 |
50![[thin space (1/6-em)]](https://www.rsc.org/images/entities/char_2009.gif) : :![[thin space (1/6-em)]](https://www.rsc.org/images/entities/char_2009.gif) 50 50 |
75 | 2924 | 39 | 0.454 | |||||
| PIM-1 (Song 2013) | CHCl3 | vacuum overnight | ∼50 | Pure | 313 | 4333 | 14 | –0.391 | 390 |
50![[thin space (1/6-em)]](https://www.rsc.org/images/entities/char_2009.gif) : :![[thin space (1/6-em)]](https://www.rsc.org/images/entities/char_2009.gif) 50 50 |
147 | 3077 | 21 | –0.113 | |||||
| PIM-1, UV, 30 min | CHCl3 | UV treatment in air, vacuum overnight | ∼50 | Pure | 58 | 1555 | 27 | –0.105 | |
50![[thin space (1/6-em)]](https://www.rsc.org/images/entities/char_2009.gif) : :![[thin space (1/6-em)]](https://www.rsc.org/images/entities/char_2009.gif) 50 50 |
45 | 1335 | 30 | –0.060 | |||||
| PIM-1 (Song 2014) | CHCl3 | MeOH overnight; 120 °C vacuum 24 h (1 mbar) | 50 | Pure | 356 | 5135 | 14 | –0.296 | 393 and 513 |
50![[thin space (1/6-em)]](https://www.rsc.org/images/entities/char_2009.gif) : :![[thin space (1/6-em)]](https://www.rsc.org/images/entities/char_2009.gif) 50 50 |
239 | 3979 | 17 | –0.249 | |||||
| TOX-PIM-1 | CHCl3 | MeOH overnight; 385 °C vacuum 24 h (1 mbar) | 50 | Pure | 30 | 1100 | 37 | 0.076 | |
50![[thin space (1/6-em)]](https://www.rsc.org/images/entities/char_2009.gif) : :![[thin space (1/6-em)]](https://www.rsc.org/images/entities/char_2009.gif) 50 50 |
39 | 979 | 25 | –0.575 | |||||
Ultem/PIM-1 (90![[thin space (1/6-em)]](https://www.rsc.org/images/entities/char_2009.gif) : :![[thin space (1/6-em)]](https://www.rsc.org/images/entities/char_2009.gif) 10) 10) |
CHCl3 | 120 °C vacuum 24 h | 45 ± 5 | Pure | 0.12 | 4.0 | 25 | –0.296 | 406 |
50![[thin space (1/6-em)]](https://www.rsc.org/images/entities/char_2009.gif) : :![[thin space (1/6-em)]](https://www.rsc.org/images/entities/char_2009.gif) 50 50 |
0.09 | 3.0 | 27 | –0.245 | |||||
Ultem/PIM-1 (80![[thin space (1/6-em)]](https://www.rsc.org/images/entities/char_2009.gif) : :![[thin space (1/6-em)]](https://www.rsc.org/images/entities/char_2009.gif) 20) 20) |
CHCl3 | 120 °C vacuum 24 h | 45 ± 5 | Pure | 0.19 | 6.6 | 25 | 0.073 | |
50![[thin space (1/6-em)]](https://www.rsc.org/images/entities/char_2009.gif) : :![[thin space (1/6-em)]](https://www.rsc.org/images/entities/char_2009.gif) 50 50 |
0.17 | 6.5 | 31 | –0.320 | |||||
| OAPS/PIM-1 (5 wt%) | THF | 110 °C vacuum | 70–80 | Pure | 157 | 3266 | 21 | –2.157 | 437 |
50![[thin space (1/6-em)]](https://www.rsc.org/images/entities/char_2009.gif) : :![[thin space (1/6-em)]](https://www.rsc.org/images/entities/char_2009.gif) 50 50 |
185 | 3202 | 17 | –2.154 | |||||
| Polymer | Casting solvent | Treatment and drying conditions | Thickness (μm) | Comp. (mol%) | P(H2) (barrer) | P(CH4) (barrer) | α(H2/CH4) | Score | Ref. |
|---|---|---|---|---|---|---|---|---|---|
| 35 °C, Ptotal = 2 bar | |||||||||
| PIM-NH2 (448 d) | CHCl3 | MeOH 24 h; 130 °C vacuum 12 h | 67.2 ± 0.9 | Pure | 1134 | 44 | 26 | 0.288 | 142 |
50![[thin space (1/6-em)]](https://www.rsc.org/images/entities/char_2009.gif) : :![[thin space (1/6-em)]](https://www.rsc.org/images/entities/char_2009.gif) 50 50 |
1127 | 54 | 20.8 | 0.118 | |||||
| PIM-NH2 (443 d, cond.) | CHCl3 | MeOH 24 h; 130 °C vacuum 12 h; CO2 conditioning up to ∼29 bar | 82 ± 1 | Pure | 990 | 54 | 18.3 | −0.064 | |
50![[thin space (1/6-em)]](https://www.rsc.org/images/entities/char_2009.gif) : :![[thin space (1/6-em)]](https://www.rsc.org/images/entities/char_2009.gif) 50 50 |
885 | 53 | 16.4 | −0.220 | |||||
| PIM-NH2 | CHCl3 | MeOH 24 h; 130 °C vacuum 12 h | 58.0 ± 0.9 | Pure | 1785 | 297 | 6 | −0.496 | |
50![[thin space (1/6-em)]](https://www.rsc.org/images/entities/char_2009.gif) : :![[thin space (1/6-em)]](https://www.rsc.org/images/entities/char_2009.gif) 50 50 |
1652 | 330 | 5 | −0.683 | |||||
| 25 °C, Ptotal = 6 bar | |||||||||
| TX-AOPIM-1 370 °C 48 h | DMF | Drying at 60 °C; MeOH 24 h; 110 °C vacuum 24 h | 65 ± 5 | Pure | 1060 | 3.2 | 331 | 2.130 | 515 |
50![[thin space (1/6-em)]](https://www.rsc.org/images/entities/char_2009.gif) : :![[thin space (1/6-em)]](https://www.rsc.org/images/entities/char_2009.gif) 50 50 |
665 | 3.2 | 208 | 1.473 | |||||
| 35 °C, Ptotal = 7 bar | |||||||||
| AO-PIM-1 | DMF | MeOH 24 h; 120 °C overnight | 25 ± 5 | Pure | 926 | 42 | 22 | 0.024 | 514 |
50![[thin space (1/6-em)]](https://www.rsc.org/images/entities/char_2009.gif) : :![[thin space (1/6-em)]](https://www.rsc.org/images/entities/char_2009.gif) 50 50 |
609 | 130 | 4.7 | −1.401 | |||||
| SCA4/AO-PIM-1 (1 wt%) | DMF | 25 ± 5 | Pure | 866 | 23 | 38 | 0.385 | ||
50![[thin space (1/6-em)]](https://www.rsc.org/images/entities/char_2009.gif) : :![[thin space (1/6-em)]](https://www.rsc.org/images/entities/char_2009.gif) 50 50 |
567 | 67 | 8.4 | −1.012 | |||||
| SCA4/AO-PIM-1 (2 wt%) | DMF | 25 ± 5 | Pure | 781 | 3.4 | 233 | 1.665 | ||
50![[thin space (1/6-em)]](https://www.rsc.org/images/entities/char_2009.gif) : :![[thin space (1/6-em)]](https://www.rsc.org/images/entities/char_2009.gif) 50 50 |
543 | 14 | 40 | 0.107 | |||||
| SCA4/AO-PIM-1 (3 wt%) | DMF | 25 ± 5 | Pure | 693 | 2.7 | 260 | 1.665 | ||
50![[thin space (1/6-em)]](https://www.rsc.org/images/entities/char_2009.gif) : :![[thin space (1/6-em)]](https://www.rsc.org/images/entities/char_2009.gif) 50 50 |
470 | 6.1 | 77 | 0.506 | |||||
| SCA4/AO-PIM-1 (5 wt%) | DMF | 25 ± 5 | Pure | 542 | 1.8 | 296 | 1.598 | ||
50![[thin space (1/6-em)]](https://www.rsc.org/images/entities/char_2009.gif) : :![[thin space (1/6-em)]](https://www.rsc.org/images/entities/char_2009.gif) 50 50 |
393 | 3.5 | 114 | 0.672 | |||||
| Polymer | Casting solvent | Treatment and drying conditions | Thickness (μm) | Comp. (mol%) | P(C3H6) (barrer) | P(C3H8) (barrer) | α(C3H6/C3H8) | Score | Ref. |
|---|---|---|---|---|---|---|---|---|---|
| PIM-PI-1 | CHCl3 | MeOH 24 h; 120 °C vacuum 24 h | 130 | Pure | 393 | 51 | 8 | 0.264 | 329 |
50![[thin space (1/6-em)]](https://www.rsc.org/images/entities/char_2009.gif) : :![[thin space (1/6-em)]](https://www.rsc.org/images/entities/char_2009.gif) 50 50 |
260 | 108 | 2 | −0.963 | |||||
| KAUST-PI-1 | CHCl3 | MeOH 24 h; 120 °C vacuum 24 h | 100 | Pure | 817 | 66 | 12 | 0.906 | |
50![[thin space (1/6-em)]](https://www.rsc.org/images/entities/char_2009.gif) : :![[thin space (1/6-em)]](https://www.rsc.org/images/entities/char_2009.gif) 50 50 |
676 | 146 | 5 | −0.101 | |||||
| PIM-6FDA-OH | THF | n-Hexane/DCM (90/10) 24 h; 120 °C vacuum 24 h | — | Pure | 5.1 | 0.27 | 19 | 0.106 | 159 |
50![[thin space (1/6-em)]](https://www.rsc.org/images/entities/char_2009.gif) : :![[thin space (1/6-em)]](https://www.rsc.org/images/entities/char_2009.gif) 50 50 |
3.69 | 0.36 | 10 | −0.554 | |||||
| PIM-6FDA-OH 250 °C (Swaidan 2015) | THF | n-Hexane/DCM (90/10) 24 h; 120 °C vacuum 24 h; 250 °C vacuum 24 h | — | Pure | 3.5 | 0.12 | 29 | 0.439 | |
50![[thin space (1/6-em)]](https://www.rsc.org/images/entities/char_2009.gif) : :![[thin space (1/6-em)]](https://www.rsc.org/images/entities/char_2009.gif) 50 50 |
2.31 | 0.16 | 14 | −0.361 | |||||
| PIM-6FDA-OH CMS 600 °C | THF | n-Hexane/DCM (90/10) 24 h; 120 °C vacuum 24 h | — | Pure | 45 | 1.3 | 35 | 1.221 | 373 |
50![[thin space (1/6-em)]](https://www.rsc.org/images/entities/char_2009.gif) : :![[thin space (1/6-em)]](https://www.rsc.org/images/entities/char_2009.gif) 50 50 |
50 | 2.1 | 24 | 0.870 | |||||
| PIM-6FDA-OH TR 400 °C | THF | n-Hexane/DCM (90/10) 24 h; 120 °C vacuum 24 h | — | Pure | 14 | 0.97 | 14 | 0.055 | |
50![[thin space (1/6-em)]](https://www.rsc.org/images/entities/char_2009.gif) : :![[thin space (1/6-em)]](https://www.rsc.org/images/entities/char_2009.gif) 50 50 |
12 | 1.1 | 11 | −0.231 | |||||
| PIM-6FDA-OH 250 °C (Ma 2018) | THF | 250 °C 24 h | 40–60 | Pure | 3.5 | 0.10 | 35 | 0.616 | 414 |
50![[thin space (1/6-em)]](https://www.rsc.org/images/entities/char_2009.gif) : :![[thin space (1/6-em)]](https://www.rsc.org/images/entities/char_2009.gif) 50 50 |
1.9 | 0.10 | 19 | −0.122 | |||||
| ZIF-8/PIM-6FDA-OH (33 wt%) | THF | 250 °C 24 h | 40–60 | Pure | 10 | 0.30 | 33 | 0.818 | |
50![[thin space (1/6-em)]](https://www.rsc.org/images/entities/char_2009.gif) : :![[thin space (1/6-em)]](https://www.rsc.org/images/entities/char_2009.gif) 50 50 |
8.7 | 0.40 | 22 | 0.370 | |||||
| ZIF-8/PIM-6FDA-OH (65 wt%) | THF | 250 °C 24 h | 40–60 | Pure | 38 | 0.90 | 42 | 1.364 | |
50![[thin space (1/6-em)]](https://www.rsc.org/images/entities/char_2009.gif) : :![[thin space (1/6-em)]](https://www.rsc.org/images/entities/char_2009.gif) 50 50 |
30 | 1.0 | 30 | 0.976 |
Upper bound data for CO2-based mixtures measured at total pressures of both 2 bar and 4 bar are shown in Fig. 72. In binary CO2/CH4 and CO2/N2 mixtures, the CO2-based permselectivity either increases or decreases depending on the sample considered, highlighting the significance of functional chemistry and gas composition in dictating competitive effects in CO2-based mixtures. For the two studies considering gas feeds of 15![[thin space (1/6-em)]](https://www.rsc.org/images/entities/char_2009.gif) :
:![[thin space (1/6-em)]](https://www.rsc.org/images/entities/char_2009.gif) 85 CO2/N2, the permselectivity increases in the mixed gas case. Deployment of CO2/N2 separations for carbon capture applications would likely involve low total feed pressures, where competitive sorption could be leveraged. When considering binary CO2/CH4 separations for natural gas purification, enhanced competitive effects are of most value when plasticization can be simultaneously mitigated. Plasticization trends observed for CO2/CH4 binary mixed-gas tests at higher pressures of 10 bar are further evaluated in Section 5.2.4.
85 CO2/N2, the permselectivity increases in the mixed gas case. Deployment of CO2/N2 separations for carbon capture applications would likely involve low total feed pressures, where competitive sorption could be leveraged. When considering binary CO2/CH4 separations for natural gas purification, enhanced competitive effects are of most value when plasticization can be simultaneously mitigated. Plasticization trends observed for CO2/CH4 binary mixed-gas tests at higher pressures of 10 bar are further evaluated in Section 5.2.4.
Pure- and mixed-gas upper bound data for binary H2/CH4 and C3H6/C3H8 gas mixtures are summarized in Fig. 73. In the case of H2/CH4, there is very limited data in the literature, so we report on three studies by Mizrahi Rodriguez and Benedetti et al.,142 Wu et al.,514 and Huang et al.,515 which show the expected reduction in permselectivity and H2 permeability for the mixed-gas case. This result is consistent with the relative critical temperatures of the gases (CH4 (Tc = 190.6 °C) > H2 (Tc = 33.2 °C)), where CH4 will sorb more strongly than H2. As such, competitive sorption will bias sorption selectivity toward CH4, reducing overall H2 permeability and resulting in lower H2/CH4 mixed-gas permselectivity. Similar results have been observed for microporous polymers tested in gas mixtures including H2/N2142,444 and H2/CO2.388,389,405 In each of these cases, the critical temperatures of CO2 and N2, are much higher than that of H2, resulting in a decrease of H2 permeability and H2-based selectivity when tested in gas mixtures.
An emerging membrane-based separation is the separation of alkenes from alkanes, commonly referred to as olefin/paraffin separations. Ethylene and propylene are required in enormous volumes for the synthesis of commodity plastics (e.g., polyethylene and polypropylene),134 but because of their similar sizes and boiling points, olefin/paraffin separations often require energy-intensive cryogenic distillation. Membranes are highly desired for this separation, but the high polarizability of olefins and paraffins results in strong plasticization effects, precluding the use of many state-of-the-art commercial membranes. In addition to these industrial challenges, there are limited literature data on olefin/paraffin separation performance of emerging polymers such as PIMs.
Some limited low-pressure results are presented in Fig. 73b for C3H6/C3H8 separation in microporous materials. To the best of our knowledge, the only report of C2H4/C2H6 separation in microporous polymers has been performed for a CMS derived from PIM-6FDA-OH.384 Because C3H8 (Tc = 369.9 °C) and C3H6 (Tc = 365.2 °C) have higher critical temperatures than CO2 (Tc = 304.2 °C), they often interact more strongly with polymers and lead to plasticization, as highlighted in Section 5.1. For a C3H6/C3H8 mixture, the sorption affinity for C3H8 is slightly higher than that of C3H6 and, thus, competitive sorption effects should be unfavorable towards C3H6. Additionally, because the sorption of both C3H6 and C3H8 is high and their condensabilities are so similar, polymers are often plasticized by both of these gases, resulting in decreased mixed-gas permselectivity. Even when plasticization plays a role, mixed-gas C3H6 permeability decreases slightly, indicating some competitive sorption with C3H8, which will slightly reduce the permeability of both gases in the mixture. In short, these findings highlight the challenges of making stable and high-performance polymers for C3H6/C3H8 separation. In fact, many of the top performing samples in Fig. 73b are for MMMs and CMS membranes.
Fig. 74 summarizes the differences in score between the mixed-gas case and the corresponding pure-gas case for H2/CH4, C3H6/C3H8, CO2/CH4, and CO2/N2 mixtures for all microporous polymers represented in Tables 8–11. In this analysis, the upper bound score for a pure-gas test was subtracted from that for the mixed-gas test to provide an indication of magnitude and direction of the performance change. Therefore, a positive score indicates that the mixed-gas performance exceeded the pure-gas performance, while a negative score indicates the opposite trend. For CO2-based mixtures, the scoring metric oscillates around zero, indicating that competitive benefits could outweigh plasticization effects for these separations. For H2/CH4, competition will reduce performance metrics (i.e., H2/CH4 selectivity and H2 permeability are both reduced in all mixtures), which can be generally applied to other H2-based separations. For very condensable alkene/alkane gas pairs, plasticization effects outcompete competitive sorption at low pressures, often resulting in decreased performance (i.e., decreased permeability and permselectivity). While competitive sorption effects can outweigh plasticization in highly diffusion-selective materials, the design of sorption-selective materials with strong plasticization resistance remains a promising approach to assuage the impact of plasticization in condensable mixtures.
The polymers with hydrogen bonding moieties (Fig. 75a and b) considered in this review showed a decrease in CO2 permeability and CO2/CH4 selectivity with increasing pressure. Many of the pure-gas studies (Fig. 75a and c) showed a smaller decrease in CO2/CH4 selectivity with increasing pressure compared to the respective mixed-gas studies (Fig. 75b and d), including comparisons for polymers such as PIM-6FDA-OH,346 PIM-PMDA-OH,346 TPDA-APAF,345 and TPDA-DAR.345 In the mixed-gas case, some of the polymers considered such as TPDA-DAR,343 TDA1-APAF (250 days aged),345 AO-PIM-1,347 and 6FDA-TrMCA342 retained good separation performance on the 2018 CO2/CH4 mixed-gas upper bound despite the decrease in permselectivity due to plasticization.
In contrast, polymers that do not contain hydrogen bonding groups (Fig. 75c and d) exhibited a larger spread in pure-gas performance changes from 1–2 to ∼10 bar. However, it is important to note that, for the polymers without hydrogen bonding moieties, not all samples tested under pure-gas conditions were tested in mixtures. Additionally, there were three times as many polymers without hydrogen bonding moieties (i.e., 35 unique studies) reported in the datasets compared to those with hydrogen bonding moieties (i.e., 11 unique studies). Generally, the difference in upper bound score for non-hydrogen bonding polymers ranged from –0.5 to 0.3 for pure-gas tests and from –0.9 to –0.2 for mixed-gas tests (Fig. 77). For hydrogen bonding polymers, however, the range in upper bound score differences was much smaller, from only –0.3 to –0.1 for pure-gas tests and from –0.5 to –0.1 for mixed-gas tests. This result demonstrates large differences in trends between high-pressure pure- and mixed-gas permeation tests for hydrogen bonding and non-hydrogen bonding polymers, further illustrating the influence of hydrogen bonding on plasticization resistance.
When mixed-gas tests were considered, the overall score differences for both hydrogen bonding and non-hydrogen bonding polymers were negative (Fig. 77), indicating a decrease in upper bound performance. This trend can be attributed to plasticization. PIM-1 samples are highlighted with a blue outline for both pure- and mixed-gas tests, where the same general trend of decreased CO2/CH4 performance in mixtures at high pressures is observed (Fig. 77). Taken together, mixed-gas tests allow for evaluation of the effects of plasticization on the transport of the co-permeating species, and therefore such tests can provide a more comprehensive view of changes in CO2/CH4 mixed-gas selectivity. In the pure-gas case, plasticization trends will only be observed based on CO2 plasticization pressure curves and, as a result, the potential change in CH4 permeation is concealed when calculating permselectivity.
CO2/CH4 upper bound plots for post-synthetically modified (PSM) microporous polymers and multi-component systems, which include MMMs and co-polymers, are presented in Fig. 76. In both PSM and multi-component systems, pure-gas tests display a wide variation in scores ranging from –0.6 to 0.1 and from –0.3 to 0.2, respectively. Both mitigation strategies appear to influence plasticization effects in a similar fashion. When comparing the ranges in the difference in upper bound scores between pure- and mixed-gas tests, PSM displayed a range of –0.6 to 0.1 for pure-gas tests versus –0.9 to –0.1 for mixed-gas tests. However, in regard to multi-component systems, pure-gas tests displayed a range of –0.3 to 0.2 while mixed-gas tests displayed a much larger range of –1.1 to 0.3. This finding suggests that plasticization adversely affects multi-component systems more than PSM polymers. However, it is important to note that not all samples tested under pure-gas conditions were also tested in mixtures, limiting our confidence in this conclusion. Therefore, only general trends can be drawn from Fig. 77 and only samples with both pure- and mixed-gas data can be used to draw direct conclusions. When considering a directly comparable set of polymers for PSM, for example, TPDA-APAF versus TPDA-ATAF treated at 250 °C, mixed-gas tests showed a 31% and a 30% loss in CO2/CH4 permselectivity versus a 20% and 12% permselectivity loss in the calculated pure-gas case, respectively.34 In addition, for the samples considered, CMS materials generally showed larger permselectivity differences compared to PSM samples that underwent thermal treatments at lower temperatures (e.g., TR and thermal annealing). For instance, in mixed-gas tests, the CMS derived from PIM-6FDA-OH at 600 °C and 800 °C had an additional 12% and 30% decrease in performance from pure-gas calculations to mixed-gas measurements, respectively. On the other hand, the thermally-rearranged PIM-6FDA-OH and the thermally annealed TPDA-APAF showed a smaller decrease of 2% and 11% in CO2/CH4 permselectivity compared to the pure-gas calculations, respectively. Larger permselectivity differences were also observed when considering directly comparable examples for multi-component systems compared to those for PSM systems, as shown in Fig. 76. For instance, for OAPS/PIM-1 (5 wt%),437 the calculated pure-gas permselectivity increased by 12% while the mixed-gas permselectivity at high pressure decreased by 24%. In this case, the calculated pure-gas selectivity appears to be higher because the sample is tested past its plasticization pressure point. Thus, the pure-gas CO2 permeability increases, but the CH4 permeability remains unaffected in the pure-gas case. In contrast, the experimental mixed-gas selectivity unambiguously shows the decrease in mixed-gas permselectivity as a result of plasticization.
Plasticization trends for C3H6/C3H8 mixtures are highlighted against the 2003 pure-gas and 2012 mixed-gas upper bound in Fig. 78. Once again, a reduction in selectivity is observed as pressure increases from 1 bar C3H6 partial pressure to 2.5 to 3 bar C3H6 partial pressure. For all reported samples containing PIM-6FDA-OH, a decrease in C3H6 permeability is also observed, likely due to competitive sorption with C3H8.159,329,414 In contrast, for PIM-PI-1 and KAUST-PI-1, C3H6 permeability increases as a result of significant plasticization which overcomes competitive sorption. While PIM-PI-1 and KAUST-PI-1 have high intrachain rigidity, they do not contain any hydrogen bonding moieties, rendering them susceptible to plasticization.329 PIM-6FDA-OH, however, contains –OH groups that hydrogen bond, assisting in CTC formation that helps suppress plasticization.159,329 Of note, even with plasticization effects, seven of the nine samples considered surpass the 2012 mixed-gas upper bound limit for this gas mixture. Moreover, when considering the PIM-6FDA-OH samples modified under various conditions, the TR analogue and the ZIF-assisted films showed the smallest decrease in performance metrics in mixed-gas scenarios, suggesting the promise of these strategies for boosting plasticization resistance. While plasticization effects were more pronounced for the CMS analogue of PIM-6FDA-OH compared to the original pristine polymer, performance remained above the 2003 upper bound given the initial enhancements resulting from carbonization of the material.
5.3. Long-term stability of microporous polymers
While this review will not cover long-term performance of microporous polymers in-depth (readers are referred to the following reference for more information),202 polymer stability is nevertheless an important factor to consider for industrial applications. In this section, we briefly summarize important studies (in both academic and industrial labs) pertaining to long-term performance and stability of microporous polymers.In 2022, Chen et al. developed dibenzomethanopentacene (DBMP)-based PIM copolymer films, and found that over an aging period of over 1000 days, the permeability of DBMP-based PIM copolymers was reduced only by 36–50%, while PIM-1 experienced a reduction in permeability of ∼74% on average, suggesting that the incorporation of the rigid DBMP motif can help reduce physical aging effects.516 Bezzu et al. reported that after long-term physical aging (>3.5 years), PIMs containing SBF motifs aged similarly to PIM-1, except for PIM-SBF-5 (Fig. 37), which saw a ∼39% decrease in CO2 permeability (compared to ∼79% for PIM-1).368 This slower aging exhibited by PIM-SBF-5 could be attributed to the bulky t-butyl groups that maintain distance between polymer chains that prevent collapse, while other PIM-SBF polymers contain smaller methyl groups.368 Swaidan et al. reported in 2015 that, despite the increased rigidity exhibited by TPIM-1 over PIM-1, the O2 permeability for TPIM-1 decreased by 95% over the course of 780 days (compared to 70% for PIM-1 over the course of 1380 days), suggesting that intrachain rigidity alone is insufficient in mitigating physical aging.517 However, there are some distinct counterexamples that note connections between interchain rigidity and observed reductions in physical aging effects for long-term tests. In 2013, Li and Chung reported differences in aging behavior for PIM-1 and PIM-UV4 h (a PIM-1 film that was UV-treated for 4 hours). Over the course of 100 days of aging in an ambient environment, the CH4 permeability of PIM-1 decreased by ∼60% and the CH4 permeability of PIM-UV4 h decreased by only 25%.389 This finding suggests that the UV-treated PIM membrane had a more stable structure than PIM-1. When comparing O2/N2 selectivity, PIM-UV4 h selectivity increased by ∼5% and PIM-1 selectivity increased by 30%, matching trade-off expectations in permeability and selectivity during aging.389
In 2021, Foster et al. synthesized PIM-1 thin film composite (TFC) membranes and found that both selectivity and aging behavior could be varied by changing the topology of the polymer.518 For instance, polymerization performed without nitrogen gas led to polymers with higher degrees of branching which could form into small loops.518 While high molecular weight PIM-1 TFC membranes exhibited a 76% decrease in CO2 permeability in the first 7 days of aging, a blend containing 80 wt% of high molecular weight PIM-1 and 20 wt% PIM-1 containing small loops exhibited a 47% decrease in CO2 permeability.518
The incorporation of fillers has also been shown to mitigate physical aging. In 2020, Chen et al. fabricated MOF-801/PIM-1 MMMs and aged them for 100 days in a dry environment. It was found that while the CO2 permeability of PIM-1 decreased by 60%, the CO2 permeability of MOF-801/PIM-1 MMM (with 5 wt% MOF-801) decreased by only 30%, suggesting that MOF-801 helped to rigidify PIM-1.519 In 2023, Cong et al. incorporated a trisilver complex (trisilver pyrazolate, Ag3pz3) into PIM-1 films to act as a C3H6 carrier filler.520 When the films were aged in an ambient environment, the permeability of C3H6 dropped in the first 60 days (∼15%) and then stabilized, while the C3H8 permeability remained stable throughout the 120 days of aging.520
In an industrial context, membrane modules often operate continuously for extended periods of time. Therefore, it is also important to test the long-term stability of polymer membranes under the presence of plasticizing gases to evaluate their resistance to plasticization. In 2019, Li et al. continuously operated an AO-PIM-1 membrane under a feed mixture containing 20 mol% H2S, 20 mol% CO2, and 60 mol% CH4 at a feed pressure of 8.6 bar and a temperature of 35 °C over the course of 10 days.521 It was found that the permeabilities of all gases stabilized after 7 days, and the mixed-gas H2S/CH4 (40 to 50) and CO2/CH4 (20) selectivities remained relatively consistent throughout the 10 days.521 It was hypothesized that the stability of permeabilities and selectivities during the long-term stability testing could be attributed to the free volume of the AO-PIM-1 membrane being continuously occupied by gases, which could reduce the densification of the membrane.521 Chen et al. reported that after 120 h of continuous gas permeation testing, MOF-801/PIM-1 membranes (with 5 wt% MOF) maintained stable performance with an average CO2 permeability of 9682 barrer throughout the test.519 In addition, Cong et al. reported that during long-term stability testing of Ag3pz3/PIM-1 membranes under single gas conditions, both C3H6 and C3H8 permeabilities remained stable throughout the 24 days of testing.520 Therefore, incorporating hydrogen bonding motifs (in the case of AO-PIM-1) or fillers (in the case of both MOF-801 and Ag3pz3) in PIM membranes can help maintain stability even when exposed to a continuous feed of plasticizing gases.
While this review does not cover refrigerant gases extensively, a study done by Gutiérrez-Hernández et al. in 2023 monitored the long-term separation performance of branched PIM-1 under a 50![[thin space (1/6-em)]](https://www.rsc.org/images/entities/char_2009.gif) :
:![[thin space (1/6-em)]](https://www.rsc.org/images/entities/char_2009.gif) 50 mixture feed of difluoromethane and pentafluoroethane at 1.3 bar and 30 °C, which was changed to a different mixture (68.9 vol% difluoromethane and 31.1 vol% 2,3,3,3-tetrafluoropropene) after four days.522 In the first four days, the permeability of difluoromethane increased by ∼45% to 1325 barrer, but after the mixture was switched, the difluoromethane permeability dropped to 1244 barrer due to an increase in difluoromethane concentration, which would be expected to decrease permeability based on dual-mode sorption.522 The permeability of difluoromethane then remained relatively constant throughout the rest of the long-term stability testing (7 days total), suggesting an opportunity and a need to further study PIM-1 and other microporous polymers for refrigerant applications.522
50 mixture feed of difluoromethane and pentafluoroethane at 1.3 bar and 30 °C, which was changed to a different mixture (68.9 vol% difluoromethane and 31.1 vol% 2,3,3,3-tetrafluoropropene) after four days.522 In the first four days, the permeability of difluoromethane increased by ∼45% to 1325 barrer, but after the mixture was switched, the difluoromethane permeability dropped to 1244 barrer due to an increase in difluoromethane concentration, which would be expected to decrease permeability based on dual-mode sorption.522 The permeability of difluoromethane then remained relatively constant throughout the rest of the long-term stability testing (7 days total), suggesting an opportunity and a need to further study PIM-1 and other microporous polymers for refrigerant applications.522
6. Conclusions and recommendations
Penetrant-induced plasticization remains a critical challenge for polymer membrane performance under realistic high-pressure and condensable feed conditions that are relevant to industry. This review presents a comprehensive summary of the phenomenon of plasticization in emerging microporous polymers, including an in-depth analysis of plasticization trends measured for pure- and mixed-gas permeation and sorption testing conditions. Additionally, in-depth characterization techniques are described to evaluate plasticization at a fundamental level. General mitigation strategies to reduce plasticization effects are also highlighted, including new synthetic approaches, post-synthetic modifications, and multi-component systems such as composites, blends, and copolymers.While gas permeation tests are an indirect method employed by membrane scientists to probe plasticization in polymer membranes, experiments that directly probe chain mobility in the presence of plasticizing gases can provide direct mechanistic information. For example, studies have been performed on traditional linear polymers to evaluate how gases such as CO2 influence mechanical properties and the glass transition temperature. However, there are very few related studies on microporous polymers. Tests such as dynamic mechanical analysis (DMA) and dilation experiments can probe chain mobility in the presence of plasticizing gases, which could fill this unmet research need. It is recommended that researchers use additional methods besides gas permeation tests to probe chain mobility in the presence of plasticizing gases, such as DMA, differential scanning calorimetry (DSC), dilation experiments, and molecular dynamics (MD) simulations.
When considering methods to mitigate plasticization effects in microporous polymers, previous research has focused on various strategies including the introduction of (1) rigid backbone moieties to induce intrachain rigidity, (2) hydrogen bonding backbone moieties to increase interchain rigidity, (3) thermal and chemical crosslinking, and (4) filler incorporation (such as metal–organic frameworks (MOFs)) or polymer–polymer blending. When viewed holistically, the most significant differences in transport performance were observed for systems with increased interchain rigidity induced by hydrogen bonding moieties, such as –OH. In fact, the variation in mixed-gas normalized permeabilities for CO2 and CH4 were much more significant in the absence of hydrogen bonding, suggesting that the introduction of secondary forces improves plasticization resistance. Other strategies including filler incorporation and crosslinking appeared to stabilize plasticization effects, but clear trends were not observed when comparing across classes of different fillers. Introducing methods to increase interchain rigidity can be a useful technique to mitigate plasticization effects, but in general, reducing intrachain mobility through the incorporation of bulky chain moieties does not significantly improve plasticization resistance. Therefore, we recommend that researchers further investigate the incorporation of secondary forces into microporous polymers, including the incorporation of hydrogen bonding motifs.
The plasticization pressure, which is the pressure at which permeability begins to increase with increasing feed pressure, is often the first metric used to determine if a membrane is plasticization resistant. However, the plasticization pressure alone does not account for changes in permeability of the less condensable penetrant in a mixture experiment. For mixed-gas experiments, some unambiguous indications of plasticization include an increase in permeability of the less condensable penetrant and a decrease in the overall permselectivity with increasing feed pressure. Additionally, when running pure- and mixed-gas tests, maximum feed pressures tested are around 25 bar, but plasticization behavior can significantly change at higher pressures. Therefore, in addition to high-pressure pure-gas tests, it is recommended that researchers perform mixed-gas tests with application-inspired conditions at relevant feed pressures and temperatures.
In addition to both pure- and mixed-gas permeation tests, it is also critical to report specific testing conditions and protocols when evaluating sorption and permeation at high pressures. While performing high-pressure tests is routine in the polymer membrane community, the hold times between each data point for testing are seldom reported. Because plasticization is directly associated to polymer chain motion and dynamics, slight changes in the amount of time a polymer is exposed to a plasticizing gas can significantly influence the resulting high-pressure data, thus biasing plasticization results. For example, PIM-1 has plasticization pressures for CO2 at 35 °C that range from <2 bar to 27 bar, despite these tests being run for the same polymer composition. It is recommended that researchers report the hold times of each pressure point for high-pressure sorption and permeation tests. Having this information will allow more consistent and reliable comparisons of plasticization effects between polymer structures and chemistries.
When considering mixed-gas testing in microporous materials, this review provides a comprehensive survey of mixtures and testing conditions that have been considered for polymers in the literature. While CO2/CH4 has been investigated in great depth, other binary and complex ternary mixtures are seldom explored, despite representing more realistic industrial scenarios. In general, the review of previous work showed that in binary CO2/CH4 mixtures, both sorption and diffusion selectivity play an important role in defining separation metrics. In mixtures containing H2S, sorption selectivity can play a much more significant role over diffusion selectivity in determining overall performance. As such, in addition to running mixed-gas tests with application-inspired feed pressures and temperatures, it is also recommended that mixture compositions reflect compositions found in industry. For example, investigating plasticizing impurities commonly found in natural gas such as H2S and BTEX aromatics would strengthen the current fundamental and practical understanding of plasticization for that specific application. Additional mixtures including condensable C2–C4 gases would also assist in evaluating membrane promise for emerging applications.475
It has been proposed that gases with high solubility and critical temperatures induce plasticization in polymer membranes. Before the era of microporous polymers, a critical gas concentration of 38 ± 7 cm(STP)3 cm(polymer)−3 was proposed to correlate with CO2 pure-gas plasticization curves, regardless of the polymer. While there has been some disagreement about the use of this specific critical concentration with non-microporous polymers,80 many recent studies on microporous polymers indicate that this critical concentration of CO2 is much higher.34,48,90,328,342,346 In this review, high-pressure plasticization data for microporous polymers was evaluated and the CO2 concentration observed at the plasticization pressure was found to be consistently higher than the critical concentration originally suggested by Bos et al. (Fig. 67). It is recommended that researchers perform sorption experiments during materials development to evaluate the effects of gas concentration on plasticization. Mixed-gas sorption experiments are ideal to replicate realistic conditions, and more of these experiments are encouraged, but as these tests are often not as accessible, models such as the mixed-gas dual-mode sorption model or NELF model can be used for predicting mixed-gas sorption behavior.
Lastly, most of the membranes tested at the lab scale are bulk films with thicknesses on the micron scale (i.e., >1 μm). However, in an industrial setting, thinner membranes (i.e., <1 μm) are required to maximize productivity. Moreover, thinner membranes are more susceptible to plasticization,460,523 and thus the thicker membranes that are often tested are not fully representative of how the same material will perform in an industrial setting. Finally, membrane modules operating in a real process are used continuously for extended periods of time, indicating an application need to explore testing under continuous gas flow. We encourage researchers to examine the plasticization properties of thick and thin films using sorption experiments and long-term permeation tests in the presence of plasticizing contaminants.
In conclusion, microporous polymers represent a class of promising materials for gas separations due to their solution processability and high performance relative to the Robeson upper bound. However, despite their rigid backbone structures, microporous materials and emerging polymers are often still susceptible to penetrant-induced plasticization. Although further research is needed to fully understand and mitigate plasticization effects, a great deal of progress has been made to address these effects and enable membrane technology for emerging applications.
List of abbreviations
Conflicts of interest
There are no conflicts of interest to declare.Acknowledgements
We gratefully acknowledge support for this study from the National Science Foundation CAREER Award under Award Number CBET-2146422, the U.S. Department of Energy, Office of Science, Office of Basic Energy Science, Separation Science program under Award Number DE-SC0019087, and the Department of the Navy, Office of Naval Research under ONR awards N00014-20-1-2418 and N00014-21-1-2666.References
- G. Towler and R. Sinnott, Chemical Engineering Design Principles, Practice and Economics of Plant and Process Design, Elsevier Ltd, 2nd edn, 2013 Search PubMed.
- J. D. Seader, E. J. Henley and D. K. Roper, Separation Process Principles, Wiley, 3rd edn, 2011 Search PubMed.
- D. S. Sholl and R. P. Lively, Nature, 2016, 532, 435–437 CrossRef PubMed.
- U. S. E. I. Administration, Energy consumption estimates by sector, https://www.eia.gov/totalenergy/data/annual/index.php.
- U.S. Energy Information Administration, International Energy Outlook 2022, https://www.eia.gov/outlooks/ieo/, (accessed 20 May 2022).
- U.S. Energy Information Administration, Annual Energy Outlook 2021, https://www.eia.gov/outlooks/aeo/, (accessed 23 January 2022).
- D. F. Sanders, Z. P. Smith, R. Guo, L. M. Robeson, J. E. McGrath, D. R. Paul and B. D. Freeman, Polymer, 2013, 54, 4729–4761 CrossRef CAS.
- S. Mokhatab and W. A. Poe, Handbook of Natural Gas Transmission and Processing, Elsevier Science Ltd, 2012, pp. 253–290 Search PubMed.
- C. Z. Liang, T. S. Chung and J. Y. Lai, Prog. Polym. Sci., 2019, 97, 101141 CrossRef CAS.
- M. Galizia, W. S. Chi, Z. P. Smith, T. C. Merkel, R. W. Baker and B. D. Freeman, Macromolecules, 2017, 50, 7809–7843 CrossRef CAS.
- R. W. Baker, Ind. Eng. Chem. Res., 2002, 41, 1393–1411 CrossRef CAS.
- Materials & Chemicals Market Research Reports & Materials & Chemicals Industry Analysis, https://www.marketresearch.com/Heavy-Industry-c1595/Materials-Chemicals-c91/, (accessed 23 January 2022).
- B. D. Freeman, Macromolecules, 1999, 32, 375–380 CrossRef CAS.
- A. Y. Alentiev and Y. P. Yampolskii, J. Membr. Sci., 2000, 165, 201–216 CrossRef CAS.
- L. M. Robeson, Z. P. Smith, B. D. Freeman and D. R. Paul, J. Membr. Sci., 2014, 453, 71–83 CrossRef CAS.
- A. X. Wu, J. A. Drayton and Z. P. Smith, AIChE J., 2019, 65, 1–12 CrossRef.
- L. M. Robeson, J. Membr. Sci., 1991, 62, 165–185 CrossRef CAS.
- L. M. Robeson, J. Membr. Sci., 2008, 320, 390–400 CrossRef CAS.
- A. Roy, S. R. Venna, G. Rogers, L. Tang, T. C. Fitzgibbons, J. Liu, H. McCurry, D. J. Vickery, D. Flick and B. Fish, Proc. Natl. Acad. Sci. U. S. A., 2021, 118, 1–9 Search PubMed.
- H. Zhai and E. S. Rubin, Environ. Sci. Technol., 2013, 47, 3006–3014 CrossRef CAS PubMed.
- B. D. Bhide and S. A. Stern, J. Membr. Sci., 1991, 62, 37–58 CrossRef CAS.
- C. A. Scholes, M. T. Ho, D. E. Wiley, G. W. Stevens and S. E. Kentish, Int. J. Greenh. Gas Control, 2013, 17, 341–348 CrossRef CAS.
- L. Zhao, E. Riensche, L. Blum and D. Stolten, J. Membr. Sci., 2010, 359, 160–172 CrossRef CAS.
- T. C. Merkel, H. Lin, X. Wei and R. Baker, J. Membr. Sci., 2010, 359, 126–139 CrossRef CAS.
- P. M. Budd, B. S. Ghanem, S. Makhseed, N. B. McKeown, K. J. Msayib and C. E. Tattershall, Chem. Commun., 2004, 230–231 RSC.
- P. M. Budd, E. S. Elabas, B. S. Ghanem, S. Makhseed, N. B. McKeown, K. J. Msayib, C. E. Tattershall and D. Wang, Adv. Mater., 2004, 16, 456–459 CrossRef CAS.
- Y. Rogan, L. Starannikova, V. Ryzhikh, Y. Yampolskii, P. Bernardo, F. Bazzarelli, J. C. Jansen and N. B. McKeown, Polym. Chem., 2013, 4, 3813–3820 RSC.
- R. Swaidan, B. Ghanem, E. Litwiller and I. Pinnau, Macromolecules, 2015, 48, 6553–6561 CrossRef CAS.
- M. Carta, M. Croad, R. Malpass-Evans, J. C. Jansen, P. Bernardo, G. Clarizia, K. Friess, M. Lanč and N. B. McKeown, Adv. Mater., 2014, 26, 3526–3531 CrossRef CAS PubMed.
- E. Lasseuguette, R. Malpass-Evans, M. Carta, N. B. McKeown and M. C. Ferrari, Membranes, 2018, 8, 1–11 CrossRef PubMed.
- S. L. Li, Z. Zhu, J. Li, Y. Hu and X. Ma, Polymer, 2020, 193, 122369 CrossRef CAS.
- Y. Rogan, R. Malpass-Evans, M. Carta, M. Lee, J. C. Jansen, P. Bernardo, G. Clarizia, E. Tocci, K. Friess, M. Lanč and N. B. McKeown, J. Mater. Chem. A, 2014, 2, 4874–4877 RSC.
- M. Carta, R. Malpass-Evans, M. Croad, Y. Rogan, J. C. Jansen, P. Bernardo, F. Bazzarelli and N. B. McKeown, Science, 2013, 339, 303–307 CrossRef CAS PubMed.
- R. Swaidan, B. Ghanem, E. Litwiller and I. Pinnau, J. Membr. Sci., 2015, 475, 571–581 CrossRef CAS.
- C. G. Bezzu, M. Carta, A. Tonkins, J. C. Jansen, P. Bernardo, F. Bazzarelli and N. B. Mckeown, Adv. Mater., 2012, 24, 5930–5933 CrossRef CAS PubMed.
- B. S. Ghanem, N. B. McKeown, P. M. Budd and D. Fritsch, Macromolecules, 2008, 41, 1640–1646 CrossRef CAS.
- N. Du, H. B. Park, G. P. Robertson, M. M. Dal-Cin, T. Visser, L. Scoles and M. D. Guiver, Nat. Mater., 2011, 10, 372–375 CrossRef CAS PubMed.
- K. Mizrahi Rodriguez, S. Lin, A. X. Wu, G. Han, J. J. Teesdale, C. M. Doherty and Z. P. Smith, Angew. Chem., Int. Ed., 2021, 60, 6593–6599 CrossRef CAS PubMed.
- Y. He, F. M. Benedetti, S. Lin, C. Liu, Y. Zhao, H. Z. Ye, T. Van Voorhis, M. G. De Angelis, T. M. Swager and Z. P. Smith, Adv. Mater., 2019, 31, 1–8 Search PubMed.
- Y. Huang and D. R. Paul, J. Membr. Sci., 2004, 244, 167–178 CrossRef CAS.
- D. Cangialosi, H. Schut, A. Van Veen and S. J. Picken, Macromolecules, 2003, 36, 142–147 CrossRef CAS.
- A. Bos, I. G. M. Pünt, M. Wessling and H. Strathmann, J. Membr. Sci., 1999, 155, 67–78 CrossRef CAS.
- B. W. Rowe, B. D. Freeman and D. R. Paul, Polymer, 2009, 50, 5565–5575 CrossRef CAS.
- B. W. Rowe, B. D. Freeman and D. R. Paul, Polymer, 2010, 51, 3784–3792 CrossRef CAS.
- M. Wessling, M. Lidon Lopez and H. Strathmann, Sep. Purif. Technol., 2001, 24, 223–233 CrossRef CAS.
- N. R. Horn and D. R. Paul, Polymer, 2011, 52, 5587–5594 CrossRef CAS.
- N. R. Horn and D. R. Paul, Macromolecules, 2012, 45, 2820–2834 CrossRef CAS.
- S. Yi, X. Ma, I. Pinnau and W. J. Koros, J. Mater. Chem. A, 2015, 3, 22794–22806 RSC.
- C. A. Scholes, G. W. Stevens and S. E. Kentish, Fuel, 2012, 96, 15–28 CrossRef CAS.
- R. Faiz and K. Li, Desalination, 2012, 287, 82–97 CrossRef CAS.
- J. Hou, P. Liu, M. Jiang, L. Yu, L. Li and Z. Tang, J. Mater. Chem. A, 2019, 7, 23489–23511 RSC.
- T. C. Merkel, M. Zhou and R. W. Baker, J. Membr. Sci., 2012, 389, 441–450 CrossRef CAS.
- C. A. Scholes, K. H. Smith, S. E. Kentish and G. W. Stevens, Int. J. Greenh. Gas Control, 2010, 4, 739–755 CrossRef CAS.
- W. Qiu, M. Kosuri, F. Zhou and W. J. Koros, J. Membr. Sci., 2009, 327, 96–103 CrossRef CAS.
- P. Shao and R. Y. M. Huang, J. Membr. Sci., 2007, 287, 162–179 CrossRef CAS.
- X. Qiao, T. S. Chung, W. F. Guo, T. Matsuura and M. M. Teoh, J. Membr. Sci., 2005, 252, 37–49 CrossRef CAS.
- M. Zhang, L. Deng, D. Xiang, B. Cao, S. S. Hosseini and P. Li, Processes, 2019, 7, 51–82 CrossRef CAS.
- N. N. Li, R. B. Long and E. J. Henley, Ind. Eng. Chem., 1965, 57, 18–29 CAS.
- N. N. Li and E. J. Henley, AIChE J., 1964, 666–670 CrossRef CAS.
- R. M. Barrer, R. Mallinder and P. S. L. Wong, Polymer, 1967, 8, 321–336 CrossRef CAS.
- W. J. Koros and D. R. Paul, J. Polym. Sci., Polym. Phys. Ed., 1978, 16, 1947–1963 CrossRef CAS.
- A. G. Wonders and D. R. Paul, J. Membr. Sci., 1979, 5, 63–75 CrossRef CAS.
- R. T. Chern, W. J. Koros, E. S. Sanders and R. Yui, J. Membr. Sci., 1983, 15, 157–169 CrossRef CAS.
- J. S. Chiou, J. W. Barlow and D. R. Paul, J. Appl. Polym. Sci., 1985, 30, 2633–2642 CrossRef CAS.
- G. K. Fleming and W. J. Koros, Macromolecules, 1986, 19, 2285–2291 CrossRef CAS.
- E. S. Sanders, J. Membr. Sci., 1988, 37, 63–80 CrossRef CAS.
- S. Zhou and S. A. Stern, J. Polym. Sci., Part B: Polym. Phys., 1989, 27, 205–222 CrossRef CAS.
- A. C. Puleo and D. R. Paul, J. Membr. Sci., 1989, 47, 301–332 CrossRef CAS.
- P. B. Smith and D. J. Moll, Macromolecules, 1990, 23, 3250–3256 CrossRef CAS.
- G. K. Fleming and W. J. Koros, J. Polym. Sci., Part B: Polym. Phys., 1990, 28, 1137–1152 CrossRef CAS.
- R. T. Chern and C. N. Provan, Macromolecules, 1991, 24, 2203–2207 CrossRef CAS.
- M. Wessling, S. Schoeman, T. van der Boomgaard and C. A. Smolders, Gas Sep. Purif., 1991, 5, 222–228 CrossRef CAS.
- J. H. Petropoulos, J. Membr. Sci., 1992, 75, 47–59 CrossRef CAS.
- A. Y. Houde, S. S. Kulkarni and M. G. Kulkarni, J. Membr. Sci., 1992, 71, 117–128 CrossRef CAS.
- M. Wessling, I. Huisman, T. V. D. Boomgaard and C. A. Smolders, J. Polym. Sci., Part B: Polym. Phys., 1995, 33, 1371–1384 CrossRef CAS.
- A. Bos, I. G. M. Pünt, M. Wessling and H. Strathmann, Sep. Purif. Technol., 1998, 14, 27–39 CrossRef CAS.
- A. Bos, I. G. M. Pünt, M. Wessling and H. Strathmann, J. Membr. Sci., 1999, 155, 67–78 CrossRef CAS.
- C. Staudt-Bickel and W. J. Koros, J. Membr. Sci., 1999, 155, 145–154 CrossRef CAS.
- J. D. Wind, C. Staudt-Bickel, D. R. Paul and W. J. Koros, Ind. Eng. Chem. Res., 2002, 41, 6139–6148 CrossRef CAS.
- J. D. Wind, S. M. Sirard, D. R. Paul, P. F. Green, K. P. Johnston and W. J. Koros, Macromolecules, 2003, 36, 6433–6441 CrossRef CAS.
- J. D. Wind, C. Staudt-Bickel, D. R. Paul and W. J. Koros, Macromolecules, 2003, 36, 1882–1888 CrossRef CAS.
- J. D. Wind, D. R. Paul and W. J. Koros, J. Membr. Sci., 2004, 228, 227–236 CrossRef CAS.
- A. Bos, I. Pünt, H. Strathmann and M. Wessling, AIChE J., 2001, 47, 1088–1093 CrossRef CAS.
- T. Visser, G. H. Koops and M. Wessling, J. Membr. Sci., 2005, 252, 265–277 CrossRef CAS.
- H. Lin, E. Van Wagner, B. D. Freeman, L. G. Toy and R. P. Gupta, Science, 2006, 311, 639–642 CrossRef CAS PubMed.
- T. Visser, N. Masetto and M. Wessling, J. Membr. Sci., 2007, 306, 16–28 CrossRef CAS.
- T. Visser and M. Wessling, Macromolecules, 2007, 40, 4992–5000 CrossRef CAS.
- W. Qiu, C. C. Chen, L. Xu, L. Cui, D. R. Paul and W. J. Koros, Macromolecules, 2011, 44, 6046–6056 CrossRef CAS.
- M. Minelli and G. C. Sarti, J. Membr. Sci., 2013, 435, 176–185 CrossRef CAS.
- R. Swaidan, B. Ghanem, M. Al-Saeedi, E. Litwiller and I. Pinnau, Macromolecules, 2014, 47, 7453–7462 CrossRef CAS.
- R. R. Tiwari, Z. P. Smith, H. Lin, B. D. Freeman and D. R. Paul, Polymer, 2015, 61, 1–14 CrossRef CAS.
- Y. Xiao, B. T. Low, S. S. Hosseini, T. S. Chung and D. R. Paul, Prog. Polym. Sci., 2009, 34, 561–580 CrossRef CAS.
- J. K. Adewole, A. L. Ahmad, S. Ismail and C. P. Leo, Int. J. Greenh. Gas Control, 2013, 17, 46–65 CrossRef CAS.
- A. F. Ismail and W. Lorna, Sep. Purif. Technol., 2002, 27, 173–194 CrossRef CAS.
- E. P. Favvas, F. K. Katsaros, S. K. Papageorgiou, A. A. Sapalidis and A. C. Mitropoulos, React. Funct. Polym., 2017, 120, 104–130 CrossRef CAS.
- U. W. R. Siagian, A. Raksajati, N. F. Himma, K. Khoiruddin and I. G. Wenten, J. Nat. Gas Sci. Eng., 2019, 67, 172–195 CrossRef CAS.
- C. A. Scholes, S. E. Kentish and G. W. Stevens, Sep. Purif. Rev., 2009, 38, 1–44 CrossRef CAS.
- K. Hunger, N. Schmeling, H. B. T. Jeazet, C. Janiak, C. Staudt and K. Kleinermanns, Membranes, 2012, 2, 727–763 CrossRef CAS PubMed.
- Y. S. Chang, P. Kumari, C. J. Munro, G. Szekely, L. F. Vega, S. Nunes and L. F. Dumée, J. Membr. Sci., 2023, 666, 121125 CrossRef CAS.
- Y. Liu, Z. Liu, G. Liu, W. Qiu, N. Bhuwania, D. Chinn and W. J. Koros, J. Membr. Sci., 2020, 593, 117430 CrossRef CAS.
- G. Reiter and P. G. De Gennes, Eur. Phys. J. E, 2001, 6, 25–28 CrossRef CAS.
- A. Serghei and F. Kremer, Macromol. Chem. Phys., 2008, 209, 810–817 CrossRef CAS.
- P. M. Budd, N. B. McKeown and D. Fritsch, J. Mater. Chem., 2005, 15, 1977–1986 RSC.
- F. Doghieri and G. C. Sarti, Macromolecules, 1996, 29, 7885–7896 CrossRef CAS.
- L. C. E. Struik, Polym. Eng. Sci., 1977, 17, 165–173 CrossRef CAS.
- R. W. Baker and B. T. Low, Macromolecules, 2014, 47, 6999–7013 CrossRef CAS.
- Y. Huang and D. R. Paul, Ind. Eng. Chem. Res., 2007, 46, 2342–2347 CrossRef CAS.
- T. P. Lodge and P. C. Hiemenz, Polymer chemistry, CRC Press, Boca Raton, 3rd edn, 2019 Search PubMed.
- J. Zhou, A. T. Haldeman, E. H. Wagener and S. M. Husson, J. Membr. Sci., 2014, 454, 398–406 CrossRef CAS.
- O. S. Fleming and S. G. Kazarian, Polym. Sci., 2006, 42, 205–238 Search PubMed.
- F. Chen, D. Peng, Y. Ogata, K. Tanaka, Z. Yang, Y. Fujii, N. L. Yamada, C. H. Lam and O. K. C. Tsui, Macromolecules, 2015, 48, 7719–7726 CrossRef CAS.
- I. Kikic, F. Vecchione, P. Alessi, A. Cortesi and F. Eva, Ind. Eng. Chem. Res., 2003, 42, 3022–3029 CrossRef CAS.
- R. G. Wissinger and M. E. Paulaitis, J. Polym. Sci., Part B: Polym. Phys., 1991, 29, 631–633 CrossRef CAS.
- P. Alessi, A. Cortesi, I. Kikic and F. Vecchione, J. Appl. Polym. Sci., 2003, 88, 2189–2193 CrossRef CAS.
- S. Araujo, N. Delpouve, S. Domenek, A. Guinault, R. Golovchak, R. Szatanik, A. Ingram, C. Fauchard, L. Delbreilh and E. Dargent, Macromolecules, 2019, 52, 6107–6115 CrossRef CAS.
- P. Flory, Principles of Polymer Chemistry, Cornell University Press, Ithaca, 1953 Search PubMed.
- E. Favre, P. Schaetzel, Q. T. Nguygen, R. Clément and J. Néel, J. Membr. Sci., 1994, 92, 169–184 CrossRef CAS.
- J. M. Zielinski and J. L. Duda, AIChE J., 1992, 38, 405–415 CrossRef CAS.
- M. Rubinstein and R. H. Colby, Polymer Physics, Oxford University Press, Oxford, UK, 2003 Search PubMed.
- H. B. Eitouni and N. P. Balsara, Physical Properties of Polymers Handbook, Springer, New York, NY, 2nd edn, 2007, pp. 339–356 Search PubMed.
- M. Mulder, Pervaporation Membrane Separation Processes, Elsevier, Amsterdam, 1991, pp. 225–250 Search PubMed.
- A. G. Mikos and N. A. Peppas, Biomaterials, 1988, 9, 419–423 CrossRef CAS PubMed.
- S. S. Jawalkar, K. V. S. N. Raju, S. B. Halligudi, M. Sairam and T. M. Aminabhavi, J. Phys. Chem. B, 2007, 111, 2431–2439 CrossRef CAS PubMed.
- Y. Yampolskii, I. Pinnau and B. Freeman, Materials Science of Membranes for Gas and Vapor Separation, John Wiley & Sons Ltd, Chichester, 2006 Search PubMed.
- T. C. Merkel, V. I. Bondar, K. Nagai, B. D. Freeman and I. Pinnau, J. Polym. Sci., Part B: Polym. Phys., 2000, 38, 415–434 CrossRef CAS.
- J. R. Li, R. J. Kuppler and H. C. Zhou, Chem. Soc. Rev., 2009, 38, 1477–1504 RSC.
- A. G. Cubitt, C. Henderson, L. A. K. Staveley, I. M. A. Fonseca, A. G. M. Ferreira and L. Q. Lobo, J. Chem. Thermodyn., 1987, 19, 703–710 CrossRef CAS.
- W. M. Haynes, CRC Handbook of Chemistry and Physics, CRC Press, Boca Raton, 95th edn, 2014 Search PubMed.
- National Institute of Standards and Technology, https://www.nist.gov/, (accessed 10 June 2022).
- D. W. Breck, Zeolite Molecular Sieves – Structure, Chemistry, and Use, John Wiley & Sons, New York, 1974 Search PubMed.
- G. Rutkai, M. Thol, R. Span and J. Vrabec, Mol. Phys., 2017, 115, 1104–1121 CrossRef CAS.
- D. W. Van Krevelen, Properties of Polymers, Elsevier, Amsterdam, 3rd edn, 1990 Search PubMed.
- B. E. Poling, J. M. Prausnitz and J. P. O’Connell, The Properties of Gases and Liquids, McGraw-Hill, New York, 5th edn, 2000 Search PubMed.
- Q. Qian, P. A. Asinger, M. J. Lee, G. Han, K. Mizrahi Rodriguez, S. Lin, F. M. Benedetti, A. X. Wu, W. S. Chi and Z. P. Smith, Chem. Rev., 2020, 120, 8161–8266 CrossRef CAS PubMed.
- J. G. Wijmans and R. W. Baker, J. Membr. Sci., 1995, 107, 1–21 CrossRef CAS.
- W. Deen, Analysis of transport phenomena, Oxford University Press, New York, 1998 Search PubMed.
- H. W. H. Lai, F. M. Benedetti, Z. Jin, Y. C. Teo, A. X. Wu, M. G. De Angelis, Z. P. Smith and Y. Xia, Macromolecules, 2019, 52, 6294–6302 CrossRef CAS.
- K. Mizrahi Rodriguez, A. X. Wu, Q. Qian, G. Han, S. Lin, F. M. Benedetti, H. Lee, W. S. Chi, C. M. Doherty and Z. P. Smith, Macromolecules, 2020, 53, 6220–6234 CrossRef CAS.
- S. Lin, T. Joo, F. M. Benedetti, L. C. Chen, A. X. Wu, K. M. Rodriguez, Q. Qian, C. M. Doherty and Z. P. Smith, Polymer, 2021, 212, 123121 CrossRef CAS.
- D. R. Paul, ACS Symp. Ser., 1979, 83, 294–302 CAS.
- W. J. Koros, J. Polym. Sci., Part A-2, 1980, 18, 981–992 CAS.
- K. Mizrahi Rodriguez, F. M. Benedetti, N. Roy, A. X. Wu and Z. P. Smith, J. Mater. Chem. A, 2021, 9, 23631–23642 RSC.
- E. Ricci, F. M. Benedetti, M. E. Dose, M. G. De Angelis, B. D. Freeman and D. R. Paul, J. Membr. Sci., 2020, 612, 118374 CrossRef CAS.
- D. R. Paul and W. J. Koros, J. Polym. Sci., Part A-2, 1976, 14, 675–685 CAS.
- T. A. Barbari, W. J. Koros and D. R. Paul, J. Membr. Sci., 1989, 42, 69–86 CrossRef CAS.
- S. A. Stern and V. Saxena, J. Membr. Sci., 1980, 7, 47–59 CrossRef CAS.
- M. H. Cohen and D. Turnbull, J. Chem. Phys., 1959, 31, 1164–1169 CrossRef CAS.
- I. C. Sanchez and R. H. Lacombe, Macromolecules, 1978, 11, 1145–1156 CrossRef CAS.
- M. G. Baschetti, F. Doghieri and G. C. Sarti, Ind. Eng. Chem. Res., 2001, 40, 3027–3037 CrossRef.
- M. G. De Angelis, T. C. Merkel, V. I. Bondar, B. D. Freedman, F. Doghieri and G. C. Sarti, Macromolecules, 2002, 35, 1276–1288 CrossRef CAS.
- M. Galizia, M. G. De Angelis and G. C. Sarti, J. Membr. Sci., 2012, 405–406, 201–211 CrossRef CAS.
- A. Bos, I. G. M. Pünt, P. Pünt, M. Wessling and H. Strathmann, J. Polym. Sci., Part B: Polym. Phys., 1998, 36, 1547–1556 CrossRef CAS.
- N. R. Horn and D. R. Paul, Polymer, 2011, 52, 1619–1627 CrossRef CAS.
- A. C. Puleo and D. R. Paul, J. Membr. Sci., 1989, 47, 301–332 CrossRef CAS.
- S. Damle and W. J. Koros, Ind. Eng. Chem. Res., 2003, 42, 6389–6395 CrossRef CAS.
- K. S. Liao, J. Y. Lai and T. S. Chung, J. Membr. Sci., 2016, 515, 36–44 CrossRef CAS.
- Y. Naito, Y. Kamiya, K. Terada, K. Mizoguchi and J. S. Wang, J. Appl. Polym. Sci., 1996, 61, 945–950 CrossRef CAS.
- J. T. Vaughn and W. J. Koros, J. Membr. Sci., 2014, 465, 107–116 CrossRef CAS.
- R. J. Swaidan, X. Ma, E. Litwiller and I. Pinnau, J. Membr. Sci., 2015, 495, 235–241 CrossRef CAS.
- G. Genduso and I. Pinnau, J. Membr. Sci., 2020, 610, 118269 CrossRef CAS.
- M. Balçık, S. Velioğlu, S. B. Tantekin-Ersolmaz and M. G. Ahunbay, Polymer, 2020, 205, 122789 CrossRef.
- E. Ricci, N. Vergadou, G. G. Vogiatzis, M. G. De Angelis and D. N. Theodorou, Macromolecules, 2020, 53, 3669–3689 CrossRef CAS PubMed.
- S. Neyertz and D. Brown, J. Membr. Sci., 2020, 614, 118478 CrossRef CAS.
- G. Kupgan, A. G. Demidov and C. M. Colina, J. Membr. Sci., 2018, 565, 95–103 CrossRef CAS.
- K. Simons, K. Nijmeijer, J. G. Sala, H. van der Werf, N. E. Benes, T. J. Dingemans and M. Wessling, Polymer, 2010, 51, 3907–3917 CrossRef CAS.
- M. Houben, R. van Geijn, M. van Essen, Z. Borneman and K. Nijmeijer, J. Membr. Sci., 2021, 620, 118922 CrossRef CAS.
- Z. P. Smith, G. Hernández, K. L. Gleason, A. Anand, C. M. Doherty, K. Konstas, C. Alvarez, A. J. Hill, A. E. Lozano, D. R. Paul and B. D. Freeman, J. Membr. Sci., 2015, 493, 766–781 CrossRef CAS.
- O. Hölck, M. R. Siegert, M. Heuchel and M. Böhning, Macromolecules, 2006, 39, 9590–9604 CrossRef.
- J. G. Wijmans, J. Membr. Sci., 2004, 237, 39–50 CrossRef CAS.
- M. Wessling, T. V. D. Boomgaard, M. H. V. Mulder and C. A. Smolders, Makromol. Chem., Macromol. Symp., 1993, 70–71, 379–396 CrossRef CAS.
- P. Ju, L. Jiang and T. B. Lu, Inorg. Chem., 2015, 54, 6291–6295 CrossRef CAS PubMed.
- J. Jeromenok and J. Weber, Langmuir, 2013, 29, 12982–12989 CrossRef CAS PubMed.
- G. Adam and J. H. Gibbs, J. Chem. Phys., 1965, 43, 139–146 CrossRef CAS.
- J. H. Gibbs and E. A. DiMarzio, J. Chem. Phys., 1958, 28, 373–383 CrossRef CAS.
- J. A. Forrest and K. Dalnoki-Veress, Adv. Colloid Interface Sci., 2001, 94, 167–195 CrossRef CAS.
- T. P. Lodge, Macromolecules, 2017, 50, 9525–9527 CrossRef CAS.
- S. Napolitano, E. Glynos and N. B. Tito, Rep. Prog. Phys., 2017, 80, 1–51 CrossRef PubMed.
- E. Vidal Russell and N. E. Israeloff, Nature, 2000, 408, 695–698 CrossRef PubMed.
- R. Böhmer, R. V. Chamberlin, G. Diezemann, B. Geil, A. Heuer, G. Hinze, S. C. Kuebler, R. Richert, B. Schiener, H. Sillescu, H. W. Spiess, U. Tracht and M. Wilhelm, J. Non.-Cryst. Solids, 1998, 235–237, 1–9 CrossRef.
- W. C. V. Wang, E. J. Kramer and W. H. Sachse, J. Polym. Sci., Part A-2, 1982, 20, 1371–1384 CAS.
- H. A. Mannan, H. Mukhtar, T. Murugesan, R. Nasir, D. F. Mohshim and A. Mushtaq, Chem. Eng. Technol., 2013, 36, 1838–1846 CrossRef CAS.
- Y. Yampolskii, Macromolecules, 2012, 45, 3298–3311 CrossRef CAS.
- K. Golzar, H. Modarress and S. Amjad-Iranagh, J. Mol. Model., 2017, 23, 1–25 CrossRef CAS PubMed.
- H. Yin, Y. Z. Chua, B. Yang, C. Schick, W. J. Harrison, P. M. Budd, M. Böhning and A. Schönhals, J. Phys. Chem. Lett., 2018, 9, 2003–2008 CrossRef CAS PubMed.
- H. Yin, B. Yang, Y. Z. Chua, P. Szymoniak, M. Carta, R. Malpass-Evans, N. B. McKeown, W. J. Harrison, P. M. Budd, C. Schick, M. Böhning and A. Schönhals, ACS Macro Lett., 2019, 8, 1022–1028 CrossRef CAS PubMed.
- K. Toi, G. Morel and D. R. Paul, J. Appl. Polym. Sci., 1982, 27, 2997–3005 CrossRef CAS.
- Y. Maeda and D. R. Paul, J. Polym. Sci., Part B: Polym. Phys., 1987, 25, 957–980 CrossRef CAS.
- S. Alexander Stern, J. Membr. Sci., 1994, 94, 1–65 CrossRef.
- R. P. White and J. E. G. Lipson, Macromolecules, 2016, 49, 3987–4007 CrossRef CAS.
- J. S. Vrentas and J. L. Duda, J. Polym. Sci., Polym. Phys. Ed., 1977, 15, 403–416 CrossRef CAS.
- N. Ramesh, P. K. Davis, J. M. Zielinski, R. P. Danner and J. L. Duda, J. Polym. Sci., Part B: Polym. Phys., 2011, 49, 1629–1644 CrossRef CAS.
- R. P. Danner, Fluid Phase Equilib., 2014, 362, 19–27 CrossRef CAS.
- L. M. Robeson, Q. Liu, B. D. Freeman and D. R. Paul, J. Membr. Sci., 2015, 476, 421–431 CrossRef CAS.
- P. M. Budd, K. J. Msayib, C. E. Tattershall, B. S. Ghanem, K. J. Reynolds, N. B. McKeown and D. Fritsch, J. Membr. Sci., 2005, 251, 263–269 CrossRef CAS.
- T. Corrado and R. Guo, Mol. Syst. Des. Eng., 2020, 5, 22–48 RSC.
- A. Bondi, J. Phys. Chem., 1964, 68, 441–451 CrossRef CAS.
- D. W. Van Krevelen and K. Te Nijenhuis, Properties of Polymers, Elsevier BV, Amsterdam, 4th edn, 2009 Search PubMed.
- S. S. Jordan and W. J. Koros, Macromolecules, 1995, 28, 2228–2235 CrossRef CAS.
- N. R. Horn, J. Membr. Sci., 2016, 518, 289–294 CrossRef CAS.
- A. X. Wu, S. Lin, K. Mizrahi Rodriguez, F. M. Benedetti, T. Joo, A. F. Grosz, K. R. Storme, N. Roy, D. Syar and Z. P. Smith, J. Membr. Sci., 2021, 636, 119526 CrossRef CAS.
- J. Y. Park and D. R. Paul, J. Membr. Sci., 1997, 125, 23–39 CrossRef CAS.
- Z. X. Low, P. M. Budd, N. B. McKeown and D. A. Patterson, Chem. Rev., 2018, 118, 5871–5911 CrossRef CAS PubMed.
- Y. P. Yampolskii, Russ. Chem. Rev., 2007, 76, 59–78 CrossRef CAS.
- A. Thran, C. Kroll and F. Faupel, J. Polym. Sci., Part B: Polym. Phys., 1999, 37, 3344–3358 CrossRef CAS.
- S. Matteucci, Y. Yampolskii, B. D. Freeman and I. Pinnau, Materials Science of Membranes for Gas and Vapor Separation, John Wiley & Sons Ltd, 2006, pp. 1–47 Search PubMed.
- C. C. Hu, C. S. Chang, R. C. Ruaan and J. Y. Lai, J. Membr. Sci., 2003, 226, 51–61 CrossRef CAS.
- T. T. Moore and W. J. Koros, J. Appl. Polym. Sci., 2007, 104, 4053–4059 CrossRef CAS.
- A. M. Kratochvil and W. J. Koros, Macromolecules, 2010, 43, 4679–4687 CrossRef CAS.
- S. Velioǧlu, M. G. Ahunbay and S. B. Tantekin-Ersolmaz, J. Membr. Sci., 2012, 417–418, 217–227 CrossRef.
- K. S. Chang, C. C. Hsiung, C. C. Lin and K. L. Tung, J. Phys. Chem. B, 2009, 113, 10159–10169 CrossRef CAS PubMed.
- A. K. Doolittle, J. Appl. Phys., 1951, 22, 1471–1475 CrossRef CAS.
- D. L. Hogenboom, W. Webb and J. A. Dixon, J. Chem. Phys., 1967, 46, 2586–2598 CrossRef CAS.
- W. Herreman, W. Grevendonk and A. De Bock, J. Chem. Phys., 1970, 53, 185–189 CrossRef CAS.
- A. A. Miller, J. Phys. Chem., 1963, 67, 1031–1035 CrossRef CAS.
- M. H. Lee, D. H. Han and B. Cho, J. Appl. Polym. Sci., 1993, 50, 1803–1806 CrossRef CAS.
- F. R. Schwarzl and F. Zahradnik, Rheol. Acta, 1980, 19, 137–152 CrossRef CAS.
- M. L. Williams, R. F. Landel and J. D. Ferry, J. Am. Chem. Soc., 1955, 77, 3701–3707 CrossRef CAS.
- M. A. Bohn, Propellants, Explos., Pyrotech., 2019, 44, 696–705 CrossRef CAS.
- T. G. Fox and S. Loshaek, J. Polym. Sci., 1955, 15, 371–390 CrossRef CAS.
- F. Xie, T. He, H. F. Zhang, F. K. Lee, B. Du, O. K. C. Tsui, Y. Yokoe, K. Tanaka, A. Takahara and T. Kajiyama, Macromolecules, 2002, 35, 1491–1492 CrossRef CAS.
- K. Tanaka, A. Taura, S. R. Ge, A. Takahara and T. Kajiyama, Macromolecules, 1996, 29, 3040–3042 CrossRef CAS.
- W. F. Yong and H. Zhang, Prog. Mater. Sci., 2021, 116, 100713 CrossRef CAS.
- S. Zhao, J. Liao, D. Li, X. Wang and N. Li, J. Membr. Sci., 2018, 566, 77–86 CrossRef CAS.
- W. F. Yong, F. Y. Li, Y. C. Xiao, P. Li, K. P. Pramoda, Y. W. Tong and T. S. Chung, J. Membr. Sci., 2012, 407–408, 47–57 CrossRef CAS.
- W. F. Yong and T. S. Chung, Polymer, 2015, 59, 290–297 CrossRef CAS.
- T. O. McDonald, R. Akhtar, C. H. Lau, T. Ratvijitvech, G. Cheng, R. Clowes, D. J. Adams, T. Hasell and A. I. Cooper, J. Mater. Chem. A, 2015, 3, 4855–4864 RSC.
- T. G. Fox, Bull. Am. Phys. Soc., 1956, 1, 123 CAS.
- N. B. Singh, N. P. Singh and K. Singh, Z. Phys. Chem., 1997, 199, 139–144 CrossRef CAS.
- R. F. Boyer, Polym. Eng. Sci., 1968, 8, 161–185 CrossRef CAS.
- J. Heijboer, Br. Polym. J., 1969, 1, 3–14 CrossRef CAS.
- R. F. Boyer, Polymer, 1976, 17, 996–1008 CrossRef CAS.
- J. Heijboer, Int. J. Polym. Mater. Polym. Biomater., 1977, 6, 11–37 CrossRef CAS.
- J. M. G. Cowie, J. Macromol. Sci., Part B: Phys., 1980, 18, 569–623 CrossRef.
- D. J. Meier, Molecular Basis of Transitions and Relaxation, CRC Press, 1967 Search PubMed.
- J. M. Pereña, Die Angew. Makromol. Chem., 1982, 106, 61–66 CrossRef.
- G. Xu, C. C. Gryte, A. S. Nowick, S. Z. Li, Y. S. Pak and S. G. Greenbaum, J. Appl. Phys, 1989, 66, 5290–5296 CrossRef CAS.
- C. Bas, C. Tamagna, T. Pascal and N. Dominique Alberola, Polym. Eng. Sci., 2003, 43, 344–355 CrossRef CAS.
- S. Z. D. Cheng, T. M. Chalmers, Y. Gu, Y. Yoon, F. W. Harris, J. Cheng, M. Fone and J. L. Koenig, Macromol. Chem. Phys., 1995, 196, 1439–1451 CrossRef CAS.
- J. P. Habas, J. Peyrelasse and M. F. Grenier-Loustalot, High Perform. Polym., 1996, 8, 515–532 CrossRef CAS.
- A. C. Comer, D. S. Kalika, B. W. Rowe, B. D. Freeman and D. R. Paul, Polymer, 2009, 50, 891–897 CrossRef CAS.
- H. W. Starkweather Jr, Macromolecules, 1981, 14, 1277–1281 CrossRef.
- H. W. Starkweather, Polymer, 1991, 32, 2443–2448 CrossRef CAS.
- P. Gill, T. T. Moghadam and B. Ranjbar, J. Biomol. Technol., 2010, 21, 167–193 Search PubMed.
- W. Brostow, S. H. Goodman and J. Wahrmund, Handbook of Thermoset Plastics, Elsevier, 2014, pp. 191–252 Search PubMed.
- Y. Z. Zhan, Y. Du and Y. H. Zhuang, Methods Phase Diagr. Determ., 2007, 108–150 Search PubMed.
- Humboldt Unniversitat zu Berlin, Adv. Lab DSC Investig. Polym., 2009, 1–17 Search PubMed.
- Q. Zheng, Y. Zhang, M. Montazerian, O. Gulbiten, J. C. Mauro, E. D. Zanotto and Y. Yue, Chem. Rev., 2019, 119, 7848–7939 CrossRef CAS PubMed.
- S. Yu, Y. Wu, S. Wang, M. Lu and L. Zuo, Sens. Actuators, A, 2019, 291, 150–155 CrossRef CAS.
- M. Ravindar Reddy, A. R. Subrahmanyam, M. Maheshwar Reddy, J. Siva Kumar, V. Kamalaker and M. Jaipal Reddy, Mater. Today Proc., 2016, 3, 3713–3718 CrossRef.
- G. B. McKenna and S. L. Simon, Handbook of Thermal Analysis and Calorimetry, Elsevier, 2002, vol. 3, pp. 49–109 Search PubMed.
- Y. Zhai, L. Okoro, A. Cooper and R. Winter, Biophys. Chem., 2011, 156, 13–23 CrossRef CAS PubMed.
- E. Huang, X. Liao, C. Zhao, C. B. Park, Q. Yang and G. Li, ACS Sustainable Chem. Eng., 2016, 4, 1810–1818 CrossRef CAS.
- Y. Mi and S. Zheng, Polymer, 1998, 39, 3709–3712 CrossRef CAS.
- V. A. Byershtein, L. M. Yegorova, V. M. Yegorov and A. B. Sinani, Polym. Sci. U.S.S.R., 1989, 31, 2719–2728 CrossRef.
- K. P. Menard and N. R. Menard, Encyclopedia of Polymer Science and Technology, John Wiley & Sons Ltd, New York, 2015, pp. 1–33 Search PubMed.
- K. Ghosal, R. T. Chern, B. D. Freeman, W. H. Daly and I. I. Negulescu, Macromolecules, 1996, 29, 4360–4369 CrossRef CAS.
- H. J. Jo, C. Y. Soo, G. Dong, Y. S. Do, H. H. Wang, M. J. Lee, J. R. Quay, M. K. Murphy and Y. M. Lee, Macromolecules, 2015, 48, 2194–2202 CrossRef CAS.
- Z. Mi, S. Wang, Z. Hou, Z. Liu, S. Jin, X. Wang, D. Wang, X. Zhao, Y. Zhang, H. Zhou and C. Chen, Polymers, 2019, 11, 1–19 Search PubMed.
- T. Lim, V. Frosini, V. Zaleckas, D. Morrow and J. A. Sauer, Polym. Eng. Sci., 1973, 13, 51–58 CrossRef CAS.
- G. N. Gubanova, S. V. Kononova, M. Cristea, D. Timpu, K. A. Romashkova, E. N. Korytkova, T. P. Maslennikova and N. N. Saprikina, Russ. J. Gen. Chem., 2015, 85, 1496–1505 CrossRef CAS.
- A. C. Comer, C. P. Ribeiro, B. D. Freeman, S. Kalakkunnath and D. S. Kalika, Polymer, 2013, 54, 891–900 CrossRef CAS.
- C. R. Maroon, J. Townsend, K. R. Gmernicki, D. J. Harrigan, B. J. Sundell, J. A. Lawrence, S. M. Mahurin, K. D. Vogiatzis and B. K. Long, Macromolecules, 2019, 52, 1589–1600 CrossRef CAS.
- X. Hu, W. H. Lee, J. Zhao, J. S. Kim, Z. Wang, J. Yan, Y. Zhuang and Y. M. Lee, J. Membr. Sci., 2020, 604, 118053 CrossRef CAS.
- J. R. Fried, H. C. Liu and C. Zhang, J. Polym. Sci., Part C: Polym. Lett., 1989, 27, 385–392 CrossRef CAS.
- T. S. Chow, Macromolecules, 1980, 13, 362–364 CrossRef CAS.
- M. Wessling, Z. Borneman, T. Van Den Boomgaard and C. A. Smolders, J. Appl. Polym. Sci., 1994, 53, 1497–1512 CrossRef CAS.
- W. Broughton, Adhes. Mar. Eng., 2012, 99–154 Search PubMed.
- M. Meyers, A. Engineering, S. Diego, E. Conferences, H. Senior, S. Award, T. M. S. D. Scientist, E. Awards, L. H. Award, K. Chawla and M. Science, Mechanical behavior of materials, Cambridge University Press, Cambridge, 2009, vol. 46 Search PubMed.
- R. E. Wetton, R. D. L. Marsh and J. G. Van-de-Velde, Thermochim. Acta, 1991, 175, 1–11 CrossRef CAS.
- P. C. Hiemenz and T. P. Lodge, Polymer Chemistry, CRC Press, Boca Raton, 2020, pp. 19–60 Search PubMed.
- S. Al-Enezi, K. Hellgardt and A. G. F. Stapley, Int. J. Polym. Anal. Charact., 2007, 12, 171–183 CrossRef CAS.
- J. Ulrich, H. G. Brion and R. Kirchheim, Polymer, 1999, 40, 1807–1814 CrossRef CAS.
- N. M. B. Flichy, S. G. Kazarian, C. J. Lawrence and B. J. Briscoe, J. Polym. Sci., Part B: Polym. Phys., 2001, 39, 3020–3028 CrossRef CAS.
- M. Minelli, S. Oradei, M. Fiorini and G. C. Sarti, Polymer, 2019, 163, 29–35 CrossRef CAS.
- G. Morel and D. R. Paul, J. Membr. Sci., 1982, 10, 273–282 CrossRef CAS.
- J. S. Chiou and D. R. Paul, J. Appl. Polym. Sci., 1986, 32, 2897–2918 CrossRef CAS.
- J. Xia, T. S. Chung and D. R. Paul, J. Membr. Sci., 2014, 450, 457–468 CrossRef CAS.
- P. Číhal, M. Dendisová, M. Švecová, Z. Hrdlička, T. M. Durďáková, P. M. Budd, W. Harrison, K. Friess and O. Vopička, Polymer, 2021, 218, 1–8 CrossRef.
- J. W. Schultz, Encycl. Anal. Chem., 2000, 1–19 CAS.
- N. Konnertz, Y. Ding, W. J. Harrison, P. M. Budd, A. Schönhals and M. Böhning, J. Membr. Sci., 2017, 529, 274–285 CrossRef CAS.
- Y. Poplavko, Broadband dielectric spectroscopy, 2021 Search PubMed.
- S. Havriliak and S. Negami, J. Polym. Sci., Part C: Polym. Symp., 2007, 14, 99–117 CrossRef.
- F. Kremer and A. Schönhals, Broadband dielectric spectroscopy, Springer-Verlag Berlin Heidelberg, New York, 2002 Search PubMed.
- N. Konnertz, Y. Ding, W. J. Harrison, P. M. Budd, A. Schönhals and M. Böhning, ACS Macro Lett., 2016, 5, 528–532 CrossRef CAS PubMed.
- Y. Matsumiya, T. Inoue, T. Iwashige and H. Watanabe, Macromolecules, 2009, 42, 4712–4718 CrossRef CAS.
- J. Schaefer, E. O. Stejskal and R. Buchdahl, Macromolecules, 1977, 10, 384–405 CrossRef CAS.
- J. Schaefer, E. O. Stejskal and R. Buchdahl, Macromolecules, 1975, 8, 291–296 CrossRef CAS.
- J. Schaefer and E. O. Stejskal, J. Am. Chem. Soc., 1976, 33, 1031–1032 CrossRef.
- A. J. Hill, S. J. Pas, T. J. Bastow, M. I. Burgar, K. Nagai, L. G. Toy and B. D. Freeman, J. Membr. Sci., 2004, 243, 37–44 CrossRef CAS.
- S. J. D. Smith, R. Hou, K. Konstas, A. Akram, C. H. Lau and M. R. Hill, Acc. Chem. Res., 2020, 53, 1381–1388 CrossRef CAS PubMed.
- C. H. Lau, X. Mulet, K. Konstas, C. M. Doherty, M. A. Sani, F. Separovic, M. R. Hill and C. D. Wood, Angew. Chem., Int. Ed., 2016, 55, 1998–2001 CrossRef CAS PubMed.
- C. H. Lau, P. T. Nguyen, M. R. Hill, A. W. Thornton, K. Konstas, C. M. Doherty, R. J. Mulder, L. Bourgeois, A. C. Y. Liu, D. J. Sprouster, J. P. Sullivan, T. J. Bastow, A. J. Hill, D. L. Gin and R. D. Noble, Angew. Chem., Int. Ed., 2014, 53, 5322–5326 CrossRef CAS PubMed.
- R. Hou, S. J. D. Smith, C. D. Wood, R. J. Mulder, C. H. Lau, H. Wang and M. R. Hill, ACS Appl. Mater. Interfaces, 2019, 11, 6502–6511 CrossRef CAS PubMed.
- N. Sakaguchi, M. Tanaka, M. Yamato and H. Kawakami, ACS Appl. Polym. Mater., 2019, 1, 2516–2524 CrossRef CAS.
- M. Koval’Aková, D. Olčák, V. Hronský, P. Vrábel, O. Fričová, I. Chodák, P. Alexy and G. Sučik, J. Appl. Polym. Sci., 2016, 133, 1–11 Search PubMed.
- M. D. Sefcik and J. Schaefer, J. Polym. Sci., Part A-2, 1983, 21, 1055–1062 CAS.
- M. D. Sefcik, J. Schaefer, F. L. May, D. Raucher and S. M. Dub, J. Polym. Sci., Part A-2, 1983, 21, 1041–1054 CAS.
- M. G. De Angelis, T. C. Merkel, V. I. Bondar, B. D. Freeman, F. Doghieri and G. C. Sarti, J. Polym. Sci., Part B: Polym. Phys., 1999, 37, 3011–3026 CrossRef CAS.
- J. N. Hilfiker, M. Stadermann, J. Sun, T. Tiwald, J. S. Hale, P. E. Miller and C. Aracne-Ruddle, Appl. Surf. Sci., 2017, 421, 508–512 CrossRef CAS.
- W. Ogieglo, H. Wormeester, M. Wessling and N. E. Benes, ACS Appl. Mater. Interfaces, 2012, 4, 935–943 CrossRef CAS PubMed.
- N. E. Benes, G. Spijksma, H. Verweij, H. Wormeester and B. Poelsema, AIChE J., 2001, 47, 1212–1218 CrossRef CAS.
- R. P. Feynman, R. B. Leighton and M. Sands, The Feynman Lectures on Physics, Addison-Wesley Publishing Company, Inc., Reading, MA, 1st edn, 1963 Search PubMed.
- A. R. Berens and H. B. Hopfenberg, Polymer, 1978, 19, 489–496 CrossRef CAS.
- D. S. Pope, G. K. Fleming and W. J. Koros, Macromolecules, 1990, 23, 2988–2994 CrossRef CAS.
- W. Ogieglo, B. Ghanem, X. Ma, M. Wessling and I. Pinnau, ACS Appl. Mater. Interfaces, 2018, 10, 11369–11376 CrossRef CAS PubMed.
- J. Crank, The Mathematics of Diffusion, Oxford University Press, London, 2nd edn, 1975 Search PubMed.
- A. C. Newns, Trans. Faraday Soc., 1956, 52, 1533–1545 RSC.
- T. Ormanci-Acar, M. Mohammadifakhr, N. E. Benes and W. M. de Vos, J. Membr. Sci., 2020, 610, 118277 CrossRef CAS.
- R. Tamime, Y. Wyart, L. Siozade, I. Baudin, C. Deumie, K. Glucina and P. Moulin, Membranes, 2011, 1, 91–97 CrossRef CAS PubMed.
- N. Du, H. B. Park, M. M. Dal-Cin and M. D. Guiver, Energy Environ. Sci., 2012, 5, 7306–7322 RSC.
- H. B. Park, C. H. Jung, Y. M. Lee, A. J. Hill, S. J. Pas, S. T. Mudie, E. Van Wagner, B. D. Freeman and D. J. Cookson, Science, 2007, 318, 254–258 CrossRef CAS PubMed.
- J. H. Kim, W. J. Koros and D. R. Paul, J. Membr. Sci., 2006, 282, 32–43 CrossRef CAS.
- W. Qiu, C. C. Chen, L. Xu, L. Cui, D. R. Paul and W. J. Koros, Macromolecules, 2011, 44, 6046–6056 CrossRef CAS.
- N. Alaslai, B. Ghanem, F. Alghunaimi, E. Litwiller and I. Pinnau, J. Membr. Sci., 2016, 505, 100–107 CrossRef CAS.
- W. Qiu, L. Xu, C. C. Chen, D. R. Paul and W. J. Koros, Polymer, 2013, 54, 6226–6235 CrossRef CAS.
- J. Vaughn and W. J. Koros, Macromolecules, 2012, 45, 7036–7049 CrossRef CAS.
- X. Duthie, S. Kentish, S. J. Pas, A. J. Hill, C. Powell, K. Nagai, G. Stevens and G. Qiao, J. Polym. Sci., Part B: Polym. Phys., 2008, 46, 1879–1890 CrossRef CAS.
- J. T. Vaughn, W. J. Koros, J. R. Johnson and O. Karvan, J. Membr. Sci., 2012, 401–402, 163–174 CrossRef CAS.
- N. B. McKeown, Sci. China: Chem., 2017, 60, 1023–1032 CrossRef CAS.
- B. S. Ghanem, Polym. Chem., 2012, 3, 96–98 RSC.
- B. S. Ghanem, R. Swaidan, X. Ma, E. Litwiller and I. Pinnau, Adv. Mater., 2014, 26, 6696–6700 CrossRef CAS PubMed.
- R. Swaidan, M. Al-Saeedi, B. Ghanem, E. Litwiller and I. Pinnau, Macromolecules, 2014, 47, 5104–5114 CrossRef CAS.
- B. S. Ghanem, R. Swaidan, E. Litwiller and I. Pinnau, Adv. Mater., 2014, 26, 3688–3692 CrossRef CAS PubMed.
- T. M. Long and T. M. Swager, J. Am. Chem. Soc., 2003, 125, 14113–14119 CrossRef CAS PubMed.
- M. Carta, M. Croad, J. C. Jansen, P. Bernardo, G. Clarizia and N. B. McKeown, Polym. Chem., 2014, 5, 5255–5261 RSC.
- B. Comesaña-Gándara, J. Chen, C. G. Bezzu, M. Carta, I. Rose, M. C. Ferrari, E. Esposito, A. Fuoco, J. C. Jansen and N. B. McKeown, Energy Environ. Sci., 2019, 12, 2733–2740 RSC.
- R. Williams, L. A. Burt, E. Esposito, J. C. Jansen, E. Tocci, C. Rizzuto, M. Lanč, M. Carta and N. B. McKeown, J. Mater. Chem. A, 2018, 6, 5661–5667 RSC.
- Y. Wang, B. S. Ghanem, Y. Han and I. Pinnau, Polymer, 2020, 201, 122619 CrossRef CAS.
- R. J. Swaidan, B. Ghanem, R. Swaidan, E. Litwiller and I. Pinnau, J. Membr. Sci., 2015, 492, 116–122 CrossRef CAS.
- R. L. Burns and W. J. Koros, J. Membr. Sci., 2003, 211, 299–309 CrossRef CAS.
- F. Li, C. Zhang and Y. Weng, Macromol. Chem. Phys., 2019, 220, 1–7 Search PubMed.
- P. Stanovsky, A. Zitkova, M. Karaszova, M. Šyc, J. C. Jansen, B. Comesaña Gándara, N. McKeown and P. Izak, Sep. Purif. Technol., 2020, 242, 2–7 CrossRef.
- F. Alghunaimi, B. Ghanem, N. Alaslai, R. Swaidan, E. Litwiller and I. Pinnau, J. Membr. Sci., 2015, 490, 321–327 CrossRef CAS.
- G. Genduso, Y. Wang, B. S. Ghanem and I. Pinnau, J. Membr. Sci., 2019, 584, 100–109 CrossRef CAS.
- Z. Zhu, J. Zhu, J. Li and X. Ma, Macromolecules, 2020, 53, 1573–1584 CrossRef CAS.
- X. Ma, Z. Zhu, W. Shi, W. Ji, J. Li, Y. Wang and I. Pinnau, J. Mater. Chem. A, 2021, 9, 5404–5414 RSC.
- Y. Wang, X. Ma, B. S. Ghanem, F. Alghunaimi, I. Pinnau and Y. Han, Mater. Today Nano, 2018, 3, 69–95 CrossRef.
- Z. Cai, Y. Liu, C. Wang, W. Xie, Y. Jiao, L. Shan, P. Gao, H. Wang and S. Luo, J. Membr. Sci., 2022, 644, 120115 CrossRef CAS.
- H. Chen, F. Dai, M. Wang, X. Yan, Z. Ke, C. Chen, G. Qian and Y. Yu, Eur. Polym. J., 2022, 173, 111231 CrossRef CAS.
- X. Han, L. Chen, Y. Wang, T. Wang, F. Cui, Z. Jiang and J. Pang, ACS Mater. Lett., 2022, 4, 61–67 CrossRef CAS.
- H. W. H. Lai, F. M. Benedetti, J. M. Ahn, A. M. Robinson, Y. Wang, I. Pinnau, Z. P. Smith and Y. Xia, Science, 2022, 375, 1390–1392 CrossRef CAS PubMed.
- M. A. Abdulhamid, G. Genduso, Y. Wang, X. Ma and I. Pinnau, Ind. Eng. Chem. Res., 2020, 59, 5247–5256 CrossRef CAS.
- N. Alaslai, B. Ghanem, F. Alghunaimi and I. Pinnau, Polymer, 2016, 91, 128–135 CrossRef CAS.
- N. Alaslai, X. Ma, B. Ghanem, Y. Wang, F. Alghunaimi and I. Pinnau, Macromol. Rapid Commun., 2017, 38, 1–5 CrossRef PubMed.
- F. Alghunaimi, B. Ghanem, N. Alaslai, M. Mukaddam and I. Pinnau, J. Membr. Sci., 2016, 520, 240–246 CrossRef CAS.
- X. Ma, R. Swaidan, Y. Belmabkhout, Y. Zhu, E. Litwiller, M. Jouiad, I. Pinnau and Y. Han, Macromolecules, 2012, 45, 3841–3849 CrossRef CAS.
- R. Swaidan, B. S. Ghanem, E. Litwiller and I. Pinnau, J. Membr. Sci., 2014, 457, 95–102 CrossRef CAS.
- S. Yi, B. Ghanem, Y. Liu, I. Pinnau and W. J. Koros, Sci. Adv., 2019, 5, 1–11 Search PubMed.
- M. Minelli, B. R. Pimentel, M. L. Jue, R. P. Lively and G. C. Sarti, Polymer, 2019, 170, 157–167 CrossRef CAS.
- J. H. Kim, W. J. Koros and D. R. Paul, J. Membr. Sci., 2006, 282, 21–31 CrossRef CAS.
- K. Tanaka, M. Okano, H. Toshino, H. Kita and K.-I. Okamoto, J. Polym. Sci., Part B: Polym. Phys., 1992, 30, 907–914 CrossRef CAS.
- S. Pandiyan, D. Brown, N. F. A. Van der Vegt and S. Neyertz, J. Polym. Sci., Part B: Polym. Phys., 2009, 47, 1166–1180 CrossRef CAS.
- G. M. Iyer, L. Liu and C. Zhang, J. Polym. Sci., 2020, 58, 2482–2517 CrossRef CAS.
- K. L. Gleason, Z. P. Smith, Q. Liu, D. R. Paul and B. D. Freeman, J. Membr. Sci., 2015, 475, 204–214 CrossRef CAS.
- G. Genduso, B. S. Ghanem and I. Pinnau, Membranes, 2019, 9, 1–14 CrossRef PubMed.
- E. Ricci, A. E. Gemeda, N. Du, N. Li, M. G. De Angelis, M. D. Guiver and G. C. Sarti, J. Membr. Sci., 2019, 585, 136–149 CrossRef CAS.
- Y. Weng, W. Ji, C. Ye, H. Dong, Z. Gao, J. Li, C. Luo and X. Ma, J. Membr. Sci., 2022, 644, 120086 CrossRef CAS.
- B. Satilmis, M. Lanč, A. Fuoco, C. Rizzuto, E. Tocci, P. Bernardo, G. Clarizia, E. Esposito, M. Monteleone, M. Dendisová, K. Friess, P. M. Budd and J. C. Jansen, J. Membr. Sci., 2018, 555, 483–496 CrossRef CAS.
- T. Corrado, Z. Huang, J. Aboki and R. Guo, Ind. Eng. Chem. Res., 2020, 59, 5351–5361 CrossRef CAS.
- I. Rose, C. G. Bezzu, M. Carta, B. Comesanã-Gándara, E. Lasseuguette, M. C. Ferrari, P. Bernardo, G. Clarizia, A. Fuoco, J. C. Jansen, K. E. Hart, T. P. Liyana-Arachchi, C. M. Colina and N. B. McKeown, Nat. Mater., 2017, 16, 932–937 CrossRef CAS PubMed.
- I. Rose, M. Carta, R. Malpass-Evans, M. C. Ferrari, P. Bernardo, G. Clarizia, J. C. Jansen and N. B. McKeown, ACS Macro Lett., 2015, 4, 912–915 CrossRef CAS PubMed.
- B. S. Ghanem, M. Hashem, K. D. M. Harris, K. J. Msayib, M. Xu, P. M. Budd, N. Chaukura, D. Book, S. Tedds, A. Walton and N. B. McKeown, Macromolecules, 2010, 43, 5287–5294 CrossRef CAS.
- S. A. Sydlik, Z. Chen and T. M. Swager, Macromolecules, 2011, 44, 976–980 CrossRef CAS.
- M. G. Rabbani, T. E. Reich, R. M. Kassab, K. T. Jackson and H. M. El-Kaderi, Chem. Commun., 2012, 48, 1141–1143 RSC.
- Y. J. Cho and H. B. Park, Macromol. Rapid Commun., 2011, 32, 579–586 CrossRef CAS PubMed.
- M. O. Sinnokrot, E. F. Valeev and C. D. Sherril, J. Am. Chem. Soc., 2002, 124, 10887–10893 CrossRef CAS PubMed.
- T. Chen, M. Li and J. Liu, Cryst. Growth Des., 2018, 18, 2765–2783 CrossRef CAS.
- C. G. Bezzu, M. Carta, M. C. Ferrari, J. C. Jansen, M. Monteleone, E. Esposito, A. Fuoco, K. Hart, T. P. Liyana-Arachchi, C. M. Colina and N. B. McKeown, J. Mater. Chem. A, 2018, 6, 10507–10514 RSC.
- A. Fuoco, B. Satilmis, T. Uyar, M. Monteleone, E. Esposito, C. Muzzi, E. Tocci, M. Longo, M. P. De Santo, M. Lanč, K. Friess, O. Vopička, P. Izák and J. C. Jansen, J. Membr. Sci., 2020, 594, 117460 CrossRef.
- F. M. Benedetti, Y.-C. M. Wu, S. Lin, Y. He, E. Flear, K. R. Storme, C. Liu, Y. Zhao, T. M. Swager and Z. P. Smith, JACS Au, 2022, 2, 1610–1615 CrossRef CAS PubMed.
- S. Lin, K. R. Storme, Y.-C. M. Wu, F. M. Benedetti, T. M. Swager and Z. P. Smith, J. Membr. Sci., 2023, 668, 121194 CrossRef CAS.
- R. Swaidan, X. Ma, E. Litwiller and I. Pinnau, J. Membr. Sci., 2013, 447, 387–394 CrossRef CAS.
- R. J. Swaidan, X. Ma and I. Pinnau, J. Membr. Sci., 2016, 520, 983–989 CrossRef CAS.
- A. Yerzhankyzy, B. S. Ghanem, Y. Wang, N. Alaslai and I. Pinnau, J. Membr. Sci., 2020, 595, 117512 CrossRef.
- S. Luo, J. Liu, H. Lin, B. A. Kazanowska, M. D. Hunckler, R. K. Roeder and R. Guo, J. Mater. Chem. A, 2016, 4, 17050–17062 RSC.
- S. Luo, Q. Zhang, L. Zhu, H. Lin, B. A. Kazanowska, C. M. Doherty, A. J. Hill, P. Gao and R. Guo, Chem. Mater., 2018, 30, 5322–5332 CrossRef CAS.
- X. Hu, W. H. Lee, J. Y. Bae, J. S. Kim, J. T. Jung, H. H. Wang, H. J. Park and Y. M. Lee, J. Membr. Sci., 2020, 612, 118437 CrossRef CAS.
- Z. P. Smith, D. F. Sanders, C. P. Ribeiro, R. Guo, B. D. Freeman, D. R. Paul, J. E. McGrath and S. Swinnea, J. Membr. Sci., 2012, 415–416, 558–567 CrossRef CAS.
- Z. Huang, C. Yin, T. Corrado, S. Li, Q. Zhang and R. Guo, Chem. Mater., 2022, 34, 2730–2742 CrossRef CAS.
- W. J. Koros and C. Zhang, Nat. Mater., 2017, 16, 289–297 CrossRef CAS PubMed.
- M. Rungta, G. B. Wenz, C. Zhang, L. Xu, W. Qiu, J. S. Adams and W. J. Koros, Carbon, 2017, 115, 237–248 CrossRef CAS.
- C. W. Jones and W. J. Koros, Carbon, 1994, 32, 1419–1425 CrossRef CAS.
- P. S. Tin, T. S. Chung, Y. Liu and R. Wang, Carbon, 2004, 42, 3123–3131 CrossRef CAS.
- O. Salinas, X. Ma, E. Litwiller and I. Pinnau, J. Membr. Sci., 2016, 500, 115–123 CrossRef CAS.
- O. Salinas, X. Ma, Y. Wang, Y. Han and I. Pinnau, RSC Adv., 2017, 7, 3265–3272 RSC.
- W. Ogieglo, T. Puspasari, A. Alabdulaaly, T. Phuong Nga Nguyen, Z. Lai and I. Pinnau, J. Membr. Sci., 2022, 652, 120497 CrossRef CAS.
- K. Hazazi, Y. Wang, N. M. S. Bettahalli, X. Ma, Y. Xia and I. Pinnau, J. Membr. Sci., 2022, 654, 120548 CrossRef CAS.
- F. Y. Li, Y. Xiao, Y. K. Ong and T. S. Chung, Adv. Energy Mater., 2012, 2, 1456–1466 CrossRef CAS.
- F. Y. Li and T. S. Chung, Int. J. Hydrogen Energy, 2013, 38, 9786–9793 CrossRef CAS.
- Q. Song, S. Cao, P. Zavala-Rivera, L. Ping Lu, W. Li, Y. Ji, S. A. Al-Muhtaseb, A. K. Cheetham and E. Sivaniah, Nat. Commun., 2013, 4, 1–9 Search PubMed.
- N. Du, M. M. Dal-Cin, G. P. Robertson and M. D. Guiver, Macromolecules, 2012, 45, 5134–5139 CrossRef CAS.
- F. Y. Li, Y. Xiao, T. S. Chung and S. Kawi, Macromolecules, 2012, 45, 1427–1437 CrossRef CAS.
- Q. Song, S. Cao, R. H. Pritchard, B. Ghalei, S. A. Al-Muhtaseb, E. M. Terentjev, A. K. Cheetham and E. Sivaniah, Nat. Commun., 2014, 5, 1–12 Search PubMed.
- X. Chen, Z. Zhang, L. Wu, X. Liu, S. Xu, J. E. Efome, X. Zhang and N. Li, ACS Appl. Polym. Mater., 2020, 2, 987–995 CrossRef CAS.
- P. Li, T. Zhang and L. Deng, Ind. Eng. Chem. Res., 2020, 59, 18640–18648 CrossRef.
- N. Du, M. M. D. Cin, I. Pinnau, A. Nicalek, G. P. Robertson and M. D. Guiver, Macromol. Rapid Commun., 2011, 32, 631–636 CrossRef CAS PubMed.
- M. M. Khan, G. Bengtson, S. Shishatskiy, B. N. Gacal, M. Mushfequr Rahman, S. Neumann, V. Filiz and V. Abetz, Eur. Polym. J., 2013, 49, 4157–4166 CrossRef CAS.
- C. Zhang, L. Fu, Z. Tian, B. Cao and P. Li, J. Membr. Sci., 2018, 556, 277–284 CrossRef CAS.
- M. Fang, Z. He, T. C. Merkel and Y. Okamoto, J. Mater. Chem. A, 2018, 6, 652–658 RSC.
- S. Luo, K. A. Stevens, J. S. Park, J. D. Moon, Q. Liu, B. D. Freeman and R. Guo, ACS Appl. Mater. Interfaces, 2016, 8, 2306–2317 CrossRef CAS PubMed.
- C. C. Hu, K. R. Lee, R. C. Ruaan, Y. C. Jean and J. Y. Lai, J. Membr. Sci., 2006, 274, 192–199 CrossRef CAS.
- J. Wu, J. Liu and T.-S. Chung, Adv. Sustain. Syst., 2018, 2, 1–10 CrossRef CAS.
- J. Liu, Y. Xiao, K. S. Liao and T.-S. Chung, J. Membr. Sci., 2017, 523, 92–102 CrossRef CAS.
- W. F. Yong, F. Y. Li, Y. C. Xiao, T.-S. Chung and Y. W. Tong, J. Membr. Sci., 2013, 443, 156–169 CrossRef CAS.
- W. F. Yong, F. Y. Li, T.-S. Chung and Y. W. Tong, J. Mater. Chem. A, 2013, 1, 13914–13925 RSC.
- L. Hao, P. Li and T.-S. Chung, J. Membr. Sci., 2014, 453, 614–623 CrossRef CAS.
- L. Hao, J. Zuo and T.-S. Chung, AIChE J., 2014, 60, 3848–3858 CrossRef CAS.
- W. F. Yong, Z. K. Lee and T.-S. Chung, ChemSusChem, 2016, 9, 1953–1962 CrossRef CAS PubMed.
- X. Mei Wu, Q. Gen Zhang, P. Ju Lin, Y. Qu, A. Mei Zhu and Q. Lin Liu, J. Membr. Sci., 2015, 493, 147–155 CrossRef.
- W. F. Yong, F. Y. Li, T. S. Chung and Y. W. Tong, J. Membr. Sci., 2014, 462, 119–130 CrossRef CAS.
- J. Sánchez-Laínez, B. Zornoza, M. Carta, R. Malpass-Evans, N. B. McKeown, C. Téllez and J. Coronas, Ind. Eng. Chem. Res., 2018, 57, 16909–16916 CrossRef.
- E. Esposito, I. Mazzei, M. Monteleone, A. Fuoco, M. Carta, N. B. McKeown, R. Malpass-Evans and J. C. Jansen, Polymers, 2019, 11, 1–14 Search PubMed.
- C. Zhang, R. P. Lively, K. Zhang, J. R. Johnson, O. Karvan and W. J. Koros, J. Phys. Chem. Lett., 2012, 3, 2130–2134 CrossRef CAS PubMed.
- X. Ma, R. J. Swaidan, Y. Wang, C. E. Hsiung, Y. Han and I. Pinnau, ACS Appl. Nano Mater., 2018, 1, 3541–3547 CrossRef CAS.
- J. Sánchez-Laínez, A. Pardillos-Ruiz, M. Carta, R. Malpass-Evans, N. B. McKeown, C. Téllez and J. Coronas, Sep. Purif. Technol., 2019, 224, 456–462 CrossRef.
- Q. Song, S. Cao, R. H. Pritchard, H. Qiblawey, E. M. Terentjev, A. K. Cheetham and E. Sivaniah, J. Mater. Chem. A, 2015, 4, 270–279 RSC.
- S. Xiong, C. Pan, G. Dai, C. Liu, Z. Tan, C. Chen, S. Yang, X. Ruan, J. Tang and G. Yu, J. Membr. Sci., 2022, 645, 120217 CrossRef CAS.
- L. Hao, K. S. Liao and T. S. Chung, J. Mater. Chem. A, 2015, 3, 17273–17281 RSC.
- X. Wu, W. Liu, H. Wu, X. Zong, L. Yang, Y. Wu, Y. Ren, C. Shi, S. Wang and Z. Jiang, J. Membr. Sci., 2018, 548, 309–318 CrossRef CAS.
- X. Wu, Y. Ren, G. Sui, G. Wang, G. Xu, L. Yang, Y. Wu, G. He, N. Nasir, H. Wu and Z. Jiang, AIChE J., 2020, 66, 1–10 Search PubMed.
- Y. Wang, Y. Ren, H. Wu, X. Wu, H. Yang, L. Yang, X. Wang, Y. Wu, Y. Liu and Z. Jiang, J. Membr. Sci., 2020, 602, 117970 CrossRef.
- J. Han, L. Bai, H. Jiang, S. Zeng, B. Yang, Y. Bai and X. Zhang, Ind. Eng. Chem. Res., 2021, 60, 593–603 CrossRef CAS.
- N. Tien-Binh, D. Rodrigue and S. Kaliaguine, J. Membr. Sci., 2018, 548, 429–438 CrossRef CAS.
- Z. Wang, H. Ren, S. Zhang, F. Zhang and J. Jin, J. Mater. Chem. A, 2017, 5, 10968–10977 RSC.
- G. Yu, X. Zou, L. Sun, B. Liu, Z. Wang, P. Zhang and G. Zhu, Adv. Mater., 2019, 31, 1–9 Search PubMed.
- N. Prasetya and B. P. Ladewig, J. Mater. Chem. A, 2019, 7, 15164–15172 RSC.
- P. F. Muldoon, S. R. Venna, D. W. Gidley, J. S. Baker, L. Zhu, Z. Tong, F. Xiang, D. P. Hopkinson, S. Yi, A. K. Sekizkardes and N. L. Rosi, ACS Mater. Lett., 2020, 2, 821–828 CrossRef CAS.
- C. Geng, Y. Sun, Z. Zhang, Z. Qiao and C. Zhong, ACS Sustainable Chem. Eng., 2022, 10, 3643–3650 CrossRef CAS.
- A. Husna, I. Hossain, I. Jeong and T. H. Kim, Polymers, 2022, 14, 655 CrossRef CAS PubMed.
- M. Khdhayyer, A. F. Bushell, P. M. Budd, M. P. Attfield, D. Jiang, A. D. Burrows, E. Esposito, P. Bernardo, M. Monteleone, A. Fuoco, G. Clarizia, F. Bazzarelli, A. Gordano and J. C. Jansen, Sep. Purif. Technol., 2019, 212, 545–554 CrossRef CAS.
- A. Sabetghadam, X. Liu, A. F. Orsi, M. M. Lozinska, T. Johnson, K. M. B. Jansen, P. A. Wright, M. Carta, N. B. McKeown, F. Kapteijn and J. Gascon, Chem. – Eur. J., 2018, 24, 12796–12800 CrossRef CAS PubMed.
- Y. Fan, C. Li, X. Zhang, X. Yang, X. Su, H. Ye and N. Li, J. Membr. Sci., 2019, 573, 359–369 CrossRef CAS.
- N. Prasetya and B. P. Ladewig, ACS Appl. Mater. Interfaces, 2018, 10, 34291–34301 CrossRef CAS PubMed.
- N. Tien-Binh, H. Vinh-Thang, X. Y. Chen, D. Rodrigue and S. Kaliaguine, J. Membr. Sci., 2016, 520, 941–950 CrossRef.
- Y. Pu, Z. Yang, V. Wee, Z. Wu, Z. Jiang and D. Zhao, J. Membr. Sci., 2022, 641, 119912 CrossRef CAS.
- W. F. Yong, K. H. A. Kwek, K. S. Liao and T. S. Chung, Polymer, 2015, 77, 377–386 CrossRef CAS.
- Y. Kinoshita, K. Wakimoto, A. H. Gibbons, A. P. Isfahani, H. Kusuda, E. Sivaniah and B. Ghalei, J. Membr. Sci., 2017, 539, 178–186 CrossRef CAS.
- M. M. Khan, V. Filiz, G. Bengtson, S. Shishatskiy, M. M. Rahman, J. Lillepaerg and V. Abetz, J. Membr. Sci., 2013, 436, 109–120 CrossRef CAS.
- H. Sun, W. Gao, Y. Zhang, X. Cao, S. Bao, P. Li, Z. Kang and Q. J. Niu, React. Funct. Polym., 2020, 147, 104465 CrossRef CAS.
- S. Kim, J. Hou, Y. Wang, R. Ou, G. P. Simon, J. G. Seong, Y. M. Lee and H. Wang, J. Mater. Chem. A, 2018, 6, 7668–7674 RSC.
- A. F. Bushell, P. M. Budd, M. P. Attfield, J. T. A. Jones, T. Hasell, A. I. Cooper, P. Bernardo, F. Bazzarelli, G. Clarizia and J. C. Jansen, Angew. Chem., Int. Ed., 2013, 52, 1253–1256 CrossRef CAS PubMed.
- G. Yu, Y. Li, Z. Wang, T. X. Liu, G. Zhu and X. Zou, J. Membr. Sci., 2019, 591, 117343 CrossRef.
- C. H. Lau, K. Konstas, C. M. Doherty, S. Kanehashi, B. Ozcelik, S. E. Kentish, A. J. Hill and M. R. Hill, Chem. Mater., 2015, 27, 4756–4762 CrossRef CAS.
- C. H. Lau, K. Konstas, A. W. Thornton, A. C. Y. Liu, S. Mudie, D. F. Kennedy, S. C. Howard, A. J. Hill and M. R. Hill, Angew. Chem., Int. Ed., 2015, 54, 2669–2673 CrossRef CAS PubMed.
- C. Zhang, B. Liu, G. Wang, G. Yu, X. Zou and G. Zhu, Chem. Commun., 2019, 55, 7101–7104 RSC.
- R. Hou, S. J. D. Smith, K. Konstas, C. M. Doherty, C. D. Easton, J. Park, H. Yoon, H. Wang, B. D. Freeman and M. R. Hill, J. Mater. Chem. A, 2022, 10, 10107–10119 RSC.
- A. Rohatgi, WebPlotDigitizer: Version 4.4 Search PubMed.
- Y. Wang, B. S. Ghanem, Z. Ali, K. Hazazi, Y. Han and I. Pinnau, Small Struct., 2021, 2, 2100049 CrossRef CAS.
- X. Ma, R. Swaidan, B. Teng, H. Tan, O. Salinas, E. Litwiller, Y. Han and I. Pinnau, Carbon, 2013, 62, 88–96 CrossRef CAS.
- P. Li, T. S. Chung and D. R. Paul, J. Membr. Sci., 2013, 432, 50–57 CrossRef CAS.
- W. S. Chi, B. J. Sundell, D. Harrigan and S. C. Hayden, ChemSusChem, 2019, 12, 2355–2360 CrossRef CAS PubMed.
- J. E. Bachman, Z. P. Smith, T. Li, T. Xu and J. R. Long, Nat. Mater., 2016, 15, 845–849 CrossRef CAS PubMed.
- Q. Qian, A. X. Wu, W. S. Chi, P. A. Asinger, S. Lin, A. Hypsher and Z. P. Smith, ACS Appl. Mater. Interfaces, 2019, 11, 31257–31269 CrossRef CAS PubMed.
- S. Shahid and K. Nijmeijer, J. Membr. Sci., 2014, 470, 166–177 CrossRef CAS.
- N. Jusoh, Y. F. Yeong, K. K. Lau and A. M. Shariff, J. Cleaner Prod., 2017, 149, 80–95 CrossRef CAS.
- B. Kraftschik and W. J. Koros, Macromolecules, 2013, 46, 6908–6921 CrossRef CAS.
- B. Kraftschik, W. J. Koros, J. R. Johnson and O. Karvan, J. Membr. Sci., 2013, 428, 608–619 CrossRef CAS.
- Z. Liu, Y. Liu, W. Qiu and W. J. Koros, Angew. Chem., Int. Ed., 2020, 59, 14877–14883 CrossRef CAS PubMed.
- A. Hayek, A. Alsamah, N. Alaslai, H. Maab, E. A. Qasem, R. H. Alhajry and N. M. Alyami, ACS Appl. Polym. Mater., 2020, 2, 2199–2210 CrossRef CAS.
- R. R. Tiwari, J. Jin, B. D. Freeman and D. R. Paul, J. Membr. Sci., 2017, 537, 362–371 CrossRef CAS.
- M. J. Mullins, D. Liu and H.-J. Sue, Thermosets, 2012, 28–61 CAS.
- I. Hossain, A. Z. Al Munsur and T.-H. Kim, Membranes, 2019, 9, 113–126 CrossRef CAS PubMed.
- P. Stanovsky, M. Karaszova, Z. Petrusova, M. Monteleone, J. C. Jansen, B. Comesaña-Gándara, N. B. McKeown and P. Izak, J. Membr. Sci., 2021, 618, 118694–118701 CrossRef CAS.
- I. Hossain, S. Y. Nam, C. Rizzuto, G. Barbieri, E. Tocci and T. H. Kim, J. Membr. Sci., 2019, 574, 270–281 CrossRef CAS.
- X. Ma, K. Li, Z. Zhu, H. Dong, J. Lv, Y. Wang, I. Pinnau, J. Li, B. Chen and Y. Han, J. Mater. Chem. A, 2021, 9, 18313–18322 RSC.
- Y. Weng, Q. Li, J. Li, Z. Gao, L. Zou and X. Ma, Sep. Purif. Technol., 2021, 279, 119681 CrossRef CAS.
- C. H. Lau, K. Konstas, C. M. Doherty, S. J. D. Smith, R. Hou, H. Wang, M. Carta, H. Yoon, J. Park, B. D. Freeman, R. Malpass-Evans, E. Lasseuguette, M. C. Ferrari, N. B. McKeown and M. R. Hill, Nanoscale, 2020, 12, 17405–17410 RSC.
- R. Darvishi and E. Pakizeh, Int. J. Polym. Sci., 2020, 2020, 1–12 CrossRef.
- A. Husna, I. Hossain, O. Choi, S. M. Lee and T. H. Kim, Macromol. Mater. Eng., 2021, 306, 1–12 CrossRef.
- W. Chen, Z. Zhang, C. Yang, J. Liu, H. Shen, K. Yang and Z. Wang, J. Membr. Sci., 2021, 636, 119581 CrossRef CAS.
- I. Hossain, S. Park, A. Husna, Y. Kim, H. Kim and T. H. Kim, ACS Appl. Mater. Interfaces, 2021, 13, 49890–49906 CrossRef CAS PubMed.
- L. Wang, X. Guo, F. Zhang and N. Li, J. Membr. Sci., 2021, 638, 119668 CrossRef CAS.
- X. Chen, Y. Fan, L. Wu, L. Zhang, D. Guan, C. Ma and N. Li, Nat. Commun., 2021, 12, 1–11 CrossRef CAS PubMed.
- J. Deng, Z. Huang, B. J. Sundell, D. J. Harrigan, S. A. Sharber, K. Zhang, R. Guo and M. Galizia, Polymer, 2021, 229, 123988 CrossRef CAS.
- D. S. Sholl and R. P. Lively, JACS Au, 2022, 2, 322–327 CrossRef CAS PubMed.
- N. Nemestóthy, P. Bakonyi, P. Lajtai-Szabó and K. Bélafi-Bakó, Membranes, 2020, 10, 1–10 CrossRef PubMed.
- J. T. Vaughn, D. J. Harrigan, B. J. Sundell, J. A. Lawrence and J. Yang, J. Membr. Sci., 2017, 522, 68–76 CrossRef CAS.
- Q. Liu, M. Galizia, K. L. Gleason, C. A. Scholes, D. R. Paul and B. D. Freeman, J. Membr. Sci., 2016, 514, 282–293 CrossRef CAS.
- S. Yates, R. Zaki, A. Arzadon, C. Liu and J. Chiou, US8016124B2, 2009.
- H. Lin, S. M. Thompson, A. Serbanescu-Martin, J. G. Wijmans, K. D. Amo, K. A. Lokhandwala and T. C. Merkel, J. Membr. Sci., 2012, 413–414, 70–81 CrossRef CAS.
- R. W. Baker and K. Lokhandwala, Ind. Eng. Chem. Res., 2008, 47, 2109–2121 CrossRef CAS.
- C. Y. Chuah, K. Goh, Y. Yang, H. Gong, W. Li, H. E. Karahan, M. D. Guiver, R. Wang and T. H. Bae, Chem. Rev., 2018, 118, 8655–8769 CrossRef CAS PubMed.
- Yadvika, Santosh, T. R. Sreekrishnan, S. Kohli and V. Rana, Bioresour. Technol., 2004, 95, 1–10 CrossRef CAS PubMed.
- R. W. Baker, B. Freeman, J. Kniep, Y. I. Huang and T. C. Merkel, Ind. Eng. Chem. Res., 2018, 57, 15963–15970 CrossRef CAS.
- C. Zhang, Y. Dai, J. R. Johnson, O. Karvan and W. J. Koros, J. Membr. Sci., 2012, 389, 34–42 CrossRef CAS.
- R. Swaidan, B. Ghanem and I. Pinnau, ACS Macro Lett., 2015, 4, 947–951 CrossRef CAS PubMed.
- Y. Liu, Z. Liu, A. Morisato, N. Bhuwania, D. Chinn and W. J. Koros, J. Membr. Sci., 2020, 601, 117910 CrossRef CAS.
- O. Vopička, M. G. De Angelis, N. Du, N. Li, M. D. Guiver and G. C. Sarti, J. Membr. Sci., 2014, 459, 264–276 CrossRef.
- E. S. Sanders, W. J. Koros, H. B. Hopfenberg and V. T. Stannett, J. Membr. Sci., 1983, 13, 161–174 CrossRef CAS.
- E. S. Sanders, W. J. Koros, H. B. Hopfenberg and V. T. Stannett, J. Membr. Sci., 1984, 18, 53–74 CrossRef CAS.
- G. Genduso, E. Litwiller, X. Ma, S. Zampini and I. Pinnau, J. Membr. Sci., 2019, 577, 195–204 CrossRef CAS.
- W. J. Koros, R. T. Chern, V. Stannett and H. B. Hopfenberg, J. Polym. Sci., Part A-2, 1981, 19, 1513–1530 CAS.
- E. Ricci and M. G. De Angelis, Membranes, 2019, 9, 1–26 CrossRef PubMed.
- M. G. De Angelis, G. C. Sarti and F. Doghieri, J. Membr. Sci., 2007, 289, 106–122 CrossRef CAS.
- M. Galizia, K. A. Stevens, Z. P. Smith, D. R. Paul and B. D. Freeman, Macromolecules, 2016, 49, 8768–8779 CrossRef.
- A. X. Wu, J. A. Drayton, X. Ren, K. Mizrahi Rodriguez, A. F. Grosz, J. W. Lee and Z. P. Smith, Macromolecules, 2021, 54, 6628–6638 CrossRef CAS.
- E. Ricci, M. Minelli and M. G. De Angelis, J. Membr. Sci., 2017, 539, 88–100 CrossRef CAS.
- H. D. Kamaruddin and W. J. Koros, J. Membr. Sci., 1997, 135, 147–159 CrossRef CAS.
- A. E. Gemeda, Ing. Chim. dell’ambiente e della Sicur., 2015, Ph. D., 139.
- R. D. Raharjo, B. D. Freeman, D. R. Paul, G. C. Sarti and E. S. Sanders, J. Membr. Sci., 2007, 306, 75–92 CrossRef CAS.
- E. S. Sanders and W. J. Koros, J. Polym. Sci., Part B: Polym. Phys., 1986, 24, 175–188 CrossRef CAS.
- C. P. Ribeiro and B. D. Freeman, Polymer, 2010, 51, 1156–1168 CrossRef CAS.
- E. Ricci, F. M. Benedetti, A. Noto, T. C. Merkel, J. Jin and M. G. De Angelis, Chem. Eng. J., 2021, 426, 130715 CrossRef CAS.
- Y. Lou, P. Hao and G. Lipscomb, J. Membr. Sci., 2014, 455, 247–253 CrossRef CAS.
- L. M. Robeson, M. E. Dose, B. D. Freeman and D. R. Paul, J. Membr. Sci., 2017, 525, 18–24 CrossRef CAS.
- A. Hayek, G. O. Yahaya, A. Alsamah and S. K. Panda, J. Appl. Polym. Sci., 2020, 137, 1–13 CrossRef.
- G. Liu, V. Chernikova, Y. Liu, K. Zhang, Y. Belmabkhout, O. Shekhah, C. Zhang, S. Yi, M. Eddaoudi and W. J. Koros, Nat. Mater., 2018, 17, 283–289 CrossRef CAS PubMed.
- G. Liu, A. Cadiau, Y. Liu, K. Adil, V. Chernikova, I. D. Carja, Y. Belmabkhout, M. Karunakaran, O. Shekhah, C. Zhang, A. K. Itta, S. Yi, M. Eddaoudi and W. J. Koros, Angew. Chem., Int. Ed., 2018, 57, 14811–14816 CrossRef CAS PubMed.
- Y. Liu, Z. Chen, W. Qiu, G. Liu, M. Eddaoudi and W. J. Koros, J. Membr. Sci., 2021, 627, 119201 CrossRef CAS.
- H. Dong, Z. Zhu, K. Li, Q. Li, W. Ji, B. He, J. Li and X. Ma, J. Membr. Sci., 2021, 635, 119440 CrossRef CAS.
- C. G. Bezzu, A. Fuoco, E. Esposito, M. Monteleone, M. Longo, J. Carolus Jansen, G. S. Nichol, N. B. Mckeown, C. G. Bezzu, G. S. Nichol, B. Mckeown, A. Fuoco, E. Esposito, M. Monteleone, M. Longo and J. C. Jansen, Adv. Funct. Mater., 2021, 31, 2104474 CrossRef CAS.
- A. W. Ameen, J. Ji, M. Tamaddondar, S. Moshenpour, A. B. Foster, X. Fan, P. M. Budd, D. Mattia and P. Gorgojo, J. Membr. Sci., 2021, 636, 119527 CrossRef CAS.
- Q. Song and E. Sivaniah, WO2015129925A1, 2015.
- J. Wu, T. S. Chung, S. Japip and T. S. Chung, J. Mater. Chem. A, 2020, 8, 6196–6209 RSC.
- M. Huang, K. Lu, Z. Wang, X. Bi, Y. Zhang and J. Jin, ACS Sustainable Chem. Eng., 2021, 9, 9426–9435 CrossRef CAS.
- J. Chen, M. Longo, A. Fuoco, E. Esposito, M. Monteleone, B. Comesaña Gándara, J. Carolus Jansen and N. B. McKeown, Angew. Chem., Int. Ed., 2023, 62, 1–9 Search PubMed.
- R. Swaidan, B. Ghanem, E. Litwiller and I. Pinnau, Macromolecules, 2015, 48, 6553–6561 CrossRef CAS.
- A. B. Foster, J. L. Beal, M. Tamaddondar, J. M. Luque-Alled, B. Robertson, M. Mathias, P. Gorgojo and P. M. Budd, J. Mater. Chem. A, 2021, 9, 21807–21823 RSC.
- W. Chen, Z. Zhang, L. Hou, C. Yang, H. Shen, K. Yang and Z. Wang, Sep. Purif. Technol., 2020, 250, 117198 CrossRef CAS.
- S. Cong, X. Feng, L. Guo, D. Peng, J. Wang, J. Chen, Y. Zhang, X. Shen and G. Yang, Adv. Sci., 2023, 3, 2–9 Search PubMed.
- S. Yi, B. Ghanem, Y. Liu, I. Pinnau and W. J. Koros, Sci. Adv., 2019, 5, 1–11 Search PubMed.
- S. V. Gutiérrez-Hernández, F. Pardo, A. B. Foster, P. Gorgojo, P. M. Budd, G. Zarca and A. Urtiaga, J. Membr. Sci., 2023, 675, 1–9 CrossRef.
- C. A. Scholes, G. Q. Chen, G. W. Stevens and S. E. Kentish, J. Membr. Sci., 2010, 346, 208–214 CrossRef CAS.
Footnote |
| † These authors contributed equally to this work and are co-first authors. |
| This journal is © The Royal Society of Chemistry 2024 |


