 Open Access Article
Predictive machine learning models trained on experimental datasets for electrochemical nitrogen reduction†
Darik A.
Rosser
ab,
Brianna R.
Farris
ab and
Kevin C.
Leonard
 *ab
*ab
aCenter for Environmentally Beneficial Catalysis, The University of Kansas, Lawrence, KS, USA
bDepartment of Chemical & Petroleum Engineering, The University of Kansas, Lawrence, KS, USA. E-mail: kcleonard@ku.edu; Tel: +1 785-864-1437
First published on 1st December 2023
Abstract
Obtaining useful insights from machine learning models trained on experimental datasets collected across different groups to improve the sustainability of chemical processes can be challenging due to the small size and heterogeneity of the dataset. Here we show that shallow learning models such as decision trees and random forest algorithms can be an effective tool for guiding experimental research in the sustainable chemistry field. This study trained four different machine learning algorithms (linear regression, decision tree, random forest, and multilayer perceptron) using different sized datasets containing up to 520 unique reaction conditions for the nitrogen reduction reaction (NRR) on heterogeneous electrocatalysts. Using the catalyst properties and experimental conditions as the features, we determined the ability of each model to regress the ammonia production rate and the faradaic efficiency. We observed that the shallow learning decision tree and random forest models had equal or better predictive power compared to the deep learning multilayer perceptron models and the simple linear regression models. Moreover, decision tree and random forest models enable the extraction of feature importance, which is a powerful tool in guiding experimental research. Analysis of the models showed the complex interaction between the applied potential and catalysts on the effective rate for the NRR. We also suggest some underexplored catalysts–electrolyte combinations to experimental researchers looking to improve both the rate and efficiency of the NRR reaction.
1 Introduction
As the chemical industry transitions to more sustainable feed-stocks, new discovery methods are needed to accelerate green chemistry initiatives. Traditional approaches for investigating chemical phenomena comprise empirical, experimental analysis, and/or computational approaches through density functional theory. These approaches rely heavily on human intuition and screening reaction systems for potential breakthroughs. Unfortunately, most interesting chemical systems have many process variables (e.g., temperature, pressure, solvents, catalysts, supports, and reactor configurations), leading to an innumerable set of possible experiments. Only a small fraction of the experimental space can be explored; thus, there is an open question on how predictive machine learning tools trained on experimental data can be used to augment traditional approaches in sustainable chemical reaction design.Machine learning is an essential tool for accelerating chemical research because it deconvolutes trends in higher dimensional spaces.1 The rise of machine learning-related publications in the fields of catalysis and sustainable chemistry indicates an eagerness to adopt new methods to predict catalyst performance.2–8 Moreover, the free availability of ready-to-use machine learning packages has made machine learning prevalent in varied fields, including medicine,9 material science,10 energy,11 food science12,13 and engineering.14,15 Despite this surge, large data sets still must be generated to train complex machine-learning algorithms. In the chemical field, this is being done by populating data-sets with density functional theory calculations to augment the search for new catalysts.15–19 However, training machine learning models on experimental data is very challenging because a central repository of experimental data does not exist. Currently, researchers are dependent on the large, non-uniform body of experimental work documented in the archival literature to train machine-learning algorithms.
Despite the challenges, the application of machine learning to experimental data sets is an exciting and growing field. Recently our group explored machine learning on the electrocatalytic reduction of CO2.20 This work focused on classification algorithms to predict product selectivity and determine feature importance; however, regression of reaction efficiency and/or rate has yet to be fully explored. One reaction pathway where regression machine learning models should be explored is the electrocatalytic nitrogen reduction reaction (NRR) to ammonia. The NRR is seen as a popular route for enabling the electrification of the ammonia industry and for utilizing water-derived hydrogen instead of fossil fuel-derived hydrogen.21 This interest has created a well-developed field of NRR research and provided some data for training machine learning models.
The electrocatalytic reduction of nitrogen into ammonia is particularly challenging for several reasons. First, the thermodynamic standard reduction potential is close to that of proton reduction to hydrogen, creating significant competition between the NRR and the hydrogen evolution reaction (HER).22 Moreover, the NRR may go through either a dissociative or associative mechanism that requires at least six proton-coupled electron transfer steps, which typically keep efficiencies low. Thus, the catalyst, electrolyte, and applied potential are all variables that can have convoluted effects on both the rate and the efficiency. Ultimately the low faradaic efficiencies and small reaction rates typical of NRR leave researchers uncertain about what direction to take research next.21
Our objective was to determine what insights off-the-shelf machine learning algorithms trained on experimental data sets reveal about the NRR, how these tools may be used in other fields, and how the accuracy scales with data availability. We also set out to both train a highly accurate model and also to describe how machine-learning algorithms compare to the most basic regression algorithm – linear regression. Specifically, we assessed how off-the-shelf shallow learning and deep learning algorithms trained on experimental data amassed from a wide range of groups and experimental conditions could predict the faradaic efficiency or the ammonia production rate when given the reactor operating conditions. Even though these are highly convoluted problems with relatively small and diverse data-sets, shallow learning algorithms could achieve coefficients of determination (R2) greater than 0.9. The shallow learning decision tree and random forest models performed as well as the deep learning multi-layer perceptron models, which makes it easier for experimental researchers to apply shallow models to adjacent fields. Decision tree and random forest models also discerned more complicated patterns with respect to feature importance, a step toward improving electrocatalytic NRR research.
2 Methods
2.1 Compiling the data set and data processing
The data set used in this study was human-curated and compiled from a review of 44 manuscripts for heterogeneous electrocatalytic NRR. The criteria for including a manuscript are as follows: the manuscript was published from a peer-reviewed journal, faradaic efficiency and reaction rate were reported with correlations to voltage and finally, the reference potential was reported. Some data points were removed from the original data set prior to the evaluation, either because the data point was missing vital information, or to ensure that the final data set could be 5-fold stratified based on source material. This means that only manuscripts that had five or more usable data points were included in the compiled data set. The compiled data set consists of 520 data points of different catalysts and reaction conditions. The reaction rate was divided by 10−8 mol cm−2 s−1 to provide a unitless rate for evaluating models. All floating-point features were scaled around a mean of 0 and standard deviation of unity to improve predictive power. The full data set is provided in the ESI.†2.2 Machine learning packages
Python within the Jupyter Notebook framework was used for all machine learning studies. The linear regression, decision tree and random forest algorithms were implemented using the Scikit-Learn machine learning libraries. Decision tree and random forest maximum depths were determined by plotting testing and training scores as a function of maximum depth using the validation set for training (ESI, Fig. S2a–d†). To obtain an acceptable prediction from regression decision trees a researcher must choose a balanced maximum depth; a tree that is too short suffers from low-continuity, whereas a tree that is too tall suffers from over-fitting. The Keras library, which is a user-friendly wrapper for TensorFlow, was used for all multi-layer perceptrons (MLPs). To ensure data-leakage through training and validation did not occur, 104 data points, stratified by their manuscript sources, were reserved as a validation set to tune hyper-parameters of decision trees, random forests and multilayer perceptrons. Tuning of the MLPs (i.e., determining the number of hidden layers and the number of perceptrons in each hidden layer) was performed using Keras's built-in tuning algorithm and the separate 104 point validation set.Model training was performed by splitting the remaining data with 80% in the training set and 20% in the testing set to produce single pass R2 scores. All MLPs were tuned and trained using 50 epochs. All models were trained using a mean squared error loss function. To further ensure the accuracy scores for the machine learning algorithms, 5-fold cross-validation was performed. The scores are calculated for each stratified testing set, and an average is taken to give the cross-validation score. Feature importance from the random forest regression models was calculated using SKLearn's built in function based on mean decrease in impurity.
The input features were one-hot encoded using Scikit-Learn built-in encoders so that all models are trained on comparable data-sets. For linear regression, decision tree and random forest models the label encoded results are also presented in the ESI, section S5.†
All source code for this study can be found in the ESI.†
3 Results and discussion
3.1 Model creation
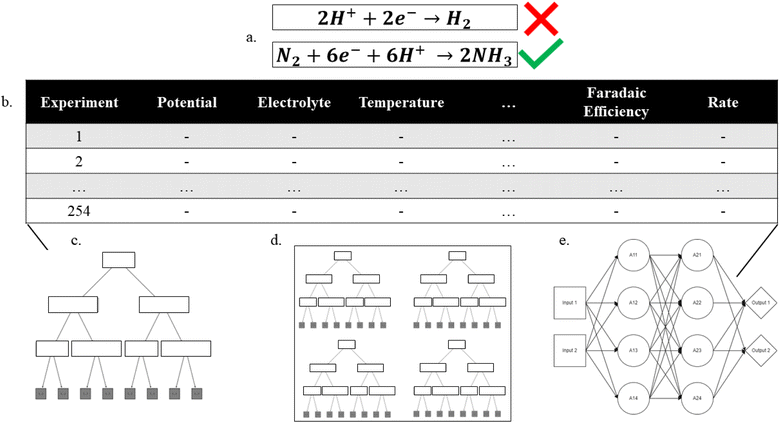
Evaluation of the experimental NRR literature revealed that while many researchers focus on either the catalyst and/or electrolyte, there are also large variations in the applied potential, the catalyst structure, and catalyst dopants, among other properties. During the literature review, ten properties were chosen based on their ability to describe the reaction parameters and catalyst. While potential and temperature were taken as floating-point values, most feature labels must be generalized to capture fundamental differences within the feature. The ten features include catalyst, catalyst element, electrode, support, dopant, microstructure, temperature, cell type, electrolyte, and protic vs. aprotic. All occurrences for each feature are shown in ESI, Table S1.† For example, each data point in the catalyst feature is the chemical species that directly interacts with N2, while the electrode feature indicates the surface that the catalyst was deposited on. The support feature indicates what material – if any – was used to aggregate catalyst particles, not including the electrode surface e.g. TiO2 supports. The dopant feature indicates binarily whether a dopant was added to the catalyst particles. The microstructure feature indicates what structure the catalyst particles formed (e.g., agglomerated, nano-particle, nano-sheet, nano-rod or nano-tube). The temperature and potential features are floating points measured in °C and volts vs. NHE, respectively. The cell type feature indicates if the experimental setup was a traditional 3-electrode system, a solid electrolyte system or a pressurized reaction system. Finally, the electrolyte feature indicates what the primary ionic species were, while the protic vs. aprotic feature indicates whether the experimental system used protic or aprotic solvents.Using our human-curated data set (Fig. 1), regression analyses were performed targeting either the faradaic efficiency or the NRR standardized rate. The efficiency decision tree had 197 nodes and a depth of 12, while the rate decision tree had 161 nodes and a depth of 12. The efficiency and rate random forest regressors both had max depths of 18 with 10 estimators for a total of 2734 and 4962 tunable parameters, respectively. The efficiency neural network used 97 nodes through 6 layers with relu activation functions and 3215 tunable parameters while the rate neural network used 25 nodes through 3 layers with relu activation functions and 1276 tunable parameters. The final layer of both neural networks had 1 node with a linear activation function. The number of tunable parameters for each model should be compared to the magnitude of the training set to show that it is reasonable in the context of the problem. The training set used 333 data points, and the most tuning parameters used were 4962 by the random forest predicting rate, approximately 15 tuning parameters for each training data point.
3.2 Model results
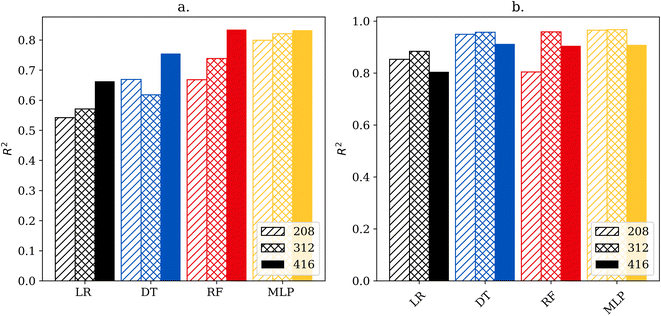
Fig. 2 shows the cross-validation scores of each model for regressing the faradaic efficiency towards ammonia and the rate of the NRR. Inspection of Fig. 2 shows some interesting trends. First, the simpler linear regression and decision tree models perform worse for predicting the efficiency compared to predicting the rate of the NRR. This suggests that the experimental factors that affect the efficiency are more complex than those that affect the rate. This is further supported by the fact that for all four models, increasing the size of the dataset improved performance for predicting efficiency, but dataset size had a more limited effect on predicting the NRR rate. For the highest data availability, the best-performing model for efficiency was the random forest model, and the best-performing model for rate was the decision tree with cross validated R2 scores of 0.835 and 0.913. Interestingly the MLP models were matched by many of the simpler models despite having access to more advanced tuning capabilities.3.3 Model robustness analysis
To evaluate the robustness of the models, 10 different randomly generated seeds were chosen and each model was re-trained and validated against the new training and testing sets. The results of all 10 random seeds were analyzed for discrepancies. The standard deviation of the R2 scores for each model are presented in ESI, Fig. S4a.† The highest cross-validated standard deviation was 0.0804 for MLPs predicting faradaic efficiency, indicating low variance between randomly selected seeds.Additionally, the averaged single pass testing and training R2 scores were analyzed to interpret the degree of over-fitting on each model, presented in ESI, Fig. S3b.† The most over-fit model was the MLP predicting the faradaic efficiency with 0.145 difference between training and testing coefficients of determination while the average difference was 0.107–an indication of some degree of over-fitting, especially in the decision trees and MLPs.
3.4 Data availability trends & model comparisons
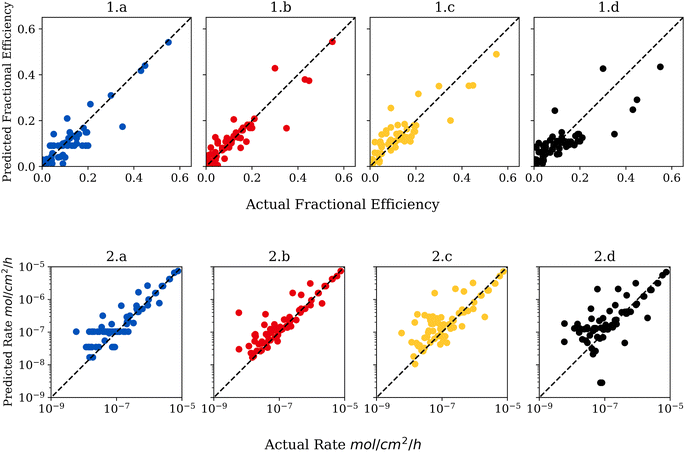
To demonstrate how the size of the dataset affects performance, each model was also trained and tested on sub-datasets of 208, 312 and 416 stratified data points. As shown in Fig. 2 model accuracy is strongly correlated to size when predicting efficiency, however, the correlation does not hold for rate predictions.Visualization of the regression model is shown in Fig. 3, which depicts a plot of actual versus predicted values. This type of data visualization can be used to identify outliers and poorly predicted points in the testing set. For a perfectly accurate prediction, the graphs would generate a line with a slope of 1. Points close to the diagonal line are predicted better than points far from the diagonal line. Points above the diagonal were predicted greater than reality, while the reverse is true for points below the diagonal. Outliers were determined via z-score of the absolute difference between predicted and actual values with a threshold of three standard deviations.
Interestingly, the same outlier exists in all models where the models are under-predicting the efficiency by one third. The outlying point had a faradaic efficiency of 0.35 while the random forest model predicted a faradaic efficiency of 0.11. The outlier is an experiment on Au single atom catalysts at −0.2 Volts NHE in aqueous Na2SO4 electrolyte.23 In the dataset, there is an identical experiment reported with an efficiency of 0.09, except that the Au catalyst is not atomically dispersed. In this case, the only difference is the microstructure–demonstrating the importance of how microstructure affects activity. This is an example of how machine learning can identify interesting experimental outliers that might be overlooked otherwise and help guide experimental research.
3.5 Feature importance
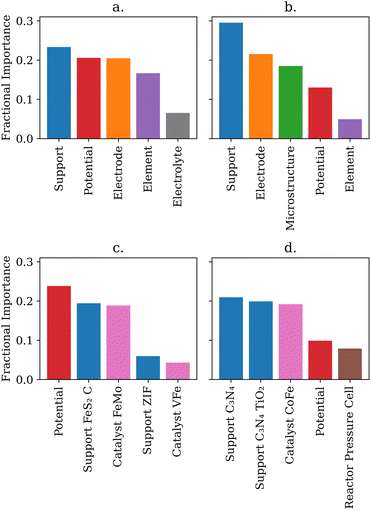
An advantage of the shallow-learning decision tree and random forest models is that researchers can obtain additional insights beyond the predictive power of the model. By analyzing how each tree in the random forest splits the dataset, it is possible to obtain the most important features of the data. Additionally, the one hot encoded feature importances can indicate which species are most important within each feature. The top five most important feature categories for predicting the efficiency and the rate are shown in Fig. 4.Intuitively, one may expect that the catalyst would be the most important feature for driving either the NRR rate or efficiency. However, the feature importance analysis showed support was the most important general feature, demonstrating the importance of catalyst–support interactions in the NRR. In addition, the applied potential was more important than the catalyst used for both parameters. This is an important finding because it provides guidance to experimental researchers in the NRR area to perform bulk electrolysis and rate determination measurements across a wide range of potentials to maximize the rate and efficiency performance. Fig. 4 also reflects trends researchers expect from NRR. Potential, element, and electrolyte are important to the random forest, mirroring the known HER competition at more negative potentials and adsorptive competition with protons from the electrolyte.21,24 Microstructure and cell type were important for predicting rate which corresponds to the known challenge of nitrogen diffusion and turnover.21,24
Comparing label encoded and one hot encoded feature importances shows that the catalyst feature had different fractional importance. Specific catalysts were highly important for predicitng both rate and efficiency, however random forests trained on label encoded data sets neglect the catalyst feature. Label encoding gave the catalysts randomly arranged integer values - essentially erasing the physical meaning of the value the random forests would read. In contrast, one hot encoding explicitly notes whether or not a catalyst was used in a given data point. Thus one hot encoding may preserve physically important information that label encoding blurs. This highlights how important selecting physically relevant features, and understanding how those features will be enumerated, is for a researcher applying machine learning models to catalysis.
3.6 Areas for exploration
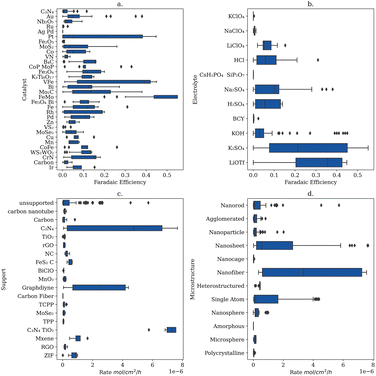
To explore the experimental space further based on the insights obtained from the feature importance studies, box and whisker plots were generated to inform future experimental approaches to resolving the low selectivity of the NRR (Fig. 5).From Fig. 5 FeMo and lithium trifluoromethanesulfonate (LiOTf) are the catalyst and electrolyte with the highest interquartile range for predicting NRR efficiency and could make a more efficient system when combined (Fig. 5a and b). To the best of our knowledge FeMo catalysts and LiOTf electrolytes have not been explored together. Additionally, C3N4 supports and nanofiber microstructures have the highest interquartile ranges for predicting the rate (Fig. 5c and d) and have been previously explored together.25 To the best of our knowledge the combination FeMo catalyst supported on C3N4 with nanofiber structures in LiOTf electrolyte has not been explored, and may yield both more efficient and higher yielding catalysts.
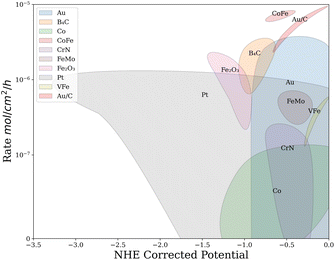
Finally, analysis of the feature importance from one hot encoded random forests showed that Au, CoFe, FeMo, VFe, CrN, B4C, Fe2O3 and Pt have an impact on the measured rate. The important catalysts were then highlighted on a plot of rate vs. potential as shown in Fig. 6. The clustering of important catalysts introduces new information to the researcher. For example, investigating the Au clustering at different potentials indicates that atomically dispersed gold on carbon support (Au/C) catalysts have higher NRR rates at less negative potentials compared to poly-crystalline Au catalysts. This analysis also shows that Co catalysts under-perform Au catalysts in the same potential range of (−0.75 V to −1.25 V vs. NHE) except for CoFe, which performs highly. These insights promote research into Au and CoFe based catalysts for electrocatalytic ammonia production.
4 Conclusions
Machine learning can be a valuable tool for experimental researchers, even when the experimental dataset is small and obtained across research groups. Interestingly, we showed that simpler shallow learning models such as decision trees and random forests match the precision of more complex artificial neural networks (ANNs) on small data sets. This should lower the barrier of entry for experimental researchers to use machine learning in their experimental analysis because shallow learning models are easier to use.Moreover, these shallow learning models can provide additional insights, including the most important features of the dataset, via analysis of the random forests models and the branch decision-making with decision trees. For the experimental researcher, understanding which experimental parameters have the largest effect is actually more important than the predictive power of a model that does not give feature importance. Our analysis uncovered specific combinations of applied potential in conjunction with the catalyst used to improve the rate of the NRR. Moreover, our analysis showed the combinations of FeMOcatalyst supported on C3N4 with nanofiber structures in LiOTf electrolyte have not been fully explored, which may be good avenues for experimentalists in this area to develop.
Author contributions
Darik Rosser: data curation, code development, writing and editing. Brianna Farris: code development, writing and editing. Kevin Leonard: principal investigator, code development, writing and editing.Conflicts of interest
There are no conflicts to declare.Acknowledgements
D. A. R. acknowledges funding from the Army Research Office under Award No. W911NF-22-1-0293. B. R. F. acknowledges support under the U.S. National Science NRT program through Award No. DGE-1922649.Notes and references
- M. I. Jordan and T. M. Mitchell, Science, 2015, 349, 255–260 CrossRef CAS PubMed.
- S. Kito, T. Hattori and Y. Murakami, Applied Catalysts A, 1994, 173–178 CrossRef.
- R. Palkovits and S. Palkovits, ACS Catal., 2019, 9, 8383–8387 CrossRef CAS.
- J. M. Serra, A. Corma, A. Chica, E. Argente and V. Botti, Catal. Today, 2003, 81, 393–403 CrossRef CAS.
- A. J. Chowdhury, W. Yang, K. E. Abdelfatah, M. Zare, A. Heyden and G. A. Terejanu, J. Chem. Theory Comput., 2020, 16, 1105–1114 CrossRef CAS PubMed.
- M. Holena and M. Baerns, Catal. Today, 2003, 81, 485–494 CrossRef CAS.
- A. L. Job, S. M. Stratton, C. E. Umhey, K. A. Hoo and S. G. Wettstein, ACS Sustainable Chem. Eng., 2022, 10, 177–181 CrossRef CAS.
- R. Ding, Y. Chen, Z. Rui, K. Hua, Y. Wu, X. Li, X. Duan, J. Li, X. Wang and J. Liu, J. Power Sources, 2023, 556, 232389 CrossRef CAS.
- J. Khan, J. S. Wei, M. Ringner, L. H. Saal, M. Ladanyi, F. Westermann, F. Berthold, M. Schwab, C. R. Antonescu, C. Peterson and P. S. Meltzer, Nat. Med., 2001, 7, 673–679 CrossRef CAS PubMed.
- R. Ramprasad, R. Batra, G. Pilania, A. Mannodi-Kanakkithodi and C. Kim, npj Comput. Mater., 2017, 3, 54 CrossRef.
- D. Liu, M. Chen, X. Du, H. Ai, K. H. Lo, S. Wang, S. Chen, G. Xing, X. Wang, H. Pan, D. Liu, M. Chen, S. Wang, S. Chen, G. Xing, H. Pan, X. Du, H. Ai, K. H. Lo and X. Wang, Adv. Funct. Mater., 2021, 31, 2008938 Search PubMed.
- W. Liao, J. Shen, S. Manickam, S. Li, Y. Tao, D. Li, D. Liu and Y. Han, Food Chem., 2023, 405, 134982 CrossRef CAS PubMed.
- F. Deng, H. Lu, Y. Yuan, H. Chen, Q. Li, L. Wang, Y. Tao, W. Zhou, H. Cheng, Y. Chen, X. Lei, G. Li, M. Li and W. Ren, Food Chem., 2023, 407, 135176 CrossRef CAS PubMed.
- H. Peng and X. Ling, Appl. Therm. Eng., 2008, 28, 642–650 CrossRef CAS.
- B. R. Goldsmith, J. Esterhuizen, J.-X. Lin, C. J. Bartel and C. Sutton, AIChE J., 2018, 64, 2311–2323 CrossRef CAS.
- R. Jinnouchi and R. Asahi, J. Phys. Chem. Lett., 2017, 8, 4279–4283 CrossRef CAS PubMed.
- H. Zhai and A. Alexandrova, J. Chem. Theory Comput., 2016, 12, 6213–6226 CrossRef CAS PubMed.
- C. Deng, Y. Su, F. Li, W. Shen, Z. Chen and Q. Tang, J. Mater. Chem. A, 2020, 8, 24563–24571 RSC.
- T. Toyao, K. Suzuki, S. Kikuchi, S. Takakusagi, K.-i. Shimizu and I. Takigawa, J. Phys. Chem. C, 2018, 122, 8315–8326 CrossRef CAS.
- B. R. Farris, T. Niang-Trost, M. S. Branicky and K. C. Leonard, ACS Sustainable Chem. Eng., 2022, 2022, 10934–10944 CrossRef.
- I. Garagounis, A. Vourros, D. Stoukides, D. Dasopoulos and M. Stoukides, Membranes, 2019, 9, 9090112 CrossRef PubMed.
- A. R. Singh, B. A. Rohr, J. A. Schwalbe, M. Cargnello, K. Chan, T. F. Jaramillo, I. Chorkendorff and J. K. Norskov, ACS Catal., 2017, 7, 706–709 CrossRef CAS.
- D. Chen, M. Luo, S. Ning, J. Lan, W. Peng, Y. Lu, T. Chan and Y. Tan, Small, 2022, 18, 2104043 CrossRef CAS PubMed.
- Y. H. Moon, N. Y. Kim, S. M. Kim and Y. J. Jang, Catalysts, 2022, 12, 1015 CrossRef CAS.
- X. Wu, L. Tang, Y. Si, C. Ma, P. Zhang, J. Yu, Y. Liu and B. Ding, Energy Environ. Mater., 2023, 6, e12316 CrossRef CAS.
Footnote |
| † Electronic supplementary information (ESI) available. See DOI: https://doi.org/10.1039/d3dd00151b |
| This journal is © The Royal Society of Chemistry 2024 |

