 Open Access Article
A machine learning approach toward generating the focused molecule library targeting CAG repeat DNA†
Qingwen
Chen
 a,
Takeshi
Yamada‡
 a,
Asako
Murata§
 a,
Ayako
Sugai
a,
Yasuyuki
Matsushita
a,
Ayako
Sugai
a,
Yasuyuki
Matsushita
 b and
Kazuhiko
Nakatani
 *a
*a
aSANKEN (The Institute of Scientific and Industrial Research), Osaka University, 8-1 Mihogaoka, Ibaraki 567-0047, Japan. E-mail: nakatani@sanken.osaka-u.ac.jp
bGraduate School of Information Science and Technology, Osaka University, 1-5 Yamadaoka, Suita 565-0871, Japan. E-mail: yasumat@ist.osaka-u.ac.jp
First published on 2nd January 2024
Abstract
This study reports a machine learning-based classification approach with surface plasmon resonance (SPR) labeled data to generate a focused molecule library targeting CAG repeat DNA. By using an SPR screening and a machine learning classification model, we can improve the identification process of elucidating new hit compounds for the next round of wet lab experiments. The reported model increased the probability of hits from 5.2% to 20.6% in a focused molecule library with 92.9% correct hit classification (recall) and 99.3% precision for the non-hit class.
In drug discovery, there has been a surge of interest in small molecules targeting DNAs and RNAs. These small molecules could be drug leads and molecular probes to study the pathological process of various diseases,1–5 for example, the trinucleotide repeat disorders6 caused by the aberrant expansion of 5′-CNG-3′ (where N = A, C, G, or T).7,8 Our laboratory developed various small molecule ligands targeting those trinucleotide repeat sequences.9 Among them, naphthyridine-azaquinolone (NA, the chemical structure is in Fig. S1, ESI†) strongly bound to the CAG repeat DNA.10 In 2020, we reported that NA induced CAG repeat contraction in Huntington's disease (HD) patient cells and an HD mice model.11 Although these results strongly motivated further exploratory studies of small molecules binding to CAG repeat DNA, developing such small molecule ligands by molecular design has been challenging due to the significant conformational variations of both ligands and the targets.12
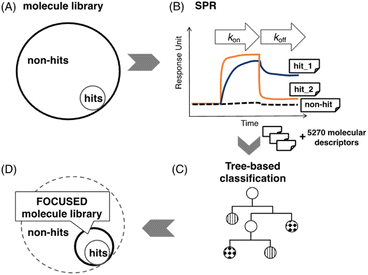
Screening would be another promising approach to finding small molecule candidates. Many screening methods have been reported for small molecules binding to specific structural motifs in nucleic acids.13 We have studied a screening method using fluorescent indicator displacement14 and surface plasmon resonance (SPR).15 Generally, the number of hits (small molecules binding to the targets) in a molecule library is much less than non-hits (Fig. 1A). Therefore, screening a large-scale library is cost-ineffective.
A focused molecule library is a smaller library that contains a higher ratio of potential hits. It would significantly reduce screening time, cost, and labor in screening if it could be generated with high credibility. Here, we report a machine learning (ML) assisted protocol of a focused molecule library targeting CAG repeat DNA by combining the SPR assay and machine learning classification (Fig. 1). SPR assay provides high-quality binding data and can be useful to generate ground truth labels in an ML task. Fig. 1B shows three typical SPR signals of the ligand's interaction with immobilized targets. After the labeling, those labeled samples will be used to train a classification model (Fig. 1C) and generate a focused molecule library, as shown in Fig. 1D. The method in detail could be found in MATERIALS AND METHODS, machine learning in the ESI.†
ML-based computational methods are revolutionizing drug discovery in diverse applications. Alphafold,16 a prime example, excels in predicting protein folding with high precision, thereby expanding the range of potential protein studies. Another success case is in retrosynthesis,17,18 aiding the efficient synthesis of complex natural products and important compounds. Moreover, ML is instrumental in the drug discovery screening phase, such as pharmacophore-based ML virtual screening,19 which pinpoints potential drugs by analyzing molecular substructures, premised on the idea that similar structures could have similar properties.20 Deep learning is powerful in analyzing molecular complexities through its advanced neural network layers,21,22 while it generally needs more data to optimize the model efficiently23 and a hard “black box” problem.24 Thus, the classic ML algorithms are preferred in our study with a medium size dataset. In addition, insufficient high-quality experimental data and label imbalance could dramatically decrease prediction accuracy when deploying ML. In this paper, we develop an ML-based approach to obtain a fair prediction in screening by mitigating these two common issues.
First, a molecule library containing 2000 compounds was screened by SPR assay to collect high-quality data and identify their ground truth labels. In the SPR assay, 5′-biotinylated d(CAG)40 DNA was immobilized on a streptavidin (SA) sensor chip. Then, each compound was injected at 50 μM onto the sensor chip to study the interaction with d(CAG)40 DNAs. The hit compounds were selected based on their response values within a specific range of sensorgrams obtained from each compound. Among the 2000 compounds screened, 104 with an RU value of basically 20 or higher were identified as hits, and the remaining 1896 compounds as non-hits, most of which showed nearly zero RU values (Fig. S2, ESI†). Separately, the binding profiles of these hit compounds were visually confirmed. The proportion of hits and non-hits in the dataset was approximately 1![[thin space (1/6-em)]](https://www.rsc.org/images/entities/char_2009.gif) :
:![[thin space (1/6-em)]](https://www.rsc.org/images/entities/char_2009.gif) 19, and the hit ratio was 5.2%. Then, molecular descriptors25 were generated by transforming the chemical structures to numerical values using Dragon 7.0 software26 for each molecule. The 5270 descriptors classified into 30 categories (shown in Table S1, ESI†) were computed, including atom types, functional groups, geometrical descriptions, and properties.
19, and the hit ratio was 5.2%. Then, molecular descriptors25 were generated by transforming the chemical structures to numerical values using Dragon 7.0 software26 for each molecule. The 5270 descriptors classified into 30 categories (shown in Table S1, ESI†) were computed, including atom types, functional groups, geometrical descriptions, and properties.
A random forest (abbreviated as RF for clarity in the later sentence) algorithm,27 one of the supervised learning methods, was used in this study. The RF algorithm consists of several weak (simple) classifiers to improve the prediction by the ensemble. It has been shown to work well with a limited amount of training data in a classification task.28 We used the RF algorithm implemented in the scikit-learn package (version: 1.1.1);29 the hyperparameters “num_tree” of 300 and “max_depth” of 300 were used in the classification. A comparative tree-based algorithm, XGBoost30 (implemented using Scikit-learn 1.1.1 and xgboost 1.6.2), was conducted to evaluate its performance against the RF algorithm.
All 2000 samples were used in the initial trial with a train–test ratio of 8![[thin space (1/6-em)]](https://www.rsc.org/images/entities/char_2009.gif) :
:![[thin space (1/6-em)]](https://www.rsc.org/images/entities/char_2009.gif) 2 (1600
2 (1600![[thin space (1/6-em)]](https://www.rsc.org/images/entities/char_2009.gif) :
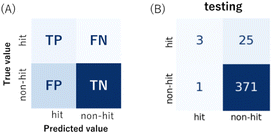
:![[thin space (1/6-em)]](https://www.rsc.org/images/entities/char_2009.gif) 400, Fig. S3, ESI†). There were 76 hits and 1524 non-hits in the training dataset (Fig. S3A, ESI†). As a result, only 3 hits were correctly predicted (true positive: TP) by the trained model from the entire 28 hits in the testing dataset (Fig. 2B and S3C†), the recall (eqn (1)) of the hit class was 0.11 (3/(3 + 25)) with a precision (eqn (2)) of 0.75 (3/(3 + 1)) (Table S2†), which showed a tendency to predict most hits as non-hits. One plausible reason was that the feature of the major non-hit class was overlearned because the proportion of the minority hit class in the training dataset was only 4.8% (76/1600), which was severely imbalanced (Fig. S3A, ESI†).
400, Fig. S3, ESI†). There were 76 hits and 1524 non-hits in the training dataset (Fig. S3A, ESI†). As a result, only 3 hits were correctly predicted (true positive: TP) by the trained model from the entire 28 hits in the testing dataset (Fig. 2B and S3C†), the recall (eqn (1)) of the hit class was 0.11 (3/(3 + 25)) with a precision (eqn (2)) of 0.75 (3/(3 + 1)) (Table S2†), which showed a tendency to predict most hits as non-hits. One plausible reason was that the feature of the major non-hit class was overlearned because the proportion of the minority hit class in the training dataset was only 4.8% (76/1600), which was severely imbalanced (Fig. S3A, ESI†).
 | (1) |
 | (2) |
 | (3) |
 | (4) |
To achieve higher prediction performance of the trained model, we applied down-sampling to remove partial samples in the majority of non-hit classes in the training dataset for a better data balance. The number of dropped non-hits was studied by changing the values to 1200, 1300, 1400, 1450, 1475, and 1485, as shown in Table S3 in the ESI.† We used the recall and precision values as the primary and secondary indices to evaluate the model. The accuracy (ACC, eqn (4)) is commonly used for evaluating models, but it may need to be revised for imbalanced datasets. A high-quality, focused molecule library should minimize false negative (FN) values while maximizing recall (Fig. 2 as shown above). In other words, it should accurately identify as many hits as possible while minimizing the number of misses. Besides, F1 values (eqn (3)) were used to analyze the precision and recall trade-offs. After the training with 6 different hit/non-hit proportions, entry 4 (76 hits and 74 non-hits as shown in Fig. 3A, left) was the most relevant result considering the average recall of 0.75 (highest 0.86) and F1 value of 0.16 (highest 0.21) (Tables 1 and S3, entry 4 in the ESI†). The chemical structures of 20 predicted hits (TP) searched by the highest precision in one prediction case were placed in Appendix A in the ESI.† The average values were calculated by removing the five top and bottom values from 100 independent experiments, where a certain number of non-hits from the training dataset were randomly removed. While we modified the balance of hits and non-hits in the training data set, the original imbalanced testing dataset with 28 hits and 372 non-hits was used as a screening library (Fig. 3A). The results shown in entries 5 and 6 have higher average recall of 0.89 and 0.94, while the precision worsens. The confusion matrices in Fig. 3B illustrate the predicted and true values' counts in a random forest model for entry 4. The two matrices represent the classification that gave the highest recall and precision of the hit class, respectively. Under these optimal conditions found for the RF model, an XGBoost model applied to the same training and testing dataset provided almost the same scores in the average, but a better result in the highest recall of 0.93 (cf. 0.86 for the RF classifier) (Fig. 3C and Table 1).
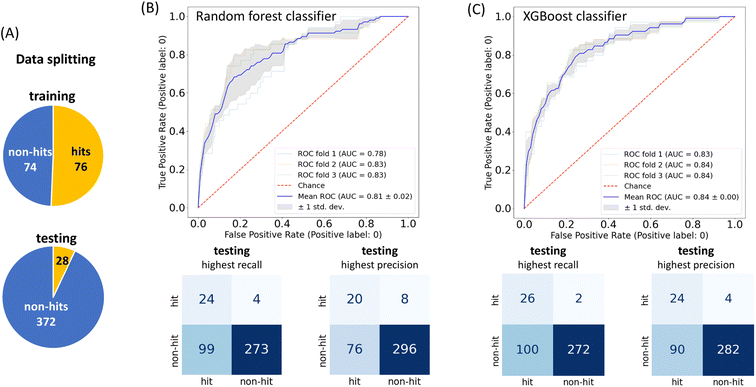 | ||
| Fig. 3 (A) The training (left) data proportion with the down-sampling adjustment shown in Table S3, entry 4 in the ESI;† the testing (bottom) data proportion without adjustment; model performance by the receiver operating characteristic (ROC) curve with 3-fold cross-validation and the confusion matrix on the testing dataset. The confusion matrix with the highest recall (left), according to this highest recall and the highest precision (right) of the (B) RF classifier and (C) XGBoost classifier. According to the highest recall recorded with the XGBoost classifier, the true hit ratio could improve from 5.2% (104/2000 compounds from SPR data) to 20.6% (26/126) in the hit class. | ||
| Classification scores of hits | Recall | Precision | F1 | |
|---|---|---|---|---|
| a Average scores obtained from 100 recorded prediction scores where the non-hits removed in each replicate experiment differed. The five top and bottom values were excluded from the calculation. b Highest scores obtained from 100 recorded prediction scores where the non-hits removed in each replicate experiment differed. | ||||
| Random forest | Averagea | 0.75 | 0.15 | 0.26 |
| Highestb | 0.86 | 0.21 | 0.33 | |
| XGBoost | Averagea | 0.76 | 0.16 | 0.26 |
| Highestb | 0.93 | 0.21 | 0.34 | |
A receiver operating characteristic (ROC) plot is used to visualize the true positive rate against the false positive rate at various thresholds for classifier performance monitoring. A higher-performance model will reflect the curves far from the diagonal line towards the top left, where the area under the curve (AUC) approaches 1. The ROC curves in our study for the hit class are shown in Fig. 3B and C, where in an RF model there is a notable upward bulge towards the left with an average AUC value of 0.81 (the results of the other 5 proportions are shown in Fig. S4A–F, ESI†). An XGBoost model shows a slightly better average AUC value of 0.84. These evaluations suggest that both RF and XGBoost models were trained and could outperform a random guess in terms of their predictive capabilities.
The over-sampling was attempted in the RF forest model, which is another sampling method and offsets the limitation of features lost during down-sampling. The idea of over-sampling is to balance the minority class proportion using synthetic or resampled data. Here SMOTE-NC (SMOTE: Synthetic Minority Over-sampling Technique; NC: Nominal and Continuous)31 was applied to augment the training dataset's categorical and continuous data. SMOTE31 utilizes the k-nearest neighbour algorithm in data generation, and SMOTE-NC resamples the categorical data instead of making new data (Appendix B, ESI† shows the list of categorical features in this study). Like the previous experiment, we conducted 100 independent experiments in dropping 1200, 1300, and 1400 non-hits to find the best result, using the RF classification model. As shown in Table S4 and Fig. S5,† even though there were no discernibly improved results on the combination of oversampling in training, entry 2 shows a relatively high precision of predictive hits of 0.37 when the recall is 0.71 (Fig. S5B,† highest precision).
Next, we tried to clarify the essential features of hits in our model by computing the importance of each molecular descriptor. The contribution of each descriptor could be measured by the SHapley Additive exPlanations (SHAP)32 value and the Gini index from the RF algorithm.33 SHAP is a useful measure to provide model explainability based on cooperative game theory, which considers the influence of different feature combinations. Fig. 4 shows the top 20 features that have the highest SHAP values. The SHAP value was implemented by the SHAP package (version: 0.41.0). And we further computed the sum of those SHAP values from 100 independent predictions on the optimal hit/non-hit numbers of 76![[thin space (1/6-em)]](https://www.rsc.org/images/entities/char_2009.gif) :
:![[thin space (1/6-em)]](https://www.rsc.org/images/entities/char_2009.gif) 74. As a result, several kinds of molecular descriptors frequently appeared on top of the ranking: walk and path counts (piPC05-10),34 where descriptor piPC09 ranked top. The descriptor piPC09 is a molecular geometrical feature belonging to the second level of general descriptor categories and graph theory/topological indices.24 It describes the molecule size and shape, with the information on bond order. The “09” indicates the values given by the path at the length of 9. In general, a molecule with a high path count of 9 is likely to be complex and large, with many branches and cycles in its structure. In our classification results, the predicted hits tend to have intensive distribution on higher piPC06/08/09 feature values, as shown in the beeswarm plot in Fig. S6B, ESI† (the beeswarm plot could illustrate the distribution of each feature and sample; more details can be found in the ESI†). In conclusion, molecules targeting CAG repeat DNA tend to be larger and more complex. In addition, 3D MoRSE (Mor15e/i/p/s/u and Mor12i/m/p/v),35 connectivity indices36 (X5Av) and Burden eigenvalues37 (SpDiam_B(e/i) and SpMin_Bh(v)) was also found in higher importance ranking. For a quantitative support of those top-ranked features, the Gini index is used, which measures feature importance according to the purity of split subsets and is different from the SHAP value (Fig. S7, ESI†). Those features overlap in both rankings, indicating that molecule size, molecular complexity, symmetry, and polarity are essential in classifying hit molecules targeting CAG trinucleotide repeats. Some properties selected to compare the two classes by a boxplot can be found in Fig. S10 and S11 in the ESI.†
74. As a result, several kinds of molecular descriptors frequently appeared on top of the ranking: walk and path counts (piPC05-10),34 where descriptor piPC09 ranked top. The descriptor piPC09 is a molecular geometrical feature belonging to the second level of general descriptor categories and graph theory/topological indices.24 It describes the molecule size and shape, with the information on bond order. The “09” indicates the values given by the path at the length of 9. In general, a molecule with a high path count of 9 is likely to be complex and large, with many branches and cycles in its structure. In our classification results, the predicted hits tend to have intensive distribution on higher piPC06/08/09 feature values, as shown in the beeswarm plot in Fig. S6B, ESI† (the beeswarm plot could illustrate the distribution of each feature and sample; more details can be found in the ESI†). In conclusion, molecules targeting CAG repeat DNA tend to be larger and more complex. In addition, 3D MoRSE (Mor15e/i/p/s/u and Mor12i/m/p/v),35 connectivity indices36 (X5Av) and Burden eigenvalues37 (SpDiam_B(e/i) and SpMin_Bh(v)) was also found in higher importance ranking. For a quantitative support of those top-ranked features, the Gini index is used, which measures feature importance according to the purity of split subsets and is different from the SHAP value (Fig. S7, ESI†). Those features overlap in both rankings, indicating that molecule size, molecular complexity, symmetry, and polarity are essential in classifying hit molecules targeting CAG trinucleotide repeats. Some properties selected to compare the two classes by a boxplot can be found in Fig. S10 and S11 in the ESI.†
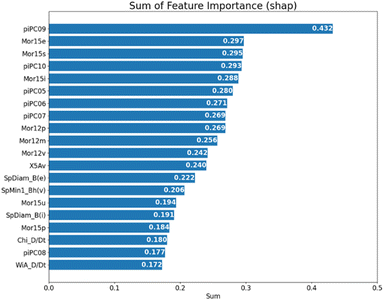 | ||
Fig. 4 The 20 highest SHAP-based feature rankings; each SHAP value shown in the figure is the sum of 100 independent experiments with the hit/non-hit ratio of 76![[thin space (1/6-em)]](https://www.rsc.org/images/entities/char_2009.gif) : :![[thin space (1/6-em)]](https://www.rsc.org/images/entities/char_2009.gif) 74 shown in Fig. 3A. 74 shown in Fig. 3A. | ||
To gain a deeper understanding of how these features impact the classification process, we trained the RF model without the top 10 and 20 features among a total of 5270 on the same testing dataset for comparison. The classification scores of the hit class in Table S5† showed slight decreases in all indices, suggesting that these top-ranked features influence the model performance only weakly. Considering the complexity and the number of features we used for the classification, we speculated that the information encapsulated by the removed top-ranked features might be redundant and can be captured by a combination of the remaining features.
Finally, we used UMAP (Uniform Manifold Approximation and Projection)38 for dimensionality reduction to illustrate a spatial distribution of hit compounds with the top 20 features, where the hit compounds are represented as red dots, showing that hit compounds were somewhat clustered towards the right side, but the observed pattern did not show a distinct separation of the clusters of the hit from the non-hit compounds. These results supported the observation that the impact of the removal of top-ranked features was not significant in our studies, and that there are possibilities to improve classification by adjusting the labelling method and including some new molecular features. The current labelling method is only focused on the response strength and, therefore, we may fail to capture other important features, such as the signal shape representing the binding thermodynamics and kinetics. The exploration of new molecular features would be of particular interest, although such features may depend on the target (Fig. 5).
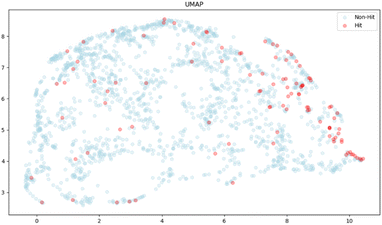 | ||
| Fig. 5 Two-dimensional UMAP visualization of 2000 molecules with the top 20 features obtained from the RF model. Red and blue dots represent 104 hits and 1896 non-hits, respectively. | ||
In summary, we evaluated an ML-based approach to generate a focused library for small molecules targeting CAG repeat DNA from a limited and severely imbalanced SPR assay labeled dataset. In this study, we compared two widely used tree-based classification models: random forest and XGBoost. A slightly better performance was obtained for XGBoost, showing a recovery of 92.9% (26/28) of hits, while 73.1% (272/372) of non-hits were correctly identified as true negatives. This result makes it possible to efficiently remove the predicted negative samples from wet experiments in future applications. The highest precision of excluded negative samples in our trial was 99.3% (272/274). Theoretically, it is possible to enhance the probability of hits from 5.2% (104/2000 compounds by SPR experiments) in an original molecule library to 20.6% (26/126 compounds) in the hit class obtained in XGBoost classification, which represents the focused library. This report serves as a preliminary investigation, paving the way for future research to delve deeper into the characteristics of hit features. It also aims to enhance model development for in silico drug discovery and hit identification, offering a foundation for the next studies in this field.
Data availability
The dataset and scripts are available in a public repository as follows: https://github.com/chen26sanken/Machine-learning-approach-toward-generating-the-focused-molecule-library-targeting-CAG-repeat-DNA.Conflicts of interest
There are no conflicts to declare.Notes and references
- M. Waring, DNA-targeting Molecules as Therapeutic Agents, Royal Society of Chemistry, 2018 Search PubMed.
- S. Haider, G. Parkinson, M. Read and S. Neidle, DNA and RNA Binders, Wiley-VCH, 2004, pp. 337–359 Search PubMed.
- M. Disney, J. Am. Chem. Soc., 2019, 141, 6776–6790 CrossRef CAS PubMed.
- M. Wang, Y. Yu, C. Liang, A. Lu and G. Zhang, Int. J. Mol. Sci., 2016, 17, 779 CrossRef PubMed.
- M. Disney, B. Dwyer and J. Childs-Disney, Cold Spring Harbor Perspect. Biol., 2018, 10, a034769 CrossRef CAS PubMed.
- A. Verma, E. Khan, S. Bhagwat and A. Kumar, Mol. Neurobiol., 2020, 57, 566–584 CrossRef CAS PubMed.
- S. Mirkin, Nature, 2007, 447, 932–940 CrossRef CAS PubMed.
- A. Gacy, G. Goellner, N. Juranić, S. Macura and C. McMurray, Cell, 1995, 81, 533–540 CrossRef CAS PubMed.
- K. Nakatani, Proc. Jpn. Acad., Ser. B, 2022, 98, 30–48 CrossRef CAS PubMed.
- K. Nakatani, S. Hagihara, Y. Goto, A. Kobori, M. Hagihara, G. Hayashi, M. Kyo, M. Nomura, M. Mishima and C. Kojima, Nat. Chem. Biol., 2005, 1, 39–43 CrossRef CAS PubMed.
- M. Nakamori, G. B. Panigrahi, S. Lanni, T. Gall-Duncan, H. Hayakawa, H. Tanaka, J. Luo, T. Otabe, J. Li, A. Sakata, M. C. Caron, N. Joshi, T. Prasolava, K. Chiang, J. Y. Masson, M. S. Wold, X. Wang, M. Y. W. T. Lee, J. Huddleston, K. M. Munson, S. Davidson, M. Layeghifard, L. M. Edward, R. Gallon, M. Santibanez-Koref, A. Murata, M. P. Takahashi, E. E. Eichler, A. Shlien, K. Nakatani, H. Mochizuki and C. E. Pearson, Nat. Genet., 2020, 52, 146–159 CrossRef CAS PubMed.
- S. Paul, D. Mytelka, C. Dunwiddie, C. Persinger, B. Munos, S. Lindborg and A. Schacht, Nat. Rev. Drug Discovery, 2010, 9, 203–214 CrossRef CAS PubMed.
- H. Haniff, L. Knerr, J. Chen and M. Disney, SLAS Discovery, 2020, 25, 869–894 CrossRef CAS PubMed.
- A. Murata, Y. Harada, T. Fukuzumi and K. Nakatani, Bioorg. Med. Chem., 2013, 21, 7101–7106 CrossRef CAS PubMed.
- T. Fukuzumi, A. Murata, H. Aikawa, Y. Harada and K. Nakatani, Chem.−Eur. J., 2015, 21, 16859–16867 CrossRef CAS PubMed.
- J. Jumper, R. Evans, A. Pritzel, T. Green, M. Figurnov, O. Ronneberger, K. Tunyasuvunakool, R. Bates, A. Žídek, A. Potapenko, A. Bridgland, C. Meyer, S. A. A. Kohl, A. J. Ballard, A. Cowie, B. Romera-Paredes, S. Nikolov, R. Jain, J. Adler, T. Back, S. Petersen, D. Reiman, E. Clancy, M. Zielinski, M. Steinegger, M. Pacholska, T. Berghammer, S. Bodenstein, D. Silver, O. Vinyals, A. W. Senior, K. Kavukcuoglu, P. Kohli and D. Hassabis, Nature, 2021, 596, 583–589 CrossRef CAS PubMed.
- S. Genheden, A. Thakkar and V. Chadimová, et al. , J. Cheminf., 2020, 12, 70 Search PubMed.
- M. Segler, M. Preuss and M. Waller, Nature, 2018, 555, 604–610 CrossRef CAS PubMed.
- T. Sato, T. Honma and S. Yokoyama, J. Chem. Inf. Model., 2010, 50, 170–185 CrossRef CAS PubMed.
- M. O'Boyle and A. Sayle, J. Cheminf., 2016, 8, 36 Search PubMed.
- A. Rifaioglu, H. Atas, M. Martin, R. Atalay, V. Atalay and T. Dogan, Briefings Bioinf., 2019, 20, 1878–1912 CrossRef CAS PubMed.
- J. Vamathevan, D. Clark, P. Czodrowski, I. Dunham, E. Ferran, G. Lee, B. Li, A. Madabhushi, P. Shah, M. Spitzer and S. Zhao, Nat. Rev. Drug Discovery, 2019, 18, 463–477 CrossRef CAS PubMed.
- L. Alzubaidi, J. Zhang, A. J. Humaidi, A. Al-Dujaili, Y. Duan, O. Al-Shamma, J. Santamaría, M. A. Fadhel, M. Al-Amidie and L. Farhan, J. Big Data, 2021, 8, 53 CrossRef PubMed.
- C. Rudin, Nat. Mach. Intell., 2019, 1, 206–215 CrossRef PubMed.
- R. Todeschini and V. Consonni, Handbook of Molecular Descriptors, Wiley-VCH, 2008 Search PubMed.
- A. Mauri, V. Consonni, M. Pavan and R. Todeschini, Match Commun. Math. Comput. Chem., 2006, 56, 237–248 CAS.
- L. Breiman, Random Forests, Machine Learning, Springer, 2001, vol. 45, pp. 5–32 Search PubMed.
- K. Napierala and J. Stefanowski, J. Intell. Inf. Syst., 2016, 46, 563–597 CrossRef.
- F. Pedregosa, G. Varoquaux, A. Gramfort, V. Michel, B. Thirion, O. Grisel, M. Blondel, P. Prettenhofer and R. Weiss, J. Mach. Learn. Res., 2011, 12, 2825–2830 Search PubMed.
- T. Chen and C. Guestrin, Proceedings of the ACM SIGKDD International Conference on Knowledge Discovery and Data Mining, ACM, 2016, pp. 785–794 Search PubMed.
- N. Chawla, K. Bowyer, L. Hall and W. Kegelmeyer, J. Artif. Intell. Res., 2002, 16, 321–357 CrossRef.
- S. Lundberg and S. Lee, NIPS, 2017, 4768–4777 Search PubMed.
- B. Menze, M. Kelm, R. Masuch, U. Himmelreich, P. Bachert, W. Petrich and F. Hamprecht, BMC Bioinf., 2009, 10, 213 CrossRef PubMed.
- A. Balaban, Theory and Topology in Chemistry, ed. R. B. King and D. H. Rouvray, Elsevier, 1987, pp. 159–176 Search PubMed.
- O. Devinyak, D. Havrylyuk and R. Lesyk, J. Mol. Graphics Modell., 2014, 54, 194–203 CrossRef CAS PubMed.
- M. Randić, J. Am. Chem. Soc., 1975, 97, 6609 CrossRef.
- F. Burden, J. Chem. Inf. Comput. Sci., 1989, 29, 225–227 CrossRef CAS.
- L. McInnes, J. Healy and J. Melville, J. Open Source Softw., 2018, 3, 861 CrossRef.
Footnotes |
| † Electronic supplementary information (ESI) available. See DOI: https://doi.org/10.1039/d3dd00160a |
| ‡ Current address: Nucleotide and Peptide Drug Discovery Center, Tokyo Medical and Dental University, 1-5-45 Yushima, Bunkyo-ku, Tokyo 113-8519, Japan. |
| § Current address: Department of Material Sciences, Faculty of Engineering Sciences, Kyushu University, 6-1 Kasuga-koen, Kasuga, Fukuoka 816-8580, Japan. |
| This journal is © The Royal Society of Chemistry 2024 |

