 Open Access Article
Machine learning-assisted analysis of dry and lubricated tribological properties of Al–Co–Cr–Fe–Ni high entropy alloy
Saurabh
Vashistha
abc,
Bashista Kumar
Mahanta
ab,
Vivek Kumar
Singh
d,
Neha
Sharma
b,
Anjan
Ray
e,
Saurabh
Dixit
f and
Shailesh Kumar
Singh
 *abc
*abc
aClimate Change and Data Science, CSIR – Indian Institute of Petroleum, Dehradun-248005, India. E-mail: sk.singh@iip.res.in; shailesh.csiriip@gmail.com
bAdvanced Tribology Research Centre, CSIR – Indian Institute of Petroleum, Dehradun-248005, India
cAcademy of Scientific and Innovative Research (AcSIR), Ghaziabad-201002, India
dDepartment of Mechanical Engineering, Indian Institute of Technology Bombay, Mumbai-400076, India
eCSIR – Indian Institute of Petroleum, Dehradun-248005, India
fMishra Dhatu Nigam Limited, Hyderabad-500058, India
First published on 30th September 2024
Abstract
This study marks a notable advancement in tribology by thoroughly investigating the tribological properties of a high-entropy alloy under both lubricated and dry conditions. The research encompasses a detailed evaluation of the alloy's wear behavior, utilizing a data-driven modeling approach that employs an evolutionary framework to build and validate a predictive model. The findings offer critical insights into the tribological performance of high-entropy alloys under diverse operational and lubrication conditions. Specifically, the Al–Co–Cr–Fe–Ni alloy exhibits exceptional tribological properties, with a coefficient of friction ranging from 0.0165 to 0.6024 and surface roughness between 0.261 and 1.11. A data-driven methodology was employed to develop a predictive model with an accuracy exceeding 94%, effectively capturing the precise trends in lubrication behavior and providing in-depth information on surface characteristics for future experimental endeavors and data extraction. Additionally, the study underscores the profound impact of lubricant chemical composition on the wear behavior of the alloy, highlighting the crucial importance of selecting appropriate lubricants for specific tribological applications.
1. Introduction
High entropy alloys (HEAs) have emerged as a revolutionary alternative to traditional alloys in recent years. Unlike alloys that contain only one or two core components, HEAs require multiple constituents and provide a wide range of benefits that cater to different needs. In contrast, HEAs consist of four or more principal elements, with several elements present in concentrations ranging from 5% to 35%.1 This increased configurational entropy reaches a certain level and results in the formation of a single-phase solid solution. This characteristic helps prevent the precipitation of intermetallic compounds, which is a primary factor in reducing mechanical performance. The HEA alloy is an important material for structural and functional purposes due to its outstanding mechanical strength, resilience to corrosion, and stability under elevated temperatures.2,3 The surface properties of a material play a vital role in determining its overall service life in most applications. While the bulk properties are important, it is the surface that directly interacts with the environment, leading to various forms of degradation, wear, and corrosion. Therefore, optimizing and maintaining favourable surface properties is crucial for ensuring the longevity and performance of a material. One way to increase the service life of a material is by reducing the coefficient of friction at its mating surface, which leads to a decrease in the wear rate. Surface treatment processes, such as bronzing, are often used to improve the hardenability and wear resistance of materials like Ni, Al, Fe, Co, and Ti-based alloys.4 However, these processes can be costly. An alternative approach to achieve similar results without undergoing surface treatment is to use lubricating oils on the contacting surface. Lubricants are substances that are applied between two surfaces in relative motion to reduce friction and wear. They can be in the form of oils, greases, or solid lubricants. By using appropriate lubricating oils, a protective film is formed on the mating surfaces, which reduces direct metal-to-metal contact and minimizes friction and wear. The lubricating film acts as a barrier, providing a smooth surface that separates the mating materials. This helps to decrease the wear rate and increase the service life of the materials. It's important to select the right type of lubricating oil based on factors such as the operating conditions, temperature, load, and compatibility with the mating materials. Different lubricants have different properties and viscosities, which make them suitable for specific applications.The lack of knowledge about the tribological behavior of High-Entropy Alloys (HEAs) can be attributed to several factors. Firstly, the number of alloy systems that have been thoroughly studied is still relatively small, resulting in limited available data. To address this, a broader range of HEA systems should be investigated to expand the knowledge base. Secondly, the tribological behavior of HEAs is significantly influenced by their microstructural and compositional characteristics, which makes it challenging to draw generalized conclusions. Therefore, it is important to conduct systematic studies that take into account various microstructural features and alloy compositions to better understand their impact on tribological properties. Thirdly, although several lubricants have been tested on HEAs, the number of studies conducted in this area is still relatively limited. To alleviate this limitation, more study should be performed to investigate how different lubricants affect the level of friction and wear encountered by HEAs. Furthermore, most research on HEAs has primarily focused on their mechanical properties, with only a few studies dedicated to tribology. To enhance our understanding of the tribological behavior of HEAs, it is crucial to place greater emphasis on conducting tribological investigations alongside the characterization of mechanical properties.
In order to address these knowledge gaps, studies should prioritize three main areas. Firstly, there should be a focus on examining the impact of different lubricants on the wear and friction behaviour of HEAs. This will provide valuable insights into the optimal lubrication strategies for HEA applications. Secondly, it is important to explore the effect of microstructural and compositional attributes on the tribological properties of HEAs. By systematically varying these parameters, researchers can uncover correlations and establish guidelines for designing HEAs with tailored tribological properties. Lastly, in conjunction with the development of new HEA systems, tribological studies should be integrated to better understand the lubrication behavior of these materials. This interdisciplinary approach will ensure that both mechanical and tribological aspects are comprehensively addressed in HEA research. By addressing these factors and conducting further research in these areas, a deeper understanding of the tribological behavior of HEAs can be achieved, enabling their broader application in industries where friction and wear properties are critical.
High Entropy Alloys (HEAs) have gained significant attention in recent years due to their exceptional mechanical properties, corrosion resistance, and high-temperature stability. However, understanding the tribological behavior of HEAs, particularly the Al–Co–Cr–Fe–Ni system, remains limited. Yuan Yu et al.5 investigated the tribological properties of Al–Co–Cr–Fe–Ni and Al–Co–Cr–Fe–Ni–Ti0.5 HEAs using gear oil and multiple alkylated cyclopentanes (MACs). The study showed that the Al–Co–Cr–Fe–Ni–Ti0.5 alloy exhibited superior tribological properties compared to the Al–Co–Cr–Fe–Ni alloy when adequately lubricated with gear oil. Heat treatment resulted in a uniform grain structure for Al–Co–Cr–Fe–Ni alloy, while the dendrite structure was retained in the Al–Co–Cr–Fe–Ni–Ti0.5 alloy. Young Liu et al.6 studied the influence of normal loads on the friction and wear behaviours of AlCrCuFeNi2 HEA against Si3N4 ceramic balls under different conditions (dry, simulated rainwater, and deionized water). The study found that simulated rainwater affected tribological behavior through processes such as passive film formation, lubrication, cooling, cleaning, and corrosion, resulting in adhesive, abrasive, and corrosive wear. Haitao Duan et al.7 studied the lubricated tribological properties of an Al–Co–Cr–Fe–Ni–Cu high-entropy alloy (HEA) utilising pin-on-disc testing. The results showed that by lubricating the HEA with a hydrogen peroxide solution (90%) and oil, the friction and wear resistance of the HEA was significantly enhanced or improved as compared to using only conventional lubricating oil. The coefficient of friction was lower after a grinding stage. These studies demonstrate the importance of different lubricants in influencing the tribological behaviour of Al–Co–Cr–Fe–Ni HEAs. Gear oil and MACs were found to enhance the tribological properties of Al–Co–Cr–Fe–Ni–Ti0.5 alloy, while simulated rainwater and hydrogen peroxide solution showed positive effects on wear and friction reduction. These findings highlight the need to explore and optimize lubrication strategies for HEAs, considering specific working conditions and lubricant characteristics. The influence of normal loads on the tribological properties of HEAs was also emphasized. Simulated rainwater, for instance, induced complex wear mechanisms, including adhesive, abrasive, and corrosive wear. Understanding these effects is crucial for predicting the wear behaviour of HEAs in practical applications. The literature survey highlights the scarcity of studies on the tribological behaviour of HEAs, indicating the need for further research in this field. Furthermore, the utilization of machine learning-based approaches for validating experimental data has emerged as a promising avenue for advancing our understanding of HEA tribology.8–12 In the present context, ANN-based modeling approaches have emerged as highly efficient techniques for capturing the intricate trends inherent in complex datasets. Their ability to handle nonlinearity and adapt to diverse data structures makes them particularly suited for modeling phenomena with multifaceted dependencies. ANN models excel in identifying underlying patterns without the need for explicit mathematical formulations, offering a robust solution for processing and interpreting complex data. This flexibility and precision enable ANN-based models to accurately predict behaviors across a wide range of applications, making them a powerful tool for data-driven analysis and modeling in complex systems.13–15 This work represents a notable progress in the field of tribology as it provides a comprehensive analysis of the tribological behaviour of a high-entropy alloy (HEA) under both lubricated and dry conditions. By examining the wear characteristics of the alloy, the research contributes to a better understanding of its performance in real-world applications.
2. Materials and methodology
The granules of aluminum, cobalt, chromium, iron, and nickel with high level of purity (purity > 99.9 wt%) have been employed to fabricate the Al–Co–Cr–Fe–Ni High Entropy Alloy (HEA) utilizing the method of vacuum induction melting. The resultant cast component was a rectangular ingot characterized by dimensions of 115 × 135 × 170 mm. The cylindrical specimens measuring 6 mm in diameter and 20 mm in length were extracted from the as-cast ingot through the process of Wire Cut Electrode Discharge Machining (EDM) to conduct the experiment. The nominal composition of the high entropy alloy is given below in Table 1.| Element | Al | Co | Cr | Fe | Ni |
|---|---|---|---|---|---|
| at% | 20.1 | 20.0 | 19.3 | 18.7 | 21.8 |
| wt% | 10.7 | 23.4 | 19.9 | 20.7 | 25.4 |
2.1 Test sample and experimental test conditions
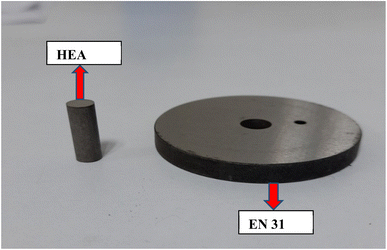
The test specimens were in the form of circular plates and cylindrical pins. The test specimens have the following specification:(i) Metallic disc: EN-31 alloy steel circular plate of 50 mm diameter with hardness 680 Hv.
(ii) HEA pin: cylindrical pins of 6 mm diameter and 20 mm length having hardness 338 Hv.
(iii) Lubricants: mineral oil, synthetic oil, vegetable oil and their physicochemical properties are shown Table 2 below. The vegetable oil was synthesized in the laboratory using Karanja oil. The mineral oil and synthetic oil were purchased from the market and the base oils used were SN 150 and polyalphaolefin (PAO 200) respectively.
| Property | Mineral oil | Synthetic oil | Vegetable oil |
|---|---|---|---|
| Density (g cm−3) | 0.848 | 0.856 | 0.859 |
| Viscosity (cst) | 18.24 | 18.56 | 18.78 |
The image of test samples used in the experiments is shown in Fig. 1. The experiments were carried out on a pin on disc tribo-tester with a constant rotational speed, under varied test settings with varying load, over a set period of time. The Table 3 shows the experimental test conditions for pin on disc experiment. The scanning electron microscopy (SEM) was done to analyze the worn surface morphologies of the samples after test. Also, a Coherence Correlation Interferometry (CCI) optical profilometer was used to find the average values of surface roughness and 3D roughness maps of the samples after experiment.
| S. No. | Normal force (N) | Condition | Test duration (min) | RPM | Temperature (°C) |
|---|---|---|---|---|---|
| 1 | 50 | Dry | 30 | 200 | 25 ± 2 |
| 2 | 100 | Dry | 30 | 200 | 25 ± 2 |
| 3 | 150 | Dry | 30 | 200 | 25 ± 2 |
| 4 | 200 | Dry | 30 | 200 | 25 ± 2 |
| 5 | 50 | Mineral oil | 30 | 200 | 25 ± 2 |
| 6 | 100 | Mineral oil | 30 | 200 | 25 ± 2 |
| 7 | 150 | Mineral oil | 30 | 200 | 25 ± 2 |
| 8 | 200 | Mineral oil | 30 | 200 | 25 ± 2 |
| 9 | 50 | Synthetic oil | 30 | 200 | 25 ± 2 |
| 10 | 100 | Synthetic oil | 30 | 200 | 25 ± 2 |
| 11 | 150 | Synthetic oil | 30 | 200 | 25 ± 2 |
| 12 | 200 | Synthetic oil | 30 | 200 | 25 ± 2 |
| 13 | 50 | Vegetable oil | 30 | 200 | 25 ± 2 |
| 14 | 100 | Vegetable oil | 30 | 200 | 25 ± 2 |
| 15 | 150 | Vegetable oil | 30 | 200 | 25 ± 2 |
| 16 | 200 | Vegetable oil | 30 | 200 | 25 ± 2 |
2.2 Experimental Setup
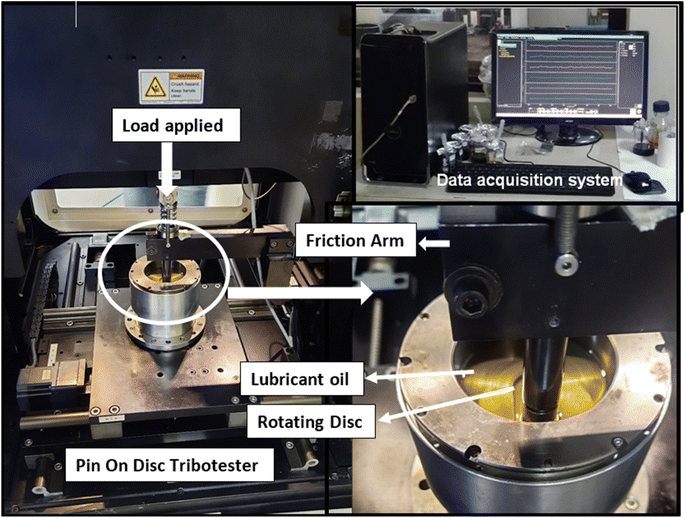
Experiments were conducted to investigate the tribological properties of an Al–Co–Cr–Fe–Ni high entropy alloy. The R-tec USA tribo-tester (Fig. 2) is used to evaluate material tribological properties. The tribo-tester comprises of a revolving stage that may be modified to rotate at the fixed rpm. A disc bearing a test specimen is fastened to the stage, while a friction arm is held motionless above the stage. At the end of the friction arm is a fixture with a mating pin test specimen which has an offset of 20 mm from the centre of the disc. A lubricant or oil can be filled around the disc to submerge it, and a sensor is put on the friction arm to measure frictional resistance when the disc is spun. A servomotor is used to load the test specimens, and computer-controlled software runs the test apparatus, continuously monitoring and recording the friction encountered.The test specimens (pin and disc) were coded and then inspected to ensure that the surfaces were consistent. The specimens were forced together for 3–5 minutes under a weight of 25–30 N to obtain a full contact area between the pin and plates. Following that, the parts were cleaned with a solvent and dried in an oven to remove grease, oil, and dirt. Finally, the specimens were weighed to the fourth decimal place of a gram in the laboratory. The pins and plates were reinstalled and full area contact was verified. Once contact was established, the pins were loaded and the experiments were carried out under the specified conditions. Following completion, the pins and plates were removed, cleaned with a solvent, and placed in an oven to eliminate any remaining wear debris. The specimens were then weighed on laboratory weighing machine to elucidate their weight loss and wear rate. Data acquisition software was used to monitor and record the friction force. Each experiment was carried out three times to verify data repeatability and reproducibility.
2.3 ANN based modelling
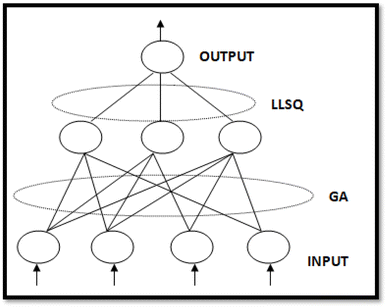
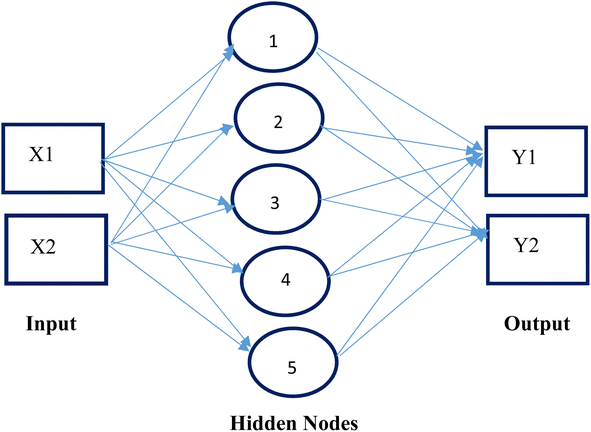
The ANN model was developed using experimental data from a pin-on-disc tribo-tester, and it was then optimised using a Genetic Algorithm (GA), with the ANN model serving as the objective function. Experiments were carried out in order to determine the optimal lubricant for a particular HEA alloy by examining the coefficient of friction and roughness of computationally developed lubricants. The ANN-based Evolutionary Neural Network (EvoNN)16,17 is used in this work. EvoNN uses a population of neural networks as inputs and genetically evolves the weights and connections through Predator Prey Genetic Algorithm (PPGA) and Linear Least Square (LLSQ) method.18 A neural network is an interconnected layer of nodes that resembles neurons in our brain network. The layers are input, hidden, and output layers. The nodes in the layers are interconnected with each other through synapses. The synapses take the value from their input, multiply it with specific weights and biases, and pass the output to different layers. The entire process is repeated until the desired output from the output layer is obtained. The network's efficiency is determined by the number of connections and nodes it has. A neural network's hidden layer utilises a transfer/activation function to determine whether or not a neuron should be activated. Depending on the complexity of the problem, there may be numerous hidden layers. These layers use the transfer/activation function to calculate the values needed to determine whether or not to activate the neuron.19 The structure of EvoNN can be seen in Fig. 3. In EvoNN, the weights and connections between input and hidden layers were evolved genetically by PPGA. The weights and connections between the hidden and output layers were trained by the LLSQ method to ensure convergence. EvoNN employs a training methodology that computes a Pareto front between network training error and network complexity for a population of networks/models. This allows for a trade-off between these two parameters in order to select optimum model. The training is done separately for all objectives, and the optimum final model is chosen using the AICc criterion.203. Results and discussion
After loading the test specimens in the tribotester, the experiments were conducted at different loads and conditions with time duration and rotational speed of 30 minutes and 200 rpm respectively. The data acquisition system continuously monitors and records the coefficient of friction values during the test. The results obtained during the experiments like friction, wear and surface roughness are discussed in the sections given below.3.1 Friction and wear behaviour
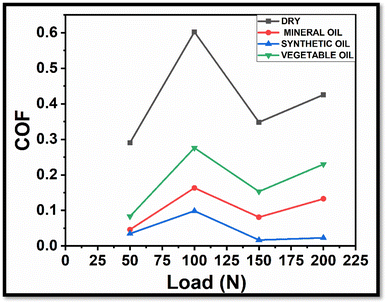
Fig. 4 shows the coefficient of friction (COF) curves of Al–CO–Cr–Fe–Ni based high entropy alloy against EN31 steel disc at four loads varying from 50 N to 200 N for dry condition, vegetable oil, mineral oil, and synthetic oil, respectively. It is observed that the COF curves are more fluctuating for the dry condition compared to the three lubricated conditions. This suggests that the presence of lubricants helps in reducing the fluctuations and stabilizing the frictional behavior between the HEA and steel disc. In a general context, the coefficient of friction (COF) exhibits an elevation to a maximal value during the preliminary phases (running-in period) before reaching a steady state. The phenomenon known as the running-in-period can be attributed to the rupture of mechanical bonds or localized welding occurring between the asperities of two interfacing surfaces.21–23 Thus, initially the coefficient of friction remains high in the running period and after sometime it becomes steady as the experiment runs and the average value of the coefficient of friction in the steady state was calculated for each test condition which was known to be steady state average coefficient of friction (CoF). The CoF values reached in steady state after approximately 120–180 s for different test conditions. The steady state average COF is the average of 5000 to 5500 cycles. Fig. 5 presents the steady state average COFs at loads varying from 50 N to 200 N for all four conditions. From this figure, it can be inferred that synthetic oil provides the lowest coefficient of friction across all loads for the HEA and steel disc tribopair. On the other hand, the highest coefficient of friction is observed in the dry condition, where no lubricant is used. Among the lubricants, vegetable oil manifests the highest COF values at all loads.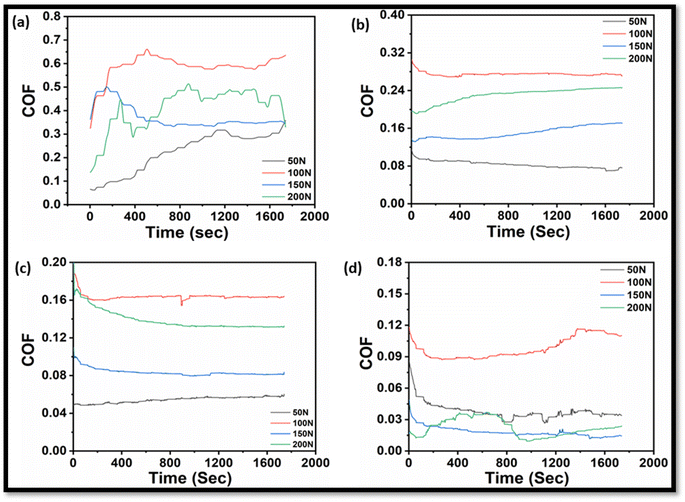 | ||
| Fig. 4 Friction coefficient curves of HEA alloy at (50–200 N) for dry condition (a), vegetable oil (b), mineral oil (c) and synthetic oil (d). | ||
In dry conditions, Fig. 6(a) of SEM micrographs shows mild scratches at a load of 50 N. However, at a load of 100 N (Fig. 6(b)), deeper grooves are visible, accompanied by the presence of wear debris being pulled out. This increased wear and debris generation contribute to a higher coefficient of friction (COF) value at the 100 N load. The reason for the increase in COF value with an increase in load is explained as follows: when the load increases, there is a higher quantity of wear debris generated, which is unable to compress adequately between the two mating surfaces. This inability to compress leads to the phenomenon of abrasion and micro cutting, which contribute to increased friction and a higher COF value. This information is supported by ref. 24. However, Fig. 5 shows a decrease in COF values at loads of 150 N and 200 N for all conditions. This decrease can be attributed to the following factors: Increased load results in higher pressure between the mating surfaces. This increased pressure causes more shear strain on the surfaces, which, in turn, leads to an increase in the strength of the material. As a result of this higher strength, there is a decrease in the real area of contact between the surfaces, which leads to a lower COF value. Ref. 25 supports this explanation. With an increase in load, there is also an increase in the temperature between the mating surfaces, generating more frictional heat. The higher temperature contributes to better compression of wear debris. This improved compression leads to a reduction in the COF value. Ref. 26 provides support for this statement.
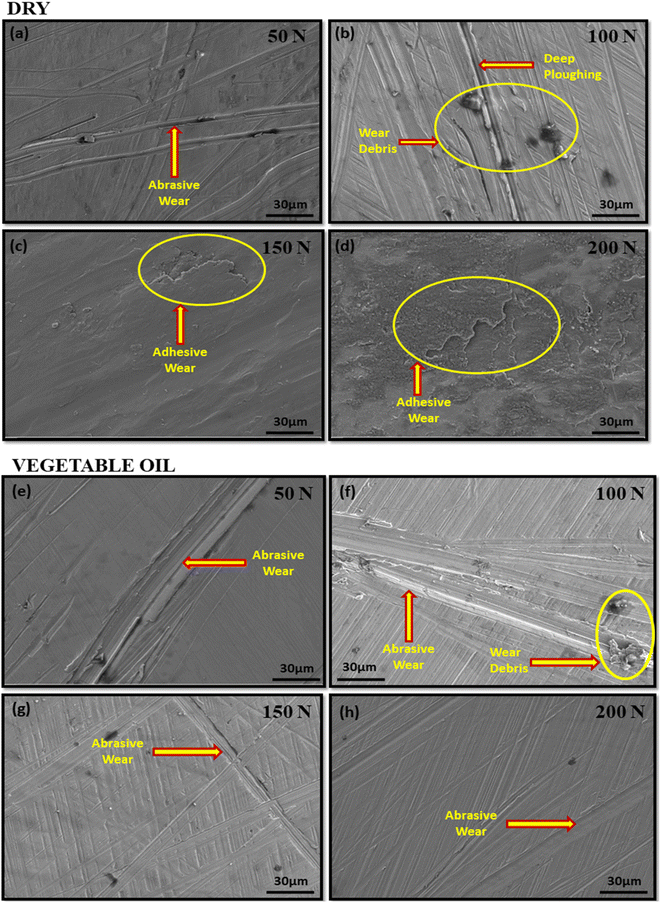 | ||
| Fig. 6 Worn surface morphologies of HEA samples at (50–200 N) for dry state (a–d) and vegetable oil (e–h). | ||
The primary wear mechanisms observed varies depending on the load and lubrication conditions. In dry conditions, the primary wear mechanism at 50 N and 100 N loads is identified as abrasive wear, as evidenced by Fig. 6(a and b) showing mild scratches and deeper grooves, respectively. However, at 150 N and 200 N loads, the dominant wear mechanism in the dry condition shifts to adhesive wear, which is confirmed by the presence of macroscopic chunks in Fig. 6(c and d). The COF values for all conditions are lower at 150 N and 200 N loads compared to 100 N load. This can be attributed to the increased load causing better compaction of wear debris on the surface. As the load increases, the wear debris becomes more compressed, resulting in reduced friction and lower COF values. Extreme states of sliding contact that eliminate any superficial layers of metal oxide and lubricating films produce metal surfaces that can give rise for substantial adhesion and thus adhesion comes into picture after disruption of oxide films between the sliding surfaces in case of lubricants.27 In lubricating conditions, the main wear mechanism observed for all loads is abrasive wear. This is confirmed by the SEM images of worn surfaces for vegetable oil (Fig. 6(e–h)), mineral oil (Fig. 7(a–d)), and synthetic oil (Fig. 7(e–h)). The presence of abrasive wear indicates that the lubricants are not fully preventing direct contact between the mating surfaces, leading to abrasive interactions. In summary, the wear mechanisms observed include abrasive wear and adhesive wear, with the dominant mechanism depending on the load and lubrication conditions. Abrasive wear is prevalent in lubricating conditions, while adhesive wear becomes dominant in the dry condition at higher loads. The compacting of wear debris with increasing load contributes to lower COF values.
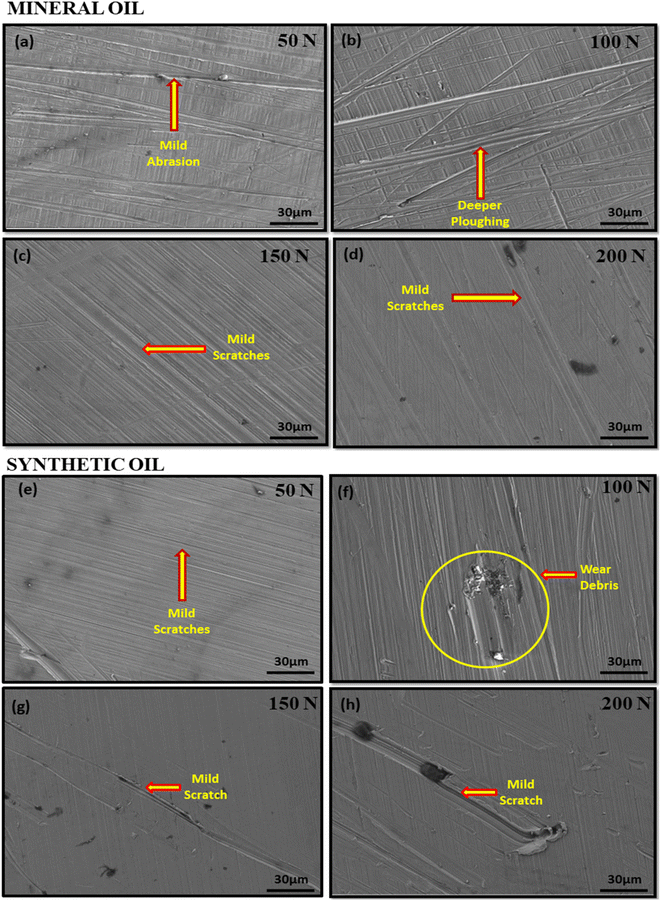 | ||
| Fig. 7 Worn surface morphologies of HEA samples at (50–200 N) using mineral oil (a–d) and synthetic oil (e–h). | ||
Wear tests were conducted for different durations to evaluate wear rates. For the lubricating conditions, the tests were initially performed for 30 minutes, and no wear was reported during this time. To determine the wear rate, extended tests were carried out for 1 hour in dry condition as well as using lubricating oils for 100 N and 200 N loads. The wear rates for mineral oil and vegetable oil for both the loads were found to be almost same i.e. 0.0038 g for 100 N and 0.013 g for 200 N. The wear measurements reported for dry condition and synthetic oil are as follows:
Dry condition:
• Wear at 100 N load: 0.004 g.
• Wear at 200 N load: 0.016 g.
Synthetic oil lubricant:
• Wear at 100 N load: 0.003 g.
• Wear at 200 N load: 0.005 g.
Based on these measurements, it is clear that the wear values are higher in the dry condition compared to the synthetic oil lubricant for both 100 N and 200 N loads. When comparing the percentage increase in wear from 100 N to 200 N load, the dry condition shows a 300% increase in wear (from 0.004 g to 0.016 g). On the other hand, when using synthetic oil, the percentage increase in wear is 66% (from 0.003 g to 0.005 g) when the load increases from 100 N to 200 N. These results indicate that the lubricating effect of synthetic oil reduces the wear compared to the dry condition. Moreover, the percentage increase in wear is less pronounced with synthetic oil as the load increases, suggesting that the lubricant helps mitigate the wear rate as the load becomes higher.
The tribo-performance results of the lubricated conditions, as depicted in Fig. 4 and 5 suggests that the composition of the HEA alloy substrate plays a significant role in the interaction between the alloy and different lubricating oils. The presence of metal elements from the d-block in the HEA alloy substrate, which possess extended covalency and vacant orbitals, tends to interact more strongly with synthetic oil compared to mineral and vegetable oil base stocks. This stronger interaction leads to a reduction in friction at the interface when synthetic oil is used as the lubricant. Furthermore, based on the molecular structure of synthetic oil, which is composed of polymeric olefins, it is inferred that a reverse micelle structure is formed with the transition elements Cr, Co, and Cu present in the HEA alloy. Synthetic oils with larger molecular size exhibit soft chemical nature and follow the HSAB (Hard–Soft Acid–Base) principle. As a result, soft–soft solid interactions occur, forming a stable lubricating film with synthetic oil. This property of synthetic oils, along with the soft–soft solid interactions and the stable lubricating film formation, leads to a clear decreasing trend in the coefficient of friction (COF) with an increase in load. This implies that as the load increases, the COF values decrease when synthetic oil is used as the lubricant. The information provided is supported by ref. 28–30, which likely provide more in-depth explanations and details on the specific properties and interactions mentioned. Overall, the composition of the HEA alloy substrate and the molecular structure of synthetic oil contribute to the strong interaction and reduced friction at the interface, resulting in a stable lubricating film formation and a decreasing trend in COF with increasing load.
On the other hand, mineral oil, which consists of a mixture of Paraffins, Isoparaffins, Olefins, Napthenes, and Aromatics (PIONA), tends to form less stable lubricating films on the HEA alloy. This is attributed to weak interactions between the oil molecules and the alloy surface, as well as the presence of unsaturated sites in the oil composition. These weak interactions result in weaker adsorption of the lubricant on the alloy surface, leading to higher friction. The weak film formation with mineral oil becomes more prominent at higher loads due to the effects of frictional heating. Under increased temperatures, the weak interaction between the alloy and mineral oil can be offset by stronger adsorption of sulfur present in the base stock. The presence of sulfur enhances the lubricating properties by forming a stronger adsorbed layer on the surface, resulting in a reduction in friction as the load increases. This suggests that the unsaturated sites and sulfur in mineral oil can better withstand higher stresses compared to vegetable oils. In contrast, vegetable oil exhibits the highest friction when used as a lubricant with the HEA alloy. This can be attributed to the long chain and ester moieties present in vegetable oil, which tend to form weak interfacial films. As a result, the interaction between the vegetable oil and the HEA alloy is poor, leading to greater fluctuations in friction values with increasing load. The explanation provided sheds light on the differences in performance observed with different lubricants, including mineral oil and vegetable oil, when used with the HEA alloy. It highlights the importance of the composition and properties of the lubricating oils in influencing the interfacial interactions and friction behavior.
The SEM micrographs of the wear obtained under lubricated conditions, as depicted in Fig. 6 and 7, provide valuable insights into the wear modes and film stability of the HEA substrate when lubricated with different oils. When the HEA substrate is lubricated with vegetable oil, the SEM micrographs suggest that a better film stability is achieved compared to mineral oil. Under increasing load conditions, mild abrasion is observed, indicating a smoother wear mode. On the other hand, when mineral oil is used as the lubricant, deep ploughing is observed under similar load conditions, indicating a more severe wear mode. This difference in wear behavior can be attributed to the alloy composition of the HEA, which forms a compatible lubricating film with vegetable oil compared to mineral oil.31,32 The compatibility of the HEA alloy with vegetable oil contributes to better film stability and reduces the severity of wear. In the case of synthetic oil, the SEM micrograph suggests that the film-forming ability of synthetic oil with the HEA substrate is stronger than mineral and vegetable oil. The synthetic oil exhibits strong adsorption over the HEA substrate, leading to reduced wear loss at the interface and demonstrating better antiwear performance under different load conditions. This indicates that synthetic oil offers excellent compatibility with the HEA substrate and forms a robust lubricating film, resulting in improved wear resistance. The wear attributes observed in the SEM micrographs align with the friction results obtained, indicating a correlation between wear and friction performance. The compatibility and film-forming ability of the lubricants with the HEA substrate play a crucial role in determining the wear modes and overall performance. The information provided is supported by ref. 33 and 34, which likely offer further details and explanations regarding the wear modes, film stability, and compatibility between lubricants and the HEA substrate. Overall, the SEM micrographs of the wear and the observed wear attributes validate the obtained friction results, highlighting the importance of lubricant compatibility and film formation in influencing the wear behavior of the HEA substrate.
3.2 Surface roughness
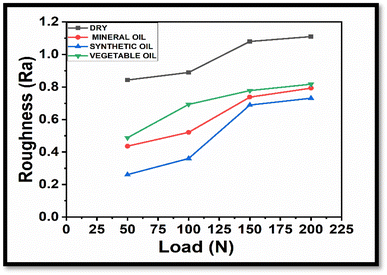
Surface roughness is the parameter that can affect the frictional values and the wear rate of the mating parts. Fig. 8 states that as the load increases from 50 N to 200 N, the average surface roughness (Ra) exhibits an increasing trend for all four conditions.The conditions mentioned include dry conditions, usage of synthetic oil, and vegetable oil. The highest values of surface roughness are reported for dry conditions, while the usage of synthetic oil yields the lowest values of average surface roughness for all four loads. Among the three lubricants mentioned, vegetable oil shows high values of surface roughness (Ra). Fig. 9 and 10 provide 3D roughness images of the HEA samples for all the conditions, which further support the observations made regarding surface roughness. When the average surface roughness is higher, the retention of wear debris on the surface increases, which is responsible for a decrease in the coefficient of friction. In other words, increased surface roughness can contribute to higher wear rates and affect the frictional behavior of the mating parts.35
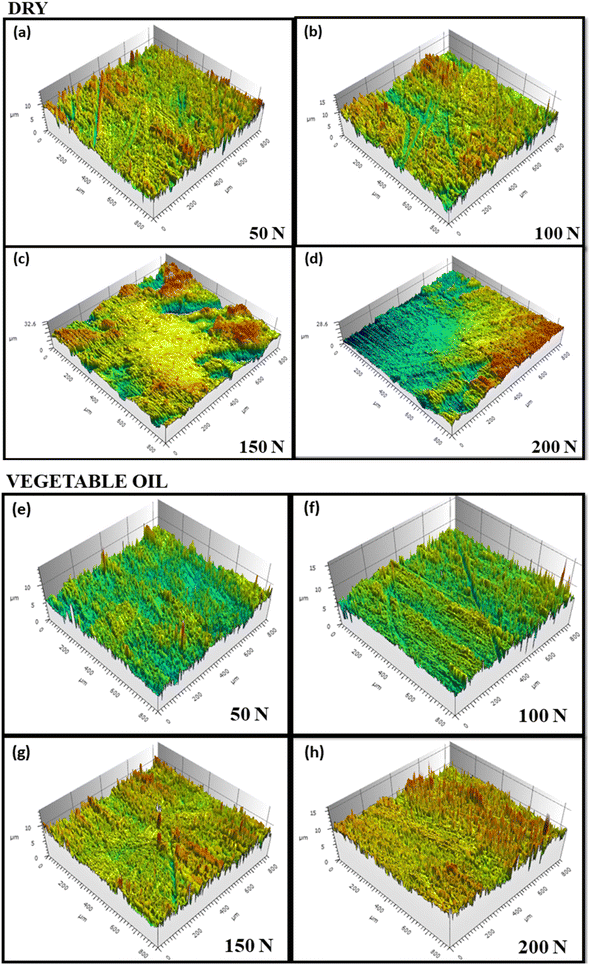 | ||
| Fig. 9 3D surface roughness maps of HEA samples at (50–100 N) for dry state (a–d) and vegetable oil (e–h). | ||
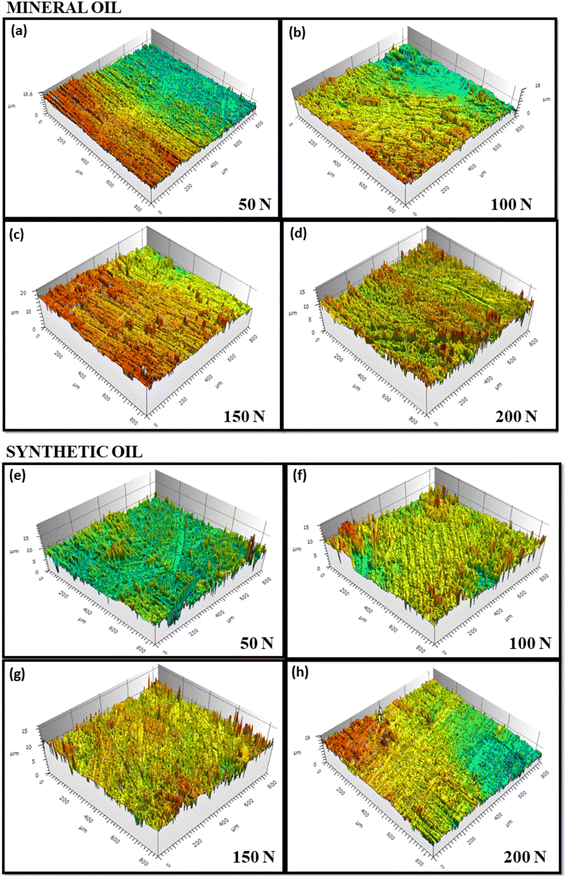 | ||
| Fig. 10 3D surface roughness maps of HEA samples at 50–200 N using mineral oil (a–d) and synthetic oil (e–h). | ||
4. ANN approach to validate the results
An ANN-based approach known as EvoNN36–38 is used in the modelling work to generate the prediction model for the objectives like COF and roughness for Al–Co–Cr–Fe–Ni high entropy alloy. The data are collected from the tribological experiment to generate a data-driven model. In the experiment process, 16 experiments are carried out at four different load and lubricating conditions. The load is between 50 to 200 N, and four other lubricating conditions, like dry, vegetable oil, mineral oil, and synthetic oils, are used in the process. The COF and Roughness values generated in this work are shown in Table 4.| COF (Y1) | Roughness (Y2) |
|---|---|
| 0.0165–0.6024 | 0.261–1.11 |
EvoNN employs an evolutionary training approach where key mechanisms such as crossover, mutation, and selection are pivotal in capturing precise data trends. This method excels in modeling small, highly nonlinear datasets due to its inherent self-evolution capabilities, which minimize error using a Predator-Prey Genetic Algorithm (PPGA). This distinguishes EvoNN from conventional ANN-based algorithms by its ability to iteratively refine the model, ensuring superior accuracy in complex data scenarios. This approach is applied to all the data, where the COF and the surface roughness are played a significant role in the tribological application, where both the objectives play a major role and provide better lubricating conditions and control the COF for better performance during the working condition. Two different models are generated by considering the above data. To generate the best model, the optimum parameters are considered. EvoNN is a tried and tested method used largely in the modelling process, basically in alloy design, chemical synthesis process, mechanical properties modelling, and deforming process.39 In the modelling process, neural networks are connected between inputs like load (X1) and lubricating condition (X2) and the hidden nodes. Different weightage values are given to each connection, varying between 0 and 1. The input process value transfers from input to hidden nodes and is stored in the hidden nodes where the error reduction occurs; the detailed working process is described elsewhere.18 The EvoNN evolution process is carried out in the lower part of the network, i.e., between the input and the hidden layer. The upper part of the algorithm linear list squired (LLSQ) method19 is used for convergence purpose. EvoNN uses a linear transfer function for output nodes. The optimized input from the lower portion significantly improves the output by gradient-based solver procedure. By using LLSQ, mathematical convergence is possible at the output stage. The detailed architecture of the network is shown in Fig. 11. Here, one hidden layer along with 7 optimum hidden nodes are considered to generate the optimum model.
The optimum parameters are decided by considering necessary changes in the input side, i.e., in the lower part of the network, where evolution takes place. Evolution processes like selection, crossover, and mutation are carried out in each generation with the help of a predator-prey genetic algorithm.39 The RSME error of the objective changes in each generation, and finally, a Pareto trade-off is generated between accuracy and complexity. Multiple models are generated through this process, out of which one is chosen by considering the corrected Akaike information criterion40 into the account. The various input parameters like the number of generations, hidden nodes, killing interval, numbers of predators and prey, cross-over, and mutation factors generate the number of models.41 The initial parameters for this work are shown in Table 5.
| Parameters | EvoNN |
|---|---|
| Hidden nodes | 5, 7, 10 |
| Max rank | 10, 15, 20 |
| Number of preys | 500 |
| Number of predators | 50 |
| Grit size | 60 × 60 |
| No of generations | 50, 75, 100 |
The process is continued with all the changes after number iteration and combination changes; a time will come when values are stagnated, and no more variation is noticed in error reduction results. These parameters are considered optimum parameters for the particular work. The optimum parameters with the best-fitted training error considered for this work are shown in Table 6.
| Model | Generation | Model structure (hidden nodes) | COF (Y1) | Roughness (Y2) |
|---|---|---|---|---|
| EvoNN | 100 | 7 | 0.02742 | 0.0263 |
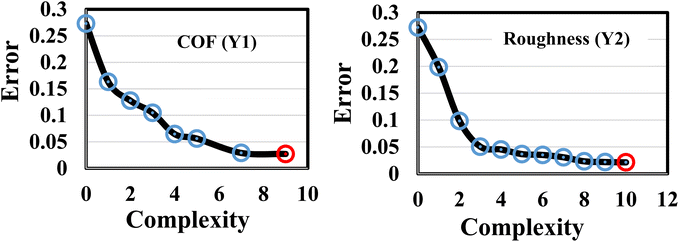
After the output is modeled against such parameters and the training models are generated with respect to these inputs, the training curves are properly analyzed. The best training models, already described in the table, with COF value for the training model, is 0.02742 and for roughness is 0.0263, having the best model with the least error and higher accuracy. The optimum training models are shown in Fig. 12 with a red circle in the Pareto front.
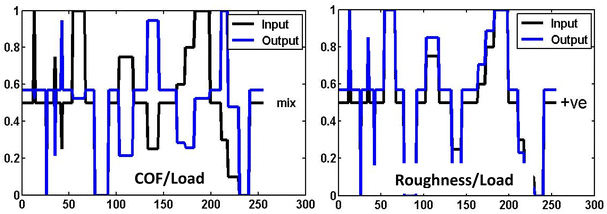
One of the most significant works in the training process knows the input parameters' exact behavior. Single Variable Response (SVR),41 which is incorporated into the algorithm, gives a clear idea regarding the individual response with respect to the output. The input-like load shows the effect on the output parameter like COF and the roughness with continuous changes in the input side. This provides a clear idea of +ve, −ve, mixed, and no response criteria of individual objectives. The single-variable responses are shown in Fig. 13.
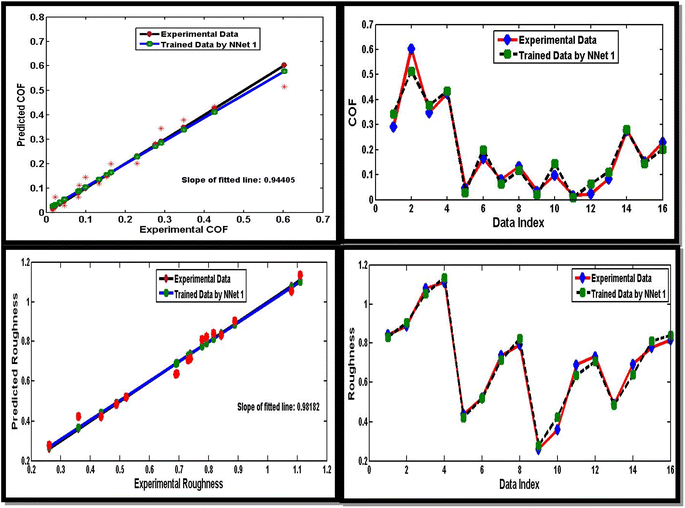
The slope of fitting and the Root Mean Squared Error is vital to know the difference between experimental results and the prediction results generated from the trained models. The slope of fitting and the training results for the COF and roughness are shown in Fig. 14.
The training results, which are generated from the optimum models, are compared with the experimental results. The fitting slope between the experimental COF and the predicted COF is evaluated as 0.94, and the slope between the experimental roughness and the predicted roughness is 0.98. This slope of fitting and the training indicate that the results neither under fitting nor over fitting with the experimental data. The root mean squared error is calculated for COF and the roughness. The above results are shown in Tables 7 and 8.
| Experimental COF | Predicted COF | RMSE |
|---|---|---|
| 0.2904 | 0.3436 | 0.0532 |
| 0.6024 | 0.5145 | 0.0879 |
| 0.348 | 0.3783 | 0.0303 |
| 0.4252 | 0.4334 | 0.0082 |
| 0.0459 | 0.0279 | 0.0180 |
| 0.1633 | 0.1988 | 0.0355 |
| 0.081 | 0.0626 | 0.0184 |
| 0.1327 | 0.1177 | 0.0150 |
| 0.0345 | 0.0267 | 0.0078 |
| 0.0987 | 0.1442 | 0.0455 |
| 0.0165 | 0.0080 | 0.0085 |
| 0.023 | 0.0631 | 0.0401 |
| 0.0833 | 0.1108 | 0.0275 |
| 0.2759 | 0.2817 | 0.0058 |
| 0.153 | 0.1455 | 0.0075 |
| 0.23 | 0.2006 | 0.0294 |
| Average error = 0.02741 | ||
| Experimental roughness | Predicted roughness | RMSE |
|---|---|---|
| 0.843 | 0.8315 | 0.0115 |
| 0.889 | 0.9043 | 0.0153 |
| 1.08 | 1.0532 | 0.0268 |
| 1.11 | 1.1352 | 0.0252 |
| 0.436 | 0.4224 | 0.0136 |
| 0.521 | 0.5201 | 0.0009 |
| 0.738 | 0.7149 | 0.0231 |
| 0.793 | 0.8241 | 0.0311 |
| 0.261 | 0.2785 | 0.0175 |
| 0.36 | 0.4233 | 0.0633 |
| 0.689 | 0.6371 | 0.0519 |
| 0.731 | 0.7080 | 0.0230 |
| 0.488 | 0.4839 | 0.0041 |
| 0.693 | 0.6387 | 0.0543 |
| 0.778 | 0.8098 | 0.0318 |
| 0.817 | 0.8419 | 0.0249 |
| Average error = 0.02614 | ||
Based on the information provided, it can be concluded that the error between the experimental and predicted results is significantly low, indicating a high prediction accuracy of the model. The testing results closely align with the model's predictions. The values used in the modelling process were generated under similar conditions to those in the experimental method. Furthermore, the behaviour of the coefficient of friction (COF) in both the experimental and modelling work followed a similar pattern. It increased up to a 100 N load and then decreased at 200 N. This similarity suggests that the model accurately captured the relationship between the COF and the load conditions. Similarly, the roughness responses observed in both the modelling and experimental processes exhibited a similar pattern. The figures depicting these responses are shown in Fig. 13. Overall, the close alignment between the experimental and predicted results, as well as the similarities in the observed patterns for both the COF and roughness, indicate a high level of agreement between the model and the real-world behaviour of the system being studied.
5. Conclusion
• The research work aimed to investigate the tribological behavior of an Al–Co–Cr–Fe–Ni high entropy alloy in dry and different lubricating conditions.• The study found that using synthetic oil as a lubricant provided better performance compared to other lubricating conditions, as the coefficient of friction was minimized due to extended covalency and the presence of vacant orbitals, which interact strongly in synthetic oil.
• The study also observed that the wear rate under lubrication was lower compared to dry conditions when tested for 1 hour. The favourable wear resistance was achieved in synthetic oil due to abrasive wear alone and better surface roughness.
• In this study an artificial neural network (ANN)-based modelling (EvoNN) is used to validate the results. The accuracy of the trained model for the coefficient of friction was more than 94%, and for roughness, it was 98%.
• The study concludes that synthetic oil is an important lubrication medium for the Al–Co–Cr–Fe–Ni high entropy alloy. All the tribological properties were achieved under loading conditions, and the synthetic oil performed better than other lubricating media.
• The results of this study provide valuable insights into the development of high-performance lubricants for HEAs. By highlighting the benefits of synthetic oil and demonstrating the effectiveness of an ANN-based modeling approach, the research paves the way for future advancements in lubricant design and optimization, ultimately enhancing the tribological performance of HEAs in various industrial applications. The findings derived from the friction coefficient analysis indicate that the neural predictive model possesses the capability to serve as an effective predictor for the frictional and lubrication phenomena observed in the experimental applications associated with the journal bearing.42
Data availability
The code which is used in the modelling work is known as newmaster code, can be found at https://github.com/bashista1A/bashi_code with https://doi.org/10.1016/j.commatsci.2009.04.023, https://doi.org/10.1080/10426914.2014.984203, https://doi.org/10.2355/isijinternational.47.1195, https://doi.org/10.1201/9781003201045. The version of the code employed for this study is newmaster code. Data and processing scripts for this paper, including friction data are available at https://github.com/bashista1A/bashi_code. This study is carried out using self experiment data which are generated from the rotating disc Tribo tester experiments only. The data are provided in the manuscript.Conflicts of interest
The authors declare that they have no conflict of interest.Acknowledgements
The Council of Scientific and Industrial Research, New Delhi, provided funding for the current work (HCP-0042). The authors would like to express their sincere gratitude for the generous support provided by the Council of Scientific and Industrial Research, New Delhi. The financial assistance received from CSIR India played a crucial role in facilitating and advancing this research project. The authors acknowledge that CSIR's funding has been instrumental in conducting the study and has significantly contributed to the successful completion of this work.References
- M. C. Gao, J. W. Yeh, P. K. Liaw and Y. Zhang, High-entropy alloys, Springer International Publishing, Cham, 2016 Search PubMed.
- Y. Qiao, Y. Chen, F. H. Cao, H. Y. Wang and L. H. Dai, Int. J. Impact Eng., 2021, 158, 104008 CrossRef.
- Q. L. Niu, X. H. Zheng, W. W. Ming and M. Chen, Tribol. Trans., 2013, 56, 101–108 CrossRef CAS.
- Y. Geng, H. Tan, J. Cheng, J. Chen, Q. Sun, S. Zhu and J. Yang, Tribol. Int., 2020, 151, 106444 CrossRef CAS.
- Y. Yu, J. Wang, J. Li, J. Yang, H. Kou and W. Liu, J. Mater. Sci. Technol., 2016, 32(5), 470–476 CrossRef CAS.
- Y. Liu, et al. , Metall. Mater. Trans. A, 2016, 47(7), 3312–3321 CrossRef CAS.
- H. Duan, et al. , Wear, 2013, 297, 1045–1051 CrossRef CAS.
- S. Bhaumik, S. D. Pathak, S. Dey and S. Datta, Tribol. Int., 2019, 140, 105813 CrossRef.
- N. Chakraborti, Evolutionary data driven modeling, in Informatics for materials science and engineering, Butterworth-Heinemann, 2013 Search PubMed.
- K. Deb, Multi Objective optimization using Evolutionary Algorithms, John Wiley, Chi Chester, 2001 Search PubMed.
- F. Pettersson, A. Biswas, P. K. Sen, H. Saxén and N. Chakraborti, Mater. Manuf. Processes, 2009, 24, 320–330 CrossRef CAS.
- F. Pettersson, N. Chakraborti and H. A. Saxén, Appl. Soft Comput., 2007, 70, 387–397 CrossRef.
- A. S. Mohammed, S. Dodla, J. K. Katiyar and M. A. Samad, Proc. Inst. Mech. Eng., Part J, 2023, 237(4), 943–953 CrossRef.
- D. K. Prajapati, D. Ahmad, J. K. Katiyar, C. Prakash and R. M. Ajaj, Surf. Topogr.: Metrol. Prop., 2023, 11(3), 035006 CrossRef.
- D. K. Prajapati, J. K. Katiyar and C. Prakash, Ind. Lubr. Tribol., 2023, 75(9), 1022–1030 CrossRef.
- B. K. Mahanta and N. Chakraborti, Steel Res. Int., 2018, 89(9), 1800121 CrossRef.
- N. Chakraborti, Applications of Metaheuristics in Process Engineering, Springer, Cham, 2014 Search PubMed.
- B. K. Mahanta, S. Sarkar, P. K. Sen and N. Chakraborti, Can. Metall. Q., 2022, 61(1), 1–13 CrossRef CAS.
- A. Agarwal, F. Pettersson, A. Singh, C. S. Kong, H. Saxén, K. Rajan, S. Iwata and N. Chakraborti, Mater. Manuf. Processes, 2009, 24(3), 274–281 CrossRef CAS.
- B. K. Mahanta and N. Chakraborti, Mater. Manuf. Processes, 2020, 35(6), 677–686 CrossRef CAS.
- J. K. Katiyar, S. K. Sinha and A. Kumar, Wear, 2016, 362–363, 199–208 CrossRef CAS.
- V. Goyal, S. K. Sharma and B. V. M. Kumar, Mater. Today: Proc., 2015, 2(4–5), 1082–1091 CAS.
- E. Zanoria, S. Danyluk and M. McNallan, Wear, 1995, 181, 784–789 CrossRef.
- S. Samion, M. I. Ibrahim, N. A. C. Sidik and M. N. M. Jaafar, J. Teknol., 2014, 66(1), 53 Search PubMed.
- C. F. Tu and T. Fort, Tribol. Int., 2004, 37(9), 701–710 CrossRef CAS.
- T. C. Ing, A. K. Mohammed Rafiq, Y. Azli and S. Syahrullail, Tribol. Trans., 2012, 55(5), 539–548 CrossRef CAS.
- A. W. Batchelor and G. W. Stachowiak, Tribology in materials processing, J. Mater. Process. Technol., 1995, 48(1–4), 503–515 CrossRef.
- J. Yan, H. M. Lien and F. Mangolini, Orthoborate Ionic Liquids, 2023 Search PubMed.
- R. Lu, H. Nanao, K. Kobayashi, T. Kubo and S. Mori, J. Jpn. Pet. Inst., 2010, 53(1), 55–60 CrossRef CAS.
- S. M. Hsu, Tribol. Int., 2004, 37(7), 553–559 CrossRef CAS.
- J. M. Martin, C. Grossiord, K. Varlot, B. Vacher and J. Igarashi, Tribol. Lett., 2000, 8, 193–201 CrossRef CAS.
- S. M. Hsu and R. S. Gates, Tribol. Int., 2005, 38(3), 305–312 CrossRef CAS.
- S. Zhang, Y. Qiao, Y. Liu, L. Ma and J. Luo, Friction, 2019, 7, 372–387 CrossRef.
- A. A. Khan and M. S. Kaiser, Res. Eng. Struct. Mater., 2023, 9(1), 1–18 Search PubMed.
- P. L. Menezes and S. V. Kailas, J. Mater. Process. Technol., 2008, 208(1–3), 372–382 CrossRef CAS.
- B. K. Mahanta, R. Jha and N. Chakraborti, in Machine Learning in Industry, Springer, Cham, 2022, 47–81 Search PubMed.
- N. Chakraborti in Computational Approaches to Materials Design: Theoretical and Practical Aspects, IGI Global, Hershey, 2016 Search PubMed.
- R. Jha, F. Pettersson, G. S. Dulikravich, H. Saxen and N. Chakraborti, Mater. Manuf. Processes, 2015, 30(4), 488–510 CrossRef CAS.
- S. Roy, A. Dutta and N. Chakraborti, Comput. Mater. Sci., 2021, 190, 110258 CrossRef CAS.
- J. Tiwari, B. K. Mahanta, H. Krishnaswamy, S. Devadula and M. A. Amirthalingam, Met. Mater. Int., 2023, 29(8), 2287–2303 CrossRef.
- B. K. Mahanta, P. Gupta, I. Mohanty, T. K. Roy and N. Chakraborti, Digit. Chem. Eng., 2023, 7, 100094 CrossRef.
- E. Durak, Ö. Salman and C. Kurbanoğlu, Ind. Lubr. Tribol., 2008, 60(6), 309–316 CrossRef.
| This journal is © The Royal Society of Chemistry 2024 |

