 Open Access Article
AMPERE: automated modular platform for expedited and reproducible electrochemical testing†
Jehad
Abed‡
 ab,
Yang
Bai‡
 b,
Daniel
Persaud
 a,
Jiheon
Kim
b,
Julia
Witt
 c,
Jason
Hattrick-Simpers
 *a and
Edward H.
Sargent
 *b
*b
aDepartment of Materials Science and Engineering, University of Toronto, 184 College Street, Toronto, Ontario M5S 3E4, Canada. E-mail: jason.hattrick.simpers@utoronto.ca
bDepartment of Electrical and Computer Engineering, University of Toronto, 35 St George Street, Toronto, Ontario M5S 1A4, Canada. E-mail: ted.sargent@utoronto.ca
cDivision of Material and Surface Technologies, Bundesanstalt für Materialforschung und -prüfung (BAM), Unter den Eichen 87, 12205 Berlin, Germany
First published on 26th September 2024
Abstract
Rapid and reliable electrochemical screening is critical to accelerate the development of catalysts for sustainable energy generation and storage. This paper introduces an automated and modular platform for expedited and reproducible electrochemical testing (AMPERE), designed to enhance the efficiency and reliability of multivariate optimization. The platform integrates a liquid-handling robot with custom-made modular array reactors, offering sample preparation and electrochemical testing in the same platform. Additionally, we use offline inductively coupled plasma optical emission spectroscopy (ICP-OES) to measure metal concentrations in the electrolyte after the reaction, which serves as a proxy for assessing the electrochemical stability. We use the platform to conduct 168 experiments continuously in less than 40 hours to examine the influence of catalyst ink formulation on the performance of Ir, Ru, IrO2, and RuO2 for the oxygen evolution reaction (OER) in acid. We specifically investigate the role of solvent type and concentration, catalyst concentration, and binder content on the performance. We find that Ru/RuO2 catalysts show improvements in activity that are not directly linked to improvements in the electrochemical surface area or inversely correlated to Ru dissolution. This suggests a complex interplay between the catalytic performance of the drop-casted catalyst film and ink formulation. AMPERE simplifies catalyst preparation and testing at large scale, making it faster, more reliable, and accessible for widespread use.
Introduction
Automated platforms, designed for continuous operation and parallel execution of experiments, are playing a pivotal role in advancing materials design. By minimizing human intervention in repetitive and non-cognitive tasks, these platforms enhance the throughput and reproducibility of large-scale experiments.1,2 As a result, the application of such platforms has seen a significant increase across various materials domains. They have been effectively employed in the study of conjugated polymers,3 photovoltaic thin films,4 as well as oxides and phosphates.2Accelerated electrochemical testing is gaining popularity as the global demand for energy storage and generation fuels interest in novel materials. However, the development of an electrochemical testing platform is a complex, multifaceted challenge that necessitates the simultaneous consideration of three fundamental design principles: miniaturization, parallelization, and automation.5–7 For instance, miniaturization was demonstrated by Gregoire et al., using a scanning droplet cell to sequentially scan (photo)electrochemical properties of a combinatorial composition library.8 This approach has shown that reducing scale can improve the efficiency of electrochemical testing achieving a throughput of 4 seconds per sample. Additionally, Gerroll et al. developed an electrochemical platform capable of running independent experiments in parallel each under unique conditions. The electrochemical cell array, dimensioned to match a 96-well plate, was used to study reproducibility through collecting cyclic voltammograms of common redox systems.9 Furthermore, Oh et al. devised an automated platform integrating a liquid-handling robot and microfabricated electrodes to streamline the characterization of redox-active electrolytes.10 Despite these advancements, the widespread application remains a challenge due to the specific expertise required to construct and operate these platforms (more information in Table S1 in the ESI†). One major hurdle is that commercially available instruments are costly and often restrict the implementation and customization of proprietary software and hardware for specific applications.11 As a result, research groups often resort to customizing more affordable equipment. However, these custom setups are complex and pose challenges in replication and knowledge transfer.12 For instance, while miniaturization can reduce experimental costs and accelerate testing, it can also amplify the impact of small experimental artifacts and disturbances, thereby posing challenges to the reproducibility of experiments and creating a gap with large scale testing.13
To address these challenges, we introduce AMPERE, an automated modular platform for expedited and reproducible electrochemical testing. The platform employs a liquid-handling robot to blend liquid solvents with catalyst powders to create inks, and to accurately dispense ink droplets on a substrate to form catalyst films when dried. These films are prepared in custom-made modular array reactors which are designed to allow both sample preparation and electrochemical testing in one place, thereby eliminating the need for additional parts and steps to transfer samples between different platforms. The reactors are simple to build and replicate. They can be manufactured using a bench-top CNC mill or a stereolithographic (SLA) 3D printer, making this platform readily adoptable by other labs. They offer the flexibility of utilizing individual cells in the array independently accommodating different sample preparation methods and electrochemical testing conditions. This streamlined sample preparation and testing process minimizes potential inconsistencies in samples, which is a crucial aspect especially when the preparation method has a significant influence on the performance of the catalyst. For example, the method of preparing powdered catalysts, with various chemical (e.g., composition, structure) and physical (e.g., morphology, wettability) properties, for electrochemical testing can lead to notable differences in observed activity, complicating comparisons across different studies. Stability is another crucial performance metric significantly influenced by sample preparation. However, the relationship between sample preparation and stability has been less explored in research. Automated platforms can effectively tackle the multivariant challenge of sample preparation. Here, we use the platform to optimize catalyst ink formulations for the oxygen evolution reaction (OER) in acid. In particular, we screen different catalyst ink formulations varying catalyst loading, binder (Nafion) weight, solvent type and volume to understand the relationship between sample preparation and the dissolution of Ru and Ir metals. The platform improves the consistency of sample preparation and electrochemical testing, rather than eliminating all experimental variability in results. By standardizing equipment, testing protocols, and sample preparation, we minimize discrepancies caused by experimental setup and ensure a high level of reproducibility across different testing scenarios.
Experimental setup
Description of the platform
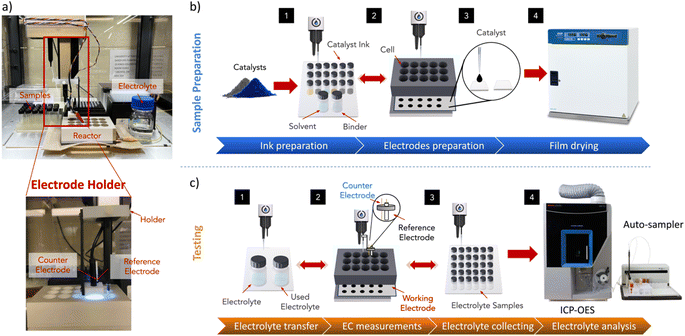
The platform consists of a liquid handling robot (Opentrons OT-2), a potentiostat (Biologic VSP-3e), array reactors, and an electrode holder (see S1: system overview in the ESI and Fig. S1 and Table S2 for more information†). We utilized the OT-2 system for its ease of setup and Python API compatibility; however, other similar systems can also be used. The array reactor in this work is made through CNC milling of a PEEK block due to its excellent chemical stability (see S2: reactor design in the ESI†). Otherwise, the reactor could also be easily 3D printed using a suitable printing material and resolution. The reactor has 15 wells arranged in a uniform 5 × 3 grid (Fig. S2–S4†). The design of the reactor can be tailored to suit the specific requirements of the experiment. It can be configured to have identical well shapes and a uniform arrangement, or alternatively, the wells can be arranged in any configuration that works best for the specific application (Fig. S5 and S6†).The reactor is composed of two main components: a top piece carved with multiple reaction wells, and a base plate made with grooves to house one or more substrates. These two parts are sandwiched together using bolts and magnets, forming a single reactor structure.
Each well in the reactor has a maximum volume capacity of 5 mL. At the bottom of each well is a small round opening with a 5 mm diameter (0.196 cm2). These wells serve a dual purpose: they facilitate drop-casting for sample preparation on the substrate and allow the electrolyte to interact with the sample surface for electrochemical measurements. A holder carrying reference and counter electrodes was fabricated and attached to the pipette head of the OT-2 to move electrodes between wells for electrochemical testing (Fig. S7, see S3: electrode holder design in the ESI†). Argon gas is bubbled near the surface of the catalyst through a tube secured by the holder, which helps in reducing bubble formation on the surface and mildly agitates the solution, thereby reducing mass transport. To reduce cross-contamination, our electrodes are washed between experiments by immersing them repeatedly in a nitric acid solution followed by DI water, reducing residual metal contaminants (see S5: electrode washing protocol in the ESI†).
We employ this platform to prepare films of Ir, IrO2, Ru, and RuO2 nanopowders, with varying ink formulations (see S6: materials in the ESI†). We then study the impact of these variations on their performance under oxygen evolution reaction (OER) conditions in an acidic environment. AMPERE oversees all related tasks, including dispensing solvents, drop-casting, electrolyte transfer, electrochemical measurements, and waste electrolyte collection (Fig. 1). However, tasks such as powder weighing, ink sonication, catalyst drying, and ICP-OES measurements are performed separately, offline (Fig. S12, see S7: powder weighing and ink preparation in the ESI†).
Electrochemical testing
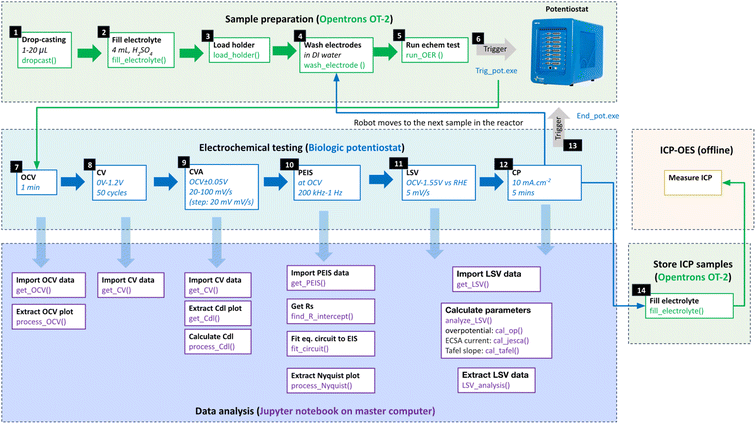
An automated multi-step electrochemical protocol was employed to measure OER performance (Fig. 2 and S9†). All samples are immersed in acid for 30 minutes before testing, with subsequent samples subjected to longer durations due to the sequential nature of the test. The protocol begins with conditioning the sample's surface chemically at open circuit voltage (OCV) for 1 minute and measuring the potential under equilibrium conditions. This is followed by a cyclic voltammetry advanced (CVA) step to collect cyclic voltammetry (CV) plots on the as-prepared samples in a non-faradaic voltage window bounded by [OCV − 0.05] V to [OCV + 0.05] V, with voltage sweep rates varying from 20 mV s−1 to 100 mV s−1 in 20 mV s−1 increments. This step measures the capacitive current to estimate the electrochemical surface area (ECSA) before the reaction. Subsequently, electrochemical impedance spectroscopy (EIS) is taken from 200 kHz to 1 Hz at OCV to extract the solution resistance (Rs). Linear sweep voltammetry (LSV) is then conducted from 1 V to 1.65 V vs. RHE, using a scan rate of 5 mV s−1, to prepare polarization curves. The overpotential (OP) taken at 10 mA cm−2 was used to determine the OER activity of the samples. Finally, chronopotentiometry (CP) is used to hold the current density at 10 mA cm−2 to evaluate short-term stability. Electrolyte samples were then collected for ICP-OES measurement. Additional details regarding robot-potentiostat integration and other experimental setup details can be found in the ESI (see S4: potentiostat connection in the ESI†).Results and discussion
Verification of electrochemical reproducibility in reactor cells
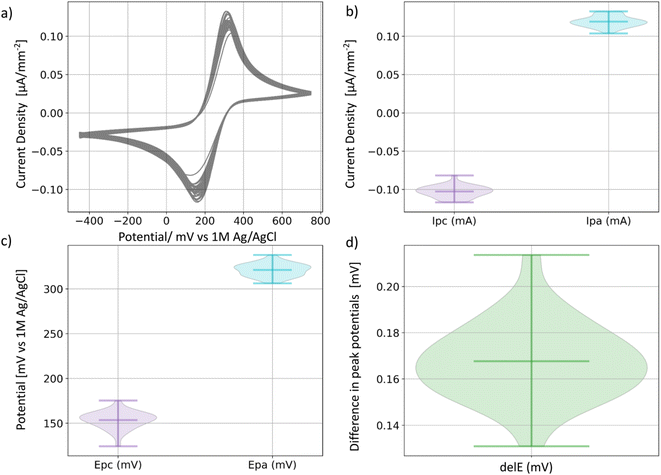
To ensure the consistency and reliability of results from the reactor cells, we conducted 30 CVs tests (2 per cell) on potassium ferricyanide (K3Fe(CN)6), a redox reagent known for its support of reversible one-electron transfers. We used a setup comprising a platinum wire counter electrode, a 1 M Ag/AgCl reference electrode paired with a fluorine-doped tin oxide (FTO)-coated glass working electrode. The potential was systematically swept from −450 mV to 450 mV, enabling the transfer of electrons within the K3Fe(CN)6 solution (Fig. 3a). FTO is expected to maintain its inert behavior throughout the process, so the observed electrochemical behavior of the redox reagent solely results from the redox reaction of the K3Fe(CN)6 solution.All 30 CVs display reversible electron transfer, with an average anodic peak potential at 321 mV ± 7 mV and an average cathodic peak potential at 154 mV ± 10 mV (Fig. 3c) and an average separation of 167 mV ± 17 mV (Fig. 3d), consistent with the Fe(CN)63−/Fe(CN)64− transition. Furthermore, the variation of the peak current densities between runs is only ±8 μA, demonstrating current density measurement reliability.
The impact of substrate on deposition quality and reliability
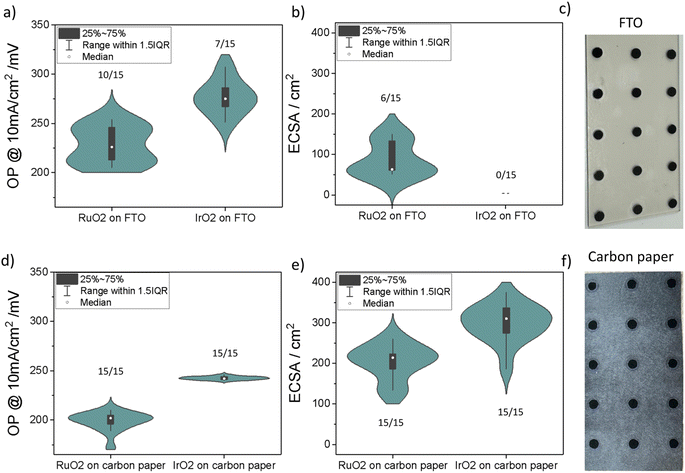
Two of the widely used substrate options for OER testing, FTO glass and carbon paper, were considered for this work. The measurements were performed using commercially available IrO2 and RuO2 powders, which are commonly used catalysts for acidic OER (Table S3, see S6: materials in the ESI†). Fifteen electrochemical measurements were carried out for each sample to study sample preparation reliability on FTO compared to carbon paper. In total, 60 measurements were completed within 5 hours. Subsequent data extraction and analysis were carried out using a Jupyter notebook (refer to https://github.com/Jehadabed/AMPERE.git).Upon initial visual inspection, the deposited films before electrochemical testing on both substrates appeared intact, even after rinsing with DI water, maintaining a round shape with a consistent area of ca. 0.196 cm2 for all spots (Fig. 4c and f). However, during electrochemical testing, we observed that intense bubbling occasionally led to the detachment of the catalyst layer on the FTO glass, with instances of it floating in the electrolyte. In contrast, the catalyst layer remained intact on the carbon paper due to the strong adhesion of particles to the fibers. The values on each of the violin plots in Fig. 4 represent the number of successful electrochemical measurements. Carbon paper showed 100% success rates for both RuO2 and IrO2, while FTO had significantly lower rates, 66% for RuO2 and 47% for IrO2.
The median overpotential of RuO2 at 10 mA cm−2 on FTO (226 mV) and carbon paper (202 mV) were both lower than respective overpotentials for IrO2 on FTO (275 mV) and carbon paper (242 mV), which agrees with the literature. Notably, both materials demonstrate lower OP values on carbon paper compared to their counterparts on FTO glass. This observation is attributed to the increased roughness of carbon paper, leading to higher ECSA (Fig. 4b and e). Furthermore, the OP distributions for RuO2 and IrO2 samples on carbon paper are generally narrower than those prepared on FTO glass. This suggests that FTO introduces additional variability in measurements between experiments. As a result, we found that using FTO as a substrate for drop-casted films results in erroneous measurements lowering the success rate.
Another substrate commonly used for standard testing and ECSA measurement is glassy carbon. When we conducted the same study on glassy carbon (Fig. S13†), we found that the average overpotentials were similar to those on carbon paper, approximately 200 mV for RuO2 and 260 mV for IrO2, but the ECSA values were significantly lower, around 50 cm2 for RuO2 and 100 cm2 for IrO2, compared to 200 cm2 and 300 cm2 on carbon paper. This is attributed to the smoother surface of glassy carbon versus the fibrous surface of carbon paper which increases ECSA. However, a major issue with glassy carbon was the significant measurement errors caused by excessive oxygen bubbling at high current densities, which adhered to the electrode surface. Additionally, glassy carbon electrodes are expensive, not entirely inert under high current densities, and fragile, complicating their integration in our custom-made reactors.14 They also require frequent polishing to maintain a clean substrate interface for subsequent material depositions, which is not ideal for our high-throughput testing. This led us to conclude that glassy carbon may not be the most suitable substrate for our platform.
Finally, we observed that the use of the carbon paper led to a slow leakage of the electrolyte through the paper and out of the reactor over several hours due to its porous and hydrophilic nature. To address this issue, we used a secondary hydrophobic carbon paper and placed it beneath the hydrophilic paper to prevent leaks. This double carbon paper substrate was used for all subsequent experiments in this work.
The impact of ink formulation on reproducibility of measurements
Having identified an appropriate substrate for reproducible testing, we then focused on tuning the ink formulation. This critical step significantly impacts the properties of the deposited film and thereby the overall activity–stability behavior of the catalyst. We considered factors including the type and concentration of the solvent, catalyst concentration, and binder (Nafion) concentration (Table 1).| # | Experimental variable | Solvent type | Organic solvent concentration, % v/v | Catalyst concentration, mg mL−1 solvent | Binder (Nafion) concentration, μL mL−1 solvent |
|---|---|---|---|---|---|
| 1 | Solvent type | IPA/ethanol![[thin space (1/6-em)]](https://www.rsc.org/images/entities/char_2009.gif) : :![[thin space (1/6-em)]](https://www.rsc.org/images/entities/char_2009.gif) water water |
20 | 20 | 40 |
| 2 | Solvent concentration | Ethanol![[thin space (1/6-em)]](https://www.rsc.org/images/entities/char_2009.gif) : :![[thin space (1/6-em)]](https://www.rsc.org/images/entities/char_2009.gif) water water |
10 | 20 | 40 |
| 20 | |||||
| 30 | |||||
| 3 | Catalyst concentration | Ethanol![[thin space (1/6-em)]](https://www.rsc.org/images/entities/char_2009.gif) : :![[thin space (1/6-em)]](https://www.rsc.org/images/entities/char_2009.gif) water water |
20 | 10 | 40 |
| 20 | |||||
| 30 | |||||
| 40 | |||||
| 4 | Binder (Nafion) concentration | Ethanol![[thin space (1/6-em)]](https://www.rsc.org/images/entities/char_2009.gif) : :![[thin space (1/6-em)]](https://www.rsc.org/images/entities/char_2009.gif) water water |
20 | 20 | 20 |
| 40 | |||||
| 80 |
The first parameter we decided to investigate was the choice of organic solvent in water, specifically ethanol and isopropanol (IPA). Organic solvents are added to improve nanoparticle dispersion, reduce surface tension, and increase the wettability of surfaces. We observed by eye that all catalysts – Ir, Ru, IrO2, and RuO2 – demonstrated improved particle dispersion in an IPA/water mixture. This can be attributed to the slightly higher viscosity of IPA (ca. 2 mPa s) compared to ethanol (ca. 1 mPa s) at 20 °C.15,16 In general, particles disperse more easily in a lower-viscosity solvent because the particles can move more freely, however, a higher-viscosity solvent may help prevent the particles from settling out of the solution due to gravity. Therefore, the slightly higher viscosity of IPA could keep the catalyst particles suspended in the solution longer than ethanol producing more uniform films. However, we noted that upon application, IPA caused the solution to quickly permeate and exit the carbon paper, resulting in significant measurement errors in overpotential compared to ethanol (Fig. S14†). Given these observations, we chose ethanol as the solvent for the subsequent optimization experiments.
We then investigated the influence of ethanol![[thin space (1/6-em)]](https://www.rsc.org/images/entities/char_2009.gif) :
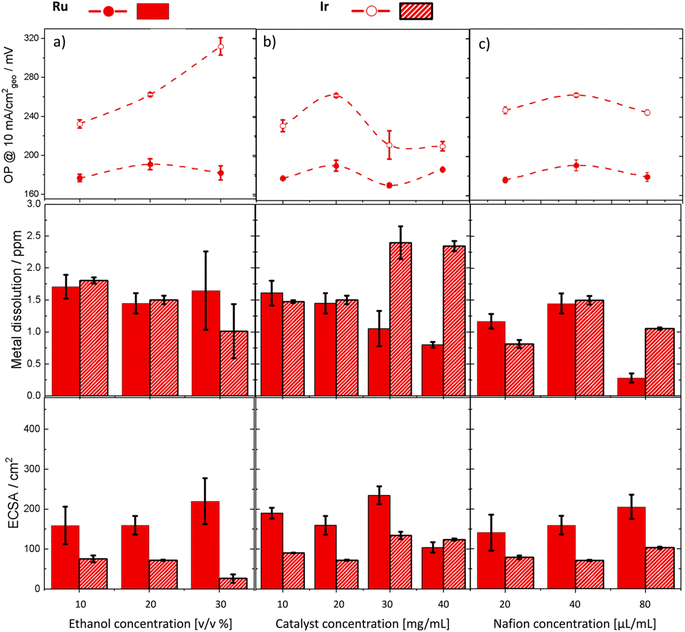
:![[thin space (1/6-em)]](https://www.rsc.org/images/entities/char_2009.gif) water concentration (volume/volume%) on the performance of Ru and Ir metals (Fig. 5a). For Ir, increasing ethanol concentration reduced the electrochemical surface area (ECSA), which correspondingly reduced the number of active sites available for the reaction. This resulted in higher overpotentials and lower Ir dissolution. On the other hand, the overpotential of Ru increased slightly as ethanol concentration was increased from 10–20% but then dropped again between 20–30%. Activity improvements were accompanied by increased metal dissolution for Ru. Moreover, we noted larger measurement errors at 30% ethanol for both Ir and Ru. This is attributed to the increased penetration of catalyst ink at high ethanol concentration through the carbon paper, making it challenging to maintain a uniform mass loading of the catalyst on the surface. Further investigations focused on the effects of catalyst concentration on performance (Fig. 5b). Both Ru and Ir metals exhibited a stepwise increase in activity when the catalyst concentration was increased from 20 to 30 mg mL−1. However, increasing the catalyst concentration beyond this point did not yield further improvements. This trend was paralleled by a similar increase in ECSA for both metals, which accounted for the observed activity improvements. Interestingly, Ru dissolution decreased significantly with increased catalyst concentration, deviating from the expected inverse activity–stability behavior. At concentrations above 30 wt%, Ir dissolution was notably higher than that of Ru. In the last experiment, we adjusted the Nafion content (Fig. 5c). Nafion concentrations had a subtle impact on overpotential for both Ir and Ru. However, increasing Nafion concentration for Ru significantly reduced the dissolution rate of the metal potentially due to enhanced binding of the catalyst to the substrate. Nonetheless, striking a balance in Nafion content is necessary as insufficient Nafion can lead to poor catalyst adhesion and potential detachment under strong oxygen bubbling, while excessive Nafion can obstruct catalytic active sites.
water concentration (volume/volume%) on the performance of Ru and Ir metals (Fig. 5a). For Ir, increasing ethanol concentration reduced the electrochemical surface area (ECSA), which correspondingly reduced the number of active sites available for the reaction. This resulted in higher overpotentials and lower Ir dissolution. On the other hand, the overpotential of Ru increased slightly as ethanol concentration was increased from 10–20% but then dropped again between 20–30%. Activity improvements were accompanied by increased metal dissolution for Ru. Moreover, we noted larger measurement errors at 30% ethanol for both Ir and Ru. This is attributed to the increased penetration of catalyst ink at high ethanol concentration through the carbon paper, making it challenging to maintain a uniform mass loading of the catalyst on the surface. Further investigations focused on the effects of catalyst concentration on performance (Fig. 5b). Both Ru and Ir metals exhibited a stepwise increase in activity when the catalyst concentration was increased from 20 to 30 mg mL−1. However, increasing the catalyst concentration beyond this point did not yield further improvements. This trend was paralleled by a similar increase in ECSA for both metals, which accounted for the observed activity improvements. Interestingly, Ru dissolution decreased significantly with increased catalyst concentration, deviating from the expected inverse activity–stability behavior. At concentrations above 30 wt%, Ir dissolution was notably higher than that of Ru. In the last experiment, we adjusted the Nafion content (Fig. 5c). Nafion concentrations had a subtle impact on overpotential for both Ir and Ru. However, increasing Nafion concentration for Ru significantly reduced the dissolution rate of the metal potentially due to enhanced binding of the catalyst to the substrate. Nonetheless, striking a balance in Nafion content is necessary as insufficient Nafion can lead to poor catalyst adhesion and potential detachment under strong oxygen bubbling, while excessive Nafion can obstruct catalytic active sites.
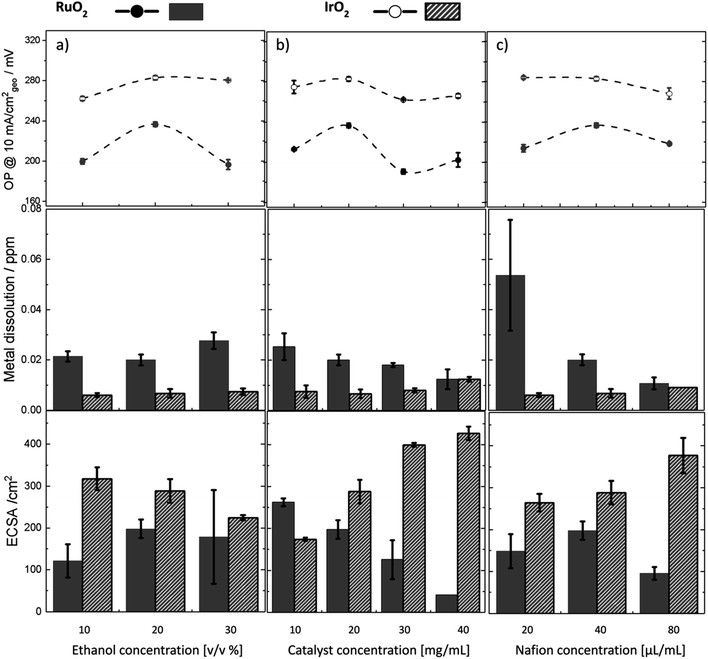
The same set of experiments conducted on IrO2 and RuO2 samples (Fig. 6) revealed lower metal dissolution values for oxides (0.02–0.08 ppm) compared to metals (0.2–2.5 ppm). This is because metals undergo oxidation during the OER and are more susceptible to structural reconstruction and dissolution. Throughout all experiments, Ir dissolution in IrO2 remained consistently lower than that for RuO2 and was almost insensitive to changes in experimental parameters, indicating inherent stability as expected. Increasing the ethanol concentration for IrO2 (Fig. 6a) led to a reduction in ECSA and consequently, an increase in overpotential similar to Ir. However, the changes in overpotential for IrO2 were smaller, and its ECSA (ca. 300 cm2) was significantly larger—five times that of Ir metal (ca. 60 cm2). The minimal change in overpotential can likely be attributed to the inherently stable and porous nature of the IrO2 compared to Ir. In contrast, variations in ethanol concentration for RuO2 resulted in larger changes in overpotential, but these did not correspond with improvements in ECSA and were accompanied by significant measurement errors. Upon increasing the catalyst concentration for IrO2 and RuO2 (Fig. 6b), we observed improved activity at a concentration of 20–30 mg mL−1 for both samples. However, the activity improvement for RuO2 was not accompanied by ECSA improvement again. These observations suggest that activity improvements in RuO2 might not necessarily be linked to ECSA. Moreover, we observed that the metal dissolution for RuO2 decreased as activity improved, mirroring the trend seen in the Ru metal, which is not following a typical activity–stability inverse trend. Lastly, the impact of Nafion content on stability was more significantly seen for RuO2 than for IrO2 (Fig. 6c). Higher amounts of Nafion led to a substantial reduction in Ru dissolution and decreased measurement errors, indicating a stabilizing effect of Nafion similar to Ru metal.
To better understand how catalysts perform and degrade under operational conditions, we performed ECSA analysis on all materials (prepared using formulation #1 with ethanol from Table 1) before and after activity and stability tests (Fig. S15–S20†). Our findings revealed that Ir exhibited the most significant change in ECSA, whereas IrO2 remained relatively stable (Fig. S15†). Also, RuO2 exhibited small changes in ECSA akin to IrO2, while Ru showed large ECSA changes comparable to those of Ir. This aligns with the expectation that oxides are more stable under OER, whereas metals are susceptible to oxidation. Further analysis was conducted on Ir and IrO2 due to their contrasting ECSA behaviors. Post-reaction XRD analysis showed that both Ir and IrO2 retained their structure with some peak broadening observed for IrO2 which is likely due to structural reconstruction during the reaction (Fig. S16†). SEM images showed no major morphological changes, indicating that the ECSA variations during the reaction in Ir were primarily due to surface oxidation (Fig. S17–S20†). While we anticipate material reconstruction to occur during the reaction, particularly on the surface, these bulk characterization techniques provide limited insight into the influence of ink formulation on the structure and morphology of the surface. A deeper investigation into how the ink formula influences the catalyst post-reaction would be insightful but is beyond the scope of this study.
Discussion
This study introduces an automated and modular electrochemistry platform designed to streamline the execution of labor-intensive experiments. Constructed using commercially available systems like Opentrons and operated through open source code, this platform is readily accessible to researchers, allowing them to divert their attention from repetitive tasks to more intellectually challenging aspects of their work. The platform incorporates offline ICP measurements to assess metal dissolution as a proxy for electrochemical stability, offering a method that is less resource-intensive compared to inline ICP measurements.Using this platform, we conducted a comprehensive analysis that, to the best of our knowledge, is the first to explore the effects of ink formulation on catalyst activity and stability in such depth. Our systematic investigation involved ten different ink formulations applied to four materials, with each combination tested three times on duplicated samples. This resulted in a total of 120 experiments, in addition to the tests that were done on FTO glass substrate and using different ink solvent mixtures. Our findings reveal that the activity and stability of Ir, Ru, RuO2, and IrO2 catalysts in acidic OER are significantly influenced by factors such as particle dispersion in the ink, catalyst mass loading, and Nafion content. In general, we found that activity ranking Ru > RuO2 > Ir > IrO2 and metal dissolution trend Ir/Ru ≫ RuO2 > IrO2 across all ink formulations to be consistent with the literature.17–19
This work also emphasizes how variations in ink formulation can influence interpretations of activity and stability of catalysts on porous carbon substrates. Increasing the catalyst concentration, RuO2 demonstrated improvements in catalytic activity that were not directly linked to an increase in the ECSA or inversely correlated to Ru dissolution. This was not observed for Ir/IrO2 catalysts, where activity and Ir dissolution showed a typical positive correlation between activity and ECSA, alongside an inverse correlation between activity and stability, as we expect. The behavior observed in RuO2 could potentially be attributed to external factors such as bubble dynamics, physical properties, or surface reconstruction. Varying any of the ink formulation parameters can change the thickness, spread, and roughness of the catalyst film. This, in turn, can affect how oxygen bubbles interact with the surface resulting in activity variations.20
These observations strongly suggest that different drop-casted materials may display varying trends due to the complex interplay between the catalyst and ink formulation. This is becoming vital for interpreting catalytic stability, as it implies that reduced metal dissolution might not necessarily reflect inherent material stability. For instance, at higher catalyst concentrations, both RuO2 and IrO2 displayed similar metal dissolution amounts, which suggests similar apparent stability for both materials during short electrochemical tests (several hours), even though IrO2 is known to be inherently more stable. This emphasizes the need for detailed electrochemical studies on the impact of ink formulation before drawing conclusions about the activity–stability trends in drop-casted catalysts.
Looking ahead, we plan to enhance the platform's capabilities by incorporating multiple potentiostat channels connected to multiple electrode holders to parallelize experiments. This enhancement could significantly increase throughput by at least eight times (see S5: parallel testing in the ESI†). We also aim to use a modified design of the electrode holder that could be picked up and dropped off automatically to enable seamless transitions between the liquid pipette (used for sample preparation) and electrode measurements, moving towards a fully autonomous workflow integrated with active learning tools. Additionally, to address mass transport and bubble accumulation on the surface, we are considering the integration of a sonicator with the electrochemical reactor to assist with bubble removal. We anticipate that this platform will serve as a valuable tool for various electroanalysis and electrosynthesis studies in the future, contributing significantly to advancements in the field.
Data availability
The data that support the findings of this study are openly available in Github repository: https://github.com/Jehadabed/AMPERE.git.Conflicts of interest
The authors declare no competing financial interests.Acknowledgements
J. A. acknowledges the Natural Sciences and Engineering Research Council (NSERC) of Canada under a Vanier Canada Graduate Scholarship (grant no. 705992). The authors also acknowledge support from the Alliance for AI-Accelerated Materials Discovery (A3MD), which includes funding from Total Energies SE., Meta, Microsoft, and LG AI Research. This research is part of the StoRIES project, which has received funding from the European Union's Horizon 2020 research and innovation programme under grant agreement No. 101036910. We would like to acknowledge Mr Damir Kopilovic from the University of Toronto for his substantial contributions to the engineering design of the reactor and other components throughout the implementation phases of our project.References
- B. Burger, P. M. Maffettone, V. V. Gusev, C. M. Aitchison, Y. Bai, X. Wang, X. Li, B. M. Alston, B. Li, R. Clowes, N. Rankin, B. Harris, R. S. Sprick and A. I. Cooper, Nature, 2020, 583(7815), 237–241 CrossRef CAS PubMed.
- N. J. Szymanski, B. Rendy, Y. Fei, R. E. Kumar, T. He, D. Milsted, M. J. McDermott, M. Gallant, E. D. Cubuk, A. Merchant, H. Kim, A. Jain, C. J. Bartel, K. Persson, Y. Zeng and G. Ceder, Nature, 2023, 624(7990), 86–91 CrossRef CAS PubMed.
- Y. Bai, L. Wilbraham, B. J. Slater, M. A. Zwijnenburg, R. S. Sprick and A. I. Cooper, J. Am. Chem. Soc., 2019, 141, 9063–9071 CrossRef CAS PubMed.
- Z. Liu, N. Rolston, A. C. Flick, T. W. Colburn, Z. Ren, R. H. Dauskardt and T. Buonassisi, Joule, 2022, 6, 834–849 CrossRef CAS.
- T. H. Muster, A. Trinchi, T. A. Markley, D. Lau, P. Martin, A. Bradbury, A. Bendavid and S. Dligatch, Electrochim. Acta, 2011, 56, 9679–9699 CrossRef CAS.
- P. J. McGinn, Mater. Discovery, 2015, 1, 38–53 CrossRef.
- T. H. Muster, A. Trinchi, T. A. Markley, D. Lau, P. Martin, A. Bradbury, A. Bendavid and S. Dligatch, Electrochim. Acta, 2011, 56, 9679–9699 CrossRef CAS.
- J. M. Gregoire, C. Xiang, X. Liu, M. Marcin and J. Jin, Rev. Sci. Instrum., 2013, 84(2) DOI:10.1063/1.4790419/361146.
- B. H. R. Gerroll, K. M. Kulesa, C. A. Ault and L. A. Baker, ACS Meas. Sci. Au, 2023, 3, 371–379 CrossRef CAS PubMed.
- I. Oh, M. A. Pence, N. G. Lukhanin, O. Rodríguez, C. M. Schroeder and J. Rodríguez-López, Device, 2023, 1, 100103 CrossRef.
- R. Pollice, G. Dos Passos Gomes, M. Aldeghi, R. J. Hickman, M. Krenn, C. Lavigne, M. Lindner-D’Addario, A. Nigam, C. T. Ser, Z. Yao and A. Aspuru-Guzik, Acc. Chem. Res., 2021, 54, 849–860 CrossRef CAS PubMed.
- J. Wagner, C. G. Berger, X. Du, T. Stubhan, J. A. Hauch and C. J. Brabec, J. Mater. Sci., 2021, 56, 16422–16446 CrossRef CAS.
- D. A. Leins, S. B. Haase, M. Eslami, J. Schrier and J. T. Freeman, Digital Discovery, 2023, 2, 12–27 RSC.
- J. Edgington, A. Deberghes and L. C. Seitz, ACS Appl. Energy Mater., 2022, 5, 12206–12218 CrossRef CAS.
- F. M. Pang, C. E. Seng, T. T. Teng and M. H. Ibrahim, J. Mol. Liq., 2007, 136, 71–78 CrossRef CAS.
- I. S. Khattab, F. Bandarkar, M. A. A. Fakhree and A. Jouyban, Korean J. Chem. Eng., 2012, 29, 812–817 CrossRef CAS.
- S. Cherevko, S. Geiger, O. Kasian, N. Kulyk, J. P. Grote, A. Savan, B. R. Shrestha, S. Merzlikin, B. Breitbach, A. Ludwig and K. J. J. Mayrhofer, Catal. Today, 2016, 262, 170–180 CrossRef CAS.
- N. Danilovic, R. Subbaraman, K. C. Chang, S. H. Chang, Y. J. Kang, J. Snyder, A. P. Paulikas, D. Strmcnik, Y. T. Kim, D. Myers, V. R. Stamenkovic and N. M. Markovic, J. Phys. Chem. Lett., 2014, 5, 2474–2478 CrossRef CAS PubMed.
- C. C. L. McCrory, S. Jung, I. M. Ferrer, S. M. Chatman, J. C. Peters and T. F. Jaramillo, J. Am. Chem. Soc., 2015, 137, 4347–4357 CrossRef CAS PubMed.
- A. F. Baxter, J. Abed, D. V. F. Alvarez, D. Zhou, D. Kuvar, E. H. Sargent and D. V. Esposito, J. Electrochem. Soc., 2023, 170, 054503 CrossRef CAS.
Footnotes |
| † Electronic supplementary information (ESI) available. See DOI: https://doi.org/10.1039/d4dd00203b |
| ‡ Jehad Abed and Yang Bai contributed equally to this work. |
| This journal is © The Royal Society of Chemistry 2024 |

