Study on the efficiency of the preoxidation–coagulation process in removing disinfection by-product precursors from micropolluted water
Junwei
He
 a,
Ruibao
Jia
 ab,
Yonglei
Wang
*a,
Ke
Lin
c,
Baozhen
Liu
a,
Baosen
Liu
a and
Guilin
He
a
aSchool of Municipal and Environmental Engineering, Shandong Jianzhu University, Jinan, 250101, P.R. China. E-mail: wyl1016@sdjzu.edu.cn
bShandong Province City Water Supply and Drainage Water Quality Center, Jinan, 250014, P.R. China
cShandong Provincial Architecture Design & Research Institute Co., Ltd., Jinan, 250001, P.R. China
First published on 1st September 2023
Abstract
Recently, disinfection by-products (DBPs) have received widespread attention, and the control and removal of DBPs from drinking water is crucial for ensuring water supply safety. Although conventional coagulation treatment can effectively remove DBPs, such as trihalomethanes (THMs) and haloacetic acids (HAAs), emerging disinfection by-products, such as halogenated benzoquinones (HBQs), pose a significant potential threat to the safety of drinking water. This article focuses on the study of two types of water sources, namely the Yellow River source and the South to North Water Diversion source. Queshan Reservoir water is selected as the representative water of the Yellow River source, and Nansihu Reservoir water is selected as the representative water of the South to North Water Diversion source. This study explores the efficiency of preoxidation–coagulation technology in removing precursors of DBPs and organic compounds from slightly polluted surface water and the effect of this technology on the generation of DBPs. It was found that preoxidation–coagulation had a positive effect on the removal of precursors of DBPs from the two types of water. The removal rates of precursors of DBPs from water ranged from 10% to 75%, with the highest removal rate of HBQ precursors reaching over 70%. Moreover, the organic matter removed by preoxidation–coagulation was mainly macromolecular organic matter, and the removal rates of macromolecular organic matter from both types of water sources were above 30%. The removal of small-molecule organic matter was limited. It is speculated that the removal of DBP precursors from water by preoxidation–coagulation is mainly achieved by controlling the content of macromolecular organic matter in the water. The results of this study provide a reference for future research on the removal of precursors of emerging DBPs from water.
Water impactThis study explores the efficiency of preoxidation–coagulation technology in removing disinfection by-product precursors and organic compounds from slightly polluted surface water and the effect of this technology on the generation of disinfection by-products. It was found that preoxidation–coagulation had a positive effect on the removal of precursors of disinfection by-products from the two types of water. The removal rates of precursors of disinfection by-products from water ranged from 10% to 75%, with the highest removal rate of HBQ precursors reaching over 70%. Moreover, the organic matter removed by preoxidation–coagulation was mainly macromolecular organic matter, and the removal rates of macromolecular organic matter from both types of water sources were above 30%. The removal of small-molecule organic matter was limited. It is speculated that the removal of disinfection by-product precursors from water by preoxidation–coagulation is mainly achieved by controlling the content of macromolecular organic matter in the water. The results of this study provide a reference for future research on the removal of precursors of emerging disinfection by-products from water. |
1. Introduction
Disinfection is a necessary step in the water treatment process and a commonly used measure to ensure the safety of drinking water, which can prevent the occurrence of epidemic diseases in drinking water.1 However, during the disinfection process, natural organic compounds and pollutants emitted by humans in the water react with disinfectants to generate DBPs that are harmful to the human body. In the disinfection of drinking water with chlorine, DBPs are produced by reacting with natural organic matter (NOM) and dissolved organic matter (DOM).2–4 Most of the DBPs that have been identified and detected have genetic, cellular, and neurological toxicity,5 affect human pregnancy and induce cancer cell formation.6–8 The diversity of DBPs formed is high and a large portion remains unknown.9 Nitrogen-containing disinfection by-products (N-DBPs) have higher toxicity than carbon-containing disinfection by-products (C-DBPs);10 therefore, DBPs in water systems have been receiving increasing attention.11 Possible DBPs in drinking water have also been gradually detected. Recently, commonly detected DBPs mainly include trihalomethane, haloacetic acid, haloacetonitriles (HANs), and the emerging halogenated benzoquinone, with a typical concentration of nanograms per liter.12 Most DBPs in drinking water are toxic and can inhibit growth.13 Research on and detection of DBPs in China is gradually developing and improving,14 and some aromatic DBPs with higher stability and toxicity, such as chlorophenylacetonitrile, have been detected in drinking water in China.15 Different countries, regions, and organizations have different standards and restrictions regarding drinking water quality. Most countries have set limits for the content of DBPs in water bodies, but there are still many DBPs that are not included in national standard control measures, such as HANs and N-nitrosodimethylamine (NDMA). The detection of DBPs in water in China started relatively late, and there is relatively little research on DBPs, such as HBQs, in lake and reservoir water. Only Wu16 conducted research on detecting DBPs in Nanning swimming pool water, and Li17 conducted research on detecting DBPs in the Tianjin drinking water pipeline network and factory water. The average concentrations of various common DBPs vary in the range of tens of nanograms per liter. Moreover, the assessment of the environmental and human health risks of most DBPs is still incomplete.18 In response to the presence of DBPs in lakes and reservoirs, the current removal processes of water plants mostly rely on changing disinfection methods, such as reasonably controlling the dosage of disinfectants and incorporating other disinfection processes, such as ozone disinfection and ultraviolet disinfection,19 to reduce the production of chlorine disinfection products, but the removal efficiency is not high. In this article, coagulation was used as the main control technology, combined with preoxidation, to study the control effects of preoxidation–coagulation on the actual water quality and the precursors of DBPs, such as halogenated benzoquinone, under different conditions using the water from the Queshan Reservoir as the representative water of the Yellow River source water and the water from the Nansihu Reservoir as the representative water of the South Water source water and to study the mechanism of preoxidation–coagulation to provide a basis for studying DBP control technology.Table 1 shows the detection concentration levels of common DBPs in drinking water in different regions.
| Location | THMs (μg L−1) | HAAs (μg L−1) | DCAN (μg L−1) | DCAM (μg L−1) | Reference |
|---|---|---|---|---|---|
| ND indicates not detected. | |||||
| China | 0.8–107 | 0.45–59.6 | ND-6.7 | 0.1–2.1 | 23, 24 |
| Japan | 0.1–281 | 0.54–7.83 | ND | 0.1–1.3 | 25 |
| South Korea | ND-77.7 | ND-75.3 | ND-18.8 | ND | 26 |
| England | 16.5–47.3 | 11.1–41.0 | 0.5–2.1 | 0.2–3.6 | 27 |
| America | 4.0–112.0 | 5.0–130.0 | ND-12.0 | ND-5.6 | 12, 28 |
2. Materials and methods
2.1 Sampling points and raw water quality
With the water sources of the Queshan Reservoir and Nansihu Reservoir in Shandong Province selected as the research objects, combined with the preoxidation–coagulation process, the treatment effect of halogenated benzoquinone precursors on actual water was studied. The conventional water quality indicators and initial content of various DBPs in the water sources of the Queshan Reservoir and Nansihu Reservoir are shown in Tables 2 and 3.| Content | DOC (mg L−1) | pH | Turbidity (NTU) | Temperature (°C) | Conductivity (uS cm−1) | UV254 (cm−1) |
|---|---|---|---|---|---|---|
| Water sources | ||||||
| Queshan Reservoir | 2.514 | 7.56 | 1.41 | 11.5 | 669 | 0.059 |
| Nansihu Reservoir | 6.022 | 7.59 | 1.28 | 0.01446 | 0.0433 | 0.02628 |
| Content | HBQs (ng L−1) | Chloroform (mg L−1) | Bromo-trichloromethane (mg L−1) | DBAA | DCAA | TBAA | TCAA |
|---|---|---|---|---|---|---|---|
| Water sources | |||||||
| Queshan Reservoir | 9.649 | 0.09317 | 0.02791 | 0.01224 | 0.0442 | 0.0111 | 0.0225 |
| Nansihu Reservoir | 10.3744 | 0.1242 | 0.03086 | 0.01446 | 0.0433 | 0.02628 | 0.0217 |
2.2 Test method for the formation potential of DBPs
For the test method for the formation potential of halogenated benzoquinone (HBQFP): the water sample was placed in a brown reagent bottle, and the pH of the water sample was adjusted to approximately 7.0 with a phosphoric acid buffer solution. Then, excess NaClO solution was added, and the solution was left to react in a constant-temperature oven in the dark for 48 hours. After the reaction was completed, an appropriate amount of formic acid was added to quench the residual chlorine to terminate the reaction. After pretreatment, the samples were subjected to liquid chromatography-mass spectrometry (LC-MS) for detection, and 2 parallel samples were tested for each sample.For the test method for the formation potential of trihalomethane (THMFP) and haloacetic acid (HAAFP): the water sample was placed in a brown reagent bottle, and the pH of the water sample was adjusted to approximately 7.0 with a phosphate buffer solution. Then, excess NaClO solution was added, and the solution was left to react in a constant-temperature oven in the dark for 72 hours (trihalomethane) and 24 hours (haloacetic acid). After the reaction was completed, an excess amount of ascorbic acid was immediately added to quench the residual chlorine to terminate the reaction. Three parallel samples were tested for each group of samples; among them, the formation potential of THMFP is detected by gas chromatography (GC) and the detection of HAAFP using LC-MS.
2.3 Preoxidation–coagulation test
After adding potassium permanganate for preoxidation, a coagulation test was conducted on the water sample using a programmable six link stirrer. The hydraulic conditions were as follows: first, the sample was mixed quickly at 250 rpm for 0.5 minutes, then a certain amount of coagulant was added, and then the sample was mixed quickly at 300 rpm for 1 minute. Finally, the sample was stirred at 40 rpm for 15 minutes at low speed. After coagulation, the sample was allowed to stand for 30 minutes and then was tested for the presence of various indicators.2.4 Water quality analysis methods
The DOC was measured with a total organic carbon analyzer (TOC-VCPH, Shimadzu, Japan), the UV254 absorbance was measured using an ultraviolet spectrophotometer (Tu-1810, Beijing Proctor), and the turbidity was measured with a turbidimeter (HACH2010N, American Hash). Moreover, 3D fluorescence testing was performed using a 3D fluorescence spectrophotometer (HITACHI F-2700, Hitachi, Japan). DOC hydrophobic organic matter (HOC) and hydrophilic organic matter (CDOC) analyses were performed using an LC-OCD analyzer (Lobor, Germany), for which the CDOC was divided into biopolymers (BPs) with a molecular weight (MW) of >20![[thin space (1/6-em)]](https://www.rsc.org/images/entities/char_2009.gif) 000, humus (HS) with a molecular weight of >1000, building blocks (BBs) with a molecular weight between 300 and 500, low-molecular-weight neutral (LMWN) substances with a molecular weight of ≤350, and mostly weakly polar or nonpolar hydrophilic compounds, such as alcohols, aldehydes, ketones, small-molecular-weight amino acids, and low-molecular-weight acidic (LMWA) substances.20
000, humus (HS) with a molecular weight of >1000, building blocks (BBs) with a molecular weight between 300 and 500, low-molecular-weight neutral (LMWN) substances with a molecular weight of ≤350, and mostly weakly polar or nonpolar hydrophilic compounds, such as alcohols, aldehydes, ketones, small-molecular-weight amino acids, and low-molecular-weight acidic (LMWA) substances.20
3. Results and discussion
3.1 Analysis of the effect of preoxidation–coagulation on treating different water sources
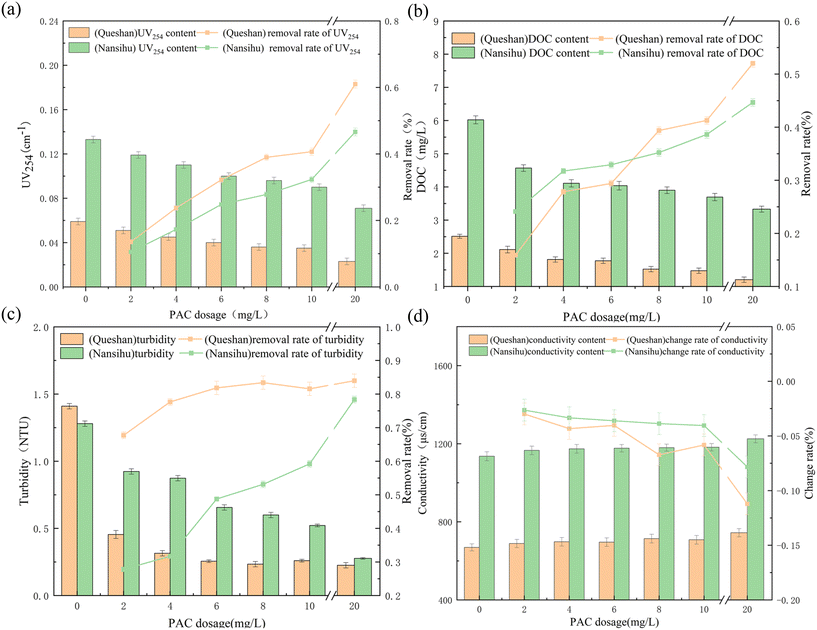
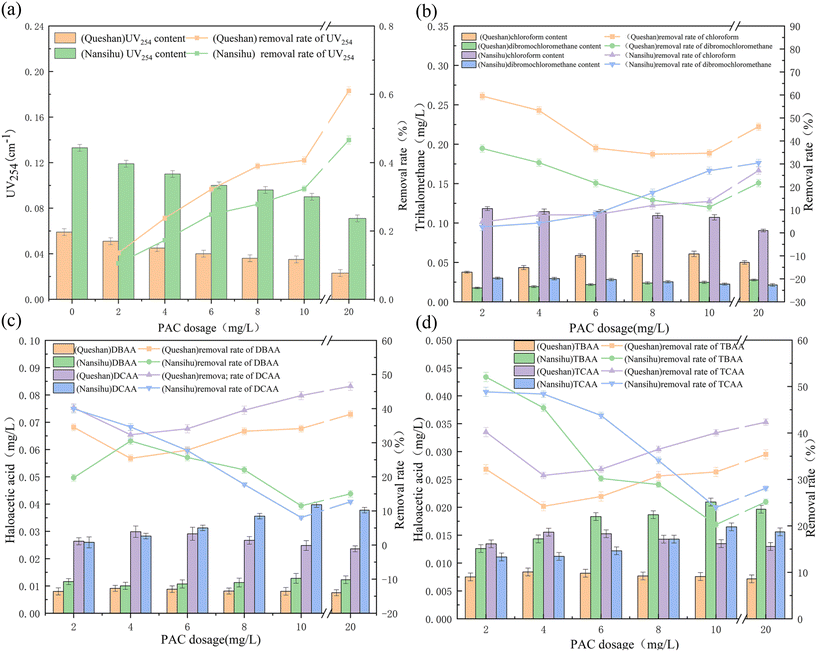
Using the Queshan Reservoir and Nansihu Reservoir water as the research objects, the preoxidation–coagulation treatment effects on the conventional indicators of water bodies and precursors of DBPs, such as HBQs, of these two types of source water were studied. The treatment effects were studied by selecting 0.2 mg L−1 potassium permanganate concentration for preoxidation–coagulation.21The removal rate of halogenated benzoquinone precursors from the Queshan water source by preoxidation–coagulation was significantly higher than that from the Nansihu water source, with a high removal rate and stable removal effect. The removal rate of trihalomethane precursors from the Queshan water source was also higher than that from the Nansihu water source. The removal effects of preoxidation–coagulation on haloacetic acid precursors from the two water sources were similar, with a similar average removal rate. The removal effect of preoxidation–coagulation on haloacetic acid precursors was similar to that on halobenzoquinone precursors and increased with increasing coagulant dosage. The removal effect on chlorohaloacetic acid was higher than that on bromohaloacetic acid, which is consistent with previous research.22 Overall, preoxidation–coagulation had a significantly better removal effect on the precursors of DBPs from the Queshan water source than from the Nansihu water source.
3.2 Study on the removal efficiency of organic components from different water sources by preoxidation–coagulation
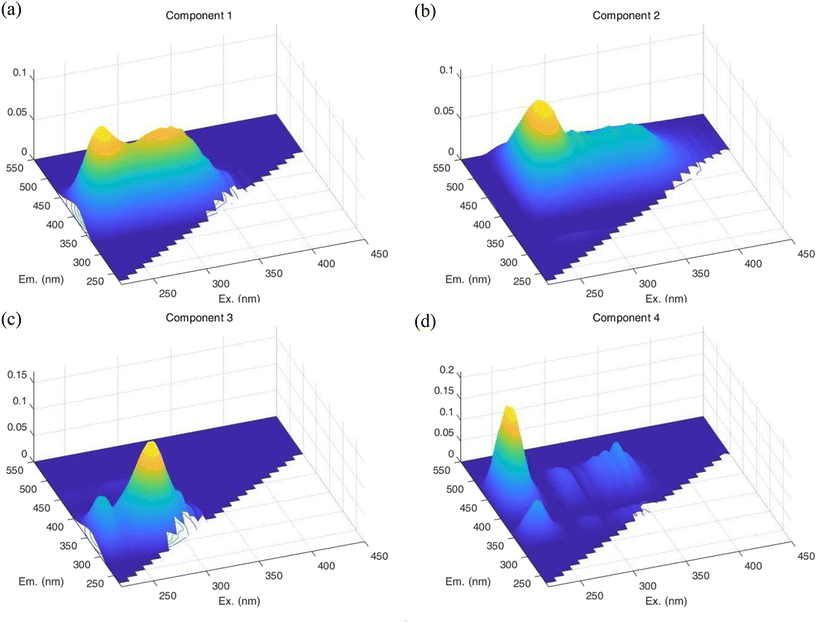 | ||
| Fig. 3 Model diagrams of four components: (a) aromatic proteins, (b) humic acid, (c) SMPs and (d) fulvic acid. | ||
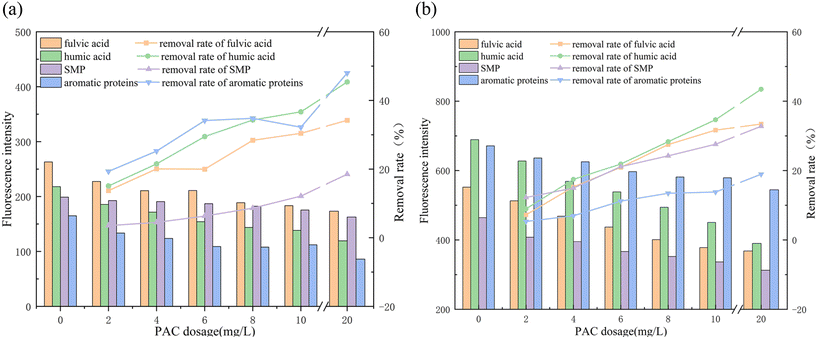
Quantitative analysis of fluorescence intensity was conducted based on the established model diagrams of the four components, and the removal effect of preoxidation–coagulation on organic matter from the two types of water sources was determined as shown in Fig. 4.
The fluorescence intensities of the Nansihu water source were significantly higher than those of the Queshan water source. The fluorescence intensities of fulvic acid, humic acid, SMPs, and aromatic proteins were 552, 689, 464, and 671 R.U., respectively, while those from the Queshan water source were 263, 218, 199, and 165 R.U., respectively. The organic matter content of the Nansihu Lake water source was significantly higher than that of the Queshan Reservoir, indicating a higher potential for the generation of DBPs, making it more difficult to treat. As indicated by the removal rate, preoxidation–coagulation had a good removal effect on both fulvic acid and humic acid from the two water sources, with removal rates of approximately 30–45%. The removal rate of the Queshan water source was higher than that of the Nansihu water source, indicating that preoxidation–coagulation had a good removal effect on macromolecular organic matter. The removal effect of preoxidation–coagulation on SMPs from both water sources was poor, with a removal rate of approximately 15–30%. Preoxidation–coagulation had a good removal effect on aromatic proteins from the Queshan Reservoir water, with a maximum removal rate of 47.97%. However, the removal rate for the Nansihu Reservoir water was only 18.93%, which may be due to the poor removal efficiency of coagulation on small-molecule organic matter. The high content of aromatic proteins in the Nansihu Reservoir water, which was approximately four times that of the Queshan Reservoir water, led to unsatisfactory final removal efficiency. Overall, preoxidation–coagulation had a good removal effect on large-molecule organic matter from both water sources and a poor removal effect on small-molecule organic matter from both water sources, but relatively speaking, it had a better removal effect on the Queshan Reservoir water.
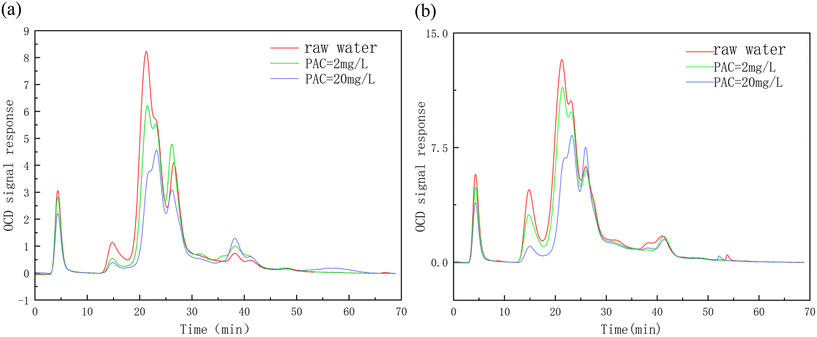
Tables 4 and 5 list the contents of the organic matter components in the Queshan Reservoir and Nansihu Reservoir, as well as the changes in these contents caused by preoxidation–coagulation under different coagulant dosages. The vast majority of organic matter in the Queshan Reservoir is hydrophilic organic matter (CDOCs), and the concentrations of BP, HS, BB, and LMWN in the raw water were 0.243 mg L−1, 2.003 mg L−1, 0.532 mg L−1, and 0.102 mg L−1, respectively. The concentrations of CDOCs in the raw water of the Nansihu Lake were 0.817 mg L−1, 3.500 mg L−1, 1.155 mg L−1, and 0.042 mg L−1, respectively. With increasing coagulant dosage, preoxidation–coagulation had a significant removal effect on hydrophobic organic compounds (HOCs) and CDOCs from both types of water sources, and it already had a good removal effect at low coagulant dosages. When the coagulant dosage was 2 mg L−1, the removal rates of HOCs and CDOCs from the Queshan water source were 15.89% and 11.36%, respectively. The removal rates of HOCs and CDOCs from the two types of water sources by preoxidation–coagulation increased with increasing coagulant dosage, with the highest removal rates exceeding 30%. Moreover, the removal efficiencies of HOCs and CDOCs from the Nansihu water source were better, reaching 59.19% and 39.86%, respectively. Preoxidation–coagulation had a good removal effect on macromolecular organic compounds, such as BP and HS, from the two types of water sources. Preoxidation–coagulation had a certain removal effect on BB at low coagulant dosages, but it decreased with increasing coagulant dosage, which also proved that the coagulation effect of potassium permanganate promoted the removal of organic compounds at low coagulant dosages, but BB is mostly a degradation product of medium-sized and small molecules, and the removal ability of preoxidation–coagulation is limited in this regard. Therefore, under high dosage conditions, coagulants can actually increase the content of medium-sized and small-molecule organic compounds in water. Preoxidation–coagulation had a good removal effect on LMWA substances but had almost no removal effect on LMWN substances. In summary, preoxidation–coagulation mostly removed large-molecule organic matter, and the relevant indicators that characterize small-molecule organic matter in water changed a little, with a removal rate of approximately 10%. This further indicated that preoxidation–coagulation essentially formed manganese dioxide to adsorb large-molecule organic matter that was better removed by floc adsorption and precipitation in the next coagulation process. Although preoxidation–coagulation significantly enhanced the removal efficiency of large-molecule organic matter from water, it could not solve the problem of poor removal efficiency of small and medium-sized organic compounds, such as BB and LMWN substances, by coagulation, which is consistent with the previous speculation.
| PAC dosage | HOC | CDOC | BP | HS | BB | LMWA | LMWN |
|---|---|---|---|---|---|---|---|
| Units are all mg L−1. | |||||||
| Raw water | 0.195 | 3.436 | 0.243 | 2.003 | 0.532 | 0.102 | 0.555 |
| 2 | 0.164 | 3.046 | 0.142 | 1.787 | 0.480 | <0.01 | 0.637 |
| 4 | 0.157 | 2.846 | 0.135 | 1.560 | 0.486 | <0.01 | 0.665 |
| 6 | 0.151 | 2.768 | 0.126 | 1.483 | 0.486 | <0.01 | 0.673 |
| 8 | 0.145 | 2.597 | 0.116 | 1.306 | 0.495 | <0.01 | 0.680 |
| 10 | 0.139 | 2.530 | 0.104 | 1.207 | 0.537 | <0.01 | 0.682 |
| 20 | 0.130 | 2.335 | 0.081 | 0.997 | 0.551 | <0.01 | 0.706 |
| PAC dosage | HOC | CDOC | BP | HS | BB | LMWA | LMWN |
|---|---|---|---|---|---|---|---|
| Units are all mg L−1. | |||||||
| Raw water | 0.272 | 6.792 | 0.817 | 3.500 | 1.155 | 0.042 | 1.278 |
| 2 | 0.261 | 5.731 | 0.616 | 2.789 | 1.176 | <0.01 | 1.150 |
| 4 | 0.244 | 5.238 | 0.611 | 2.685 | 0.928 | <0.01 | 1.014 |
| 6 | 0.235 | 5.034 | 0.468 | 2.421 | 1.026 | <0.01 | 1.119 |
| 8 | 0.195 | 4.861 | 0.451 | 2.296 | 1.045 | <0.01 | 1.069 |
| 10 | 0.167 | 4.524 | 0.419 | 2.073 | 1.054 | <0.01 | 0.978 |
| 20 | 0.111 | 4.085 | 0.245 | 1.684 | 1.090 | <0.01 | 1.066 |
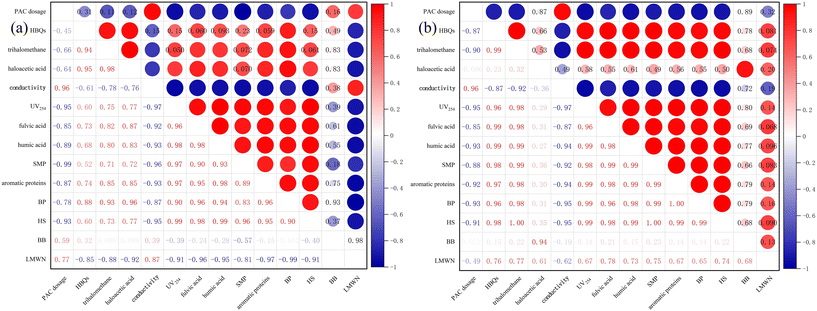
As shown in Fig. 6(a) and (b), whether it was the Queshan water source or the Nansihu water source, the correlation between HBQs and conventional indicators, such as conductivity and UV254 absorbance, was relatively low. Therefore, it is inferred that conventional indicators cannot reflect the level of DBP precursors. By comparing the two water sources, it was found that the correlation between HBQs and trihalomethane precursors was good, and the correlation between haloacetic acid precursors and two DBP precursors in the Queshan water source was good, which was different from that found for the Nansihu Lake water source. The precursor of DBPs in both types of water bodies was positively and excellently correlated with organic macromolecular substances (BP, HS) in the water. However, the precursor of DBPs in the Queshan water source was inversely correlated with small-molecule organic substances (LMWN). It is inferred that preoxidation–coagulation degrades large-molecule organic substances in the Queshan water source into small-molecule organic substances, but alcohols, such as LMWN, are difficult to degrade by potassium permanganate. The simultaneous addition of potassium permanganate promoted the oxidation and decomposition of organic matter into alcohols, ketones, and hydroxyl compounds in the water to a certain extent, resulting in an increase in LMWN substances. This confirmed that the preoxidation–coagulation treatment mentioned earlier had a poor removal effect on small-molecule organic matter, while the LMWN and HBQ precursors in the Nansihu Lake water source were positively correlated, which was in contrast to the hotspot analysis of the Queshan Reservoir. It is speculated that due to the high degree of industrial pollution in the Nansihu Reservoir water source, the protein content in the water is relatively high, and the efficiency of preoxidation–coagulation in treating the Nansihu Reservoir water source is low. A small amount of large-molecule organic matter was degraded into small-molecule organic matter, and the contents of some types of small-molecule organic matter removed by the coagulation process were greater than those produced by degradation, resulting in a decrease in the content of small-molecule organic matter in the water. By comparing the hotspot maps of the two types of water sources, it was found that there was an excellent correlation between the generation of macromolecular organic compounds (BP, HS) and the precursor of DBPs. This further proves that preoxidation–coagulation mainly removes macromolecular organic compounds from water bodies, thereby reducing the generation efficiency of DBP precursors in water.
4. Conclusion
(1) There is a significant difference in water quality between the water source of the Yellow River and the water source of the South to North Water Diversion Project. The water from the South to North Water Diversion Project is rich in organic matter, and the efficiency of preoxidation–coagulation in treating DBP precursors in low-pollution water is better than that in high-pollution water.(2) The removal rate of DBP precursors from water by preoxidation–coagulation varies from 10% to 70%, and there are significant regional differences in removal rates. The addition of potassium permanganate can enhance coagulation to a certain extent, further improving the removal efficiency of DBP precursors from water.
(3) Potassium permanganate can enhance the coagulation effect and improve the removal rate of DBPs precursors in water.
(4) The removal rate of high-molecular-weight organic compounds (BP, HS) from water by preoxidation–coagulation can reach over 60%, which can significantly improve the removal efficiency of high-molecular-weight organic compounds in water. However, the removal ability of medium- and small-molecular-weight organic compounds is limited, with a removal rate of only approximately 10%.
(5) The removal of precursors of DBPs in water bodies is related to the content of organic matter. It is speculated that the total amount of precursors of DBPs in water bodies can be reduced by increasing the removal rate of macromolecular organic matter.
(6) Preoxidation–coagulation is essentially a type of enhanced coagulation that can degrade large-molecule organic matter into small-molecule organic matter, making it easier to remove by coagulation and improving the removal effect on DBP precursors.
Conflicts of interest
The authors declare that they have no known competing financial interests or personal relationships that could have appeared to influence the work reported in this paper.Acknowledgements
This research was supported by the National Key Research and Development Program (2022YFC3203704 and 2022YFC3203705).References
- X. Li and W. A. Mitch, Drinking water disinfection byproducts (DBPs) and human health effects: Multidisciplinary challenges and opportunities, Environ. Sci. Technol., 2018, 52, 1681–1689 CrossRef CAS.
- J. Jiang, J. Han and X. Zhang, Nonhalogenated aromatic DBPs in drinking water chlorination: A gap between NOM and halogenated aromatic DBPs, Environ. Sci. Technol., 2020, 54, 1646–1656 CrossRef CAS PubMed.
- J. Jiang, X. Zhang, X. Zhu and Y. Li, Removal of intermediate aromatic halogenated DBPs by activated carbon adsorption: A new approach to controlling halogenated DBPs in chlorinated drinking water, Environ. Sci. Technol., 2017, 51, 3435–3444 CrossRef CAS PubMed.
- V. Yuthawong, C. Thongnueaha and P. Phungsai, Changes in optical properties and molecular composition of dissolved organic matter and formation of disinfection by-products during conventional water treatment processes, Environ. Sci.: Water Res. Technol., 2022, 9, 161–175 RSC.
- M. J. Plewa and E. D. Wagner, Charting a new path to resolve the adverse health effects of DBPs, ACS Symp. Ser., 2015, 1190, 3–23 CrossRef CAS.
- J. S. Benítez, C. M. Rodríguez and A. F. Casas, Disinfection byproducts (DBPs) in drinking water supply systems: A systematic review, Phys. Chem. Earth, 2021, 123, 102987 CrossRef.
- S. Chowdhury, M. A. J. Mazumder, K. Alhooshani and M. S. Al-Suwaiyan, Reduction of DBPs in synthetic water by indoor techniques and its implications on exposure and health risk, Sci. Total Environ., 2019, 691, 621–630 CrossRef CAS PubMed.
- M. A. Zazouli and L. R. Kalankesh, Removal of precursors and disinfection by-products (DBPs) by membrane filtration from water; A review, J. Environ. Health Sci. Eng., 2017, 15, 25 CrossRef PubMed.
- A. Andersson, M. Harir, M. Gonsior, N. Hertkorn, P. Schmitt-Kopplin and H. Kylin, et al., Waterworks-specific composition of drinking water disinfection by-products, Environ. Sci.: Water Res. Technol., 2019, 5, 861–872 RSC.
- E. D. Wagner and M. J. Plewa, CHO cell cytotoxicity and genotoxicity analyses of disinfection by-products: An updated review, J. Environ. Sci., 2017, 58, 64–76 CrossRef CAS PubMed.
- J. Fu, C. Huang, C. Dang and Q. Wang, A review on treatment of disinfection byproduct precursors by biological activated carbon process, Chin. Chem. Lett., 2022, 33, 4495–4504 CrossRef CAS.
- Y. Zhao, J. Anichina, X. Lu, R. J. Bull, S. W. Krasner and S. E. Hrudey, et al., Occurrence and formation of chloro- and bromo-benzoquinones during drinking water disinfection, Water Res., 2012, 46, 4351–4360 CrossRef CAS.
- Z. Zhang, Q. Zhu, C. Huang, M. Yang, J. Li and Y. Chen, et al., Comparative cytotoxicity of halogenated aromatic DBPs and implications of the corresponding developed QSAR model to toxicity mechanisms of those DBPs: Binding interactions between aromatic DBPs and catalase play an important role, Water Res., 2020, 170, 115283 CrossRef CAS.
- X. Liu, L. Chen, M. Yang, C. Tan and W. Chu, The occurrence, characteristics, transformation and control of aromatic disinfection by-products: A review, Water Res., 2020, 13, 116076 CrossRef PubMed.
- D. Zhang, W. Chu, Y. Yu, S. W. Krasner, Y. Pan and J. Shi, et al., Occurrence and stability of chlorophenylacetonitriles: A new class of nitrogenous aromatic DBPs in chlorinated and chloraminated drinking waters, Environ. Sci. Technol. Lett., 2018, 5, 394–399 CrossRef CAS.
- H. Wu, K. Long, D. Lu, Y. Mo, Q. Yang and X. Wei, Occurrence and formation of halobenzoquinones in indoor and outdoor swimming pool waters of Nanning City, Southwest China, Environ. Sci. Pollut. Res., 2019, 26, 31537–31545 CrossRef CAS PubMed.
- Y. Li, L. Zhang, L. Yang, Y. Zhang and Z. Niu, Hydrolysis characteristics and risk assessment of a widely detected emerging drinking water disinfection-by-product—2,6-dichloro-1,4-benzoquinone—in the water environment of Tianjin (China), Sci. Total Environ., 2021, 765, 144394 CrossRef CAS PubMed.
- J. Han, X. Zhang, J. Jiang and W. Li, How much of the total organic halogen and developmental toxicity of chlorinated drinking water might be attributed to aromatic halogenated DBPs?, Environ. Sci. Technol., 2021, 55, 5906–5916 CrossRef CAS.
- S. Ding, F. Wang, W. Chu, C. Fang, Y. Pan and S. Lu, et al., Using UV/H2O2 pre-oxidation combined with an optimised disinfection scenario to control CX3R-type disinfection by-product formation, Water Res., 2019, 167, 115096 CrossRef CAS.
- S. A. Huber, A. Balz, M. Abert and W. Pronk, Characterisation of aquatic humic and non-humic matter with size-exclusion chromatography – organic carbon detection – organic nitrogen detection (LC-OCD-OND), Water Res., 2011, 45, 879–885 CrossRef CAS PubMed.
- H. Zhao, L. Wang, Z. H. Zhang, B. Zhao, H. W. Zhang and H. Zhang, et al., Study on chemical Pre-Oxidation enhanced coagulation for Micro-Polluted raw water treatment, Adv. Mater. Res., 2013, 777, 472–475 Search PubMed.
- N. Tang, et al., Effect of coagulation on chlorinated disinfection by-products produced by different humus, Water & Wastewater Engineering, 2016, 52(07), 24–28 Search PubMed.
- H. Ding, L. Meng, H. Zhang, J. Yu, W. An and J. Hu, et al., Occurrence, profiling and prioritization of halogenated disinfection by-products in drinking water of China, Environ. Sci.: Processes Impacts, 2013, 15, 1424 RSC.
- W. Chu, N. Gao, D. Yin, S. W. Krasner and M. R. Templeton, Trace determination of 13 haloacetamides in drinking water using liquid chromatography triple quadrupole mass spectrometry with atmospheric pressure chemical ionization, J. Chromatogr. A, 2012, 1235, 178–181 CrossRef CAS.
- C. Zhao, Y. Fujii, J. Yan, K. H. Harada and A. Koizumi, pentafluorobenzyl esterification of haloacetic acids in tap water for simple and sensitive analysis by gas chromatography/mass spectrometry with negative chemical ionization, Chemosphere, 2015, 119, 711–718 CrossRef CAS.
- K. J. Lee, B. H. Kim, J. E. Hong, H. S. Pyo, S. Park and D. W. Lee, A study on the distribution of chlorination By-Products (CBPs) in treated water in korea, Water Res., 2001, 35, 2861–2872 CrossRef CAS.
- T. Bond, M. R. Templeton, N. H. M. Kamal, N. Graham and R. Kanda, Nitrogenous disinfection byproducts in English drinking water supply systems: Occurrence, bromine substitution and correlation analysis, Water Res., 2015, 85, 85–94 CrossRef CAS PubMed.
- S. W. Krasner, H. S. Weinberg, S. D. Richardson, S. J. Pastor, R. Chinn and M. J. Sclimenti, et al., Occurrence of a new generation of disinfection byproducts, Environ. Sci. Technol., 2006, 40, 7175–7185 CrossRef CAS PubMed.
| This journal is © The Royal Society of Chemistry 2024 |

