 Open Access Article
A metamaterial based sensor for moisture and density of cereal flours
Aswathi
P. V.
a,
Anju
Sebastian
a,
Lulu
Varghese
b,
Joseph
V. P.
a and
Jolly
Andrews
 *a
*a
aDepartment of Physics, Christ College (Autonomous) Irinjalakuda, University of Calicut, Kerala 680125, India. E-mail: jollyandrews@christcollegeijk.edu.in
bDepartment of Food Processing Technology, Christ College (Autonomous) Irinjalakuda, University of Calicut, Kerala 680125, India
First published on 7th November 2023
Abstract
The dielectric properties of cereal grain flours are studied by varying the moisture content and density, using a novel metamaterial Wire Split Ring Resonator (WSRR) based sensor working in the microwave frequency range at room temperature. Four types of cereal grains ground into fine powders are used as the test samples. The WSRR sensor is kept in the electromagnetic field that exists between two monopole antennas connected to the receiving and transmitting ports of a Vector Network Analyzer (VNA) which serves as the measuring device. The LC resonance behavior of the WSRR on interacting with the electromagnetic field and the shift in its resonance frequency in response to any changes in the dielectric environment around it form the basis of sensing. The variation in the moisture content and density of cereal flour samples will cause corresponding changes in the capacitive environment of the sensor which is reflected as the resonance frequency shift. From the resonance–density calibration plot, the maximum packing density of cereal grain powders is found which is useful in determining the efficient use of the available packing space. The moisture content, an essential requirement in ensuring the shelf life of cereal grain powders, is analyzed from the resonance–moisture calibration plot. This simple and accurate metamaterial-inspired measuring technique may find wide applications in the food industry in optimizing the shelf life and packing space of cereal grain powder products.
Sustainability spotlightCountries take various measures to ensure high quality for food products since nation building is possible only through healthy, energetic people. Quality of food products must be ensured from the harvesting to packing stage. Shelf life is determined by the moisture content present in the food product. A novel method is introduced to measure the moisture content of cereal food products using a metamaterial-based sensor in a reliable and easy way. The cost of transport is also a major concern in food trade which is connected with maximum utilization of available space. This proposed method can be employed for the compaction density packing in this regard. Hence this work is aligned with the goal 3 of UN SDG. |
1 Introduction
Powdered cereal grains serve as important raw materials for a wide variety of food products. The taste and quality of these foods largely depend on the grade of the cereal grains and various treatments in the subsequent processing stages.1 Top-grade cereal grains are characterized by good intrinsic qualities like composition, color, and aroma, and process-induced qualities like long shelf life and good storage properties.2 The storage properties of cereal grains are determined by the parameters of moisture content, density, porosity, etc. In order to ensure the good storage properties of cereal grains, these parameters should be studied and optimized.3 Since all these parameters depend upon the dielectric data, the dielectric study of cereal grains requires special attention.4,5 The dielectric properties at different frequencies are determined for a material by analyzing its interaction with the electromagnetic (em) field. Different types of free space and resonant methods have been followed for the dielectric study of cereal grains over the past fifty years which include the cavity perturbation technique, free space transmission technique, two-point method using waveguides, etc.6,7 According to the theoretical model of these methods, the material medium under study should be homogeneous. But the grain medium possesses inhomogeneities due to non-uniform kernel size distribution and porosity. This problem can be resolved by choosing the sample in powdered form. The dielectric study reports of many types of loose cereal grains are available in the literature, but those in powdered form are rarely found.8,9A novel method in this regard is introduced here which involves the recently emerging metamaterial-based measurement techniques.10 Metamaterials are artificially engineered composites with dimensions much less than the wavelength of the interacting em wave and possessing exotic properties that cannot be found in natural materials.11–13 They are also characterized by negative values of permittivity, permeability, or refractive index.14,15 A split ring resonator (SRR), a negative permeability metamaterial structure, consists of metallic loops with splits.16 When the SRR structure interacts with the time-varying electromagnetic field, it acts as an LC resonator since charges and currents are induced in it.17 The SRR structure responds to very slight changes in its dielectric environment through resonance frequency shifts.18 This forms the basis of the SRR structure, for being used as a sensor in the pharmaceutical, biomedical, engineering and food processing fields.19–21 Metamaterial-inspired sensors are in great demand in various spheres of science owing to their extreme sensitivity and preciseness.22 Some of the noticeable applications in this realm are: SRR-based sensors for the measurement of complex permittivity of dielectrics23 and their temperature dependence,24 vibration sensors capable of detecting seismic waves,25 near field imaging probes,26 non-destructive thickness measurement of dielectric films,27 near-field perturbation studies,28 microfluidic sensors,29 multichannel thin film sensors,30 and biosensors.31
A wire split ring resonator (WSRR), a special SRR structure, consists of two concentric metallic rings with splits oriented in opposite directions. The structure acts as an LC resonator when it is inserted into an em field with the magnetic field perpendicular to the plane of the rings.32 The resonance absorption is characterized by the resonance frequency and it is completely determined by the structural and dielectric parameters of the WSRR. The present work is based on the resonance frequency shift of the WSRR when a dielectric material is introduced into its near-field region. Four types of finely powdered cereal grains of wheat, corn, ragi and barley, pressed into pellets with sufficient diameter to cover the entire WSRR surface, are used as the samples for the dielectric study. Each sample when placed over the WSRR surface, a shift occurs in its resonance frequency and the shift is different for different cereal grain samples. A vector network analyser (VNA), the commonly used measuring device in microwave studies, is used for the measurements. The VNA used for the present study contains a microwave source with a frequency range of 300 kHz to 9 GHz, a processor and a display unit. The resonance absorption of the WSRR is displayed as a dip in the transmission spectrum in the VNA and the frequency corresponding to this minimum power in the transmission spectrum represents the resonance frequency of the WSRR. The variation in the dielectric properties of powdered cereal grains with moisture content and density is studied. For that, the powdered samples are placed on the WSRR and the change in resonance frequency of the WSRR is noted. Variations in resonance frequency for different moisture levels and densities are plotted. The unknown moisture contents and densities are calculated by using these plots as calibration curves.
The proposed novel method which involves a WSRR metamaterial sensor can be employed for determining the moisture level and density profiles of cereal powders for fixing the storage and packing conditions in a simple, accurate and non-destructive manner. Though different techniques have been reported in the literature, the uniqueness of the present method is the structural simplicity of the sensor and relative ease of measurement.
2 Principle of working of the metamaterial WSRR based sensor
The WSRR structure consists of two metallic copper rings with splits oriented in opposite directions and affixed on a very thin polymer film as shown in Fig. 1. The structural parameters of the WSRR are the inner radius (r), metal width (c), split gap (d) and gap between the rings (s).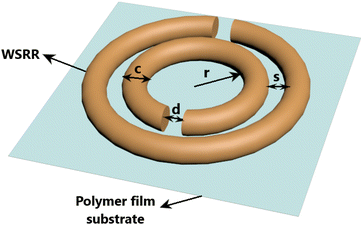 | ||
| Fig. 1 WSRR structure fixed on a thin polymer film substrate and having structural parameters – inner radius (r), metal width (c), split gap (d) and gap between the rings (s). | ||
The WSRR structure when kept in a time-varying em field with the magnetic field component oriented perpendicular to the plane of the WSRR results in current being induced in the metallic loop. The split in the loop prevents the current from flowing continuously and thereby charges are accumulated at the split gap. As a result, inductive and capacitive effects are developed in the WSRR structure and it acts as an LC resonator. The effective inductance (L) and capacitance (C) are dependent on the structural parameters of the WSRR. The resonance frequency (f) of the WSRR structure is given by,
 | (1) |
It may be noted that, out of the various types of SRR structures, the WSRR structure is preferred for this study, owing to its low-loss nature. The induced em field distribution associated with the WSRR structure pervades above, below and around the structure. Any dielectric material intrusion to this field region rearranges the field distribution and as a result of which a shift occurs in the resonance frequency of the WSRR structure. From the values of resonance frequency and transmitted power, several dielectric properties of the material under study can be obtained using suitable equations. The surface of the material under study in contact with the WSRR must be smooth and should be having a minimum base area equal to the outer dimension of the WSRR. The experimental setup for the dielectric characterization of materials using the WSRR structure is depicted in Fig. 2. It consists of the measuring device VNA with the WSRR placed between its transmitting and receiving probes and the dielectric sample placed over the WSRR structure.
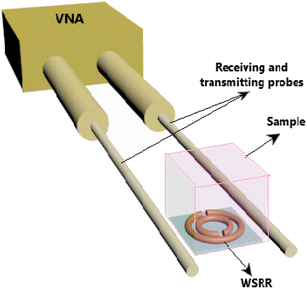 | ||
| Fig. 2 Schematic representation of the dielectric characterization set-up including the WSRR structure with a dielectric sample placed on its upper surface and the measuring device VNA. | ||
3 Dielectric properties of cereal grains
Cereal grains are the staple food for many people from different continents. Cereal grains are rich in carbohydrates, fibers, and vitamins. Grains are harvested before ripe and they should be dried to 10–15% moisture content before storage, otherwise, they may be susceptible to fungal/bacterial action.33 To keep the best quality for grains and thereby for their products, long shelf life and good storage properties must be ensured. The conventional sun drying method followed after harvesting has been replaced by dielectric heating methods like radio or microwave heating in recent years. In order to know the rate at which a material warms up in the radio or microwave field, the material–field interaction has to be well studied.Dielectric properties are the important characteristics that determine the material–field interaction. The post-harvesting processing stages of cereal grains – tempering, milling, radio or microwave frequency heating, magnetic field processing, etc. involve mainly the grain-em field interaction. Hence the knowledge of dielectric properties of grains is of utmost importance.34,35 The nature of the interaction between a material and the em field depends on both the properties of the material and the external conditions. The material properties include the dielectric nature of the material, shape, size and moisture content while the external conditions mainly depend upon the applied frequency range and humidity of the atmosphere. The dielectric properties of cereal grains are generally studied as a function of frequency, moisture content and density. Dielectric data of the grain samples are required over a wide range of frequencies since the frequency of operation differs in various processing stages. To achieve the optimum moisture content for safe storage, dielectric properties at different moisture levels are studied. From the packaging point of view, the density-dielectric study is essential for the judicious selection of the packing material and to minimize the spatial requirement of packing.36 Over the past fifty years, several attempts have been made to develop a relationship between the dielectric properties and components of food.37 Literature shows several studies to determine the dielectric properties of a large number of agricultural products like cereal grains, oil seeds, fruits and vegetables, and their dependence on frequency, moisture content, temperature, density and many other parameters.38 For the dielectric measurement of cereal grains, the free space transmission method, open-ended coaxial method and waveguide methods are generally followed. The dielectric data are evaluated from the measured reflection/transmission coefficients with the help of standard equations.
Dielectric properties of a lossy material depend on the material–field interaction and they can be expressed in terms of permittivity which is a complex quantity that is expressed as,
| εr = ε′ − jε′′ | (2) |
Inaccuracies may creep into the dielectric measurement of whole cereal grains due to the non-uniform distribution of kernel size and porosity. In order to treat the medium as homogeneous with minimum porosity, the sample in powdered form is used.
3.1 Bulk density
Cereal grains like rice, wheat and barley are widely used in powdered form. Due to their semi-solid and semi-liquid behavior powders are generally hard to handle.40 Their packing is a major concern in the food trade. The traders have now moved to compaction density-based packing rather than bulk density-based packing. Applying compaction pressure over the powdered products, the available space for packing can be maximized and transportation costs can be minimized. The maximum compaction is achieved when the air trapped between the powder particles is completely removed. This condition of maximum compaction is different for different cereal grain powders, which depends on the powder characteristics. This work monitors the maximum achievable compaction for a cereal grain powder and this is based on the resonance frequency shift of the WSRR by varying compaction pressure over the powder samples placed over it.3.2 Moisture content
The dielectric properties of cereal grains highly depend on the moisture content in the sample. This is due to the fact that the free water molecules present in the sample modify the polarizability of the grain sample. This in turn changes the dielectric properties of cereal grains. The interaction of the moist sample with the em field is entirely different from the dry sample.41 Moisture content determines the storage conditions of cereal grains and hence it plays a very vital role in the shelf life of food samples. The maximum allowed moisture content of cereal grains as per international standards is 10% to 15% on wet basis for safe storage.4 Out of the direct and indirect methods for measurement of grain moisture, the direct methods involve the measurement of loss of water on drying the grains. The indirect methods involve measuring parameters – capacitance or resistance – that change with the moisture present. Some of the indirect methods include the resistance method, capacitance method, chemical method and relative humidity method. But these methods are sample-destructive and need an elaborate experimental setup. Apart from these conventional methods, certain microwave techniques are also proposed which include the cavity perturbation method and free space method. But these methods require certain elaborate instrumentation.42 The metamaterial-based sensor method provides another opening for precise determination of the humidity content of various samples. In this regard, Mohammad Abdolrazzaghi et al. have proposed certain methods for enhancing the Q values of the metamaterial resonator sensor in the presence of lossy samples which may lead to more accurate results.43–45 The proposed metamaterial WSRR sensor-based moisture measurement doesn't alter the composition of the sample and there is no need for elaborate sample preparation.4 Methodology
The details of the preparation of experimental samples and the experimental setup are given below.4.1 Sample preparation
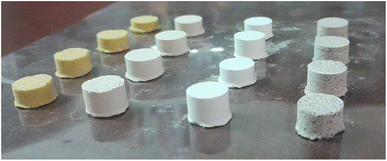
Four branded high-quality cereal grains (wheat, barley, ragi and corn) are purchased from the market and sun-dried for two days to remove any free water content that may present. The samples are ground into fine powders and sieved through a suitable mesh which in this case is selected as 0.7 mm to keep uniform particle size. Applying four levels of compaction pressure on 1 g of each dry cereal grain powder, samples in the form of small pellets are prepared as shown in Fig. 3.To perform moisture studies, four sets of each experimental sample are prepared with different moisture levels. For that 2 ml, 4 ml, 6 ml and 8 ml water is added to 20 g of each powdered sample and mixed thoroughly. These samples are sealed and kept for 24 hours for uniform moisture distribution. The moisture level in each sample is calculated on wet basis using the following equation,
 | (3) |
4.2 Experimental setup
For the fabrication of the WSRR, small pieces of copper wires of required length are precisely bent into the form of two split rings using a cylindrical cavity-shaped mold. Then they are fixed on a thin adhesive polymer film in such a way that the two split gaps are oriented in opposite directions. The radius of the copper wire used is 0.446 mm. The dimensions of the fabricated WSRR are: inner radius (r) = 2.04 mm, metal width (c) = 1.02 mm, split gap (d) = 0.26 mm, the gap between the rings (s) = 0.41 mm. It is affixed on a thin polyethylene film, a low-loss and low dielectric constant material, having dielectric permittivity (εr) = 2.25 and thickness (t) = 38 μm.The range of frequency is set from 2 GHz to 6 GHz in VNA. The WSRR structure is placed between the two monopole antennas connected to the receiving and transmitting ports of the VNA as shown in Fig. 4. The resonance frequency of the WSRR test probe alone is noted. The resonance frequencies corresponding to dry powder samples in the loose and compacted form are also noted by placing the samples over the WSRR test probe.
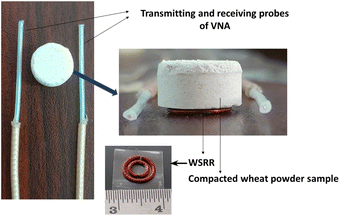 | ||
| Fig. 4 Compacted dry sample of wheat flour, placed on the WSRR situated between receiving and transmitting probes. | ||
For the moisture studies, the resonance measurements using the moist sample are also carried out. The resonance frequency changes for each cereal flour sample prepared with different moisture levels and fixed compaction density are noted by placing them on the WSRR test probe.
The optimum packing density and moisture level for safe storage are determined by analyzing the calibration plots obtained for both density and moisture with the resonance frequency of the WSRR. Samples of unknown density and moisture content are also prepared and their density and moisture content are calculated from the corresponding plots using the calibration graph.
5 Results and discussion
The moisture and density-related experimental results obtained for the selected samples along with the unknown samples are elaborated. The resonance frequency of the WSRR test probe used for the study is 3.9001 GHz.5.1 Density studies
The density values of loose dry samples of wheat, corn, barley and ragi powders are noted as d1 (loose samples taken are also in the form of pellets by gently pressing the powder with minimum compaction pressure). The resonance frequency values corresponding to all cereal grain powders are noted. This is done first by without applying compaction pressure and then under different compaction pressures or densities. The resonance frequency values and corresponding densities are tabulated in Table 1.| Cereal grain | Densities (d1, d2, d3, d4, d5 in kg m−3) and resonance frequency (f in GHz) | |||||||||
|---|---|---|---|---|---|---|---|---|---|---|
| d 1 | f | d 2 | f | d 3 | f | d 4 | f | d 5 | f | |
| Wheat | 416.668 | 3.7415 | 664.718 | 3.6599 | 820.64 | 3.6399 | 863.271 | 3.6198 | 949.598 | 3.599 |
| Corn | 386.904 | 3.7401 | 658.137 | 3.6998 | 782.022 | 3.6797 | 977.527 | 3.6401 | 1107.864 | 3.5998 |
| Ragi | 509.259 | 3.7200 | 685.277 | 3.6400 | 707.147 | 3.6199 | 738.576 | 3.5998 | 791.331 | 3.5797 |
| Barley | 373.263 | 3.7002 | 664.718 | 3.6999 | 738.576 | 3.6399 | 791.332 | 3.6199 | 874.629 | 3.5998 |
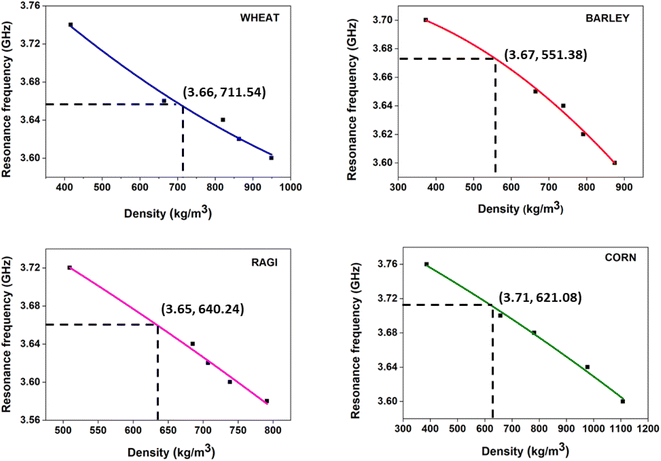
From this table, it is clear that on applying more and more pressure on the dry loose cereal powder sample the resonance frequency shifts to the low-frequency region. The resonance frequency variation with respect to different densities of four cereal grain powders is given in Fig. 5 where as the density increases the resonance frequency decreases in all the cases.
In fact, it is due to the reduction in the amount of void space between the powder particles, the effective dielectric constant of the sample increases. This in turn results in the enhancement of effective capacitance and hence the resonance frequency is shifted to the low-frequency side. As a typical case in Fig. 6 the plot of transmitted power with the frequency (resonance curves) of the WSRR for the wheat powder sample is depicted.
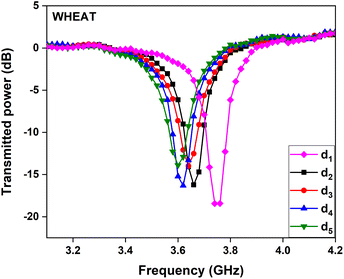 | ||
| Fig. 6 Transmitted power with the frequency of the WSRR corresponding to compacted dry wheat powder samples. | ||
The unknown densities of the samples are identified from the resonance frequency–density curves through the calibration curve. They are tabulated in Table 2 which are found to be in good agreement with the measured values.
| Cereal grain | Density values (kg m−3) | |
|---|---|---|
| From the calibration plot | Measured | |
| Wheat | 711.54 | 693.57 |
| Corn | 621.08 | 627.093 |
| Ragi | 640.24 | 650.607 |
| Barley | 551.38 | 513.242 |
5.2 Moisture studies
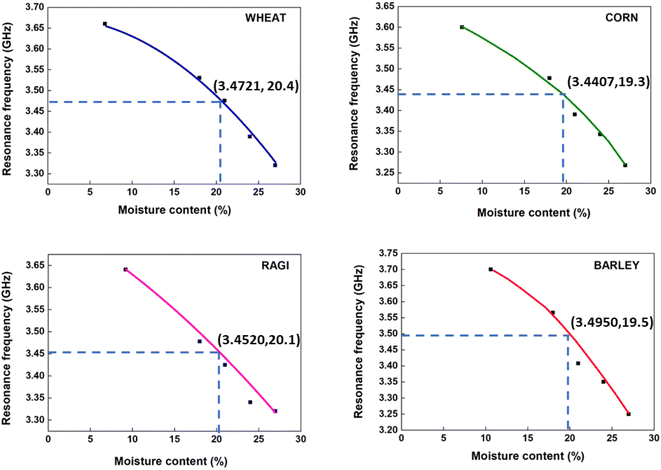
In the moisture studies, by adding different amounts of water to each sample of the four cereal grains the level of moisture in the samples is varied from 10% to 27% on wet basis. By placing the samples of all four cereal grains with different moisture contents (mc1, mc2, mc3, mc4) on the WSRR test probe, resonance frequency shifts are observed which are tabulated in Table 3. The graphical representation of the variation of resonance frequency with moisture levels in all four cereal flour samples is also displayed in Fig. 7. The plot of transmitted power with frequency (resonance curves) for the wheat sample is given in Fig. 8.| Cereal grain | Moisture contents (mc1, mc2, mc3, mc4 in %) and resonance frequency (f in GHz) | |||||||
|---|---|---|---|---|---|---|---|---|
| mc1 | f | mc2 | f | mc3 | f | mc4 | f | |
| Wheat | 18 | 3.7415 | 21 | 3.6599 | 24 | 3.6399 | 27 | 3.6198 |
| Corn | 18 | 3.7401 | 21 | 3.6998 | 24 | 3.6797 | 27 | 3.6401 |
| Ragi | 18 | 3.7200 | 21 | 3.6400 | 24 | 3.6199 | 27 | 3.5998 |
| Barley | 18 | 3.7002 | 21 | 3.6999 | 24 | 3.6399 | 27 | 3.6199 |
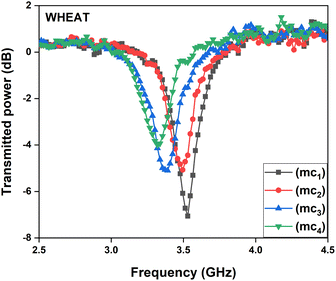 | ||
| Fig. 8 Transmitted power with the frequency of the WSRR corresponding to compacted dry wheat powder samples. | ||
Here also the calibration curves are used for finding the unknown moisture of the selected samples. For that, samples of four cereal grains are prepared and they are placed on the WSRR test probe for measuring their resonance frequencies. By locating these values in the frequency–moisture plots the moisture content is noted and compared with the values obtained using eqn (3). These values are given in Table 4. In our study, only non-free-flowing samples are selected. In the case of free-flowing flours like rice powder, pelletization is not possible. In such conditions, a thin cylindrical container made of low-loss polymer may be used as a sample holder.
| Cereal grain | Moisture content (%) | |
|---|---|---|
| From the calibration plot | Measured | |
| Wheat | 20.4 | 20 |
| Corn | 19.3 | 20 |
| Ragi | 20.1 | 20 |
| Barley | 19.5 | 20 |
6 Concluding remarks
Powdered food products are generally packed in plastic or polymer pouches/containers. Usually, the trapped air is squeezed out from the food pouches or nitrogen gas is filled in them in order to ensure a long shelf life. From the packaging point of view the available packing space can be increased by squeezing the air out of the food packages. Dense packing of food powders applying compaction pressure would be the next generation packing. By incorporating a WSRR-based sensor in a suitable way in the packing stage, the food powders can be packed to maximum density. This may be helpful in optimizing the filling of powdered packed products to the maximum quantity in cargo or shelf space. Another possible application may be pressing certain food powders into pelletized form in precise quantities that could be used for specific purposes like sugar pellets. The moisture content in the packed food can also be evaluated with the help of this sensing method and hence the optimum moisture level can be achieved which will enhance the shelf life. The present work can be further extended to develop a sensor probe that may help to find the correct density and moisture content of the food powder by simply placing the powder packet on the sensor probe. The same methodology can be followed for the determination of dryness in edible dried fruits and nuts.This ingenious and novel metamaterial WSRR sensor-based method is a promising step for optimizing the packing density with the standard moisture content for ensuring safe storage. The reliability, easiness and effectiveness of this proposed method make it quite suitable for direct applications in the food industry, especially in processing and packaging sections.
Conflicts of interest
There are no conflicts to declare.Acknowledgements
Aswathi P. V. gratefully acknowledges Kerala State Council for Science, Technology and Environment (KSCSTE), Kerala for the financial support under the KSCSTE research fellowship (KSCSTE/1980/2019-FSHP-PS).References
- B. McKevith, Nutr. Bull., 2004, 29, 111–142 CrossRef.
- B. K. Bala, Drying and Storage of Cereal Grains, John Wiley & Sons, 2016 Search PubMed.
- P. R. Shewry and N. G. Halford, J. Exp. Bot., 2002, 53, 947–958 CrossRef CAS PubMed.
- N. Bhargava, R. Jain, I. Joshi and K. Sharma, Int. J. Sci. Environ. Technol., 2013, 2, 369–374 Search PubMed.
- E. Kress-Rogers and M. Kent, J. Food Eng., 1987, 6, 345–376 CrossRef.
- S. Nelson and S. Trabelsi, Instrumentation and Measurement Technology Conference Record, 2003, pp. 518–523 Search PubMed.
- M. Venkatesh and G. Raghavan, Can. Biosyst. Eng., 2005, 47, 15–30 Search PubMed.
- H. S. Chua, G. Parkinson, A. D. Haigh and A. A. Gibson, J. Food Eng., 2007, 78, 1155–1158 CrossRef.
- W. Guo, G. Tiwari, J. Tang and S. Wang, Biosyst. Eng., 2008, 101, 217–224 CrossRef.
- N. I. Zheludev and Y. S. Kivshar, Nat. Mater., 2012, 11, 917–924 CrossRef CAS PubMed.
- J. B. Pendry, A. J. Holden, D. J. Robbins and W. Stewart, IEEE Trans. Microwave Theory Tech., 1999, 47, 2075–2084 CrossRef.
- Y. Liu and X. Zhang, Chem. Soc. Rev., 2011, 40, 2494–2507 RSC.
- T. Chen, S. Li and H. Sun, Sensors, 2012, 12, 2742–2765 CrossRef PubMed.
- D. R. Smith, W. J. Padilla, D. Vier, S. C. Nemat-Nasser and S. Schultz, Phys. Rev. Lett., 2000, 84, 4184 CrossRef CAS PubMed.
- D. R. Smith, J. B. Pendry and M. C. Wiltshire, Science, 2004, 305, 788–792 CrossRef CAS PubMed.
- K. Aydin, I. Bulu, K. Guven, M. Kafesaki, C. M. Soukoulis and E. Ozbay, New J. Phys., 2005, 7, 168 CrossRef.
- F. Hesmer, E. Tatartschuk, O. Zhuromskyy, A. A. Radkovskaya, M. Shamonin, T. Hao, C. J. Stevens, G. Faulkner, D. J. Edwards and E. Shamonina, Phys. Status Solidi B, 2007, 244, 1170–1175 CrossRef CAS.
- J. Naqui, M. Durán-Sindreu and F. Martín, Sensors, 2011, 11, 7545–7553 CrossRef PubMed.
- S. Hardinata, F. Deshours, G. Alquié, H. Kokabi and F. Koskas, 2018 18th International Symposium on Antenna Technology and Applied Electromagnetics (ANTEM), 2018, pp. 1–2 Search PubMed.
- P. V. Kapitanova, S. I. Maslovski, I. V. Shadrivov, P. M. Voroshilov, D. S. Filonov, P. A. Belov and Y. S. Kivshar, Appl. Phys. Lett., 2011, 99, 251914 CrossRef.
- S. Basaran, U. Olgun and K. Sertel, Electron. Lett., 2013, 49, 636–638 CrossRef.
- L. Su, J. Mata-Contreras, P. Vélez and F. Martín, Int. J. Antenn. Propag., 2017, 2017, 5619728 Search PubMed.
- S. P. Chakyar, S. K. Simon, C. Bindu, J. Andrews and V. Joseph, J. Appl. Phys., 2017, 121, 054101 CrossRef.
- S. P. Chakyar, J. Andrews and V. Joseph, International Journal of Mechanical and Mechatronics Engineering, 2016, 10, 1134–1137 Search PubMed.
- S. K. Simon, S. P. Chakyar, A. Sebastian, J. Jose, J. Andrews and V. Joseph, Sensing and Imaging, 2019, 20, 1–11 CrossRef.
- C. Bindu, S. K. Simon, A. Sebastian, P. V. Aswathi, D. Joseph, J. Andrews and V. P. Joseph, Prog. Electromagn. Res. M, 2021, 105, 141–150 CrossRef CAS.
- A. Sebastian, D. Davis, S. K. Simon, S. P. Chakyar, J. Jose, J. Kizhakooden, N. Paul, C. Bindu, V. Joseph and J. Andrews, AIP Conf. Proc., 2019, 020141 CrossRef CAS.
- A. Sebastian, S. P. Chakyar, C. Bindu, V. Joseph and J. Andrews, 2019 Thirteenth International Congress on Artificial Materials for Novel Wave Phenomena (Metamaterials), 2019, p. X-378 Search PubMed.
- D. J. Rowe, S. Al-Malki, A. A. Abduljabar, A. Porch, D. A. Barrow and C. J. Allender, IEEE Trans. Microwave Theory Tech., 2014, 62, 689–699 Search PubMed.
- W. Withayachumnankul, C. Fumeaux and D. Abbott, IEEE Sens. J., 2011, 12, 1455–1458 Search PubMed.
- S. RoyChoudhury, V. Rawat, A. H. Jalal, S. Kale and S. Bhansali, Biosens. Bioelectron., 2016, 86, 595–608 CrossRef CAS PubMed.
- K. Umadevi, S. P. Chakyar, S. K. Simon, J. Andrews and V. Joseph, Europhys. Lett., 2017, 118, 24002 CrossRef.
- G. Mrema, L. Gumbe, H. Chepete and J. Agullo, Rural Structures in the Rropics: Design and Development, 2011, vol. 3, pp. 363–411 Search PubMed.
- M. Venkatesh and G. Raghavan, Biosyst. Eng., 2004, 88, 1–18 CrossRef.
- R. Torrealba-Meléndez, M. E. Sosa-Morales, J. L. Olvera-Cervantes and A. Corona-Chávez, J. Food Sci. Technol., 2015, 52, 8403–8409 CrossRef PubMed.
- H. Nagi, J. Kaur, B. Dar and S. Sharma, et al. , Am. J. Food Technol., 2012, 7, 301–310 CrossRef.
- A. K. Datta, G. Sumnu and G. Raghavan, Engineering Properties of Foods, CRC Press, 2014, pp. 523–588 Search PubMed.
- S. O. Nelson, IEEE Trans. Instrum. Meas., 2001, 50, 1066–1070 Search PubMed.
- M. T. Khan and S. M. Ali, Int. J. Inf. Technol. Electr. Eng., 2012, 1, 1–5 Search PubMed.
- G. Barbosa-Canovas and H. Yan, Characterization of Cereals and Flours, CRC Press, 2003, pp. 173–208 Search PubMed.
- S. B. Jones, W. Sheng and D. Or, Sensors, 2022, 22, 2083 CrossRef CAS PubMed.
- C. Zhang, Z. Shi, H. Yang, X. Zhou, Z. Wu and D. S. Jayas, Sensors, 2019, 19, 4224 CrossRef CAS PubMed.
- M. Abdolrazzaghi and M. Daneshmand, 2016 IEEE MTT-S International Microwave Symposium (IMS), 2016, pp. 1–3 Search PubMed.
- M. Abdolrazzaghi, F. Hariri, M. Chu, H. Naguib and M. Daneshmand, 2019 IEEE SENSORS, 2019, pp. 1–4 Search PubMed.
- M. Abdolrazzaghi, N. Kazemi, V. Nayyeri and F. Martin, Sensors, 2023, 23, 6236 CrossRef PubMed.
| This journal is © The Royal Society of Chemistry 2024 |

