MFI zeolite with confined adjustable synergistic Cu sites for the hydrogenation of levulinic acid†
Wanying
Liang‡
a,
Guangyue
Xu‡
*ab,
Xiang
Zhang
a,
Huiyong
Chen
 c and
Yao
Fu
 *a
*a
aHefei National Research Center for Physical Sciences at the Microscale, iChEM, CAS Key Laboratory of Urban Pollutant Conversion, Anhui Province Key Laboratory of Biomass Clean Energy, University of Science and Technology of China, Hefei 230026, China. E-mail: fuyao@ustc.edu.cn; craneyue@mail.ustc.edu.cn
bInstitute of Energy, Hefei Comprehensive National Science Center, Hefei 230031, China
cSchool of Chemical Engineering, Northwest University, Xi'an, Shaanxi 710069, China
First published on 30th November 2023
Abstract
The inexpensive and versatile Cu catalyst is widely employed in industrial production processes, especially in hydrogenation reactions. However, there are still challenges focused on how various Cu species synergistically work, and the stability of the Cu catalysts. In this work, Cu-confined MFI zeolites were synthesized and employed in the selective hydrogenation of levulinic acid to γ-valerolactone, an important reaction of a biomass-derived platform molecule to high-value-added chemicals. Using a hydrothermal method with a rapidly mixing-at-high-temperature procedure and adjusting the Si/Cu ratio, various Cu active sites with different functions were designed on this catalyst. The catalyst had both secondary framework Cu in the 10MR ring and quasi sub-nano cluster Cu in the cage. The secondary framework Cu could adsorb the carbonyl groups while the quasi sub-nano cluster Cu and secondary framework Cu could activate hydrogen. The zeolite framework offered strong metal–support interactions and therefore improved the stability of the Cu catalysts.
Introduction
Copper is an inexpensive catalyst that is widely used in various industrial production processes, especially hydrogenation and oxidation reactions.1 On the basis of Hund's rule, Cu0 and Cu+ have fully occupied 3d orbitals, thus making Cu a versatile catalyst. Various chemical environments and exposed surfaces inevitably lead to different catalytic performances.2 Meanwhile, the higher hydration energy of Cu2+ makes it more likely to be oxidized and consequently leach into the solvent.3 Therefore, studies on Cu catalysts are confronting two challenges: (I) How do various Cu species synergistically catalyze the reactions? (II) How to improve the stability of Cu during hydrogenation–oxidation reactions?The utilization of cellulosic biomass meets the global interest in renewable and green chemistry against the rapidly increasing consumption of fossil resources and consequent environmental problems.4 Among these, levulinic acid (LA) is one of the most important biomass platform molecules that can be easily and economically produced from cellulosic feedstocks by conventional hydrolysis.5 LA can be further converted to various high-value-added chemicals, especially γ-valerolactone (GVL).6 GVL can be used as a liquid fuel, solvent, compound intermediate, plasticizer, and food additive.7
Although the hydrogenation of LA to GVL catalyzed by noble-metal catalysts, such as Pt,8 Au,9 Pd,10 Ir,11 and Ru12-based catalysts, has been extensively studied, more research efforts have been focused on non-noble metal catalysts, especially Cu-based catalysts, as listed in Table S1.†13 Hengne et al. catalyzed LA to GVL using Cu–ZrO2 (1![[thin space (1/6-em)]](https://www.rsc.org/images/entities/char_2009.gif) :
:![[thin space (1/6-em)]](https://www.rsc.org/images/entities/char_2009.gif) 1) and Cu–Al2O3 (1
1) and Cu–Al2O3 (1![[thin space (1/6-em)]](https://www.rsc.org/images/entities/char_2009.gif) :
:![[thin space (1/6-em)]](https://www.rsc.org/images/entities/char_2009.gif) 1) in 2012 and obtained 100% GVL at 200 °C and 3.4 MPa pressure.13a Our group also prepared a series of Cu/WO3–ZrO2, Cu/ZrO2, and Cu–TiO2/ZrO2 catalysts for the conversion of LA to GVL at 200 °C and 5 MPa pressure.13b For these reported Cu catalysts, they all used very high amounts of Cu loading (12%–75% Cu content in the catalyst). The high loading of Cu would not only lead to the low specific surface metal area and low catalytic atomic efficiency but also suffer from leaching and agglomerating of Cu.
1) in 2012 and obtained 100% GVL at 200 °C and 3.4 MPa pressure.13a Our group also prepared a series of Cu/WO3–ZrO2, Cu/ZrO2, and Cu–TiO2/ZrO2 catalysts for the conversion of LA to GVL at 200 °C and 5 MPa pressure.13b For these reported Cu catalysts, they all used very high amounts of Cu loading (12%–75% Cu content in the catalyst). The high loading of Cu would not only lead to the low specific surface metal area and low catalytic atomic efficiency but also suffer from leaching and agglomerating of Cu.
Zeolite is widely used as a catalyst or support in industrial processes. Cu-zeolite catalysts have high atomic efficiency and special catalytic performance. For example, Cu-CHA was widely used in selective catalytic denitration reactions (SCR DeNOx). Previous studies indicated that the single or double Cu sites located in the 8MR ring were the key catalytic centers. Our group recently developed a hydrothermal approach involving a rapid mixing-at-high-temperature method to synthesize a series of framework metal-confined zeolites.14 The MFI confined Cu zeolites (ZKD-5; ZKD is the short form for Zhongguo Kexuejishu Daxue, Chinese Pinyin for the University of Science and Technology of China; the number 5 indicated the fifth in the ZKD series of zeolites) have been employed in the selective hydrogenation of LA to GVL. On account of the above mentioned challenge of Cu catalysts, various Cu active sites with different functions were designed by adjusting the Si/Cu ratio in ZKD-5. The catalyst was characterized to find out that it has both secondary framework Cu in the 10MR ring and quasi sub-nano cluster Cu in the cage. Kinetic experiments combined with mathematical modeling analysis indicated that the secondary framework Cu could adsorb the carbonyl groups while the quasi sub-nano cluster Cu and secondary framework Cu could activate hydrogen. The zeolite framework offered strong metal–support interactions and therefore improved the stability of Cu catalysts.
Experimental
Synthesis of ZKD-5 catalysts
ZKD-5 was synthesized hydrothermally using a rapidly mixing-at-high-temperature procedure.In a typical procedure, TEOS (6 g) and TPAOH (3.59 g) were mixed with deionized water (5.00 g) in a 50 mL centrifuge tube while being slowly magnetically stirred (350 rpm) at 60 °C in an oil bath for 12 h. Then, Cu(NO3)2·3H2O solution (Si/Cu molar ratio were 11, 23, 47, 95, and 191) and NaF solution (Cu/Na = 2) were rapidly added to the hot-aged silica gel and well mixed by drastic mechanical vibration for seconds. The mixture was heated in a 50 mL Teflon-lined autoclave (HTG-50-SS2, Anhui CHEMN Instruments Co. Ltd) at 170 °C for 24 h. The zeolite was collected after filtration, washed with water, and dried at 105 °C. The obtained zeolite was calcined at 550 °C in air for 2 h with a heating ramp of 3 °C min−1. All the above-mentioned catalysts were reduced at 400 °C for 2 h with a heating ramp of 3 °C min−1 under an H2 flow of 100 mL min−1 before use.
Synthesis of Cu-based supported-catalysts
The supported catalysts were prepared by the wet impregnation method. The supports (2 g) and the corresponding amount of Cu(NO3)2·3H2O (Si/Cu = 47/1) were mixed with acetone (200 g) while being magnetically stirred at 45 °C for 24 h. After the elimination of the water by rotary evaporation and drying at 80 °C, the solid sample was calcined at 550 °C in air for 2 h at a heating ramp of 3 °C min−1. According to the different supports selected, the samples were named Cu/S-1, Cu/SiO2, and Cu/HZSM-5, respectively.All the mentioned above catalysts were reduced at 400 °C for 2 h with a heating ramp of 3 °C min−1 under an H2 flow of 100 mL min−1 before use.
Catalyst test methods
The hydrogenation of LA was performed in a 25 mL NSC-type reactor purchased from Anhui CHEMN Instruments Co. Ltd. Specific steps: 1 mmol LA and 100 mg catalyst were dispersed in 8 g distilled H2O solution. Before the reaction, the reactor was purged three times with hydrogen and then charged with hydrogen to the corresponding pressure. The reaction was heated by a thermocouple and stirred magnetically at a speed of 800 rpm. After the reaction was completed, the reactor was placed into cold water and cooled to room temperature followed by releasing the gas. In the study, the influence of different reaction conditions (concentration, reaction temperature, hydrogen pressure, and time) on the catalytic activity was investigated.The product was analyzed using the Shimadzu Nexis 2030 gas chromatography (GC) instrument equipped with an RTX-65 column (30 m × 0.32 mm × 0.25 μm) and a flame ionization detector. The GC gas flow rates were set as follows: 40 mL min−1 N2, 32 mL min−1 H2, and 200 mL min−1 air. The temperatures of the injection port and flame ionization detector were 250 °C and 270 °C, respectively. The initial temperature of the chromatographic column was 50 °C and increased to 190 °C at a rate of 10 °C min−1. Next, it was increased to 250 °C and maintained for 3 min at a rate of 20 °C min−1. The amount of the reactants and products was determined by the internal standard method, where the internal standard was n-hexanol. Levulinic acid conversion and product yields were calculated using the following equations.
Results and discussion
Characterizations of catalysts
Based on the hydrothermal method involving rapid mixing at a high temperature, a series of framework metal-confined zeolites were synthesized, as shown in Fig. 1(A). According to the differences in the Si/Cu ratio, these catalysts were named ZKD-5(x), where x is the Si/Cu atomic ratio. The Si/Cu ratio of 11, 23, 47, 95, and 191 represented average 8, 4, 2, 1, and 0.5 Cu atoms in a single MFI lattice with 96 T-atoms, respectively. Supported Cu/S-1 (Si/Cu = 47) was also synthesized for comparison. Nanosized crystals of ZKD-5 zeolite were obtained. They were approximately 150 nm in size as judged from the TEM images (Fig. 1(B)). On the ZKD-5 catalyst, Cu species were uniformly dispersed and no obvious aggregation was observed, while Cu/S-1 had obvious aggregation (Fig. S1†). XRD patterns also confirmed that there was no bulk metallic Cu on ZKD-5. XRD patterns indicated a typical MFI-type zeolite structure with a little shift of the diffraction peaks. As the content of Cu increased, the peaks shifted to lower 2 theta values, revealing an expansion of the lattice by the doping of Cu (Fig. 1(C)). No diffraction peaks assigned to the bulk metallic Cu phase at 43.3° and 50.4° or CuO phase at 35.5°, 35.6°, 38.7°, 39.0° and 48.8° were observed in all the catalysts.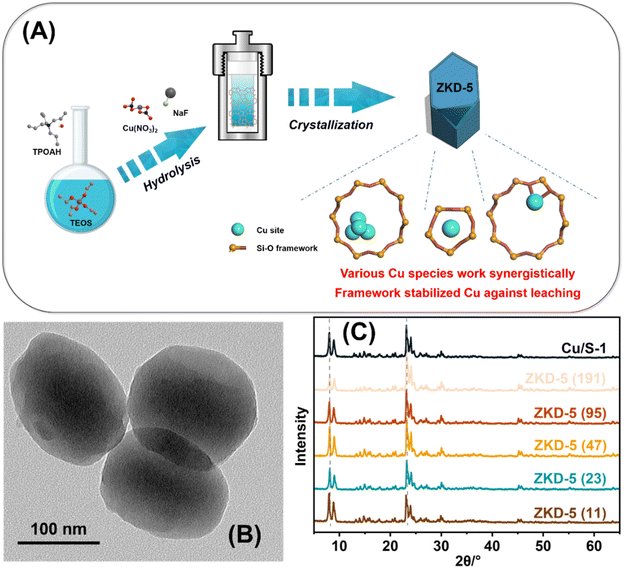 | ||
| Fig. 1 Catalyst characterization: (A) the design and synthesis of ZKD-5; (B) TEM image of ZKD-5 (47); (C) XRD patterns. | ||
In addition, with the increase of the Cu content, the grain size of the ZKD-5 zeolite increased, as shown in Fig. S1.† It indicated that the addition of Cu significantly affected the crystallization process of zeolite. It could be observed that the BET surface area (SBET) and pore size of zeolite decreased with the increase of Cu content (Fig. S2, S3, and Table S2†). It was because Cu formed free clusters in the channel when the Cu content increased to a certain extent. Furthermore, ZKD-5 (47) and catalysts with less Cu content showed similar SBET and pore sizes, indicating that they were not affected by the free species in the channels, such as Cu clusters.
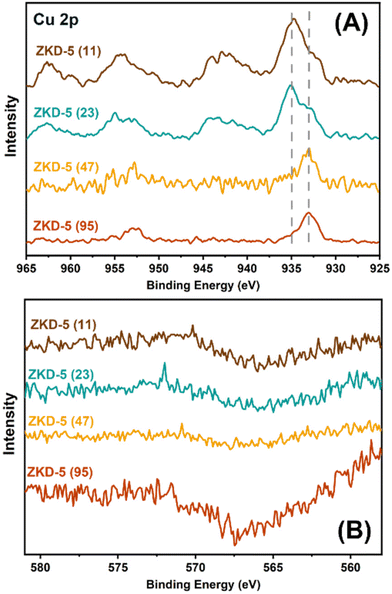
The chemical states of the surface Cu species in the reduced samples were investigated by in situ X-ray photoelectron spectroscopy (XPS) and the characterization results are displayed in Fig. 2(A). The Cu 2p3/2 signal centred at binding energies of about 933 eV and 935 eV corresponded to the reduced Cu species and Cu2+, respectively. In addition, the shake-up satellite peaks at about 940–947 eV and 959–966 eV further demonstrating the existence of Cu2+ species. However, the peaks were shifted compared to those from the previous reports. Based on our previous studies and literature, the Cu species inside the zeolite cage might be affected by the Si–O framework and thus lead to electron deficiency while the Cu located on the framework or secondary framework would act as a lower valence state. Therefore, the peaks centred at binding energies of about 933 eV and 935 eV are attributed to the in-cage Cu and secondary framework Cu, respectively.
The LMM Auger signals were feeble, as shown in Fig. 2(B). It indicated that when radiated by X-ray, most of the L-electrons in Cu would release their extra energy as photons (X-ray fluorescence), instead of occupying a lower-energy state (Auger). In most other supported Cu-based materials, the X-ray fluorescence was very weak. Therefore, in ZKD-5 zeolites, the interactions between the Si framework and the neighboring Cu would change the state of L-electrons in the 3d orbital of Cu and therefore weaken the Auger effect.
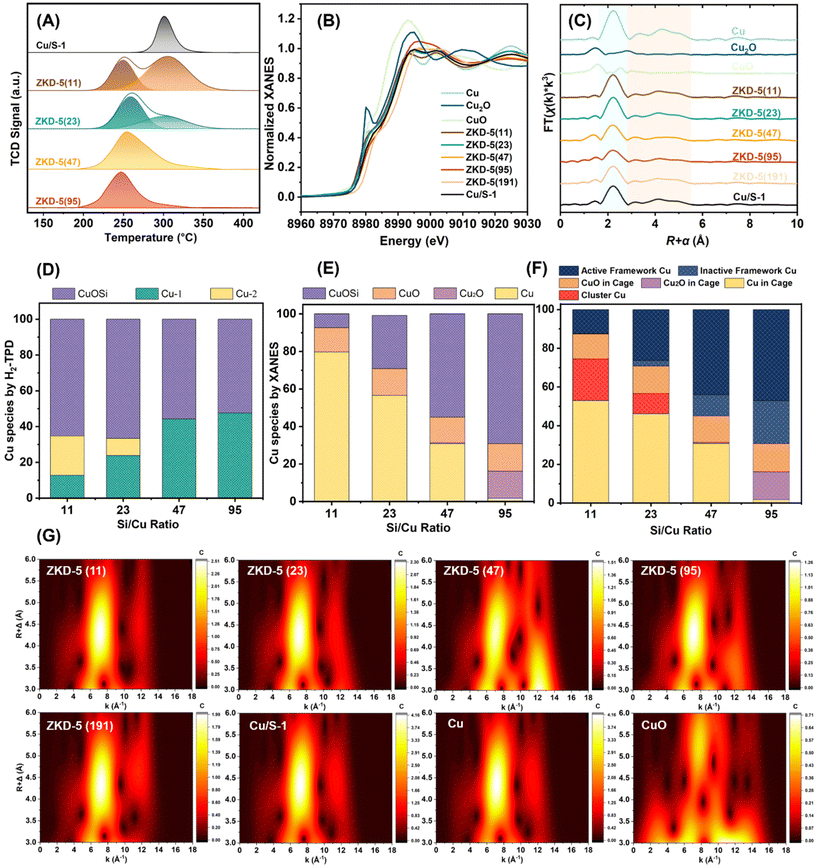
ZKD-5 catalysts were characterized by a tandem temperature-programmed desorption–oxidation–reduction (H2-TPD-N2O-titration-H2-TPR), as shown in Fig. 3(A). In the first step, H2-TPD profiles could distinguish Cu into three species. The first desorption peak centered at about 250 °C was labelled as Cu-1 in Fig. 3(D). At this temperature, H2 on the supported Cu surface will not be desorbed. It could be a very active Cu species. In zeolites with high Cu content (Si/Cu = 11 and 23), there was also a significant secondary desorption peak centered at about 310 °C, labelled as Cu-2 in Fig. 3(D). This peak had a similar desorption temperature compared with supported Cu/S-1 catalyst. Therefore, this peak was contributed by free supported Cu. Other Cu species that could not adsorb H2 were identified as framework or secondary framework Cu. The H2-TPR followed by N2O-titration is shown in Fig. S4.† Very little amount of Cu could be oxidized by N2O. It indicated that most amount of Cu, no matter Cu-1 or Cu-2, was located somewhere that N2O could not react, most probably in the cage of zeolites (mor, cas, or mfi composite building unit cages).
In situ XANES was performed under synthesis conditions (Fig. 3(B)). The peaks of ZKD-5 zeolites showed neither Cu nor CuO characteristic signals. ZKD-5 (191) with extremely low Cu content was hypothesized to solely contain framework or secondary framework Cu and it was used as a standard sample, CuOSi. Then, the XANES was analyzed by compositional linear analysis with four standards, Cu, Cu2O, CuO, and CuOSi, and the data is shown in Fig. 3(E). It is worth mentioning that it could only distinguish the species by the valence state and coordinated environment.
The k3-weighted R-space of Cu K-edge in situ EXAFS spectra (Fig. 3(C)) showed a similar Cu–Cu path compared with Cu standard sample. It indicated that in the synthesis conditions, most of the Cu revealed like simple substance Cu. However, the Cu–O path revealed differently with CuO standard samples. The second shell (orange areas) and the third/fourth shell (yellow areas) also showed some differences with the Cu standard sample.
The respective magnifications EXAFS wavelet transform 2D plots (Fig. 3(G)) located between 3.0 and 6.0 Å showed similar characterization signals with the Cu standard sample. Especially zeolites with high Cu content (Si/Cu = 11 and 23) revealed more apparent characterization such as those for the standard Cu sample. For zeolites with low Cu content (Si/Cu = 47 and 95), some special signals were observed at high k-value areas, which were mostly contributed by the coordination atoms in the second or third shell. It was another evidence for the existence of some Cu–O–Cu/Si framework or secondary framework structures.
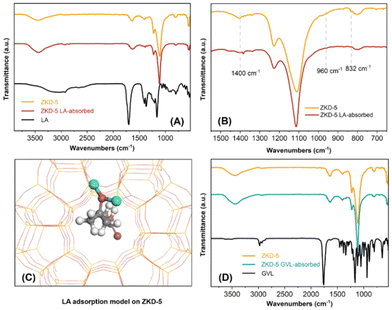
The structure of ZKD-5 was also studied by FT-IR, as shown in Fig. S5.† The spectra showed a broad adsorption band from 3750 to 2800 cm−1, which could be attributed to the overlapping of the stretching mode of hydrogen-bonded from adsorbed water and out-surface Si–OH groups. Similarly, the band at 1631 cm−1 was assigned to the O–H bending vibrations of the molecularly adsorbed water. The characteristic bands at 1227 and 1110 cm−1 are associated with the internal asymmetric and symmetric stretching vibrations of Si–O–Si and Si–O–Cu, respectively. Meanwhile, the band at 800 cm−1 corresponded to the external symmetric stretching mode of Si–O–Si. Compared to the bands of Si–O–Si and Si–O–Cu of S-1 zeolite (1225, 1100, and 795 cm−1), the bands at 1227, 1110, and 800 cm−1 have shifted to the higher wavenumbers, which are identified as the blue shift, implying that Cu was probably not in the framework of zeolite but in the cage. The bands at 1400 and 832 cm−1 as well as the shoulder bands between 1013 and 970 cm−1 are ascribed to the perturbation of the Si–O–Si framework vibration by Cu. Moreover, the bands at 960 cm−1 indicated the existence of nonbonded oxygen, which was Si–O−. Therefore, unlike ZKD-1 with the tetrahedron framework Fe, the framework Cu in ZKD-5 was located at secondary framework structures and cages.
Based on the above results, we can determine that some Cu existed as secondary framework Cu in the 10 MR ring, and other Cu existed as quasi sub-nano cluster Cu in the cage or channel. For the secondary framework Cu, some were unsaturated and coordinated and were active in catalytic reactions, while some were saturated and inactive. They were labelled as active secondary framework Cu and inactive secondary framework Cu in Fig. 3(F). For the quasi sub-nano cluster Cu, some were free in the zeolite channel and were named the cluster Cu, while some were confined in the cage of zeolite and were named Cu/Cu2O/CuO in the cage. By controlling the content of Cu, the species of Cu generated on ZKD-5 series catalysts could be controlled to coordinate the location of the Cu active site. For instance, when the Si/Cu ratio of ZKD-5 was controlled at 47 or higher, quasi sub-nano cluster Cu, which was free in the zeolite channel would no longer be formed. At the same time, the content of the secondary framework Cu would increase significantly. According to the above discussions, ZKD-5 with a variety of specific Cu sites could be designed by adjusting the Si/Cu ratio to meet the functional requirements of the catalyst.
Catalytic reactions and structure–activity relationship
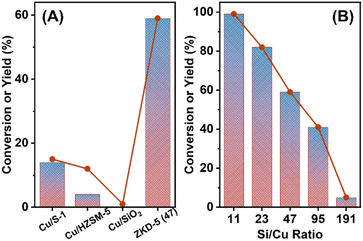
A series of ZKD-5 catalysts with different Si/Cu ratios were tested for the hydrogenation of LA in water at 130 °C, 4 MPa H2, as shown in Fig. 4 and Table 1. Supported Cu/S-1 (Si/Cu = 47), Cu/HZSM-5 (Si/Cu = 47, Si/Al = 40.5), and Cu/SiO2 (Si/Cu = 47) were also synthesized for comparison. In previous literature, single metallic Cu-based catalysts always required high reaction temperatures for LA hydrogenation. Cu/S-1 and Cu/HZSM-5 could catalyze the hydrogenation of LA at 130 °C but the conversion was not high (entries 1 and 2, Table 1), while Cu/SiO2 was almost inactive (entry 3, Table 1). Compared with these supported catalysts, our ZKD-5 catalysts revealed good performance. For ZKD-5 (11) with 8.55 wt% of Cu content, LA could be equivalently converted to GVL in 5 h (entry 4, Table 1). Other ZKD-5 catalysts with Si/Cu ratio = 23, 47, and 95 also revealed better than supported catalysts (entries 5–7, Table 1) and could reach full conversion and equivalent yield in longer reaction times (Table S3†). However, ZKD-5 (191) with the lowest Cu content could only reach 5% conversion of LA. It indicated that Cu existed in various forms with different activities in ZKD-5. This catalyst also worked well in higher concentrated feedstock. Even when pure LA was used as feedstock, as shown in Table S5† up to 95% isolated yield of GVL was obtained.| Entry | Catalyst | Cu content (wt%) by ICP | Conversion (%) | Yield (%) |
|---|---|---|---|---|
| Reaction conditions: 1 mmol LA, 100 mg catalyst, 8 mL H2O, 130 °C, 4 MPa H2, 5 h. | ||||
| 1 | Cu/S-1 | 2.15 | 15 | 14 |
| 2 | Cu/HZSM-5 | 2.19 | 12 | 4 |
| 3 | Cu/SiO2 | 2.14 | 1 | Trace |
| 4 | ZKD-5 (11) | 8.55 | 99 | 99 |
| 5 | ZKD-5 (23) | 4.32 | 82 | 82 |
| 6 | ZKD-5 (47) | 2.17 | 59 | 59 |
| 7 | ZKD-5 (95) | 1.09 | 41 | 41 |
| 8 | ZKD-5 (191) | 0.46 | 5 | 5 |
The LA adsorption and GVL desorption properties of the catalyst were also studied to further elucidate the adsorption activity of ZKD-5. The complete FT-IR spectra of ZKD-5 before and after LA treatment are shown in Fig. 5(A). As shown in Fig. 5(B), the treatment of LA led to the disappearance of some bands of ZKD-5 catalyst, including the bands at 1400 and 832 cm−1 and the bands centered at about 960 cm−1, all of which were associated with the perturbation of Cu to Si–O–Si. It could be speculated that these changes in the FT-IR spectra originated from the LA adsorption on the Cu species in the Cu–O–Si secondary framework. The adsorption of LA resulted in the weakening of the perturbation from Cu and manifested in the changes in FT-IR spectra. The adsorption model is shown in Fig. 5(C). LA was chemically adsorbed by a secondary framework Cu. In contrast, there was no significant change in the spectra of the ZKD-5 catalyst after treatment with GVL (Fig. 5(D)), indicating the interaction between ZKD-5 and GVL was very weak. In other words, the ZKD-5 catalyst has excellent GVL desorption properties.
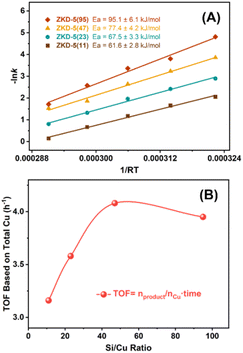
In order to verify our inferences about the Cu active sites in ZKD-5, the first-ordered mechanism of LA was studied by the reaction kinetics. The apparent activation energy increased with the decrease in Cu content (Fig. 6(A)). Especially when the Si/Cu ratio increased from 47 to 95, that is, Cu content decreased from 2% to 1%, the increase of the apparent activation energy was considerable. It indicated that the species of Cu varied at a special content. Moreover, the TOF based on total Cu revealed a volcano-like trend with the Si/Cu ratio and reached the highest when the Si/Cu ratio was 47 (Fig. 6(B)). It indicated that when Cu species in ZKD-5 were concentrated at the secondary framework Cu sites and/or in the zeolite cage, the performance of the catalyst was better when Cu content was as high as possible.
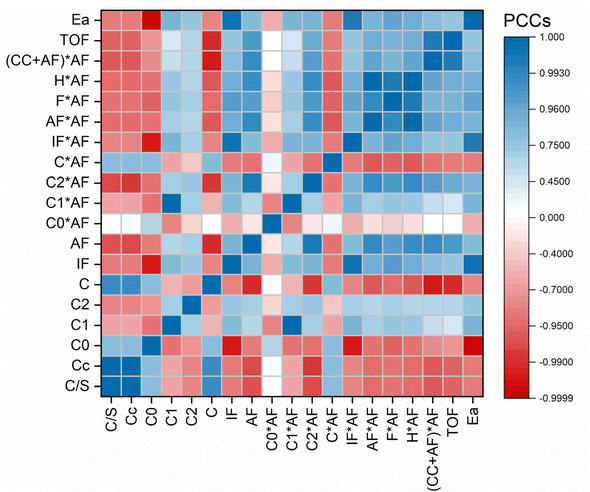
To further study how various Cu sites affected the catalytic activity, some structural and reactional data were chosen as variables for the Pearson product-moment correlation coefficient analysis, as shown in Fig. 7. The R factor was calculated using the following equation:
Darker blue and red indicate stronger positive and negative linear dependence, respectively, while light colors indicate weak dependence.
The Cu feeding content in the synthesis and actual Cu content were highly correlated, indicating that all Cu was almost crystallized with zeolite silica during this hydrothermal method during the rapidly mixing-at-high-temperature synthesis procedure. The total Cu content was positively correlated with the content of the Cu cluster, while negatively correlated with the content of the active secondary framework Cu. It indicated that the formation of the active secondary framework Cu had an upper limit and excessive high Cu content could only form free Cu nanoclusters. The content of Cu0/Cu2O/CuO in the cage had little relation with the total Cu content, indicating that the formation of Cu species in the cage was only affected by the intrinsic topological structure of the MFI zeolite.
The catalytic performance was evaluated using TOF and Ea. The dependency between TOF and various kinds of Cu species showed that the secondary framework Cu content had a positive correlation with TOF, especially the active secondary framework Cu. It indicated that the active secondary framework Cu could be the key factor that catalyzed the reaction. The content of the Cu cluster had a negative correlation with TOF. It was because the Cu cluster (similar to supported Cu nanoclusters) was not electronically improved by the Si–O zeolite framework and had very little contribution to the reaction, and the Cu cluster in channel or the opening of pores might block the micropores and hinder the mass transfer process. The Ea was negatively correlated with the Cu content, indicating that this reaction was controlled by the amount of active sites.
However, the linear correlation between TOF and the active secondary framework Cu was acceptable but not that precise. It was because other Cu species might also affect the reaction. Considering the reaction process, LA and H2 were both feedstocks. The reaction rate could be described as follows:
| r = k × c(LA)n × c(H2)m |
In this reaction, n and m were both approximately 1, that is, first-order for both LA and H2. The concentration of LA and H2 was mostly affected by the adsorption. In this high-temperature reaction with violent stirring, the mass transfer resistance was not considered during the study of the adsorption process. Therefore, the content of the adsorption sites was the key factor for adsorption. It was more reasonable to consider a double-parameter adsorption in this bi-molecular reaction.
The dependency between TOF and various kinds of Cu species with a double-parameter model was further studied. The double-parameter model was the product of the content of the active secondary framework Cu multiplied by the content of various Cu species. It clearly revealed the strongest positive linear correlation between TOF and Cu content, and the R factor was 0.997.
Based on the above discussions, we conclude that two groups of Cu species affected the reaction. One was the active secondary framework Cu, the other was the active secondary framework Cu and Cu/Cu2O/CuO in the cage. The active secondary framework Cu could adsorb and activate both LA and H2, while all the Cu/Cu2O/CuO species in the zeolite cage as well as the active secondary framework Cu could activate H2. Through the above analysis, the ZKD-5(47) catalyst was screened by adjusting the Si/Cu ratio. On ZKD-5(47), the Cu species were all concentrated in a framework or cage, which became the active Cu sites with adsorption activity. Moreover, ZKD-5(47) had as much Cu content as possible without forming Cu clusters, and its framework stabilized Cu against leaching or aggregation. No significant deactivation was observed during the five-run recycle test, as shown in Fig. 8, S6, and S7.† The Cu leaching was as low as 0.005% (Table S4†).
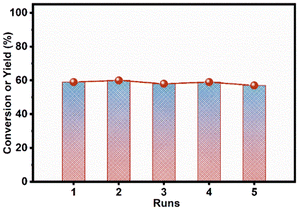 | ||
| Fig. 8 Catalyst cycle stability of ZKD-5(47) for levulinic acid to γ-valerolactone. Reaction conditions: 1 mmol LA, 100 mg catalyst, 8 mL H2O, 130 °C, 4 MPa H2, 5 h. | ||
Conclusions
In this work, Cu-confined MFI zeolites (ZKD-5) with a variety of specific Cu sites were designed by adjusting the Si/Cu ratio to meet the functional requirements of the catalyst. ZKD-5 was employed in the selective hydrogenation of levulinic acid to γ-valerolactone and reached full conversion and equivalent yield at 130 °C and the TOF was 4.08 h−1 over ZKD-5 (47). The catalyst had both secondary framework Cu in the 10MR ring and quasi sub-nano cluster Cu in the cage. The secondary framework Cu could adsorb the carbonyl groups while the quasi sub-nano cluster Cu and secondary framework Cu could activate hydrogen. ZKD-5 (47) without any free Cu clusters had the best catalytic performance. The zeolite framework offered strong metal–support interactions and therefore improved the stability of the Cu catalysts. This work provided a procedure for the synthesis of zeolite-confined Cu catalyst and clarified how various Cu species synergistically catalyze hydrogenation reactions efficiently.Conflicts of interest
The authors declare no conflict of interest.Acknowledgements
This work was supported by the National Key R&D Program of China (2018YFB1501604), the Institute of Energy, Hefei Comprehensive National Science Center under Grant No. 21KZS219, the National Natural Science Foundation of China (22293011, 51821006, 21905266), and the Fundamental Research Funds for the Central Universities (20720220007, WK3530000013).References
- (a) H. Zhou, Z. X. Chen, A. V. Lopez, E. D. Lopez, E. Lam, A. Tsoukalou, E. Willinger, D. A. Kuznetsov, D. Mance, A. Kierzkowska, F. Donat, P. M. Abdala, A. Comas-Vives, C. Copéret, A. Fedorov and C. R. Müller, Nat. Catal., 2021, 4, 860–871 CrossRef; (b) L. H. Wang, J. Jiang, J. Ma, S. Y. Pang and T. Zhang, Chem. Eng. J., 2022, 427, 16 Search PubMed.
- (a) Q. Hua, T. Cao, X. K. Gu, J. Q. Lu, Z. Q. Jiang, X. R. Pan, L. F. Luo, W. X. Li and W. X. Huang, Angew. Chem., Int. Ed., 2014, 53, 4856–4861 CrossRef PubMed; (b) Z. H. Zhang, H. Wu, Z. Y. Yu, R. Song, K. Qian, X. Y. Chen, J. Tian, W. H. Zhang and W. X. Huang, Angew. Chem., Int. Ed., 2019, 58, 4276–4280 CrossRef PubMed; (c) W. Xiong, X. K. Gu, Z. H. Zhang, P. Chai, Y. J. Zang, Z. Y. Yu, D. Li, H. Zhang, Z. Liu and W. X. Huang, Nat. Commun., 2021, 12, 5921 CrossRef PubMed; (d) J. H. Guo, G. Y. Xu, Z. Han, Y. Zhang, Y. Fu and Q. X. Guo, ACS Sustainable Chem. Eng., 2014, 2, 2259–2266 CrossRef CAS.
- (a) F. Arena, R. Giovenco, T. Torre, A. Venuto and A. Parmaliana, Appl. Catal., B, 2003, 45, 51–62 CrossRef CAS; (b) L. Zhang, J. B. Mao, S. M. Li, J. M. Yin, X. D. Sun, X. W. Guo, C. S. Song and J. X. Zhou, Appl. Catal., B, 2018, 232, 1–10 CrossRef CAS.
- (a) J. N. Chheda, G. W. Huber and J. A. Dumesic, Angew. Chem., Int. Ed., 2007, 46, 7164–7183 CrossRef CAS; (b) A. Corma, S. Iborra and A. Velty, Chem. Rev., 2007, 107, 2411–2502 CrossRef CAS PubMed; (c) P. Gallezot, Chem. Soc. Rev., 2012, 41, 1538–1558 RSC; (d) G. W. Huber, S. Iborra and A. Corma, Chem. Rev., 2006, 106, 4044–4098 CrossRef CAS PubMed; (e) W. Y. Liang, G. Y. Xu and Y. Fu, Appl. Catal., B, 2024, 340, 123220 CrossRef CAS; (f) S. Y. Wang, A. H. Cheng, F. H. Liu, J. J. Zhang, T. Xia, Z. Xiang, W. Fan and Y. Zhang, Ind. Chem. Mater., 2023, 1, 188–206 RSC.
- (a) E. M. W. Smeets, A. P. C. Faaij, I. M. Lewandowski and W. C. Turkenburg, Prog. Energy Combust. Sci., 2007, 33, 56–106 CrossRef CAS; (b) T. Werpy and G. Petersen, Top Value Added Chemicals from Biomass: Volume I – Results of Screening for Potential Candidates from Sugars and Synthesis Gas, United States, 2004. p. Medium: ED; Size: 76 pp. pages Search PubMed; (c) J. J. Bozell and G. R. Petersen, Green Chem., 2010, 12, 539–554 RSC.
- Z. H. Yu, X. B. Lu, J. Xiong and N. Ji, ChemSusChem, 2019, 12, 3915–3930 CrossRef.
- (a) I. T. Horvath, H. Mehdi, V. Fabos, L. Boda and L. T. Mika, Green Chem., 2008, 10, 238–242 RSC; (b) D. M. Alonso, S. G. Wettstein and J. A. Dumesic, Green Chem., 2013, 15, 584–595 RSC; (c) X. Tang, X. H. Zeng, Z. Li, L. Hu, Y. Sun, S. J. Liu, T. Z. Lei and L. Lin, Renewable Sustainable Energy Rev., 2014, 40, 608–620 CrossRef; (d) L. Ye, Y. W. Han, J. Feng and X. B. Lu, Ind. Crops Prod., 2020, 144, 17 CrossRef.
- (a) M. Sudhakar, V. V. Kumar, G. Naresh, M. L. Kantam, S. K. Bhargava and A. Venugopal, Appl. Catal., B, 2016, 180, 113–120 CrossRef; (b) Y. W. Lu, Y. X. Wang, Q. H. Tang, Q. E. Cao and W. H. Fang, Appl. Catal., B, 2022, 300, 13 CrossRef.
- (a) A. M. Ruppert, M. Jedrzejczyk, N. Potrzebowska, K. Kazmierczak, M. Brzezinska, O. Sneka-Platek, P. Sautet, N. Keller, C. Michel and J. Gramsa, Catal. Sci. Technol., 2018, 8, 4318–4331 RSC; (b) W. R. H. Wright and R. Palkovits, ChemSusChem, 2012, 5, 1657–1667 CrossRef.
- (a) C. Ortiz-Cervantes, M. Flores-Alamo and J. J. Garcia, ACS Catal., 2015, 5, 1424–1431 CrossRef; (b) K. Yan, T. Lafleur and J. Y. Liao, J. Nanopart. Res., 2013, 15, 7 CrossRef; (c) J. Feng, M. Li, Y. H. Zhong, Y. L. Xu, X. J. Meng, Z. W. Zhao and C. G. Feng, Microporous Mesoporous Mater., 2020, 294, 109858 CrossRef CAS.
- (a) W. Li, J. H. Xie, H. Lin and Q. L. Zhou, Green Chem., 2012, 14, 2388–2390 RSC; (b) L. Y. Shen, Q. S. Zheng, Y. Q. Liu, J. J. Wu, Z. Y. Lu and T. Tu, Green Chem., 2021, 23, 5037–5042 RSC.
- (a) G. Y. Xu, C. Li, T. Y. Deng, C. G. Wang, Y. Zhang and Y. Fu, Ind. Eng. Chem. Res., 2020, 59, 17279–17286 CrossRef CAS; (b) Y. Yang, G. Gao, X. Zhang and F. W. Li, ACS Catal., 2014, 4, 1419–1425 CrossRef CAS; (c) S. Shao, Y. Yang, K. J. Sun, S. T. Yang, A. Li, F. Yang, X. R. Luo, S. J. Hao and Y. C. Ke, ACS Catal., 2021, 11, 12146–12158 CrossRef CAS; (d) K. L. Zhang, Q. L. Meng, H. H. Wu, T. Y. Yuan, S. T. Han, J. X. Zhai, B. X. Zheng, C. Y. Xu, W. Wu, M. Y. He and B. X. Han, Green Chem., 2021, 23, 1621–1627 RSC; (e) A. Seretis, P. Diamantopoulou, I. Thanou, P. Tzevelekidis, C. Fakas, P. Lilas and G. Papadogianakis, Front. Chem., 2020, 8, 221 CrossRef CAS.
- (a) A. M. Hengne and C. V. Rode, Green Chem., 2012, 14, 1064–1072 RSC; (b) Q. Xu, X. L. Li, T. Pan, C. G. Yu, J. Deng, Q. X. Guo and Y. Fu, Green Chem., 2016, 18, 1287–1294 RSC; (c) Y. J. Tsou, T. D. To, Y. C. Chiang, J. F. Lee, R. Kumar, P. W. Chung and Y. C. Lin, ACS Appl. Mater. Interfaces, 2020, 12, 54851–54861 CrossRef CAS PubMed; (d) H. Zhong, Q. J. Li, J. K. Liu, G. D. Yao, J. Wang, X. Zeng, Z. B. Huo and F. M. Jin, ACS Sustainable Chem. Eng., 2017, 5, 6517–6523 CrossRef CAS; (e) I. Obregon, I. Gandarias, M. G. Al-Shaal, C. Mevissen, P. L. Arias and R. Palkovits, ChemSusChem, 2016, 9, 2488–2495 CrossRef CAS PubMed; (f) S. Ishikawa, D. R. Jones, S. Iqbal, C. Reece, D. J. Morgan, D. J. Willock, P. J. Miedziak, J. K. Bartley, J. K. Edwards, T. Murayama, W. Ueda and G. J. Hutchings, Green Chem., 2017, 19, 225–236 RSC; (g) Y. W. Shao, K. Sun, Q. Y. Li, Q. H. Liu, S. Zhan, Q. Liu, G. Z. Hu and X. Hu, Green Chem., 2019, 21, 4499–4511 RSC; (h) K. Yan and A. C. Chen, Fuel, 2014, 115, 101–108 CrossRef; (i) Z. Li, M. Zuo, Y. T. Jiang, X. Tang, X. H. Zeng, Y. Sun, T. Z. Lei and L. Lin, Fuel, 2016, 175, 232–239 CrossRef; (j) J. Zhang, J. Z. Chen, Y. Y. Guo and L. M. Chen, ACS Sustainable Chem. Eng., 2015, 3, 1708–1714 CrossRef; (k) S. S. R. Gupta and M. L. Kantam, Catal. Today, 2018, 309, 189–194 CrossRef.
- G. Y. Xu, X. Zhang, Z. Y. Dong, W. Y. Liang, T. C. Xiao, H. Y. Chen, Y. H. Ma, Y. Pan and Y. Fu, Angew. Chem., Int. Ed., 2023, 62, e202305915 CrossRef PubMed.
Footnotes |
| † Electronic supplementary information (ESI) available. See DOI: https://doi.org/10.1039/d3gc03356b |
| ‡ These authors contributed equally to this work. |
| This journal is © The Royal Society of Chemistry 2024 |


